Article

Modeling of Mass Balance Variability and Its Impact on Water Discharge from the Urumqi Glacier No. 1 Catchment, Tian Shan, China

1
Geography Department, Humboldt-Universität zu Berlin, Unter den Linden 6, 10099 Berlin, Germany
2
Tianshan Glaciological Station/State Key Laboratory of Cryospheric Sciences, Northwest Institute of Eco-Environment and Resources, Chinese Academy of Sciences, Lanzhou 730000, China
*
Author to whom correspondence should be addressed.
Water 2020, 12(12), 3297; https://doi.org/10.3390/w12123297
Submission received: 7 October 2020 / Revised: 7 November 2020 / Accepted: 11 November 2020 / Published: 24 November 2020

Abstract

:
Originating in the Tian Shan mountains, Urumqi River plays a key role in terms of water supply to downstream areas. In its headwaters, Urumqi Glacier No. 1 (UG1) is the largest glacier contributing to water discharge. Assessing its response to the changing climatic conditions in the area is of major importance to quantify future water availability. We here apply COSIPY, a COupled Snowpack and Ice surface energy and mass balance model in PYthon, to UG1, implementing a new albedo parameterization which integrates site-specific bare-ice albedo values on a pixel-by-pixel basis observed by remote sensing. We assess model performance threefold: quantitatively based on long-term measurement data of (1) surface mass balance (SMB) and (2) water discharge as well as qualitatively (3) comparing simulated snow line altitudes to such imated on the basis of time-lapse photography. Comparison of the modeled SMB with annually-averaged data from ablation stakes reveals that COSIPY including the new albedo parameterization accounts for 57.6% of the variance observed in the measurements. The original albedo parameterization performs only slightly inferior (57.1%). Glacier-wide comparison between modeled and glaciological SMB shows high agreement. In terms of discharge prediction, COSIPY reproduces onset and duration of the discharge season well. Estimated discharge from the whole catchment shows shortcomings in exactly matching the measured times series, but interannual variability is captured.

1. Introduction

Glaciers are an important part of the global and local water budgets. They are highly sensitive especially to air temperature and precipitation, both of which increasingly underlie long-term changes due to climate change. Especially with regard to local water supply, assessing glacier development becomes increasingly important [1,2,3,4]. Glacier-runoff responses to climate change are manifold depending on general setting and climate both concerning the expected long-term overall annual changes and their seasonal patterns (e.g., [5,6,7,8]).
Surrounded by the Taklimakan Desert, the Gurbantunggut Desert and the Gobi Desert, Urumqi River constitutes an important water resource, particularly to Urumqi, the capital of the province [9]. Urumqi River is mainly fed by rainfall [1]. Nevertheless, in its upper reaches, glaciers substantially contribute to the water cycle. Urumqi Glacier No. 1 (UG1) specifically is the largest glacier in the headwaters of Urumqi River. It lies in the eastern Tian Shan mountains in the Xinjyang Uygur autonomous region of China at 43 06 N, 86 48 E (Figure 1). UG1 is a northeast-facing valley glacier that ranges in altitude from 3740 m a.s.l. to 4486 m a.s.l. The region has a continental climate which is dominated by the Siberian High and the westerlies and their cyclonic disturbances. Precipitation falls mainly in summer [10] and glaciers classify as summer-accumulation type because both accumulation and ablation occur during summer [11].
According to Li et al. [12], runoff in the drainage basin of UG1 increased by a factor of 1.5 between 1959 and 2006. A significant amount of the increment occurred after the 1980s and coincided with an observed increase of both temperature and precipitation in the region. By modeling the glacial runoff, the authors [12] revealed that glacier meltwater doubled in the same 48-year period, whereas runoff from non-glacierized areas in the same region showed a considerably smaller increase. Thus, the UG1 discharge regime is highly sensitive to the climatic conditions and their changes, both through direct precipitation input and the melting of ice and snow [13].
UG1 is the best-monitored glacier in China [11,14,15] and has been observed to be undergoing mass wastage ever since surface mass balance (SMB) measurements began in 1959. Recession rates have increased since the 1980s [16]. In 1993, this led the glacier to split up into two branches, the east and the west branch [17,18,19]. In their study, Ye et al. [13] calculated that, in 2003, UG1 had lost 20% of its former volume in the preceding four decades. While this translates to a mean annual MB of approximately 245 mm a−1, more than two and a half times higher rates were observed during the period from 1997–2010 by Yuan et al. [20]. Both studies identify the increase in temperature as the main driver of this development. The contemporaneous increase in precipitation, which is also observed [12], is not strong enough to balance rising temperatures [21]. These findings are in line with other studies stressing the long-term climatic trend of the region towards higher mean annual temperatures and their influence on UG1 [12,13,14,17,22,23]. The temperature increase has accelerated since the end of the last century [11] and is stronger for winter than for summer [17]. However, the strongest correlation is found between mean annual MB of UG1 and mean air temperatures in summer [11,14,21]. Whereas this mismatch still moderates the (negative) MB development in favor of UG1, the impact of overall higher temperatures and a prolonged ablation season is considerable.
The ongoing recession of UG1 has increased meltwater discharge in recent decades. Once it has shrunk to a certain degree, however, meltwater will decrease with decreasing volume. According to Gao et al. [3] this tipping point will soon be reached. Peak water of glacier melt from UG1 is projected to occur around 2020. In their study, Gao et al. [3] calculated glacier MB change applying a temperature-index method in combination with a Δ h -parameterization, which distributes the derived glacier MB solely based on elevation-dependent temperature changes. A glacier’s development and its response to changing climatic conditions, however, are highly complex [24,25,26]. Temperature and precipitation alone do not exhibit enough explanatory power to account for the broad range in response signals (e.g., [24,27,28,29,30]). Instead, a glacier’s development is dominated by every single component of the energy and mass balance budget and their interactions [31,32]. The COupled Snowpack and Ice surface energy and mass balance model in PYthon (COSIPY) [33] parameterizes these key mechanisms in order to capture a glaciers evolution more thoroughly and assess the hydrological responses more accurately. In this study, we apply an updated version of COSIPY that integrates a new albedo parameterization.
The surface albedo is a dominant parameter with regard to glacier MB and development [34,35,36,37,38]. Shortcomings in its parameterization represent one of the major limiting factors in the accuracy of energy and mass balance models [39,40]. The surface albedo mainly depends on the presence or absence of snow as the top layer as well as its thickness and aging [27,41]. Once the snow has melted away, the bare-ice albedo is commonly assumed constant but can in fact vary spatially and temporally [41,42,43]. This variability arises mainly from changes of the physical properties like density, liquid water content, stratification, crystal structure, and surface roughness [42] but also from the emergence of englacial debris due to melt or from increasing exposure of supraglacial debris [44] and from impurities [42,43,45]. At UG1, light-absorbing impurities have repeatedly been identified to play a major role [18,46,47]. In their study, Yue et al. [47] derived ice albedos of UG1 in a range from 0.06 to 0.44 during the two years of observation. A study by Naegeli and Huss [48] suggests high correlations between bare-ice albedo and mean annual MB. Naegeli et al. [49] found the integration of a pixel-based albedo map into MB simulations to alter the glacier-wide ablation by 10%. Large local variations in MB were revealed. We therefore deduce that a more site-specific local definition of the bare-ice albedo could improve the accuracy of MB simulations. Whereas the influence of the formation and depletion of snow is already included in COSIPY, like most models, COSIPY uses a temporally and spatially constant bare-ice parameter so far [33]. We complement this parameterization with the pixel-wise integration of bare-ice albedo values derived from satellite data. Although still constant temporally, this accounts for the spatial variability of albedo.
In applying COSIPY to UG1, which has been thoroughly monitored for decades [11,14,15], we provide an excellent benchmark to assess model results. This study therefore presents an in-depth evaluation of model performance. The simulation of SMB is evaluated on the basis of a long-term time series of a network of ablation stakes. Then, simulated snow line altitudes (SLA) are compared to those inferred from time-lapse photography. In conclusion, COSIPY performance is further evaluated by means of its prediction of the total glacier runoff. Specifically, in this study, the following three overarching research questions are discussed:
  • How does COSIPY perform in modeling the observed SMB variability of Urumqi Glacier No. 1?
  • Can the implementation of locally more specific bare-ice albedos improve performance?
  • Can modeled MB variations explain discharge variability downstream, and how strong is the influence of Urumqi Glacier No. 1 on the variance of runoff from the catchment?
For each of these aspects, the results are contextualized concerning embedded uncertainties and limitations.

2. Materials and Methods

The data sets applied in this study are summarized in Table 1 and described in more detail in the subsections of this chapter.

2.1. COSIPY

COSIPY [33] combines a surface energy balance (SEB) model with a multi-layer subsurface snow and ice model. It is based on the predecessor model COSIMA (COupled Snowpack and Ice surface energy and MAss balance model) by Huintjes et al. [50]. It is a medium complexity model with various parameterizations for physical processes at the surface and within the snow and ice layers. These parameterizations require constants which are based on the literature as provided in detail in Sauter et al. [33], and which decisively influence the model results. COSIPY has a modular structure which makes replacing singular parameterizations straightforward. It is open-source and can be accessed via GitHub [51] (https://github.com/cryotools/cosipy). The driving variables needed to run COSIPY include air temperature T 2 , relative humidity R H 2 and wind speed U 2 , all at 2 m , surface pressure P R E S , solar radiation G, total precipitation R R R and cloud cover fraction N (Table 2). COSIPY is a one-dimensional model that resolves vertical processes at a specific point on the glacier. Spatially distributed simulations are multiples of these point models integrated independently over the glacier domain. Hence, lateral mass and energy fluxes are not considered. COSIPY is run on a digital elevation model (DEM) from the Shuttle Radar Topography Mission (SRTM) generated in February 2000 with 90 m spatial resolution. Any elevation change of the terrain over the study period was not considered since its impact on the energy balance modeling would be negligibly compared to other sources of uncertainty. Forcing data available for one point on the glacier (an automatic weather station, AWS, in this study) are interpolated spatially in a preprocessing module integrated in the model. Differences between the distributed point models arise solely from differences in altitude, slope, and aspect of the underlying DEM grid cells. We apply a glacier outline from September 2007, which is the most recent available in the Randolph Glacier Inventory 6.0 (RGI 6.0, [52]). The outline defining the static area for all model runs was chosen for approximately the middle of the study period as the best compromise regarding the slightly changing glacier area over time.
COSIPY computes the mass balance (MB) at an hourly resolution from the sum of accumulation by solid precipitation, deposition and refreezing of percolating meltwater within the snow pack and ablation by surface and subsurface melt and sublimation. The model is based on the concept of energy and mass conservation. Energy fluxes at the snow/ice–atmosphere interface determine the energy balance equation (e.g., [53]):
F = S W i n ( 1 α ) + L W i n + L W o u t + Q s + Q l + Q G
where F is the energy flux, S W i n is the shortwave incoming radiation, α is the albedo, L W i n and L W o u t are the incoming and outgoing longwave radiation, Q s and Q l are the turbulent sensible and latent heat fluxes and Q G is the ground heat flux. Heat flux from liquid precipitation is not considered. Fluxes towards (away from) the surface are positive (negative). All these exchange processes control or are controlled by the surface temperature T s . As such, T s is what couples subsurface and surface processes. Equation (1) is solved iteratively from the energy available at the surface. Physical constraints require that T s T 0 , with T 0 being the freezing point of water (0 C ). At every time step, T s calculated from Equation (1) is therefore compared to T 0 . In case T s > T 0 , following energy conservation, the resulting energy surplus of F is counted as melt energy Q m , and T s is reset to T 0 .
The net mass change MB at each point of the glacier is then calculated following:
M B = Δ Θ i ρ i + S F Q m L f + Q l L s + Q l L v .
With Θ i being the volumetric fraction of ice and ρ i being the density of ice, the first term on the right describes the internal mass changes through melt and refreezing. S F is the mass gain through snowfall. L f is the latent heat of fusion, so that the third term therefore stands for the mass loss by melt. With Q l being the latent heat flux L s the latent heat of sublimation and L v the latent heat of vaporization, the fourth term describes the sublimation or deposition and the last term the evaporation or condensation mass fluxes. For each of the two terms, the flux depends on the direction of the mixing ratio gradient and on T s . When T s < T 0 , turbulent latent energy leads to sublimation (water vapor pressure at the surface e s > water vapor pressure at measurement height e a i r ) or deposition ( e s < e a i r ), and to evaporation ( e s > e a i r ) or condensation ( e s < e a i r ) when T s equals T 0 .
Surface melt stems from energy surplus at the surface calculated from Equation (1). The resulting surface and the subsurface meltwater percolates within the snowpack—if present—and either refreezes or runs off once it reaches the glacier surface. Percolation is calculated employing the approach of Coléou and Lesaffre [54]. It follows a bucket approach, where, if the liquid water content Θ w exceeds the retention capacity, excess water is drained into the underlying layer. Refreezing can take place when Θ w > 0 and T s u b < T 0 , with T s u b being the subsurface temperature in the respective snow layer. Whereas refreezing leads to mass gain, meltwater that reaches the glacier surface and runs off contributes to mass loss. A dynamic mesh is applied to discretize the snow- and ice layers within COSIPY. This non-equidistant layering is updated at each time step and results in thinnest layers at the surface, and increasing layer thickness with depth. The technical details on the dynamical mesh are presented in Sauter et al. [33].
Liquid and solid precipitation are treated differently in COSIPY. Whereas liquid precipitation runs through the percolation module, snowfall directly contributes to accumulation (Equation (2)). Snowfall is calculated from R R R in applying a temperature-dependent logistic transfer function. The transition between solid and liquid precipitation is smoothly described in a range from 0 C to +2 C, corresponding to 100% and 0% proportion of solid precipitation [55]. The density of fresh snow ρ s n o w necessary for the conversion to snow depth depends upon air temperature and wind velocity and is performed following the approach of [56]. More details on all parameterizations including those without specific significance in the context of this study can be found in Sauter et al. [33].
Huintjes [57] ascertained that the subsurface module adapts to the prevailing conditions after a maximum of one year of spin-up time. In this study, we start modeling in January 2000. The first SMB measurements at ablation stakes used in this study stem from September 2000. The period between January and September 2000 is assumed to suffice for model spin-up, especially because it spans over a whole ablation season.

2.2. Albedo Parameterization

Albedo plays a significant role in the energy balance (1) and therefore has a major impact on the glacier MB. Within COSIPY, α is parameterized following the approach of Oerlemans and Knap [59]. It evolves dynamically within a range between α i c e α α f r s n o w ) depending on age and thickness of the snow cover, and on the albedo of the underlying layer. The upper boundary α f r s n o w is the albedo of fresh snow if the new snow layer is sufficiently thick to become the sole albedo influencing factor. If the latter is not the case, the impact of the underlying ice on α increases with decreasing snow pack thickness. The albedo of bare ice α i c e is the lower boundary of the albedo range. Whereas it is originally assumed constant in COSIPY, the new parameterization includes the albedo of bare ice on a pixel-by-pixel basis because reproducing this pattern offers great potential to better capture spatial MB variations. In this application, the albedo parameterization remains unchanged for snow and is optimized only for bare ice. Only once there is no snow cover present does the new parameterization take effect. Instead of setting the albedo to a glacier-wide constant bare-ice albedo, the bare-ice albedo specific for the respective pixel is applied. Through this step, we take into account additional spatial heterogeneity in the ablation area. The corresponding albedo values are derived from Landsat 7 and Landsat 8 images courtesy of the U.S. Geological Survey (USGS). In this study, Landsat Surface Reflectance High Level Data Products [60,61] distributed by the USGS [62] (https://earthexplorer.usgs.gov/) are applied.
We manually checked all scenes available from both satellites during the study period for suitability. Only five end-of-summer scenes meet the criteria which require UG1 to be completely cloud-free as well as mostly snow-free in the ablation zone. The chosen scenes include three Landsat 7 (2 September 2012, 5 September 2013, 27 July 2016) and two Landsat 8 (4 August 2016, 20 August 2019) images. We initially aimed at taking scenes from different points in time in order to account for the interannual trend of decreasing ice albedo as stated in studies by e.g., Fugazza et al. [63] and Naegeli et al. [43] from other study regions. The aforementioned constraints however only allowed for these five scenes, which all lie within the last third of the study period. As they all are from dates towards the end of the ablation season, intraannual trends are also not taken into account.
Optical satellite data only cover a small range of wavelengths. For the energy balance, however, the albedo of the whole solar spectrum is required. In this study, we apply the narrow-to-broadband conversion method by Liang [64], which was originally based on Landsat 5/7 data and their band designations and band widths, but is adapted to Landsat 8 as suggested by Naegeli et al. [65]. The formula for the Landsat 7 and Landsat 8 α are:
α L 7 = 0.356 b 1 + 0.13 b 3 + 0.373 b 4 + 0.085 b 5 + 0.072 b 7 0.0018
α L 8 = 0.356 b 2 + 0.13 b 4 + 0.373 b 5 + 0.085 b 6 + 0.072 b 7 0.0018
where b n represents the respective spectral band number. This approach was chosen based on the study by Naegeli et al. [65], who compared it to the method by Knap et al. [66], which is more commonly used for glaciological purposes [63,67,68]. In their study, Naegeli et al. [65] found high agreement between the two methods, but the approach by Liang [64] showed smaller deviations from the benchmark than the method of Knap et al. [66] and is therefore preferred here.
As the underlying topography has a substantial influence on the satellite signal [66], correcting the derived albedo fields for this effect is of key importance [27]. For this, we utilize the radiation model by Wohlfahrt et al. [30]. It is also used for preprocessing within COSIPY, where for every pixel it calculates S W i n from the solar radiation G. This calculation is based on the underlying DEM and corrects for inclination and aspect of the slope taking also the zenith and azimuth angles (radians) of the sun into account. Indirect terrain shading from neighboring slopes is not included in the procedure following Wohlfahrt et al. [30] which may introduce some additional error during times with low sun angle. Self-shadowing by the slope itself, e.g., the case that the slope angle of the respective pixel is larger than the sun angle, is included in this procedure. Since the position of the sun differs between the Landsat scenes, we derive pixel-wise correction factors for each scene individually. Correction factors are the ratio between the incident radiation corrected only for the position of the sun and the incident radiation corrected for both, the position of the sun and the topography. For that, at each date and time of image acquisition, the radiation model is run twice: (1) On the underlying SRTM DEM and (2) On a supposedly flat terrain with slope and aspect set to zero and height set to 4025 m a.s.l for all pixels. Albedo calculation via Equations (3) and (4) is run at the original Landsat resolution (30 m ). Then, the derived albedo maps are aggregated to the 90 m grid of the SRTM DEM we are running COSIPY on. In a next step, topography correction is carried out for each albedo map or Landsat scene individually. Subsequently, the final albedo map is obtained by averaging the five individual albedo maps.
Before topography correction, the scene-wise average albedo in the bare-ice area spans from 0.10 to 0.17. Averaged between all scenes, it lies at 0.13 . As the glacier is relatively steep and facing north, topography correction generally increases albedo. For bare ice, the average increases by 0.02 to 0.15 and then ranges from 0.12 to 0.19 between scenes. The albedo is hence exceptionally low even after correction. Integrating the so derived values into COSIPY simulation not only leads to exceptionally strong glacier disintegration, but also worsens model performance when compared to simulations with glacier-wide constant bare-ice albedos taken from the literature (e.g., [31,47]). The fact that the Landsat-derived albedos are so low can stem from a wide range of reasons, which are further mentioned in the discussion section.
In spite of the worsening of model performance when applying absolute values, we make use of the relative differences, i.e., the spatial pattern in bare-ice areas, deduced from the Landsat observations. As a value around 0.3 is commonly derived and used for the approximation of the albedo of glacier ice (e.g., [31,59,69]), we take this as target value. In order to increase the mean glacier-wide bare-ice albedo to this target value, we multiply the Landsat albedo map of the bare-ice areas by a factor of 2.1 (Figure 2). The bare-ice albedo is therefore assumed to have insignificant influence on modeling results in the uppermost parts of the glacier where the albedo parameterization of Oerlemans and Knap [59] is dominated by α f r s n o w and the albedo of firn α f i r n (cf. [33,59]). In adjusting the overall bare-ice average albedo to 0.3 , absolute values as derived only from satellite data are altered, but the spatial pattern is preserved.

2.3. Atmospheric Forcing of COSIPY

The seven atmospheric variables required to force COSIPY are derived from ERA5 reanalysis data [58]. ERA5 is the latest climate reanalysis produced by European Centre for Medium-Range Weather Forecasts (ECMWF). It provides gridded hourly estimates of a large number of atmospheric, land and oceanic climate variables at global coverage and a spatial resolution of approximately 31 km. ERA5 encompasses the period from 1979 to present and continues to be extended forward in time [58]. It is distributed free of charge through the Climate Data Store by the Copernicus Climate Change Service [70] (https://cds.climate.copernicus.eu/cdsapp#!/home).
While some variables can be taken directly from ERA5, others have to be preprocessed first (see Table 3). The former include N, G and R R R , which are taken as is in this study. The latter concern the variables T 2 , R H 2 , U 2 and P R E S . Preprocessing consists of two main steps: First, the variables are downscaled from ERA5 to a fixed point on the glacier. Second, the time series are spatially integrated from this fixed point to the glacier area to create the input for the distributed runs. The first step is done via statistical downscaling to the location of the AWS situated at 4025 m a.s.l. on the east branch of UG1 close to the main flowline (cf. Figure 1). At the AWS, there are measurements of T 2 , R H 2 , U 2 , and P R E S available in 10- or 30-min intervals. Aggregated to hourly values, AWS data span from April 2018 to January ( T 2 and R H 2 ) or May ( U 2 and P R E S ) 2019. The measurements are employed for bias correction of raw ERA5 data because the ERA5 grid cell comprising the study area (42.875 N, 86.625 E to 43.125 N 86.875 E) lies at an a model altitude 641 m lower than the AWS. The second preprocessing step, the spatial interpolation, is done applying a preprocessing module within COSIPY to account for the elevation differences for different locations on the glacier based on the DEM.
Downscaling is assessed in terms of the root mean square error (RMSE) and the mean bias error (MBE). For a summary, please refer to Table 4. Figure 3 shows the comparison between measured and raw and downscaled ERA5 values.
Concerning T 2 , there is a nonlinear bias between raw ERA5 and AWS time series. While the offset between the two time series is remarkably constant during the first six and the last three months respectively, it is almost inverted between them. To address this nonlinearity, we apply a quantile-dependent transfer function that adjusts the simulated to the observed distribution. The quantile mapping approach reduces the hourly RMSE by almost 50% to 2.73 K , the hourly MBE drops from 1.14 K to 0.004 K . On a daily basis, the RMSE decreases to 1.88 K . The explained variance R2 between measurements and ERA5 is 0.9 before as well as after downscaling. For spatial interpolation over the glacier area, we apply a constant lapse rate Γ T of 0.007 K m −1 which we derive from ERA5. For its calculation, the nine ERA5 grid cells adjacent to the study area are taken into account. As they all lie at different geopotential heights, the mean lapse rate can be calculated taking all simulated 2 m air temperatures and their corresponding altitudes over the whole study period into account.
As already mentioned above, R R R is not corrected for any bias in this study. This is because no reliable R R R measurements were available from the AWS. R R R is therefore taken from ERA5 as is and then distributed evenly over the whole glacier area because in the absence of reliable data for bias analysis we also refrain from applying a lapse rate. Spatial differences in solid precipitation only arise from the share of R R R falling as solid dependent on the altitudinal dependency of T 2 .
ERA5 G and N are directly used without any downscaling procedure. N is assumed constant over the whole glacier domain and therefore not spatially interpolated. On the other hand, G is spatially distributed via the radiation model by Wohlfahrt et al. [30].
R H 2 is not provided by ERA5 as output parameter but calculated from T 2 and the dewpoint temperature as suggested by Hersbach et al. [58]. Comparison of the calculated R H 2 with the measurements at the AWS shows good agreement during the first months of observation. From September on, however, the two time series increasingly differ. Analogous to T 2 , quantile mapping is applied to address this nonlinearity, but is only able to drop the RMSE from 24.87% to 24.04% with an R2 of 0.26 . The MBE improves from −11.81 to −0.05%. This suggests that R H 2 calculated and downscaled from ERA5 performs well at meeting the hourly mean over the whole observation period but does not at predicting hourly sharp values. RMSE of daily averages are improved from 19.22% to 15.42% with an R2 of 0.42 . Daily means are therefore shown to be met more accurately than hourly means, on both time scales; however, R H 2 is identified to be relatively difficult to predict.
The wind speed is given in ERA5 in 10 m height divided into two different parameters or directional wind components, U 10 and V 10 . The resulting wind speed has to be calculated from the two components and is then downscaled via the logarithmic wind profile [71] assuming a roughness length of 2.12 mm as the mean between the average roughness of firn (4 mm) and fresh snow ( 0.24 mm) [72]. U 2 is highly variable as it not only depends on topography but also on numerous large- and small-scale dynamics. It is therefore among the most difficult meteorological parameters to model accurately, especially in complex terrain [73,74,75]. U 2 from reanalyses show substantial bias relative to observations and although ERA5 performs better than other reanalyses in capturing diurnal [76] and seasonal variations, natural variability proves difficult to predict [77]. The RMSE between 2 m raw ERA5 and measured data lies at 2.06 m s −2, the MBE at 1.58 m s −2. Observed U 2 are on average more than two times higher than modeled U 2 , but the difference is smaller during summer than during winter. As statistical downscaling of highly dynamic predictors is problematic, but dynamical downscaling is beyond the scope of this study, raw ERA5 U 2 as calculated from the logarithmic wind profile are scaled with a constant factor for bias correction. For this, a scaling factor of 2 is chosen because meeting the average U 2 magnitude of the summer regime is more important than that of the winter regime with respect to mass balance changes of UG1. This decreases the RMSE by 20% and the MBE by more than 50%, but the R2 is only 0.07 . On a daily basis, RMSE and MBE remain similarly high and R2 low. U 2 is assumed spatially constant over the glacier area and is therefore broadcast equally from the AWS to the whole domain at every time step.
P R E S is supplied in ERA5 at the surface level but is approximately equal to the pressure at 2 m . It is downscaled from ERA5 to the AWS applying the barometric formula [71]. Comparison of the thus downscaled modeled and observed P R E S shows good agreement. ERA5 performs well at predicting both the average value at the corresponding pressure level and the temporal variability of the variable. The offset between raw ERA5 and observed P R E S is relatively constant and is captured by the applied barometric formula. The RMSE drops from 51.89 h Pa to 2.11 h Pa , the MBE from −51.86 h Pa to 1.87 h Pa . For daily averages, improvements are almost the same. The R2 is 0.97 and 0.99 respectively. Spatial interpolation of P R E S to the whole glacier domain is carried out applying the barometric formula.

2.4. Observation Data for Model Validation

COSIPY simulations are validated two-fold based on two different sets of measurement data. Modeled SMB is compared to ablation data available from an extensive network of ablation stakes distributed over both of UG1’s branches. Modeled glacier runoff is compared to the water discharge measured at a gauging station located at 3693 m a.s.l. [12] approximately 420 m downstream of the eastern and approximately 900 m downstream of the western terminus (cf. Figure 1). Measured water levels are converted into runoff using rating curves as outlined in Li et al. [12] and Jia et al. [78]. The observational data set on water discharge used in this study runs from 2011 until 2018 and shows daily measurements during summer months (May–September). According to Li et al. [12], 95% of runoff occurs between May and September, while the stream is frozen in rest of the year.
Available ablation measurements began in August 2000 and ran for up to 16 years. They are available in m w . e . For this study, only long-term continuous data series were of interest. A total of 24 ablation stakes fulfills these conditions until September 2014, ten of them until September 2016 (Figure 1).
Concerning the uncertainty in ablation measurements, in order to obtain specific SMB at the individual stakes, the surface height change is measured and then converted to m w . e . via the density of the ice or snow [79]. Surface roughness, debris cover, and general human-induced reading inaccuracies cause errors in the former, while the latter introduces uncertainty due to the spatial and temporal variability and the lack of quantitatively sufficient measurements of the density of ice or snow. Stake reading inaccuracies are estimated to be minimum ± 10 mm per reading. According to the law of error propagation, this results in 14 mm of random error for each mass balance measurement as the result of the difference from two readings. Subsequently, again following the law of error propagation and assuming approximately five mass balance measurements per year, this results in annual uncertainty of 26 mm. If there is snow present when the stakes are measured, the relation between surface height change and mass change becomes more variable and their conversion more error-prone. In this case, density is not assumed constant anymore but measured for the different snow layers and then applied for its conversion from m to m w . e . We assume an uncertainty in snow density measurements of at least ±50 k g / m 3 which adds to the general uncertainty of ablation measurements via ablation stakes depending on the presence and thickness of the snow cover.
Uncertainty concerning the measurement data on water discharge stem from two main sources: First, measurement inaccuracies can be considerable and are estimated here to be ±10%. The range of uncertainty is a best guess. We assume this to be a reasonable uncertainty range. Taking a much higher or lower uncertainty estimate, however, would alter neither the results nor the discussion of the study. Second, due to its location downstream of UG1, the gauging station does not measure the discharge from the glacier alone, but from the whole basin down to this outlet. In order to make COSIPY discharge and the measured discharge comparable, we approximate the corresponding catchment, then integrate R R R over the non-glacierized part of the catchment and add this to the runoff which COSIPY models for the glacierized part (UG1). This calculation implicitly assumes that, in the non-glacierized part of the basin, there is no time lag between R R R falling and its discharge. Effectively, the approach translates to a configuration which neglects any storage in the form of snow or permafrost, and any time lag caused by water routing through the catchment. Basin size is hence the only controlling factor in the calculation of the discharge from off-glacier. The delineation of the catchment is based on the 30 m SRTM DEM deriving flow direction and flow accumulation rasters from it first. In defining the outlet and delineating the watersheds, we then outline the basin. It is approx. 3.56 km2 in size, while UG1 itself is approx. 1.58 km2 in size. The basin delineation embeds uncertainty from the underlying DEM as well as the different processing steps themselves. We estimate this uncertainty to the length of the underlying SRTM DEM grid cell. This corresponds to approx. ± 0.25 km2, which tallies with approx. ±7% of the total basin area.
Furthermore, we qualitatively compare time-lapse images of a fixed camera system facing the east branch of UG1 (cf. Figure 1 for camera position) with the simulated SLA. For this study, we investigated pictures with a temporal resolution of one to two images per day between July and December 2018 (cf. Table 1).

3. Results

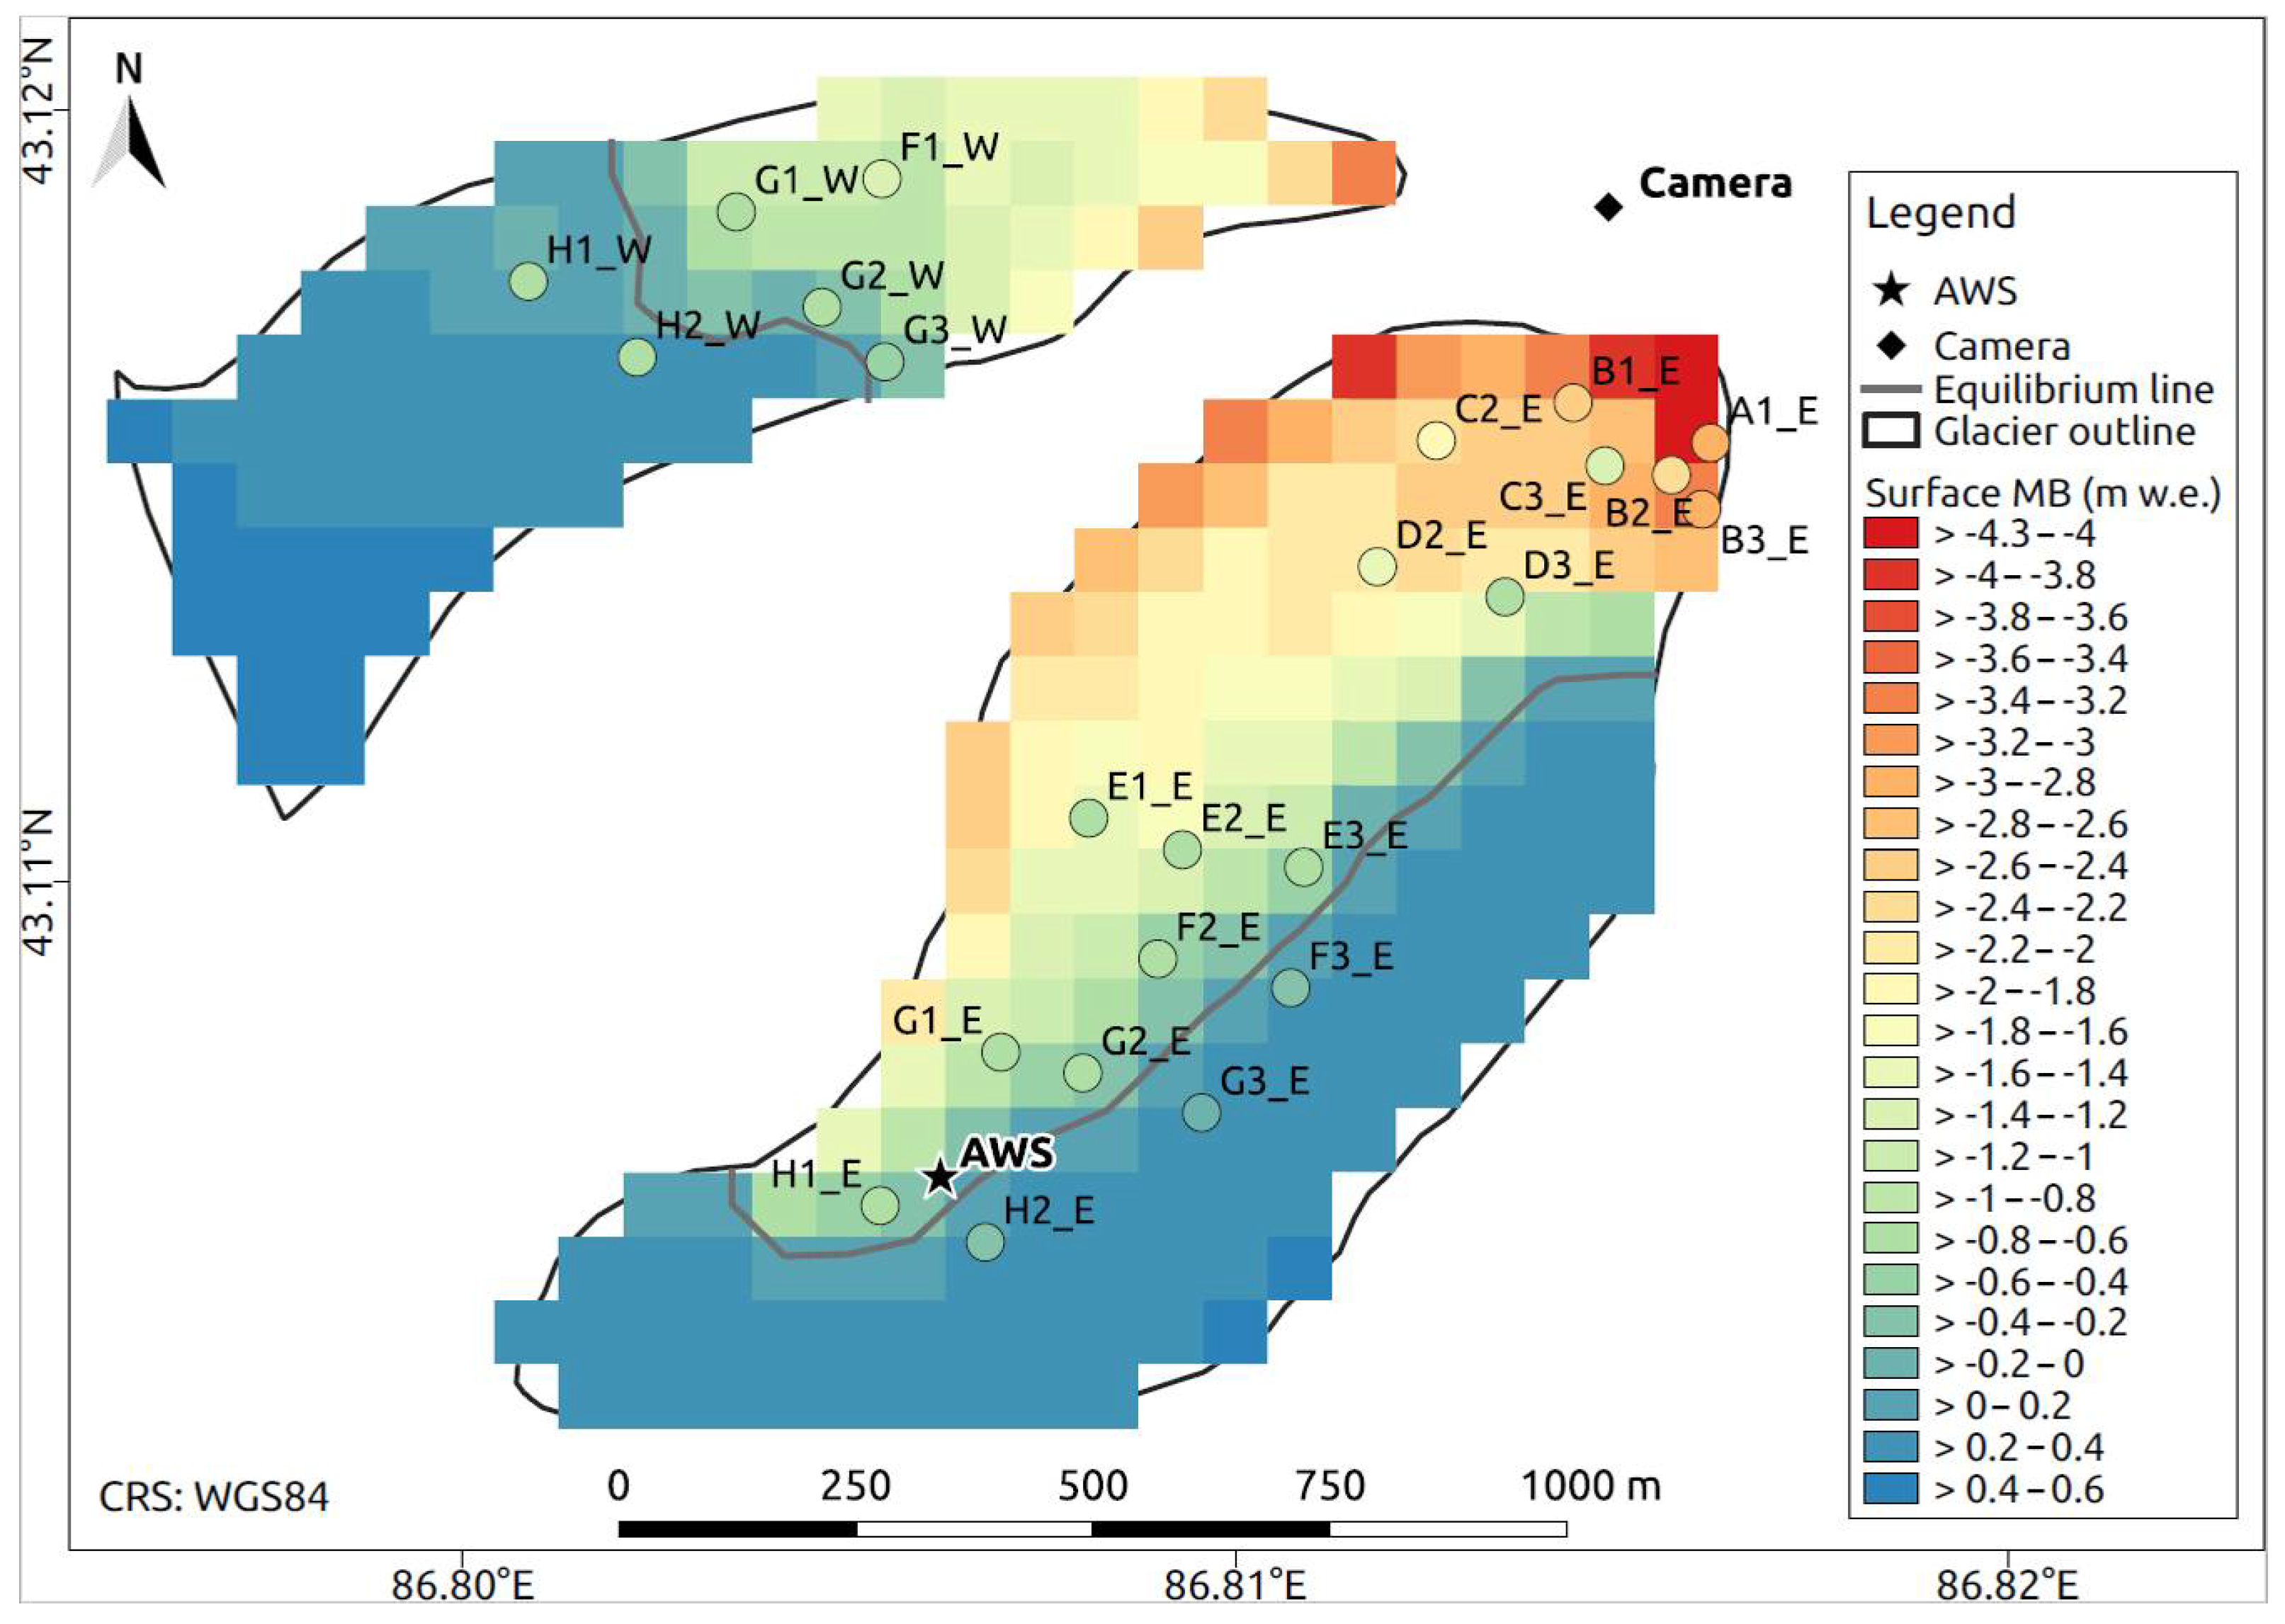
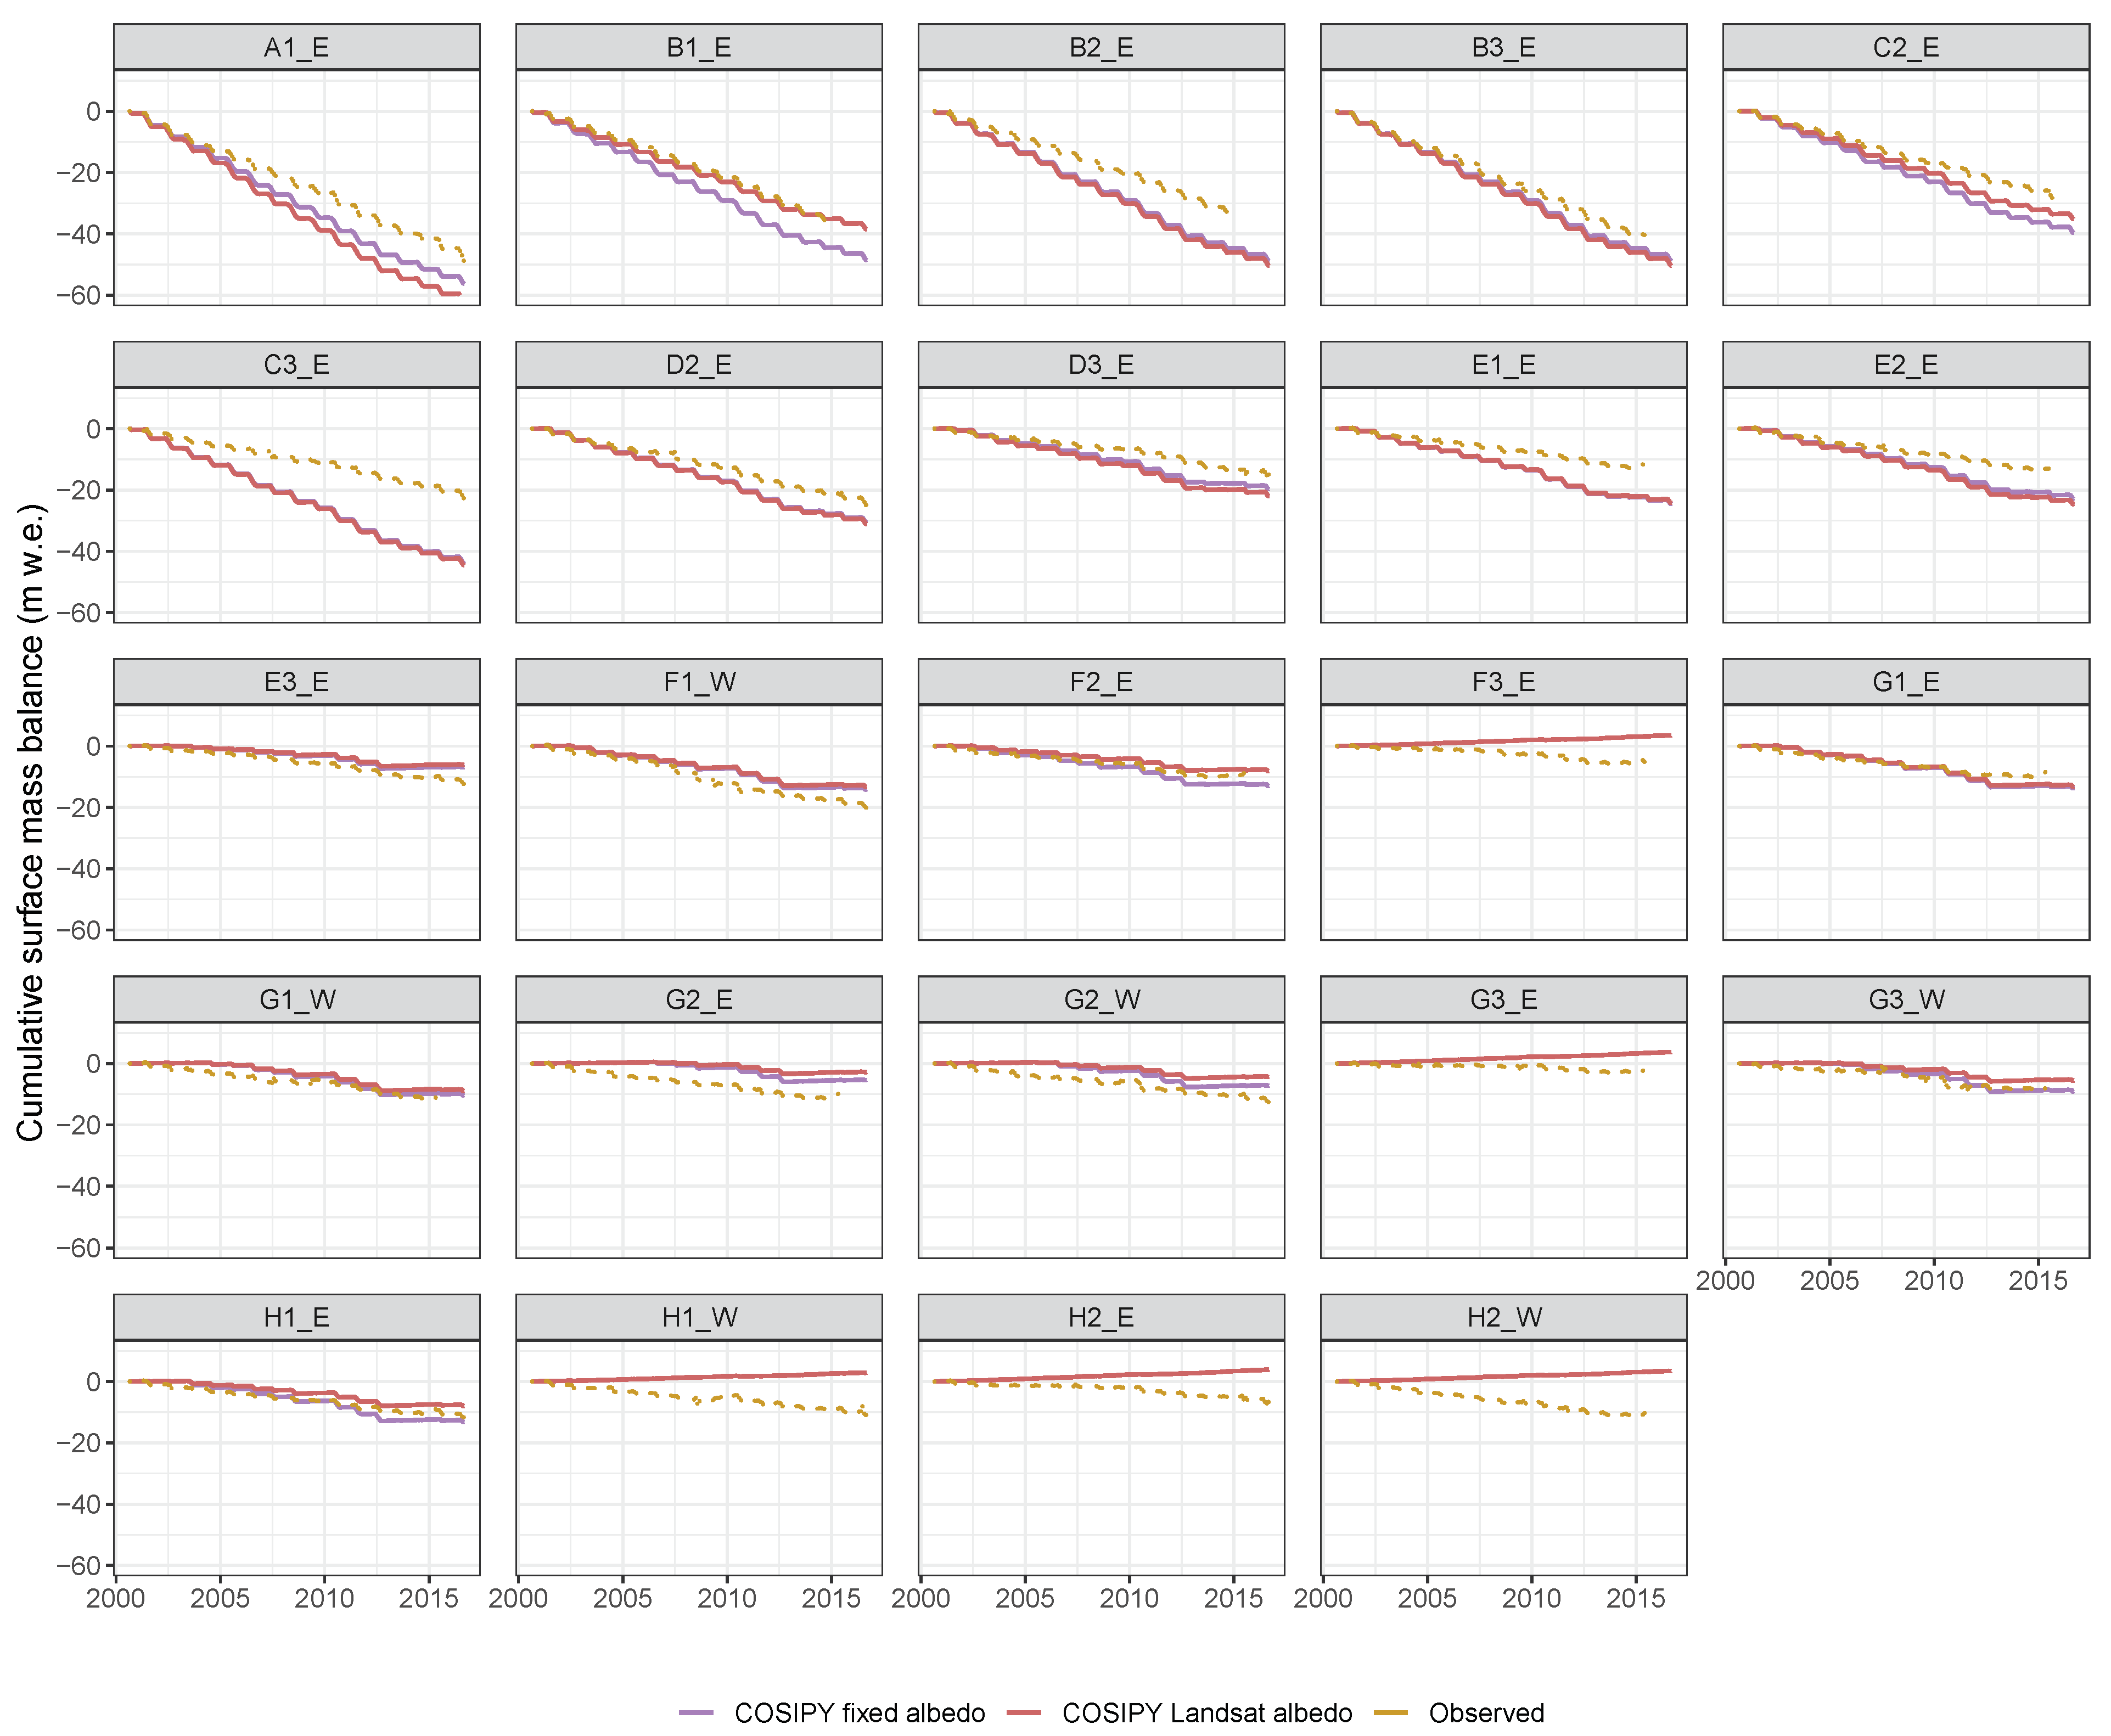
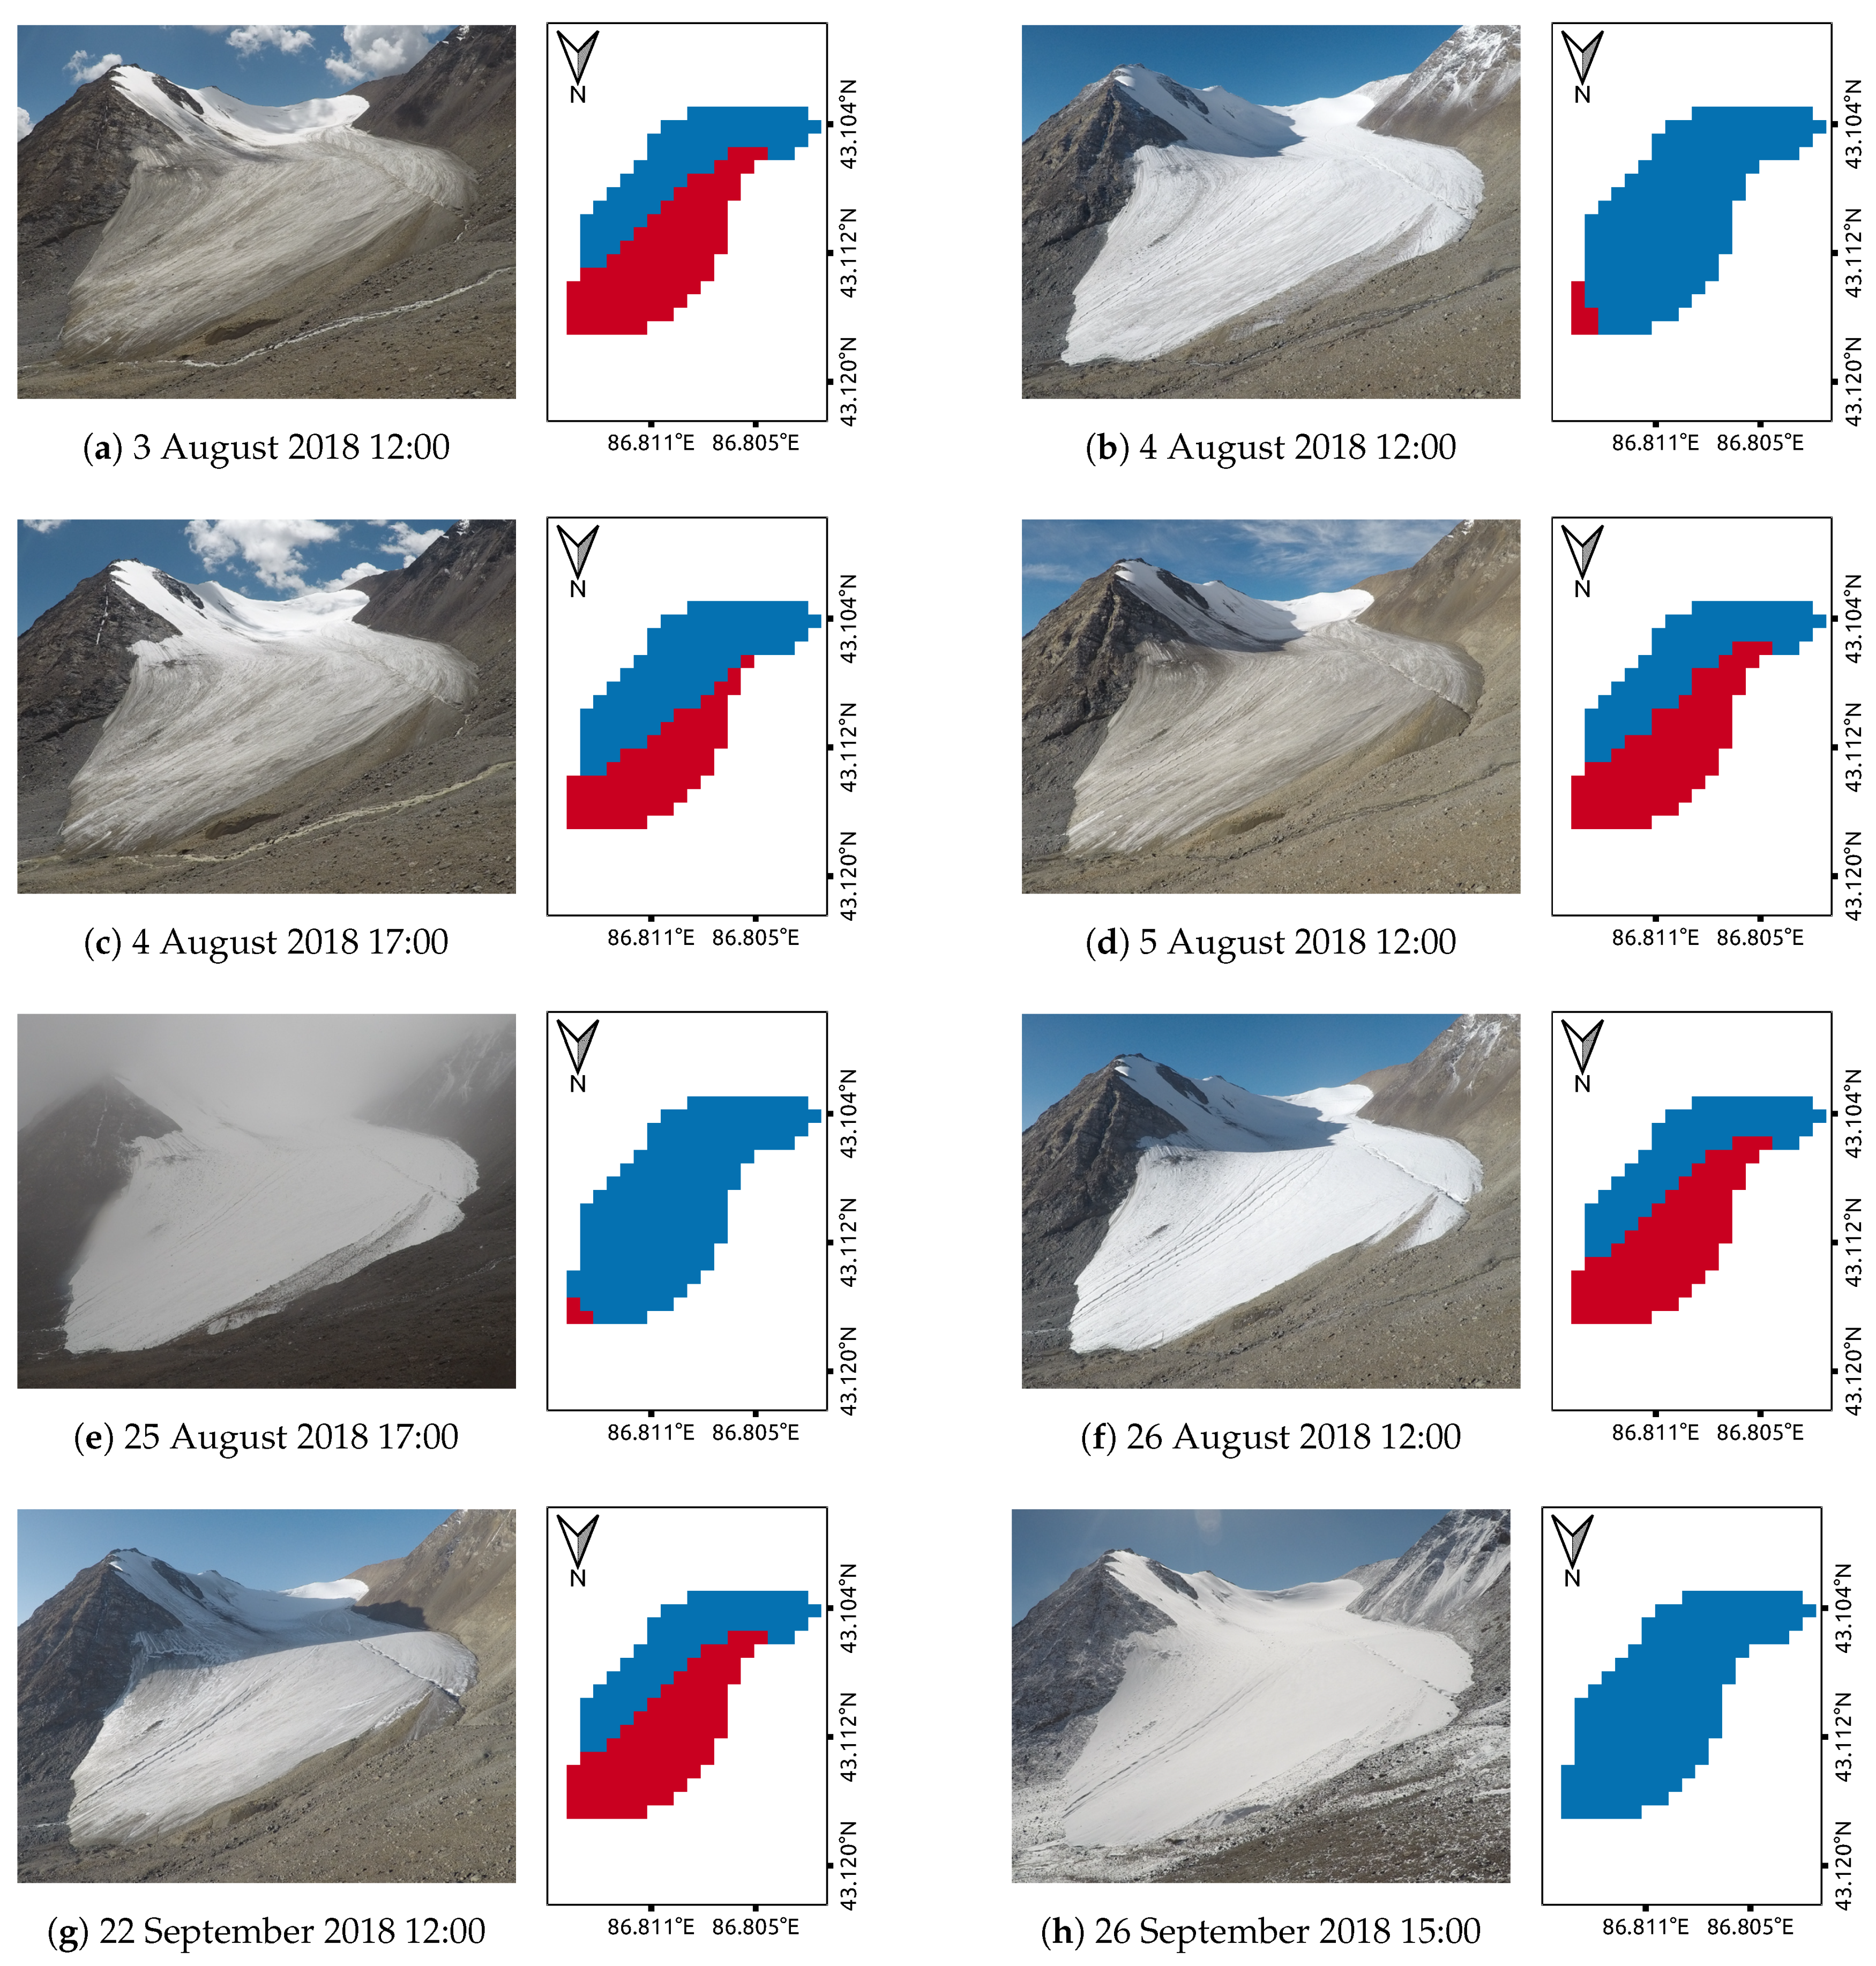
3.1. Surface Mass Balance Modeling

In the best performing setup, simulated glacier-wide mean annual (using the definition of the hydrological year from October to September) SMB is 688 ± 356 mm w . e . a 1 (± standard deviation) during the study period. Maximum annual SMB is modeled by COSIPY for 2014, when annual SMB is 24 mm w . e . a 1 . With an annual SMB of 1356 mm w . e . a 1 , minimum values occur in 2010. The years 2000 and 2020 are excluded from this calculation due to spin-up in 2000 and missing values at the end of 2020.
Validation of SMB simulations against ablation stakes is carried out comparing the respective stake to the COSIPY grid cell it lies within. As the number of stakes with long-term time series is reduced from 24 to ten at the end of 2014, comparisons are mostly carried out for the observation period 2000–2014. Figure 4 shows the spatial distributions of observed and modeled mean annual SMB for this period. Overall, SMB is most negative in the lowermost parts of the glacier and increases with altitude. In COSIPY, the zonation into ablation and accumulation zones follows the overall altitudinal gradient on the western branch. On the eastern branch, the zonation is different between its eastern and its western part. This is because the altitudinal signal is superimposed by the effects of topography in terms of slope and aspect.
Considering the agreement between ablation stakes and COSIPY, the spatial pattern matches for most stakes, whereas there are marked discrepancies visible at others. Figure 5 shows mean annual differences (COSIPY−Measured) in SMB during the 14 years of observation. An elevation-dependent bias between simulated and measured SMB is discernible with COSIPY underestimating mass balance in the ablation area and overestimating it in the accumulation area. Largest differences occur at the lower tongue of the eastern branch, where maximum underestimation is 1551 mm w . e . a 1 (stake C3_E). Maximum overestimation ( + 990 mm w . e . a 1 ) occurs in the western branch’s accumulation area at stake H2_W. Best overall agreement is shown at the stakes F1_W, G1_W, and G3_W in the ablation area of the west branch, at four stakes (E3_E, F2_E, G1_E, H1_E) along the eastern branch’s equilibrium line and at stake B1_E at the tip of the eastern glacier tongue. Of these, with only + 26 mm w . e . a 1 difference, stake B1_E shows the smallest discrepancy between COSIPY and the measurements. Averaged over all stakes, COSIPY underestimates the measured SMB by only 42 mm w . e . a 1 . However, with a standard deviation of 647 mm w . e . a 1 , the variance is high. On the eastern branch, the differences are on average 223 ± 630 mm w . e . a 1 . On the western branch, it is + 500 ± 330 mm w . e . a 1 .
Figure 6 depicts the stake-wise temporal evolution of the long-term SMB over the course of the study period. In order to also assess performance of the new albedo implementation, modeled SMB is shown for both, the new Landsat albedo parameterization and a spatially and temporally constant (fixed) albedo of 0.3 . The general SMB underestimation in the ablation area of the eastern branch (stakes with letters A–E) as well as the general overestimation in both branches’ accumulation area (stakes H1_W, H2_W, H2_E, G3_E, F3_E) are observable in both parameterizations and persist over the whole study period. The cumulative differences between COSIPY and the measurements consistently increase over time. Regarding those stakes that show small cumulative differences between COSIPY and the measurements in Figure 4 and Figure 5, two differing behaviors are discernible: whereas e.g., stakes B1_E and F2_E and H1_E show good alignment during the whole study period, especially for the Landsat albedo parameterization, agreement at other stakes is less coherent. Stake G1_E, for instance, shows good alignment during the first twelve years; then, the two modeled curves and the measurement curve abruptly diverge. Stake G1_W, in contrast, shows divergence in the first half of the observation period while the measured and the two modeled time series converge during the second half of the study period. Differences between the two model runs differ between stakes. There are both stakes where agreement between the model and the measurements is better for the fixed albedo run and stakes where it is better for the Landsat albedo run. Generally, however, both model runs show a high coherency.
The scatterplot in Figure 7 shows the mean daily SMB averaged over the single years for all ablation stakes individually. The MBE between COSIPY and the measurements is negligible for both albedo parameterizations. With an RMSE of only 0.0024 m w . e . per day, both parameterizations show small variance from the observations. Both COSIPY runs capture measured SMB variations very well on an annual basis. The correlation to the measured values is only slightly higher in the Landsat albedo run (R2 = 0.576 ) than in the fixed albedo run (R2 = 0.571 ).
Figure 8 shows the comparison of the glacier-wide annual SMB as modeled by COSIPY and the one published by the WGMS, the World Glacier Monitoring Service [80]. WGMS data were calculated via the glaciological method as described by Ostrem and Brugman [81] by the research team of the Tianshan Glaciological Station [82]. Averaged over the study period, the WGMS data returns a mean glacier-wide SMB of 680 ± 315 mm w . e . a 1 . With a value of 676 ± 373 mm w . e . a 1 , COSIPY reproduces this value accurately. However, regarding single years, some differences become apparent. While there are years in which the two SMB match nicely (e.g., 2008, 2010), there are numerous years in which differences are significant (e.g., 2001, 2003, 2009, 2013, 2014, 2015). While the MBE ( 4.3 mm w . e . a 1 ) is negligible over the 17 years of observation, the RMSE amounts to 284 mm w . e . a 1 . The explained variance is 42% between both datasets, but statistics are only based on 17 single years.
In Figure 9, eight example images captured by the fixed camera are presented. On the right-hand side of each scene, the simulated SLA is attached. All snow-covered (snow depth > 0.1 cm) pixels are displayed in blue, the snow-free in red. On the morning of 3 August 2018, only the accumulation area is snow-covered in both the image and the simulation. In the morning of the next day (4 August 2020), a thin snow layer is visible in the image. In the time-equivalent simulation, pixels are also snow-covered except for the lowermost ones. The depletion of snow in both the time-lapse photos and the simulation can be observed from the afternoon of the same day until the morning of 5 August 2018. Later, on 25 August 2018, the result of a snowfall event is visible in both the image and the simulated snow cover. However, on the next day, in the simulation, the snow cover has already completely melted away in the ablation area, while it is still present in the image of that day (26 August 2018). The 22 September 2018 shows an example with no snow cover in the ablation area of both the photography and the simulation. On 26 September 2018, a snow cover is visible in both data sets. The snow cover then persists in both the time-lapse photography series and the simulation, until the end of the time series of photos on 29 December 2018.

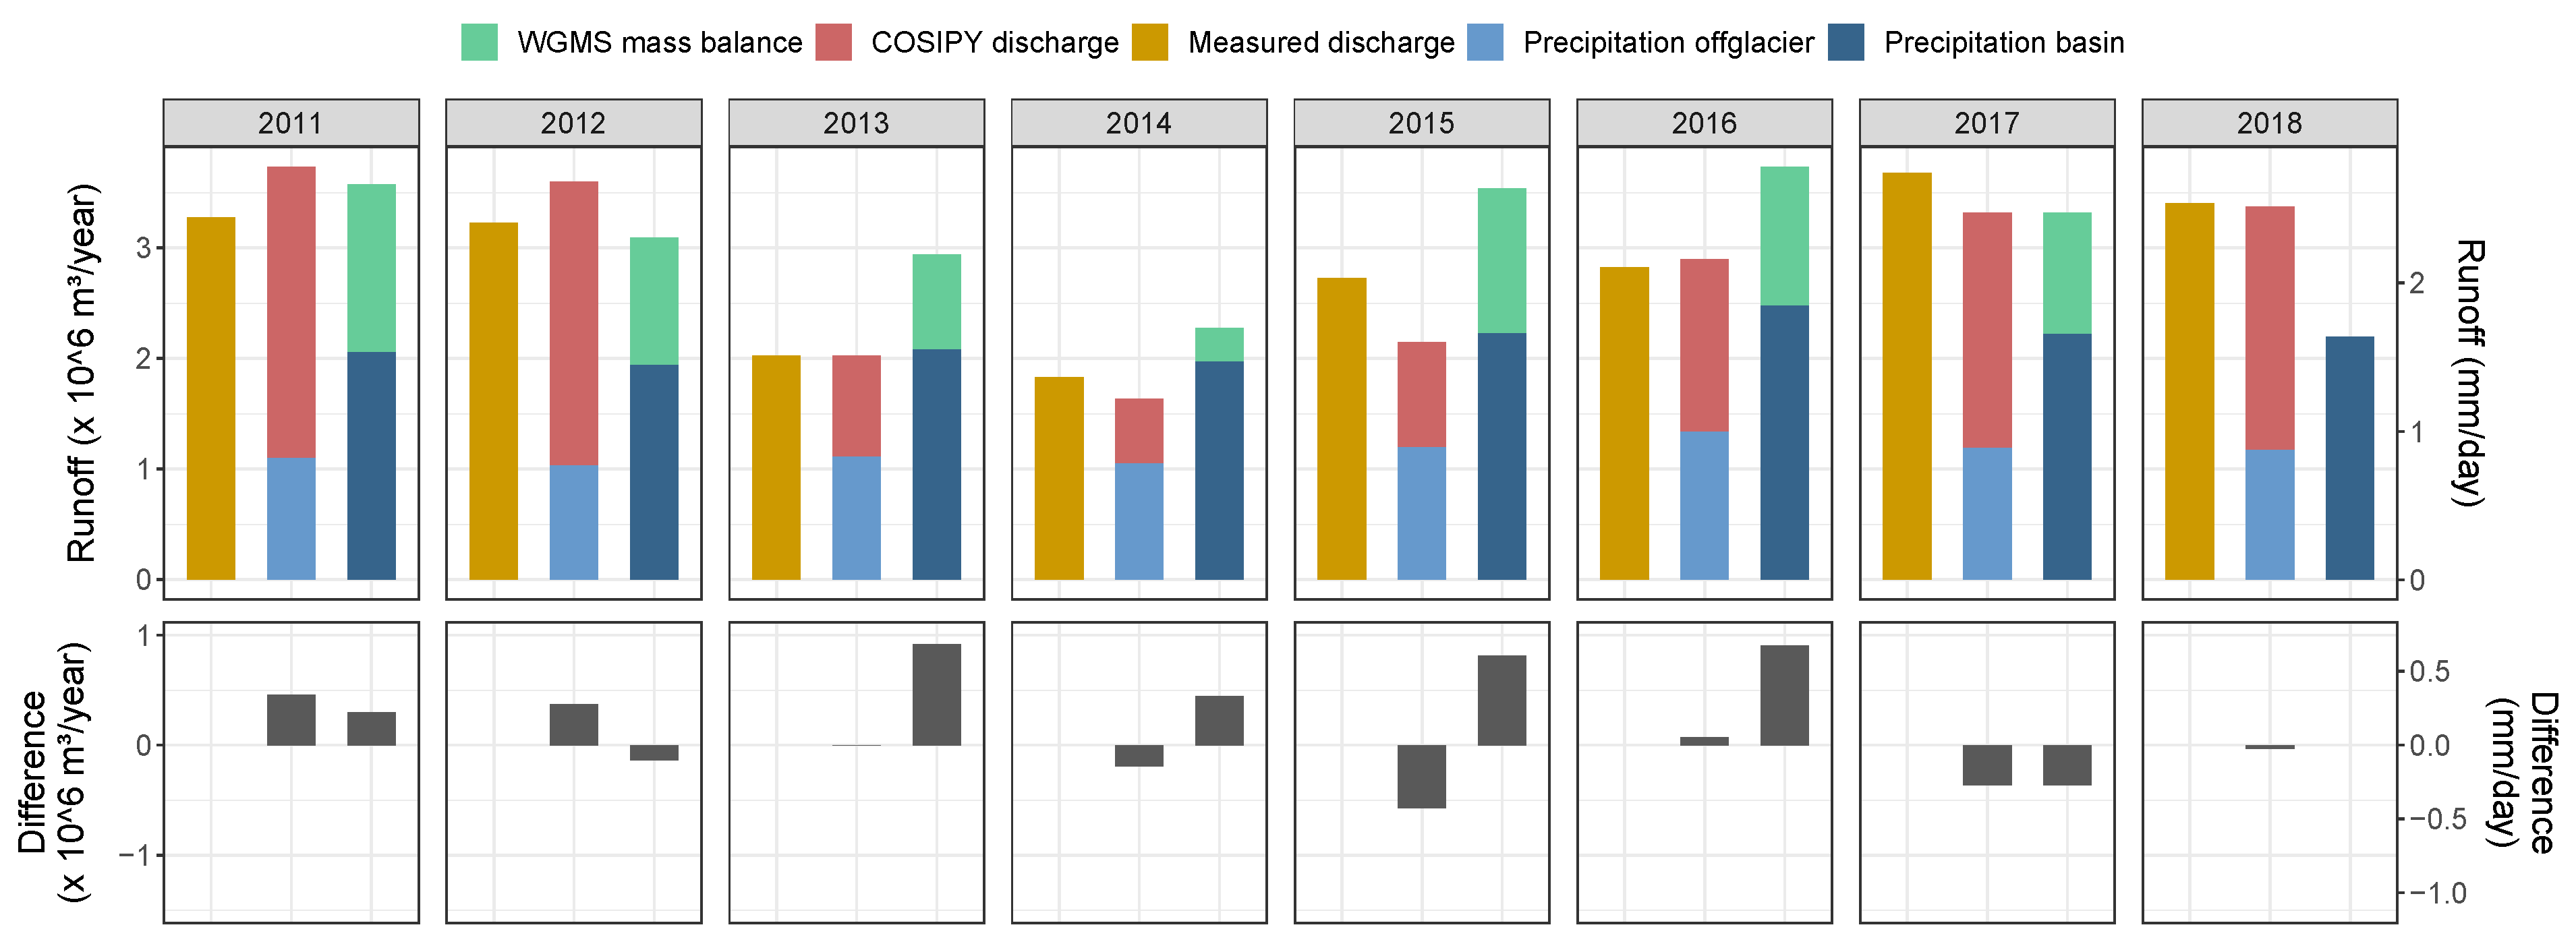
3.2. Discharge Derived from Glacier Mass Balance Modeling and Estimation of Catchment Runoff

COSIPY performance in modeling the discharge derived from mass balance modeling is assessed for the Landsat albedo run only. Figure 10 depicts the temporal evolution of the measured discharge, as well as the discharge derived from glacier mass balance modeling of UG1 alone (COSIPY discharge), and the discharge composed of the sum of mass balance derived discharge from UG1 and R R R for the non-glacierized part of the catchment (COSIPY discharge + precipitation off-glacier, from here on termed basin discharge) without any hydrological modeling applied. The latter closes the gap between the limited area of the glacier surface and the full catchment area. Measured discharge is generally higher than modeled glacier mass balance derived discharge, but including the estimated off-glacier discharge comes closer to the order of magnitude shown in the observations. Measurements at the gauging station only yield results in the summer months. In fact, COSIPY shows that modeled discharge in winter is negligible. Analog to the measurements, the onset of the melting season at the beginning of the summer months is marked by an abrupt increase in discharge. This onset is in most years captured nicely by COSIPY compared to the measurements. Apart from coinciding discharge season onsets, e.g., coinciding maximum peaks in the years 2013 or 2016, as well as the first two maximum peaks in 2018 are encouraging. However, in 2014, measurements show significantly higher discharge in the first half of the summer season than in the second half, whereas COSIPY models this behavior vice versa. In contrast to the COSIPY discharge for UG1 only and the measured discharge, the basin discharge shows runoff during the whole year. In addition, the onset of the discharge season is not as abrupt as in the other two time series. Analogous to the comparison between measured and COSIPY discharge, during the summer season, there are relative changes that nicely match between the basin discharge and the measurements (e.g., 2018), whereas there also is contrasting behavior (e.g., 2012). Regarding differences between years, quantitatively, COSIPY is not able to exactly reproduce the measured discharge, but qualitatively, the interannual variability is accurately captured. For both the discharge derived from mass balance modeling of UG1 only and the combined estimated basin discharge, years with high (low) summer measured discharge generally also show high (low) discharge derived from mass balance modeling and the rough estimation of off-glacier contributions.
Figure 11 and Figure 12 show the comparison of three different compounds of variables contributing to discharge. The first one is the measured discharge. The second compound is the aforementioned basin discharge, which is composed of the discharge COSIPY models for UG1 (COSIPY discharge) and the precipitation that falls in the non-glacierized part of the drainage basin (precipitation off-glacier). The third compound comprises the mass balance of UG1 as published by the WGMS (WGMS mass balance) and the precipitation that falls in the drainage basin as a whole, i.e., on-glacier and off-glacier (precipitation basin). This compound is from here on termed WGMS+precipitation discharge. The difference between Figure 11 and Figure 12 is the time span that is included in the calculation of the different compounds. In Figure 11, they represent only days during which discharge measurements are available. In Figure 12, in contrast, the whole year is included in the calculation. The exceptions from this are the measured discharge, which in both figures refers to measurement periods only, and the WGMS mass balance, which includes all days of the whole year in both figures. In both figures, the upper barplots show the absolute values of the different components, while the lower barplots show the differences between the measurements and the basin discharge or the WGMS+precipitation discharge compound. In 2018, there is no WGMS mass balance data available. Not visible in these plots are the evaporation and sublimation that occur in the non-glacierized part of the drainage basin where they would reduce the amount of discharge. These variables are approximated from their annual average on UG1 as modeled with COSIPY and subtracted from the off-glacier precipitation and from the basin precipitation, respectively. Mean assumed off-glacier evaporation per year is 0.007 m w . e . or 34.407 m 3 for measurement days only and 0.013 m w . e . or 46.047 m 3 for the whole year. Mean assumed off-glacier sublimation per year is 0.009 m w . e . or 26.777 m 3 for measurement days only and 0.024 m w . e . or 89.646 m 3 for the whole year.
For both examined time spans, the three different compounds generally are in the same order of magnitude, but absolute values differ significantly. Regarding measurement days only, cumulative measured discharge per year is on average (2.9 ± 0.7) × 10 6 m 3 . It is approx. 22% higher than both the cumulative basin discharge with (2.3 ± 0.8) × 10 6 m 3 and the WGMS+precipitation discharge with (2.3 ± 0.6) × 10 6 m 3 . Regarding all days of the year because of missing data in winter, measured volume stays the same, while mean cumulative basin discharge increases to (2.8 ± 0.8) × 10 6 m 3 and WGMS+precipitation discharge to (3.1 ± 0.6) × 10 6 m 3 . As a result, basin discharge is only slightly smaller than measured discharge and WGMS+precipitation discharge is on average 15% higher. Considering measurement days only, basin discharge is generally lower than the measured discharge, whereas for all days of the year the two compounds match well in most years. The WGMS+precipitation discharge compound generally underestimates the measured discharge when considering measurement days only, but overestimates it in most years when all days are included in the calculation. Interannual variability observed in the measured discharge is best reproduced by the basin discharge combination that includes all days of the year. The two precipitation components are quantitatively remarkably constant over time (Figure 11 and Figure 12). It is the COSIPY discharge and the WGMS mass balance that mainly explain the interannual variations.

4. Discussion

4.1. Surface Mass Balance Modeling and Associated Uncertainties

For the period 2000–2016, COSIPY models a glacier-wide mean annual mass balance of 688 mm w . e . a 1 or 681 mm w . e . a 1 with the Landsat and the fixed albedo parameterization, respectively. Both values agree well with the rate of 664 mm.a−1 found by Yuan et al. [20] during the period 1997–2010 and with the rate of 702 mm a−1 during 1997–2008 derived by Li et al. [16]. They are less than 8% higher than the 740 mm a−1 observed by Han et al. [14] for the period 1997–2002.
The spatial distribution of measured and modeled cumulative SMB (Figure 4 and Figure 5) is not perfect at all ablation stakes. In terms of absolute differences, there is no clear pattern discernible. In terms of relative differences, in both albedo parameterizations, COSIPY generally overestimates SMB in the accumulation area and underestimates it in the ablation area (Figure 6). The general agreement between COSIPY and the ablation stakes is, however, very convincing. The overall spatial agreement between the simulated and observed SMB is supported by the qualitative comparison between the time-lapse images and the simulated SLA. Most of the available and usable points in time photos and simulation report comparable snow cover on sub-daily time scale. Concerning the agreement between the two albedo parameterizations, differences are, depending on the ablation stake, clearly visible at some stakes. However, overall correlations with the measurements are high for either run. The scatter plots between measured and modeled mean daily SMB per stake and year (Figure 7) and their metrics show that although metrics identify the Landsat albedo parameterization as slightly better, differences are negligible.
Both model and measurement uncertainty have to be considered when comparing COSIPY and SMB measurements. A major source of model uncertainty lies in the forcing of COSIPY. During the year in which AWS data were available, ERA5 reanalysis performs well in predicting P R E S and T 2 but has difficulties with U 2 and R H 2 (Figure 3). Since we observed a nonlinear bias between unscaled ERA5 and measured T 2 , we applied a quantile mapping approach to downscale T 2 to the altitude of the AWS. The probable reason for especially the higher ERA5 summer temperatures is the so-called glacier cooling effect [83]. As a result of this effect and the katabatic boundary layer [84,85] on the glacier, the lapse rate is often not constant over the glacier [86,87,88]. These effects, however, are not the focus of this study. In the absence of any observational data for the study area that could justify applying such varying lapse rates, we refrain from following such approaches in this study. R H 2 and U 2 are more difficult to predict by ERA5 than P R E S and T 2 , especially in complex terrain. U 2 in combination with T 2 or R H 2 governs the turbulent heat fluxes. Both these fluxes are linear with U 2 and T 2 or mixing ratio gradient. Thus, the combination of both variables is of crucial importance for turbulent fluxes. Measured and modeled U 2 , however, do not show statistical correlation, on neither the hourly nor the daily basis. The parameterization of the turbulent fluxes are therefore assumed to be not reliable for single locations and times. Further uncertainty arises from uncertainty in the atmospheric measurements at the AWS and because downscaling could be based on only one year of measurements. Furthermore, the performance of ERA5 prediction of G, N and R R R could neither be evaluated nor could R R R be corrected for possible biases. G and N impact on the radiation budget. Snowfall in combination with T 2 determines the main source of external mass income to the glacier and also exhibits a strong influence on albedo and thus the energy balance (Equation (1)). R R R prediction is known to be highly error-prone, especially in complex terrain (e.g., [3,89,90]). UG1 has been shown in various studies to be especially sensitive to T 2 and to R R R [11,13,16,20]. In addition to these two parameters, [22] also stresses UG1’s sensitivity especially to S W i n (in combination with albedo) and to U 2 and R H 2 . Errors in the forcing data and their spatialization can therefore have a considerable influence on SMB.
Apart from meteorological forcing, uncertainty stems from the model itself. Those aspects can be summed up as follows: First, all parameterizations within COSIPY are generalizations of more complex processes. The parameterizations are based on a variety of free parameters which exert a strong influence on the model outcome. Their values are in this study mainly based on typical or site-specific values found in the literature, with a typically broad range of plausible values. Second, not all relevant processes for the energy and mass balance can be fully covered. A major factor to be mentioned is that COSIPY is a one-dimensional model limited to vertical fluxes of energy and matter only. Any effects of micro-scale atmospheric advection, snow redistribution by wind, avalanches, and ice-dynamics are neglected. A further aspect not considered in the model is the heat flux from rain. Rain heat flux happens when rain falls onto a colder surface and describes the conduction of heat towards the glacier which is then available for melt. Concerning the energy balance (1), another drawback is the neglect of shadowing effects from surrounding topography. In this respect, refinement of the radiation module could lead to resolving spatial differences even better.
To assess model results, measurements at ablation stakes are taken as ground-truth data and performance of COSIPY is evaluated on the basis of how well the simulations reproduce the measured patterns. However, measurement errors, varying evaluation periods or other biases originating from changes in instrumentation or observational or analytical methodology could significantly bias the outcome [91,92]. We aim to reduce some of the hence resulting uncertainties by referring to annual values only. Another drawback in model evaluation lies in the difference between point-wise (ablation stakes) and areal values (COSIPY). Point-wise observations are susceptible to high natural variability at small spatial scales. Areal estimates on the contrary mirror key processes only. Hence, although areal estimates are assumed to deliver more reasonable results, scale-induced differences hamper analysis.
The comparison between WGMS and COSIPY (Landsat albedo parameterization) in terms of glacier-wide annual SMB in Figure 8 shows very good agreement between both mass balance products. WGMS mass balances are calculated via the glaciological method by extrapolating SMB derived from ablation stakes over the entire glacier area [79]. This is especially error-prone in areas where processes differ, but which are not monitored sufficiently with ablation stakes, e.g., the accumulation area [93]. COSIPY on the contrary calculates the SMB for every pixel individually. Glaciological time series have repeatedly been identified to require homogenization, usually conducted via the geodetic method [2,91,92]. For SMB at UG1, however, Wang et al. [79] concluded that there was no need for calibration. Nonetheless, COSIPY as well as the glaciological and the geodetic method all include different processes in their calculation and certain discrepancies between them are reasonable. COSIPY is therefore identified a valuable tool to complement existing methods for the analysis of glacier development. Geodetic mass balances might be a suitable option for further validation of COSIPY in future studies.

4.2. Albedo Parameterization and Associated Uncertainties

Since bare-ice albedo can vary temporally and spatially [41,42,43], constant value for ice albedo presents a shortcoming in energy balance models. However, albedo values deduced from Landsat images are very low and require adjustment before integration into COSIPY. The images were not corrected for anisotropy before utilization. Anisotropy is material-dependent but typically leads to an underestimation of albedo values [49,65]. According to Klok et al. [94], this underestimation is greater for ice than for snow. Anisotropy correction is found to be especially important for large solar zenith angles [94,95]. In the five scenes applied in this study, solar zenith angles relative to the surface-parallel plane at satellite overpass range from 29.4 to 40.4 and derived albedos are conspicuously low, especially in bare-ice areas (Figure 2). Thus, anisotropy is assumed to affect the albedo derived in this study. Further uncertainty arises from the narrow-to-broadband conversion. It weights and aggregates individual spectral bands and assumes spectral properties for a wide range of wavelengths not measured. The implicit assumptions are error-prone and add uncertainty to the retrieved products [65]. Another factor biasing the results lies in the choice of Landsat scenes for the analysis. The two main constraints, namely the absence of clouds and snow, limited the selection to scenes from 2012–2019 only, which are all from towards the end of the ablation season. Negative long-term ice albedo trends could distort results (e.g., [43,63]). At UG1, a statistically significant negative trend of albedo was found by Wang et al. [67] for the period 2000–2011. It is assumed that this trend has continued since then. The rate, however, is small and is therefore assumed to be negligible over the study period. As the melting season proceeds, exposure time of already snow-free areas prolongs. As a consequence, accumulation of impurities grows [41,96] and englacial debris increasingly melts out [97], which highly affects albedo [42,45,49,63]. An additional drawback from the sole employment of images from the ablation season is the influence of meltwater on albedo. Meltwater decreases the albedo due to its lower reflectivity [96,98,99]. However, albedo might also increase toward the end of the ablation season due to washed out dust and debris by meltwater and rain [53,100].
Whereas aforementioned curbs are likely to bias the results to a certain degree, low albedos can not only be explained by methodological uncertainty. Fugazza et al. [101] found similarly low values for the ablation areas of different glaciers in the Alps. They attributed low absolute values and the general decreasing interannual trend mainly to an augmenting supraglacial debris cover and the overall climatic evolution leading to enhanced melt and prolonged ablation seasons. Similarly small albedo values have also been derived through in-situ measurements (e.g., [18,34,47]) and are often related to the accumulation of light-absorbing impurities [18,42,43,45,47,96]. Regarding UG1 specifically, all of these aspects apply. Air temperatures at UG1 show a long-term increase, which has accelerated during recent decades while rising precipitation does not exhibit enough influence to reconcile warming [12,13,14,17,22]. Melt is enhanced and stratigraphic and ice formation zone characteristics altered [17]. Bare-ice areas expand and exposure times prolong favoring the increased accumulation of light-absorbing impurities. Takeuchi and Li [18] found the bare-ice area of UG1 almost completely covered in “brown dust” in August 2006. In their study, mean ice albedo from spectral reflectance measurements ranged from 0.09 to 0.24, with a mean of 0.14 . A later study by Yue et al. [47] derived albedo values for both, bare-ice and snow-covered areas, from Landsat images employing the narrow-to-broadband approach by Knap et al. [66]. While they did carry out radiometric calibration as well as topographic and anisotropic corrections, their values are similar to those derived in this study. In their study, ice albedo ranges from 0.06 to 0.44 and comparison of Landsat derived albedos to those measured with a handheld spectroradiometer show good agreement. Low values correlate positively with the abundance of impurities and debris [47].

4.3. Approximation of Discharge and Associated Uncertainties

Quantitatively, the mean annual mass balance derived discharge and estimated total basin discharge of 2.8 × 10 6 m 3 agrees well with the measured annual basin discharge of 2.9 × 10 6 m 3 as well as with the study by Li et al. [12] who during the period 1959–2006 calculate an increase in discharge by 1.65 × 10 6 m 3 or 150%. This corresponds to an annual basin runoff of 2.8 × 10 6 m 3 at the end of their observation period, which roughly coincides with the beginning of the study period. The prediction of mean annual discharge amount is therefore promising.
Looking at the temporal correlation between measured and modeled glacier mass balance derived or estimated basin discharge (Figure 10), some differences are discernible. Measurements are interrupted in winter because both, stream, and gauging device are stopped. COSIPY nicely mirrors this development as there is hardly any discharge modeled from UG1 during winter. Basin discharge on the contrary, although significantly lower during winter, does generally occur all year round. The reason lies in the assumption for the simplified calculation of the off-glacier precipitation, which implies that precipitation runs off the same day it has fallen. However, temperatures in the study area drop far below freezing point in winter. Precipitation would thus in reality rather accumulate as snow and ice contributing to seasonal melting in spring and summer when temperatures rise above freezing point. Apart from the season and the influence of air temperatures, response times differ depending on e.g., the soil properties and thus percolation times. The neglect of these factors introduces errors in the temporal evolution of discharge from off-glacier which in turn superimposes the discharge from the basin as a whole. High agreement in both onset and duration of the discharge season, especially between COSIPY discharge and measurements, however suggests promising model performance once aforementioned factors are accurately parameterized.
Figure 11 and Figure 12 show that, in terms of annual discharge amount, off-glacier precipitation in combination with COSIPY discharge from UG1 performs well in reproducing the measured discharge. In the calculation in Figure 11, the winter precipitation is not included, which is why basin discharge is less than measured discharge. Other possible processes not included in the model include e.g., the melting of permafrost. In Figure 12, winter precipitation is included in the estimation, but the measurements are from summer only. Assuming that the measuring device can still (already) be stopped while there is already (still) water running off, actual runoff could be higher than measurements suggest. According to Li et al. [12], about 95% of the discharge at the gauging station occurs from May to September and are therefore covered by the measurements. High annual correlation between the measurements and the basin discharge in Figure 12 is therefore assumed reliable and mirrors the fact that solid precipitation during the winter season adds to the runoff in the following melt season. Comparison with the discharge resulting from the combination of WGMS mass balance and basin precipitation on the other hand is less satisfactory. As both off-glacier precipitation and basin precipitation show only small variations between years, interannual variability is mainly caused by COSIPY discharge or by WGMS mass balance. Therefore, it is the WGMS mass balance that causes the dissimilarities to the measurements and to the basin discharge. As already mentioned in Section 4.1, differences in the mass balance calculations by the WGMS and by COSIPY are considerable. Superiority in reproducing measured runoff therefore clearly identifies COSIPY as a valuable tool not only for the calculation of the long-term glacier-wide mass balance, but also for the assessment of discharge.
All model uncertainties addressed in Section 4.1 are included in COSIPY discharge simulations as well. In addition, inaccuracies in the WGMS mass balance calculation remain. Furthermore, although basin discharge delivers satisfactory results, its approximation includes the delineation of the drainage basin itself, whose accuracy is in turn curbed by inaccuracies in the underlying DEM. With a total size of 3.56 km2, it, however, deviates by only + 0.22 km2 ( + 6 %) from the ones derived by Li et al. [12] and by Ye et al. [13]. As this lies within the uncertainty range approximated for inaccuracies in the DEM, drainage basin delineation seems to be appropriate. Furthermore, discharge measurements themselves are error-prone as well, especially in mountainous proglacial areas with uneven along and cross-profiles of streams and heavy sediment load [102,103].

5. Conclusions

Given the many sources of uncertainty, COSIPY has proven to accurately and satisfactorily reproduce both the SMB at the location of single mass balance stakes and the glacier-wide SMB of UG1. The integration of site-specific bare-ice albedos on a pixel basis improves SMB simulation slightly, but if the time-benefit relation justifies the extra expenditure is questionable. The inclusion of a parameterization for snowdrift as well as shadowing effects of nearby walls might improve both overall and spatial patterns of SMB. To further investigate the remaining mismatch between glaciological method and COSIPY, both in overall annual values and at single stake locations, it will be necessary to compare both methods to high-resolution geodetic mass balances derived from repeated satellite or drone-based observations of glacier volume. Such future work, however, requires the integration of COSIPY with an ice-dynamical model in order to incorporate ice dynamic adjustment of the glacier geometry.
COSIPY allows for predicting the onset and duration of the discharge season as well as interannual variations that are markedly governed by glacier mass balance and to a much lesser extent by variations in precipitation. COSIPY covers temporal variations during the course of the season to some extent. However, the temporal mismatch between measured drainage basin runoff and modeled glacier SMB is not fully compensated for by merely adding estimates of off-glacier precipitation as done in a kind of first-order approximation in this study. Therefore, efforts in future studies must include applying a distributed hydrological model for off-glacier areas of the catchment and a water routing scheme within the glacier itself. Including more of the processes that contribute to runoff in the non-glacierized part of the basin such as meltwater generation from permafrost and especially taking their different response times into account could further improve discharge simulations, and are therefore suggested as research objectives in follow-up studies.

Author Contributions

The conceptualization of the study was discussed and set up by all authors during proposal writing, fieldwork and analysis of data. K.T. and A.A. developed the methodology and software adaptations. Fieldwork and validation of field observations were carried out among others by Z.L., P.W., H.L. and C.S. Formal analysis was carried out by K.T. and A.A. Discussion of results was organized by C.S. together with K.T. and A.A. Writing—original draft preparation and visualization was performed by K.T. with additions and revisions from both A.A. and C.S. Supervision of the whole work has been in the responsibility of C.S. Project administration was carried out by A.A. and funding acquisition by C.S., H.L. and Z.L. All authors contributed to the final text version of the manuscript. All authors have read and agreed to the published version of the manuscript.

Funding

This research was funded by the German Research Foundation, Deutsche Forschungsgemeinschaft (DFG), Grant Nos. SCHN680/13-1 and SCHN680/17-1 and the National Natural Science Foundation of China, Grant Nos. 41761134093 and 41771077. The APC was funded by Humboldt-Universität zu Berlin through resources from DFG.

Acknowledgments

We are grateful to Alexandra Hamm for field assistance and processing data that contributed to this study. We acknowledge the dedication of all staff from Urumqi Glacier No. 1 Glaciological Station of the Chinese Academy of Sciences for the sustained efforts with respect to field installations and their continued effort to the provision of field data both from the glacier and the runoff. We thank Sebastian Schubert for managing the computational infrastructure for the COSIPY runs at the Geography Department of Humboldt-Universität zu Berlin. We would also like to thank the two anonymous reviewers and the editors, who substantially helped to improve the study. We acknowledge support by the German Research Foundation, Deutsche Forschungsgemeinschaft (DFG) and the Open Access Publication Fund of Humboldt-Universität zu Berlin.

Conflicts of Interest

The authors declare no conflict of interest. The funders had no role in the design of the study, nor in the collection, analyses, interpretation of data, in the writing of the manuscript, or the decision to publish the results.

Abbreviations

The following abbreviations are used in this manuscript:
Acronyms
AWS Automatic weather station.
COSIMA COupled Snowpack and Ice surface energy and MAss balance model.
COSIPY COupled Snowpack and Ice surface energy and mass balance model in PYthon.
DEM Digital elevation model.
ECMWF European Centre for Medium-Range Weather Forecasts.
ERA5 ECMWF Reanalysis 5 th Generation.
MB Mass balance.
MBE Mean bias error.
RGI 6.0 Randolph Glacier Inventory 6.0.
RMSE Root mean squared error.
SEB Surface energy balance.
SLA Snow line altitude.
SMB Surface mass balance.
SRTM Shuttle Radar Topography Mission.
UG1 Urumqi Glacier No. 1.
USGS U.S. Geological Survey.
WGMS World Glacier Monitoring Service.
List of constants
SymbolDescriptionUnitDefault Value
L f Latent heat of fusion J k g 1 3.34 × 10⁵
L s Latent heat of sublimation J k g 1 2.849 × 10⁶
L v Latent heat of vaporization J k g 1 2.514 × 10⁶
T 0 Zero temperatureK273.16
List of symbols
SymbolDescriptionUnit
FEnergy flux W m 2
GSolar radiation W m 2
NCloud cover fraction-
P R E S Surface pressure h Pa
Q G Ground heat flux W m 2
Q l Latent heat flux W m 2
Q m Energy available for surface melt W m 2
Q s Sensible heat flux W m 2
R H 2 Relative humidity in 2 m%
RRRPrecipitationmm
SFMass gain by snowfall m w . e
T 2 Air temperature at 2 mK
T s Surface temperatureK
U10WS10 component in direction x m s 1
U2Wind speed at 2 m m s 1
V10WS10 component in direction y m s 1
Θ i Volumetric fraction of ice-
Θ w Liquid water content-
α Albedo-
α f i r n Firn albedo-
α f r s n o w Fresh snow albedo-
α i c e Bare ice albedo-
ρ i Density of ice kg m 3
ρ s n o w Density of fresh snow kg m 3
b n Landsat spectral band number-
e a i r Water vapor pressure of the airhPa
e s Water vapor pressure at the surfacehPa
L W i n Incoming longwave radiation W m 2
L W o u t Outgoing longwave radiation W m 2
S W i n Incoming shortwave radiation W m 2
T s u b Subsurface temperatureK
Γ T Temperature lapse rate K m 1

References

  1. Kong, Y.; Pang, Z. Evaluating the sensitivity of glacier rivers to climate change based on hydrograph separation of discharge. J. Hydrol. 2012, 434, 121–129. [Google Scholar] [CrossRef]
  2. Huss, M.; Sold, L.; Hoelzle, M.; Stokvis, M.; Salzmann, N.; Farinotti, D.; Zemp, M. Towards remote monitoring of sub-seasonal glacier mass balance. Ann. Glaciol. 2013, 54, 75–83. [Google Scholar] [CrossRef] [Green Version]
  3. Gao, H.; Li, H.; Duan, Z.; Ren, Z.; Meng, X.; Pan, X. Modelling glacier variation and its impact on water resource in the Urumqi Glacier No. 1 in Central Asia. Sci. Total Environ. 2018, 644, 1160–1170. [Google Scholar] [CrossRef] [PubMed]
  4. Pelto, M.S. Skykomish River, Washington: Impact of ongoing glacier retreat on streamflow. Hydrol. Process. 2011, 25, 3356–3363. [Google Scholar] [CrossRef]
  5. Huss, M. Present and future contribution of glacier storage change to runoff from macroscale drainage basins in Europe. Water Resour. Res. 2011, 47. [Google Scholar] [CrossRef] [Green Version]
  6. Koboltschnig, G.R.; Schöner, W. The relevance of glacier melt in the water cycle of the Alps: The example of Austria. Hydrol. Earth Syst. Sci. 2011, 15, 2039–2048. [Google Scholar] [CrossRef] [Green Version]
  7. Bliss, A.; Hock, R.; Radić, V. Global response of glacier runoff to twenty-first century climate change. J. Geophys. Res. Earth Surf. 2014, 119, 717–730. [Google Scholar] [CrossRef]
  8. Carturan, L.; De Blasi, F.; Cazorzi, F.; Zoccatelli, D.; Bonato, P.; Borga, M.; Dalla Fontana, G. Relevance and Scale Dependence of Hydrological Changes in Glacierized Catchments: Insights from Historical Data Series in the Eastern Italian Alps. Water 2019, 11, 89. [Google Scholar] [CrossRef] [Green Version]
  9. Zhang, Y.; Luo, Y.; Sun, L. Quantifying future changes in glacier melt and river runoff in the headwaters of the Urumqi River, China. Environ. Earth Sci. 2016, 75. [Google Scholar] [CrossRef]
  10. Bershaw, J.; Lechler, A.R. The isotopic composition of meteoric water along altitudinal transects in the Tian Shan of Central Asia. Chem. Geol. 2019, 516, 68–78. [Google Scholar] [CrossRef]
  11. Zhang, G.; Li, Z.; Wang, W.; Wang, W. Rapid decrease of observed mass balance in the Urumqi Glacier No. 1, Tianshan Mountains, central Asia. Quat. Int. 2014, 349, 135–141. [Google Scholar] [CrossRef]
  12. Li, Z.; Wang, W.; Zhang, M.; Wang, F.; Li, H. Observed changes in streamflow at the headwaters of the Urumqi River, eastern Tianshan, central Asia. Hydrol. Process. 2010. [Google Scholar] [CrossRef]
  13. Ye, B.; Yang, D.; Jiao, K.; Han, T.; Jin, Z.; Yang, H.; Li, Z. The Urumqi River source Glacier No. 1, Tianshan, China: Changes over the past 45 years. Geophys. Res. Lett. 2005, 32. [Google Scholar] [CrossRef]
  14. Han, T.; Ding, Y.; Ye, B.; Liu, S.; Jiao, K. Mass-balance characteristics of Ürümqi glacier No. 1, Tien Shan, China. Ann. Glaciol. 2006, 43, 323–328. [Google Scholar] [CrossRef] [Green Version]
  15. Mingjie, G.; Tianding, H.; Baisheng, Y.; Keqin, J. Characteristics of melt water discharge in the Glacier No. 1 basin, headwater of Urumqi River. J. Hydrol. 2013, 489, 180–188. [Google Scholar] [CrossRef]
  16. Li, Z.; Li, H.; Chen, Y. Mechanisms and simulation of accelerated shrinkage of continental glaciers: A case study of Urumqi Glacier No. 1 in eastern Tianshan, Central Asia. J. Earth Sci. 2011, 22, 423–430. [Google Scholar] [CrossRef]
  17. Li, Z.; Yongping, S.; Huilin, L.; Zhiwen, D.; Liwei, W. Response of the Melting Urumqi Glacier No. 1 in Eastern Tianshan to Climate Change. Adv. Clim. Chang. Res. 2008, 4, 67–72. [Google Scholar]
  18. Takeuchi, N.; Li, Z. Characteristics of Surface Dust on Ürümqi Glacier No. 1 in the Tien Shan Mountains, China. Arct. Antarct. Alp. Res. 2008, 40, 744–750. [Google Scholar] [CrossRef]
  19. WGMS. Glacier Mass Balance Bulletin; No. 12 (20 ed.; Vol. 12, ICSU(WDS)/IUGG(IACS)/UNEP/ UNESCO/WMO; World Glacier Monitoring Service: Zurich, Switzerland, 2013. [Google Scholar] [CrossRef]
  20. Yuan, F.; Hao, Z.; Berndtsson, R.; Jiang, P.; Yasuda, H. The Mass Balance of Glacier No. 1 at the Headwaters of the Urumqi River in Relation to Northern Hemisphere Teleconnection Patterns. Water 2016, 8, 100. [Google Scholar] [CrossRef] [Green Version]
  21. Farinotti, D.; Longuevergne, L.; Moholdt, G.; Duethmann, D.; Mölg, T.; Bolch, T.; Vorogushyn, S.; Güntner, A. Substantial glacier mass loss in the Tien Shan over the past 50 years. Nat. Geosci. 2015, 8, 716–722. [Google Scholar] [CrossRef]
  22. Che, Y.; Zhang, M.; Li, Z.; Wei, Y.; Nan, Z.; Li, H.; Wang, S.; Su, B. Energy balance model of mass balance and its sensitivity to meteorological variability on Urumqi River Glacier No.1 in the Chinese Tien Shan. Sci. Rep. 2019, 9. [Google Scholar] [CrossRef] [PubMed] [Green Version]
  23. Wang, P.; Li, Z.; Li, H.; Zhang, Z.; Xu, L.; Yue, X. Glaciers in Xinjiang, China: Past Changes and Current Status. Water 2020, 12, 2367. [Google Scholar] [CrossRef]
  24. Scherler, D.; Bookhagen, B.; Strecker, M.R. Spatially variable response of Himalayan glaciers to climate change affected by debris cover. Nat. Geosci. 2011, 4, 156–159. [Google Scholar] [CrossRef]
  25. Sagredo, E.; Lowell, T. Climatology of Andean glaciers: A framework to understand glacier response to climate change. Glob. Planet. Chang. 2012, 86-87, 101–109. [Google Scholar] [CrossRef]
  26. Adhikari, S.; Marshall, S.J. Influence of high-order mechanics on simulation of glacier response to climate change: Insights from Haig Glacier, Canadian Rocky Mountains. Cryosphere 2013, 7, 1527–1541. [Google Scholar] [CrossRef] [Green Version]
  27. Hock, R.; Holmgren, B. A distributed surface energy-balance model for complex topography and its application to Storglaciären, Sweden. J. Glaciol. 2005, 51, 25–36. [Google Scholar] [CrossRef] [Green Version]
  28. Bolch, T.; Kulkarni, A.; Kaab, A.; Huggel, C.; Paul, F.; Cogley, J.G.; Frey, H.; Kargel, J.S.; Fujita, K.; Scheel, M.; et al. The State and Fate of Himalayan Glaciers. Science 2012, 336, 310–314. [Google Scholar] [CrossRef] [Green Version]
  29. Kääb, A.; Berthier, E.; Nuth, C.; Gardelle, J.; Arnaud, Y. Contrasting patterns of early twenty-first-century glacier mass change in the Himalayas. Nature 2012, 488, 495–498. [Google Scholar] [CrossRef]
  30. Wohlfahrt, G.; Hammerle, A.; Niedrist, G.; Scholz, K.; Tomelleri, E.; Zhao, P. On the energy balance closure and net radiation in complex terrain. Agric. For. Meteorol. 2016, 226-227, 37–49. [Google Scholar] [CrossRef] [Green Version]
  31. Mölg, T.; Maussion, F.; Yang, W.; Scherer, D. The footprint of Asian monsoon dynamics in the mass and energy balance of a Tibetan glacier. Cryosphere 2012, 6, 1445–1461. [Google Scholar] [CrossRef] [Green Version]
  32. Maussion, F.; Gurgiser, W.; Großhauser, M.; Kaser, G.; Marzeion, B. ENSO influence on surface energy and mass balance at Shallap Glacier, Cordillera Blanca, Peru. Cryosphere 2015, 9, 1663–1683. [Google Scholar] [CrossRef] [Green Version]
  33. Sauter, T.; Arndt, A.; Schneider, C. COSIPY v1.3—An open-source coupled snowpack and ice surface energy and mass balance model. Geosci. Model Dev. 2020. [Google Scholar] [CrossRef]
  34. Oerlemans, J.; Giesen, R.; Van Den Broeke, M. Retreating alpine glaciers: Increased melt rates due to accumulation of dust (Vadret da Morteratsch, Switzerland). J. Glaciol. 2009, 55, 729–736. [Google Scholar] [CrossRef] [Green Version]
  35. Qu, B.; Ming, J.; Kang, S.C.; Zhang, G.S.; Li, Y.W.; Li, C.D.; Zhao, S.Y.; Ji, Z.M.; Cao, J.J. The decreasing albedo of the Zhadang glacier on western Nyainqentanglha and the role of light-absorbing impurities. Atmos. Chem. Phys. 2014, 14, 11117–11128. [Google Scholar] [CrossRef] [Green Version]
  36. Brun, F.; Dumont, M.; Wagnon, P.; Berthier, E.; Azam, M.F.; Shea, J.M.; Sirguey, P.; Rabatel, A.; Ramanathan, A. Seasonal changes in surface albedo of Himalayan glaciers from MODIS data and links with the annual mass balance. Cryosphere 2015, 9, 341–355. [Google Scholar] [CrossRef] [Green Version]
  37. Mernild, S.H.; Malmros, J.K.; Yde, J.C.; Wilson, R.; Knudsen, N.T.; Hanna, E.; Fausto, R.S.; As, D.V. Albedo decline on Greenland’s Mittivakkat Gletscher in a warming climate. Int. J. Climatol. 2015, 35, 2294–2307. [Google Scholar] [CrossRef]
  38. Hoffman, M.J.; Fountain, A.G.; Liston, G.E. Distributed modeling of ablation (1996–2011) and climate sensitivity on the glaciers of Taylor Valley, Antarctica. J. Glaciol. 2016, 62, 215–229. [Google Scholar] [CrossRef] [Green Version]
  39. Machguth, H.; Paul, F.; Hoelzle, M.; Haeberli, W. Distributed glacier mass-balance modelling as an important component of modern multi-level glacier monitoring. Ann. Glaciol. 2006, 43, 335–343. [Google Scholar] [CrossRef] [Green Version]
  40. Fitzgerald, P.W.; Bamber, J.L.; Ridley, J.K.; Rougier, J.C. Exploration of parametric uncertainty in a surface mass balance model applied to the Greenland ice sheet: Exploration of Parametric Uncertainty. J. Geophys. Res. Earth Surf. 2012, 117. [Google Scholar] [CrossRef]
  41. Bergstrom, A.; Gooseff, M.; Myers, M.; Doran, P.T. The seasonal evolution of albedo across glaciers and the surrounding landscape of the Taylor Valley, Antarctica. Remote Sens. 2019. [Google Scholar] [CrossRef] [Green Version]
  42. Jonsell, U.; Hock, R.; Holmgren, B. Spatial and temporal variations in albedo on Storglaciären, Sweden. J. Glaciol. 2003, 49, 59–68. [Google Scholar] [CrossRef] [Green Version]
  43. Naegeli, K.; Huss, M.; Hoelzle, M. Change detection of bare-ice albedo in the Swiss Alps. Cryosphere 2019, 13, 397–412. [Google Scholar] [CrossRef] [Green Version]
  44. Collier, E.; Maussion, F.; Nicholson, L.I.; Mölg, T.; Immerzeel, W.W.; Bush, A.B.G. Impact of debris cover on glacier ablation and atmosphere-glacier feedbacks in the Karakoram. Cryosphere 2015, 9, 1617–1632. [Google Scholar] [CrossRef] [Green Version]
  45. Ming, J.; Du, Z.; Xiao, C.; Xu, X.; Zhang, D. Darkening of the mid-Himalaya glaciers since 2000 and the potential causes. Environ. Res. Lett. 2012, 7, 014021. [Google Scholar] [CrossRef] [Green Version]
  46. Ming, J.; Xiao, C.; Wang, F.; Li, Z.; Li, Y. Grey Tienshan Urumqi Glacier No.1 and light-absorbing impurities. Environ. Sci. Pollut. Res. 2016, 23, 9549–9558. [Google Scholar] [CrossRef] [Green Version]
  47. Yue, X.; Zhao, J.; Li, Z.; Zhang, M.; Fan, J.; Wang, L.; Wang, P. Spatial and temporal variations of the surface albedo and other factors influencing Urumqi Glacier No. 1 in Tien Shan, China. J. Glaciol. 2017, 63, 899–911. [Google Scholar] [CrossRef] [Green Version]
  48. Naegeli, K.; Huss, M. Sensitivity of mountain glacier mass balance to changes in bare-ice albedo. Ann. Glaciol. 2017, 58, 119–129. [Google Scholar] [CrossRef] [Green Version]
  49. Naegeli, K.; Damm, A.; Huss, M.; Schaepman, M.; Hoelzle, M. Imaging spectroscopy to assess the composition of ice surface materials and their impact on glacier mass balance. Remote Sens. Environ. 2015, 168, 388–402. [Google Scholar] [CrossRef]
  50. Huintjes, E.; Sauter, T.; Schröter, B.; Maussion, F.; Yang, W.; Kropáček, J.; Buchroithner, M.; Scherer, D.; Kang, S.; Schneider, C. Evaluation of a Coupled Snow and Energy Balance Model for Zhadang Glacier, Tibetan Plateau, Using Glaciological Measurements and Time-Lapse Photography. Arct. Antarct. Alp. Res. 2015, 47, 573–590. [Google Scholar] [CrossRef]
  51. Sauter, T.; Arndt, A. COSIPY v1.3. 2020. Available online: https://github.com/cryotools/cosipy (accessed on 17 November 2020).
  52. Consortium, R.G.I. Randolph Glacier Inventory 6.0; Digital Media: Denver, CO, USA, 2017. [Google Scholar] [CrossRef]
  53. Oerlemans, J. Glaciers and Climate Change; Google-Books-ID: OJHXK91Ci1AC; CRC Press: Boca Raton, FL, USA, 2001. [Google Scholar]
  54. Coléou, C.; Lesaffre, B. Irreducible water saturation in snow: Experimental results in a cold laboratory. Ann. Glaciol. 1998, 26, 64–68. [Google Scholar] [CrossRef] [Green Version]
  55. Hantel, M.; Ehrendorfer, M.; Haslinger, A. Climate sensitivity of snow cover duration in Austria. Int. J. Climatol. 2000, 20, 615–640. [Google Scholar] [CrossRef]
  56. Vionnet, V.; Brun, E.; Morin, S.; Boone, A.; Faroux, S.; Le Moigne, P.; Martin, E.; Willemet, J.M. The detailed snowpack scheme Crocus and its implementation in SURFEX v7.2. Geosci. Model Dev. 2012, 5, 773–791. [Google Scholar] [CrossRef] [Green Version]
  57. Huintjes, E. Energy and Mass Balance Modelling for Glaciers on the Tibetan Plateau: Extension, Validation and Application of a Coupled Snow and Energy Balance Model. Ph.D. Thesis, Publikationsserver der RWTH Aachen University, Aachen, Germany, 2014. [Google Scholar]
  58. Hersbach, H.; Bell, B.; Berrisford, P.; Hirahara, S.; Horányi, A.; Muñoz-Sabater, J.; Nicolas, J.; Peubey, C.; Radu, R.; Schepers, D.; et al. The ERA5 global reanalysis. Q. J. R. Meteorol. Soc. 2020, 146, 1999–2049. [Google Scholar] [CrossRef]
  59. Oerlemans, J.; Knap, W.H. A 1 year record of global radiation and albedo in the ablation zone of Morteratschgletscher, Switzerland. J. Glaciol. 1998, 44, 231–238. [Google Scholar] [CrossRef] [Green Version]
  60. Claverie, M.; Vermote, E.F.; Franch, B.; Masek, J.G. Evaluation of the Landsat-5 TM and Landsat-7 ETM+ surface reflectance products. Remote Sens. Environ. 2015, 169, 390–403. [Google Scholar] [CrossRef]
  61. Vermote, E.; Justice, C.; Claverie, M.; Franch, B. Preliminary analysis of the performance of the Landsat 8/OLI land surface reflectance product. Remote Sens. Environ. 2016, 185, 46–56. [Google Scholar] [CrossRef]
  62. USGS. U.S. Geological Survey. Earth Explorer. 2020. Available online: https://earthexplorer.usgs.gov/ (accessed on 17 November 2020).
  63. Fugazza, D.; Senese, A.; Azzoni, R.S.; Maugeri, M.; Maragno, D.; Diolaiuti, G.A. New evidence of glacier darkening in the Ortles-Cevedale group from Landsat observations. Glob. Planet. Chang. 2019, 178, 35–45. [Google Scholar] [CrossRef]
  64. Liang, S. Narrowband to broadband conversions of land surface albedo I Algorithms. Remote Sens. Environ. 2000, 76, 213–238. [Google Scholar] [CrossRef]
  65. Naegeli, K.; Damm, A.; Huss, M.; Wulf, H.; Schaepman, M.; Hoelzle, M. Cross-Comparison of Albedo Products for Glacier Surfaces Derived from Airborne and Satellite (Sentinel-2 and Landsat 8) Optical Data. Remote Sens. 2017, 9, 110. [Google Scholar] [CrossRef] [Green Version]
  66. Knap, W.H.; Reijmer, C.H.; Oerlemans, J. Narrowband to broadband conversion of Landsat TM glacier albedos. Int. J. Remote Sens. 1999, 20, 2091–2110. [Google Scholar] [CrossRef]
  67. Wang, J.; Ye, B.; Cui, Y.; He, X.; Yang, G. Spatial and temporal variations of albedo on nine glaciers in western China from 2000 to 2011: The Variations of Albedo on Nine Glaciers in Western China. Hydrol. Process. 2014, 28, 3454–3465. [Google Scholar] [CrossRef]
  68. Pope, E.L.; Willis, I.C.; Pope, A.; Miles, E.S.; Arnold, N.S.; Rees, W.G. Contrasting snow and ice albedos derived from MODIS, Landsat ETM+ and airborne data from Langjökull, Iceland. Remote Sens. Environ. 2016, 175, 183–195. [Google Scholar] [CrossRef] [Green Version]
  69. Cuffey, K.M.; Paterson, W.S.B. The Physics of Glaciers; Google-Books-ID: Jca2v1u1EKEC; Academic Press: Cambridge, MA, USA, 2010. [Google Scholar]
  70. ECMWF. Copernicus Climate Change Service. 2020. Available online: https://cds.climate.copernicus.eu/cdsapp#!/home (accessed on 17 November 2020).
  71. Stull, R. Practical Meteorology; OCLC: 955055316; Springer: Dordrecht, The Netherlands, 2016. [Google Scholar]
  72. Brock, B.W.; Willis, I.C.; Sharp, M.J. Measurement and parameterization of aerodynamic roughness length variations at Haut Glacier d’Arolla, Switzerland. J. Glaciol. 2006, 52, 281–297. [Google Scholar] [CrossRef] [Green Version]
  73. Jiménez, P.A.; González-Rouco, J.F.; Montávez, J.P.; García-Bustamante, E.; Navarro, J.; Dudhia, J. Analysis of the long-term surface wind variability over complex terrain using a high spatial resolution WRF simulation. Clim. Dyn. 2013, 40, 1643–1656. [Google Scholar] [CrossRef]
  74. Shea, J.; Wagnon, P.; Immerzeel, W.; Biron, R.; Brun, F.; Pellicciotti, F. A comparative high-altitude meteorological analysis from three catchments in the Nepalese Himalaya. Int. J. Water Resour. Dev. 2015, 31, 174–200. [Google Scholar] [CrossRef] [Green Version]
  75. Karger, D.N.; Conrad, O.; Böhner, J.; Kawohl, T.; Kreft, H.; Soria-Auza, R.W.; Zimmermann, N.E.; Linder, H.P.; Kessler, M. Climatologies at high resolution for the earth’s land surface areas. Sci. Data 2017, 4. [Google Scholar] [CrossRef] [PubMed] [Green Version]
  76. Ferreira, M.; Santos, A.; Lucio, P. Short-term forecast of wind speed through mathematical models. Energy Rep. 2019, 5, 1172–1184. [Google Scholar] [CrossRef]
  77. Ramon, J.; Lledó, L.; Torralba, V.; Soret, A.; Doblas-Reyes, F.J. What global reanalysis best represents near-surface winds? Q. J. R. Meteorol. Soc. 2019, 145, 3236–3251. [Google Scholar] [CrossRef] [Green Version]
  78. Jia, Y.; Li, Z.; Jin, S.; Xu, C.; Deng, H.; Zhang, M. Runoff Changes from Urumqi Glacier No. 1 over the Past 60 Years, Eastern Tianshan, Central Asia. Water 2020, 12, 1286. [Google Scholar] [CrossRef]
  79. Wang, P.; Li, Z.; Li, H.; Wang, W.; Yao, H. Comparison of glaciological and geodetic mass balance at Urumqi Glacier No. 1, Tian Shan, Central Asia. Glob. Planet. Chang. 2014, 114, 14–22. [Google Scholar] [CrossRef]
  80. WGMS. Fluctuations of Glaciers Database; World Glacier Monitoring Service (WGMS): Zurich, Switzerland, 2019. [Google Scholar] [CrossRef]
  81. Ostrem, G.; Brugman, M. Glacier Mass-Balance Measurements—A Manual for Field and Office Work; Technical Report 4; Geographisches Institut Universität Zurich: Zurich, Switzerland, 1991. [Google Scholar]
  82. TGS. The Annual Report; Technical Report; Northwest Institute of Eco-Environment and Resources, Chinese Academy of Sciences: Beijing, China, 2018. (In Chinese) [Google Scholar]
  83. Carturan, L.; Cazorzi, F.; De Blasi, F.; Dalla Fontana, G. Air temperature variability over three glaciers in the Ortles–Cevedale (Italian Alps): Effects of glacier fragmentation, comparison of calculation methods, and impacts on mass balance modeling. Cryosphere 2015, 9, 1129–1146. [Google Scholar] [CrossRef] [Green Version]
  84. Petersen, L.; Pellicciotti, F. Spatial and temporal variability of air temperature on a melting glacier: Atmospheric controls, extrapolation methods and their effect on melt modeling, Juncal Norte Glacier, Chile: Temperature Variability over a Glacier. J. Geophys. Res. Atmos. 2011, 116. [Google Scholar] [CrossRef]
  85. Petersen, L.; Pellicciotti, F.; Juszak, I.; Carenzo, M.; Brock, B. Suitability of a constant air temperature lapse rate over an Alpine glacier: Testing the Greuell and Böhm model as an alternative. Ann. Glaciol. 2013, 54, 120–130. [Google Scholar] [CrossRef] [Green Version]
  86. Greuell, W.; Knap, W.H.; Smeets, P.C. Elevational changes in meteorological variables along a midlatitude glacier during summer. J. Geophys. Res. Atmos. 1997, 102, 25941–25954. [Google Scholar] [CrossRef]
  87. Greuell, W.; Böhm, R. 2 m temperatures along melting mid-latitude glaciers, and implications for the sensitivity of the mass balance to variations in temperature. J. Glaciol. 1998, 44, 9–20. [Google Scholar] [CrossRef] [Green Version]
  88. Shea, J.M.; Moore, R.D. Prediction of spatially distributed regional-scale fields of air temperature and vapor pressure over mountain glaciers. J. Geophys. Res. 2010, 115. [Google Scholar] [CrossRef]
  89. Beck, H.E.; Vergopolan, N.; Pan, M.; Levizzani, V.; van Dijk, A.I.J.M.; Weedon, G.P.; Brocca, L.; Pappenberger, F.; Huffman, G.J.; Wood, E.F. Global-scale evaluation of 22 precipitation datasets using gauge observations and hydrological modeling. Hydrol. Earth Syst. Sci. 2017, 21, 6201–6217. [Google Scholar] [CrossRef] [Green Version]
  90. Kim, K.Y.; Kim, J.; Boo, K.O.; Shim, S.; Kim, Y. Intercomparison of precipitation datasets for summer precipitation characteristics over East Asia. Clim. Dyn. 2019, 52, 3005–3022. [Google Scholar] [CrossRef] [Green Version]
  91. Cogley, J.G. Geodetic and direct mass-balance measurements: Comparison and joint analysis. Ann. Glaciol. 2009, 50, 96–100. [Google Scholar] [CrossRef] [Green Version]
  92. Andreassen, L.M.; Elvehøy, H.; Kjøllmoen, B.; Engeset, R.V. Reanalysis of long-term series of glaciological and geodetic mass balance for 10 Norwegian glaciers. Cryosphere 2016, 10, 535–552. [Google Scholar] [CrossRef] [Green Version]
  93. Soruco, A.; Vincent, C.; Francou, B.; Ribstein, P.; Berger, T.; Sicart, J.; Wagnon, P.; Arnaud, Y.; Favier, V.; Lejeune, Y. Mass balance of Glaciar Zongo, Bolivia, between 1956 and 2006, using glaciological, hydrological and geodetic methods. Ann. Glaciol. 2009, 50, 1–8. [Google Scholar] [CrossRef] [Green Version]
  94. Klok, E.J.; Greuell, W.; Oerlemans, J. Temporal and spatial variation of the surface albedo of Morteratschgletscher, Switzerland, as derived from 12 Landsat images. J. Glaciol. 2003, 49, 491–502. [Google Scholar] [CrossRef] [Green Version]
  95. Arnold, N.S.; Rees, W.G.; Hodson, A.J.; Kohler, J. Topographic controls on the surface energy balance of a high Arctic valley glacier. J. Geophys. Res. 2006, 111. [Google Scholar] [CrossRef]
  96. Azzoni, R.S.; Senese, A.; Zerboni, A.; Maugeri, M.; Smiraglia, C.; Diolaiuti, G.A. Estimating ice albedo from fine debris cover quantified by a semi-automatic method: The case study of Forni Glacier, Italian Alps. Cryosphere 2016, 10, 665–679. [Google Scholar] [CrossRef] [Green Version]
  97. Jepsen, S.M.; Adams, E.E.; Priscu, J.C. Sediment Melt-Migration Dynamics in Perennial Antarctic Lake Ice. Arct. Antarct. Alp. Res. 2010, 42, 57–66. [Google Scholar] [CrossRef]
  98. Greuell, W. Melt-water accumulation on the surface of the greenland ice sheet: Effect on albedo and mass balance. Geogr. Ann. Ser. A Phys. Geogr. 2000, 82, 489–498. [Google Scholar] [CrossRef]
  99. Paul, F.; Machguth, H.; Kääb, A. On the impact of glacier albedo under conditions of extreme glacier melt: The summer of 2003 in the ALPS. EARSeL eProc. 2005, 4, 139–149. [Google Scholar]
  100. Oerlemans, J. The Microclimate of Valley Glaciers. In Igitur, Utrecht Publishing & Archiving Services; Archiving Services; Universiteitsbibliotheek Utrecht: Utrecht, The Netherlands, 2010; p. 138. [Google Scholar]
  101. Fugazza, D.; Senese, A.; Azzoni, R.S.; Maugeri, M.; Diolaiuti, G.A. Spatial distribution of surface albedo at the Forni Glacier (Stelvio National Park, Central Italian Alps). Cold Reg. Sci. Technol. 2016, 125, 128–137. [Google Scholar] [CrossRef]
  102. Nolin, A.W.; Phillippe, J.; Jefferson, A.; Lewis, S.L. Present-day and future contributions of glacier runoff to summertime flows in a Pacific Northwest watershed: Implications for water resources: Late Summer Glacier Runoff in a Pacific NW Watershed. Water Resour. Res. 2010, 46. [Google Scholar] [CrossRef]
  103. Frenierre, J.L.; Mark, B.G. A review of methods for estimating the contribution of glacial meltwater to total watershed discharge. Prog. Phys. Geogr. Earth Environ. 2014, 38, 173–200. [Google Scholar] [CrossRef]
Figure 1. Study area and measurement locations. The colors within the inset maps represent altitude.
Water 12 03297 g001
Figure 2. Bare-ice albedo map derived from Landsat satellite images after topography correction and adjustment to an overall average albedo of 0.3 .
Water 12 03297 g002
Figure 3. Comparison between measured (orange), raw ERA5 (green) and downscaled ERA5 (blue) input variables air temperature, relative humidity, wind speed and air pressure (from top to bottom). The time series graphs in the left column show daily averages for better visibility of intraannual patterns. The scatter plots show hourly values. Scatterplots in the first column are between measurements and raw ERA5, in the second column between measurements and downscaled ERA5. Rug plots within the scatter plots show the 1D marginal distributions.
Water 12 03297 g003
Figure 4. Spatial distribution of the modeled (grid) and observed (circles) annual mean surface mass balance for the period 2000–2014.
Water 12 03297 g004
Figure 5. Differences in modeled and measured mean annual surface mass balance (COSIPY − Measured) for the study period 2000–2014.
Water 12 03297 g005
Figure 6. Cumulative surface mass balance at stake locations over time.
Water 12 03297 g006
Figure 7. Mean daily surface mass balance per stake per year. Comparison between measurements and COSIPY is shown for the Landsat albedo parameterization in plot (a) and for a fixed albedo of 0.3 in plot (b).
Water 12 03297 g007
Figure 8. Comparison of glacier-wide annual surface mass balance as modeled by COSIPY and as derived from the WGMS database.
Water 12 03297 g008
Figure 9. Eight example (ah) images (Beijing time) of the east branch of Urumqi Glacier No. 1 captured by a fixed camera system. Attached to the right of the images is the COSIPY simulated snow cover for the same point in time. Snow-covered (snow depth > 0.1 cm) pixels are marked in blue and snow-free pixels in red. Since the camera is facing south, the corresponding simulation output has been rotated by 180°.
Water 12 03297 g009
Figure 10. Seven-day moving average of modeled and measured discharge during 2011–2018.
Water 12 03297 g010
Figure 11. Comparison between the three different compounds representing the discharge regime. Upper barplots show absolute values of the single components, barplots in the lower panel show the differences between the measurements and the respective other compound. This plot includes only days on which measurements are available, except for the WGMS mass balance (no value available in 2018), which only is available as a single annual value.
Water 12 03297 g011
Figure 12. Analogous to Figure 11 but including all days of the year for all variables except the measured discharge, which is only available during summer.
Water 12 03297 g012
Table 1. Data sets employed in this study.
Data SetPeriodTime StepFunction/Purpose
Digital elevation model (SRTM)-staticModeling
Glacier outline (RGI 6.0)2007staticModeling
ERA52000–2020hourlyModel forcing
AWSApril 2018–May 2019hourlyDownscaling
Landsat 72 September 2012-Albedo parameterization
Landsat 75 September 2013-Albedo parameterization
Landsat 727 July 2016-Albedo parameterization
Landsat 84 August 2016-Albedo parameterization
Landsat 813 August 2019-Albedo parameterization
Ablation stakesAugust 2000–September 2014 (2016)monthly, in summerModel validation
Time-lapse photography1 July 2018–29 December 20181–2 per dayModel validation
Discharge measurements2011–2018daily, in summerModel validation
Table 2. ERA5 reanalysis data [58] derived COSIPY input variables.
VariableDescriptionUnit
P R E S Surface pressurehPa
T 2 Air temperatureK
R H 2 Relative humidity%
GIncoming solar radiationW m 2
U 2 Wind speedm s 1
R R R Total precipitationmm
NCloud cover fraction
Table 3. COSIPY driving variables and applied approaches for downscaling and spatial distribution.
VariableDownscaling Approach
ERA5 Data to AWS
Spatial Integration Approach from
AWS to Distributed Fields on Glacier
Air pressure P R E S Barometric formulaBarometric formula
Air temperature T 2 Quantile mappingLapse rate Γ T
Cloud cover fraction N--
Incoming shortwave radiation S W i n -Radiation modeling [30]
Relative humidity R H 2 Quantile mapping-
Total precipitation R R R --
Wind speed U 2 Logarithmic wind profile, Scaling factor of 2-
Table 4. Statistical measures between AWS and raw ERA5 data and AWS and downscaled ERA5 data. Explained variance R2 is provided only for the downscaled data since the downscaling procedures applied in this study have no major impact on explained variance while MBE and RMSE are improved considerably.
RawDownscaled
VariableRMSEMBERMSEMBER2
T 2 5.15 1.14 2.73 0.004 0.9
T 2 (day) 4.35 1.17 1.88 0.02 0.95
R H 2 24.87 11.81 24.04 0.05 0.26
R H 2 (day) 19.22 11.67 15.42 0.12 0.42
U 2 2.06 1.58 1.65 0.67 0.07
U 2 (day) 1.77 1.58 1.12 0.66 0.13
P R E S 51.89 51.86 2.11 1.87 0.97
P R E S (day) 51.88 51.86 1.99 1.86 0.99
Publisher’s Note: MDPI stays neutral with regard to jurisdictional claims in published maps and institutional affiliations.

