Article

Tracing Real-Time Transnational Hydrologic Sensitivity and Crop Irrigation in the Upper Rhine Area over the Exceptional Drought Episode 2018–2020 Using Open Source Sentinel-2 Data

1
Physical Geography, Institute of Environmental Social Science and Geography, Faculty of Environment and Natural Resources, University of Freiburg, Germany; Schreiberstr., 20, 79085 Freiburg, Germany
2
Department of Archaeology and Museology, Faculty of Arts, Masaryk University, Arne Nováka 1, 60200 Brno, Czech Republic
*
Author to whom correspondence should be addressed.
Water 2020, 12(12), 3298; https://doi.org/10.3390/w12123298
Submission received: 21 October 2020 / Revised: 16 November 2020 / Accepted: 23 November 2020 / Published: 24 November 2020
(This article belongs to the Section Water Resources Management, Policy and Governance)

Abstract

:
Climate and regional land-use and landcover change (LUCC) impact the ecosystem of the Upper Rhine Area (URA) and transform large parts of the landscape into strongly irrigated agricultural cropland. The increase of long-term drought periods and the trend towards low summer precipitation totals trigger an increase in groundwater scarcity and amplify the negative effects of extensive irrigation purposes and freshwater consumption in a hydrologically sensitive region in Central Europe. This article presents qualitative transnational open source remote sensing temporal series of vegetation indices (NDVI) and groundwater level development to tracing near real-time vegetation change and socio-ecological feedbacks during periods of climate extremes in the Upper Rhine Area (2018–2020). Increased freshwater consumption caused a dramatic drop in groundwater availability, which eventually led to a strong degradation of the vegetation canopy and caused governmental regulations in July 2020. Assessing vegetation growth behavior and linking groundwater reactions in the URA through open source satellite data contributes to a rapidly accessible understanding of the ecosystem’s feedbacks on the local to the transnational scale and further enables risk management and eco-political regulations in current and future decision-making processes.

1. Introduction

Land-use and Land Cover change (LUCC) impact the earth’s surface in manifold social, spatial, and temporal perspectives [1,2,3,4]. There are various factors, constraints, and interrelations of a degrading environment related to LUCC activities like rising urbanization, forest degradation, loss of wetlands, agricultural intensification, desertification, irrigation, and climatic change, often summarized as global change. The UN sustainable development Goal 15 addresses this explicitly (https://sdgs.un.org/goals/goal15, last accessed 3 August 2020). The European SOER Report (https://www.eea.europa.eu/publications/soer-2020 (2015), last accessed 3 August 2020) further states that LUCC and intensification threaten soil and water ecosystem services and drive biodiversity losses. In this context, the European Water Framework Directive (2000) and the Groundwater Directive (2006) introduced a holistic approach towards international regulations (https://ec.europa.eu/environment/water/water-framework/index_en.html, last accessed 8 August 2020). Concepts like Land Degradation Neutrality are strongly related to this (https://www.unccd.int/actions/achieving-land-degradation-neutrality, last accessed 3 August 2020). Within the spatial and temporal dimensions of LUCC, the driving factors impact on a broad variety of scales between the global, supranational, and national scale. The latter can be distinguished between region, landscape, and the unit of production [5]. Landscapes are regarded as a spatial meso-scale feature, triggered by specific social and environmental drivers like irrigation, erosion, and sedimentation processes [6,7].
However, the different social and biophysical factors not only affect the visibly perceived parts of the landscape but also the ecosystem susceptibility to long-term droughts or rapid flooding events, which are particularly controlled by the local and regional aquifer conditions, supraregional precipitation patterns, the hydrogeological system, and the water management—in particular local groundwater outtake for crop irrigation and fresh water consumption [8,9,10]. Local and regional ecosystem overstraining through intensified agricultural land-use and particularly growing surface demand for modern livestock-based food production and biofuel extraction [11], account for large-scale ecological feedbacks, stressors, and collapse in the environmental response cycle. In this context, vegetation growth behavior and climate are closely connected to each other through climate-controlled horizontal and vertical zonal vegetation boundaries and surface reflection characteristics of vegetation-covered and bare areas [12]. This system is furthermore influenced by various components controlling the functional ecosystem connectivity, such as groundwater level, faunal and floral composition, habitat permeability, accessibility, availability, and individual configuration of the landscape by the prevalent organism’s movement patterns [13,14,15].
Assessing the impact of anthropogenic fresh-water consumption on the various scales of ecosystem connectivity is among the most crucial tasks in current ecological research. For this reason, a broad number of supraregional landcover monitoring and observation techniques have been developed during the past decades that allow for surface change monitoring on large spatio-temporal scales [16,17]. Among others, vegetation indices and reflection characteristics analyses have proven to be useful and cost-effective methods to evaluate large areas through open source remote sensing techniques, digital modelling, and spatial statistics [18,19,20]. Rapid access to open-source data and satellite imagery furthermore enhances the applicability of near real-time surface observations and thus represents an additional contribution to sociocultural and demographic research and the understanding of ecosystem response behavior.
A particular emphasis is put on the application of open source data such as satellite imagery and groundwater fluctuations, which can be downloaded free of charge and further manipulated with free remote sensing or statistic software. The approach presented in this article enables the almost real-time tracking of extreme events in comparison to medium- or short-term temporal series and further allows assessing surface change and ecological transformation with medium resolution scientific data and under consideration of socio-ecological assessments [21,22,23,24,25]. The reflectance, which can be extracted from Sentinel-2 data and the qualitatively accessed vegetation indices confirm the severity of the human impact in hydrologically sensitive areas in Central Europe and represents an additional research potential to the monitoring of large areas over significant temporal sequences [26,27,28,29,30,31].
This paper presents the linkages between LUCC, irrigation strategies, and monoculture crop cultivation and their interrelations with hydrological sensitivity under climate extremes in the transnational context of the Upper Rhine river system (Figure 1) using digital surface data, Landsat and Sentinel-2 imagery, and environmental attributes such as regional groundwater fluctuations, precipitation measures, land-use, and agricultural datasets. To demonstrate the strong interrelations of local anthropogenic overprints and regional impact on the short-term scale, a case study is presented that highlights the strong hydrological system change on both sides of the river Rhine and furthermore reveals significant transnational differences in irrigation activity during the recent exceptional drought periods and phases of extreme temperature in 2018–2020 [32,33].

2. Material and Methods

Environmental analyses and diachronic system models in the Upper Rhine Area (URA) have experienced increased scientific attention within the past years, mostly because of the high climate and surface change vulnerability of the region [34,35,36,37,38,39,40,41,42,43,44]. Manifold research has been carried out, which focuses on hydrologic or groundwater discharge and flow connectivity [45], plant species vulnerability [10], landcover change and land-use development [34,39,40,46,47], soil erosion [48], climate variability [33,49,50], and chain effects of different climatic stressors [8,51,52,53]. In a coupled ecological system, however, a broad variety of spatio-temporal components form the functional ecosystem connectivity, which includes not only historical and current landscape development but also different environmental and human response cycles, decision-making, perception, and affordances [13,14,54,55,56,57].

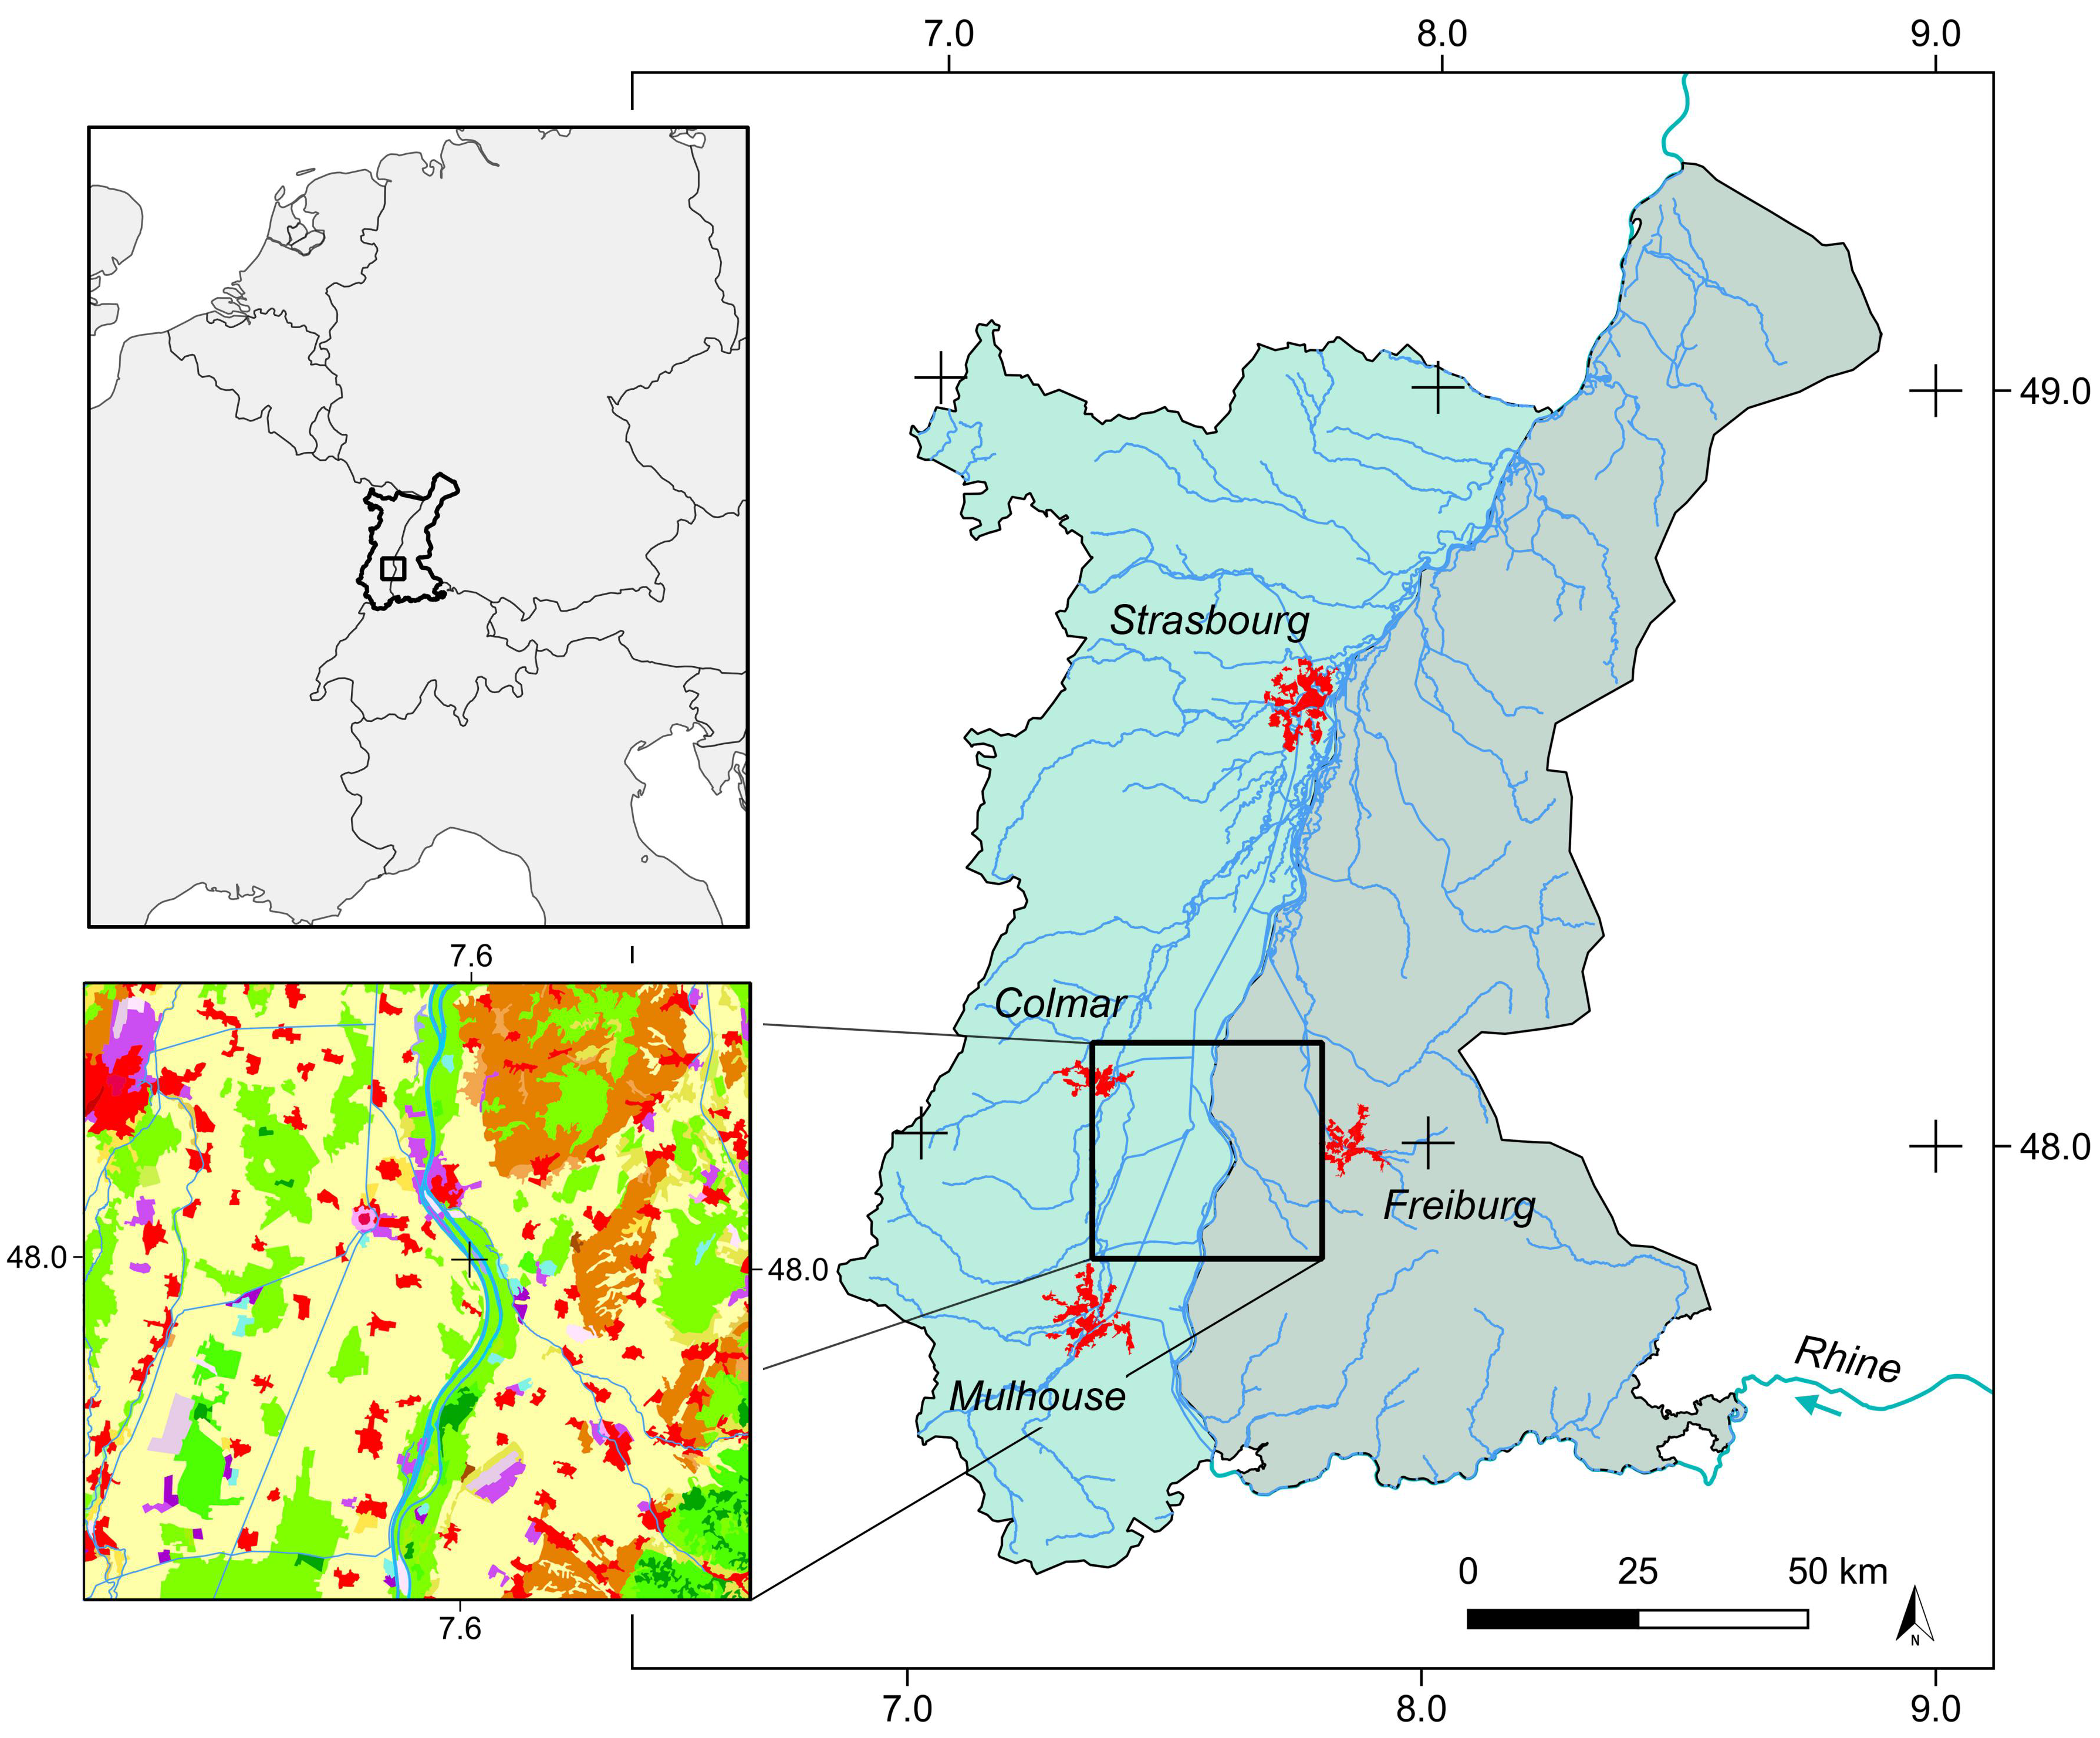
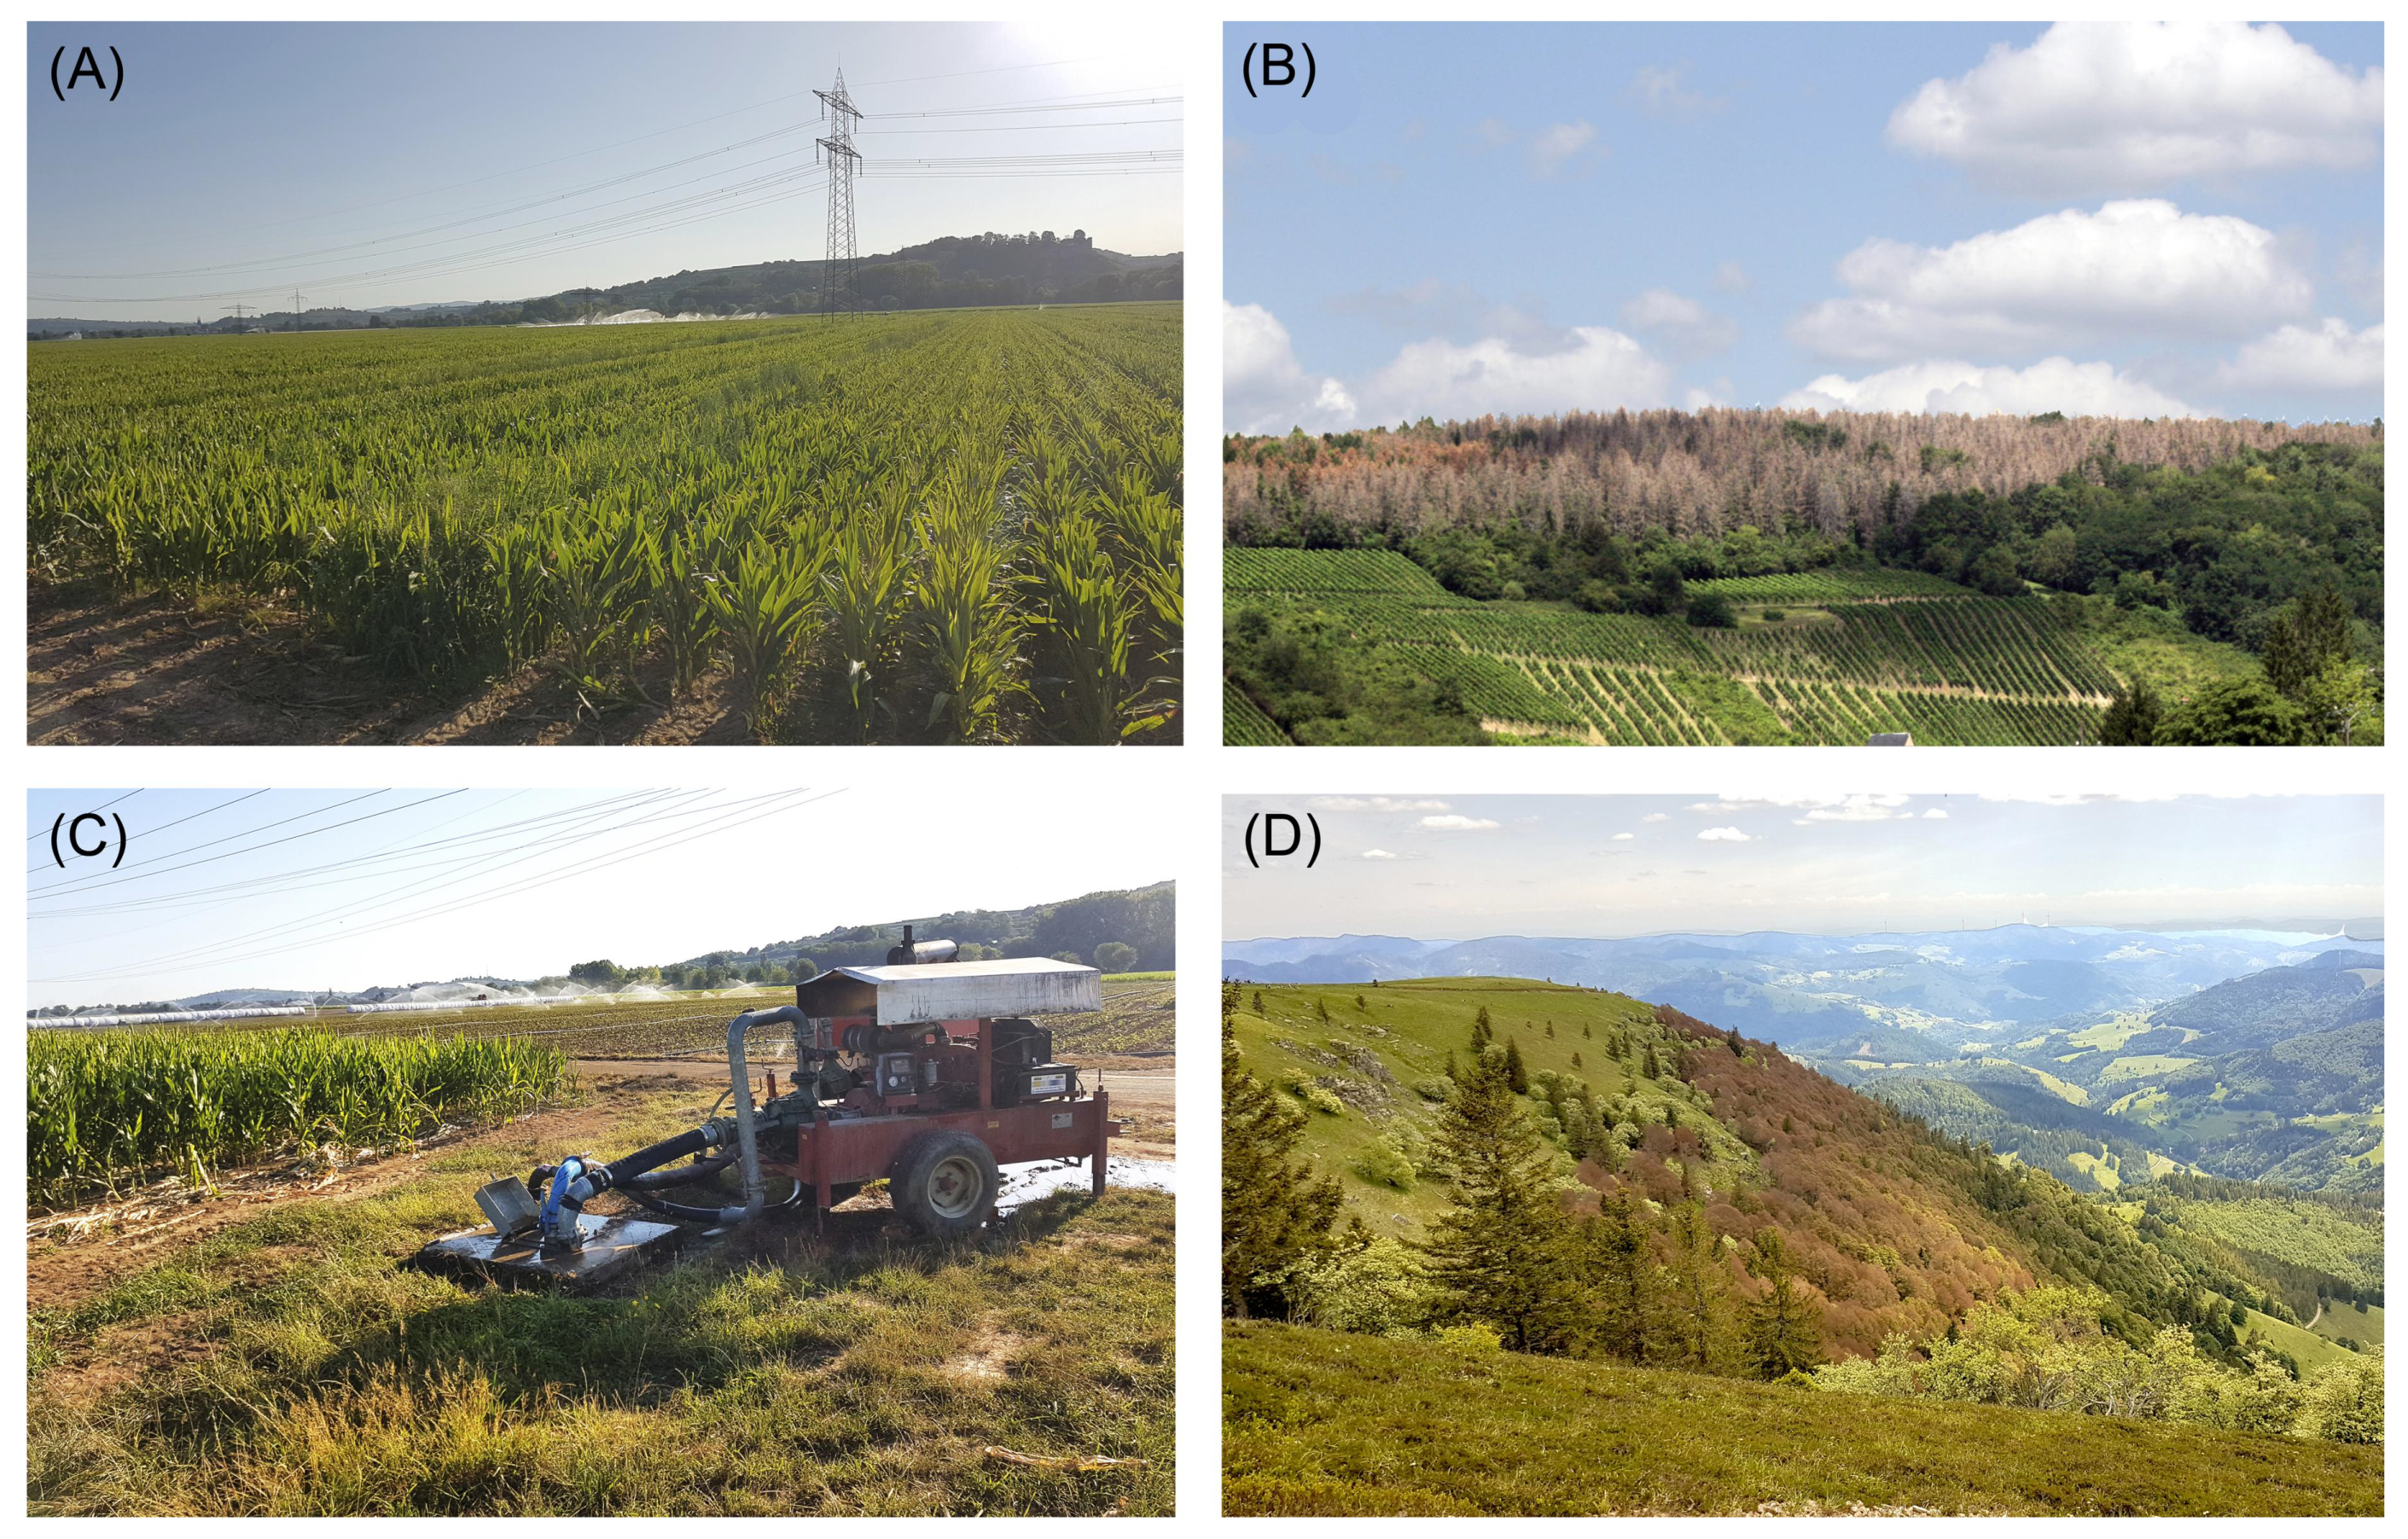
2.1. Environmental Settings and Landscape History

The study area allows for a rapidly accessible and qualitative transnational analysis to evaluate the interconnection between increased groundwater outtake for irrigation purposes and severely intensified agricultural utilization, which have altered the ecological configuration during the past decades. Considering global and regional climate change and the massive increase of severe summer droughts and heat waves in the past years, the strong ecological pressure has led to a dramatic drop in the groundwater table during summer 2020, which eventually has caused the intervention of the regional governmental administration in the Grand Est (Alsace, eastern France). The regulations of water withdrawal from the regional Rhenish aquifer in July 2020 thus marked an important step towards the public understanding of political, ecological, and socio-economic need to transformation in a future eco-political decision-making process [58,59,60].
The research area covers a cross-border section of the URA in south-western Germany (parts of the state Baden-Württemberg (afterwards referred to as BaWue) and eastern France (parts of the Region Grand Est, formerly Region Alsace, Départment Haut-Rhin (68) and Départment Bas-Rhin (67)), stretching from north of Mulhouse to the north of Colmar and the west of Freiburg (Figure 1). The URA is characterized by mild winters, long phenological phases, and the particular topographic location of the Upper Rhine Graben fault between the Vosges mountain range and the Black Forest, which supports decreased precipitation patterns and a high drought and flooding vulnerability in the lowlands of the river Rhine floodplain, which is mostly built of porous aquifer [24,34,61,62,63,64,65]. The alluvial lowlands are formed by Pleistocene and Holocene fluvial terraces that emerged from large-scale avulsion events of the primarily anastomosing channel system [66,67,68]. During glacial stadial, the area became broadly loess-covered, which locally triggered soil development and eventually led to the mid- to late Holocene loess soil composition on elevated Mesozoic plateaus and outcrops with widespread Cambisols and Luvisols that enable nowadays intensified agricultural utilization, while Gleysols are common in the wetter areas and Alluvisols in the large alluvial floodplains. Large parts of the lowlands and the floodplain, however, are characterized by Quaternary fluvial sediments with high porosity and consequently a low water storage capacity [69,70,71]. A combination of a high aquifer, periodically increased meltwater discharge, local groundwater level anomalies and heavy precipitation events can lead to rapid waterlogging of the poorly drained soils, which causes extensive and persistent flooding [24,41,42,43,47,72]. In contrast to the lowlands, the mountainous areas of the Vosges Mountains and the Black Forest are characterized by periglacial top layers, mostly covered with Cambisols and Podzols.
Agricultural exploitation and livestock breeding in the URA can be traced back to the Early Neolithic period of the area; however, there has been considerable landscape development and human-environmental interaction since prehistoric periods [39,73,74,75,76,77]. Prehistoric and historical land-use is an important component towards understanding the sediment flux in the URA. Pre-Iron Age land-use and deforestation processes caused significant surface erosion. However, most of the sediment load was locally trapped in colluvial deposits along the upstream hillslopes. Since the Iron Age, increased alluvial and colluvial deposits have been recognized (probably also due to climatic oscillation and general more humid conditions) and from the Roman period onward, a strong increase in suspended material deposition occurred [78,79,80,81]. Massive deforestation to gain charcoal for iron smelting caused a sharp decrease in fagus and quercus densities at least since the High Middle Ages, thus transforming forest composition, soil organic matter, and nutrient content [43,82,83,84]. Decreased vegetation density, soil composition modifications, and the greater availability of transportable material triggered erosion processes, sediment transport, and a dramatic increase of fine-grained material in fluvial flow regimes [48]. Wash load and sedimentation budget strongly affected the soil development. The fine-grained silty and clayey deposition along the river L’Ill and the several tributaries of the river Rhine floodplain are prone to waterlogged conditions in locales with high groundwater levels. In Addition, in the 19th century, the floodplain forests almost completely disappeared during the canalization of the river Rhine, which caused considerable groundwater lowering and increased erosion downstream of Basel [10,85]. Since the end of the 18th century, however, there has been a trend towards strong local reforestation processes as an expression of socio-ecological transformation.
Climate change and drought risk is not only limited to the lowlands of the URA but also affects large parts of the forest-covered Graben flanks and the higher mid-altitude mountain ranges. In this context, severe long-term drought periods as experienced during the 19th century AD [86] and in 2018 and 2019 will enhance the hydrological pressure on the ecosystem—not only in summer but also during the early spring growing period. Extensive irrigation in the Alsatian part of the URA will further amplify the water shortages in summer and fall and contribute severely to a dramatic drop in ground-water availability downstream in the lower Rhine basin (Figure 2).

2.2. Regional Governance and Irrigation Control 2020

After its introduction in the 15th and during the 16th century AD, maize variations spread rapidly across Europe and intensified again during the past decades due to the development of hybrid varieties, which are adapted to the climatic conditions in combination with strong increase in grain and silage yields for biofuel [87,88,89,90]. Locally, over 50% of the agricultural crop production in the URA is based on non-food maize cultivation, which consumes over most of the freshwater that is withdrawn for irrigation [91,92,93]. This development has not only triggered ecological consequences but eventually led to administrative regulations—at least in the Alsace where the impact of massive groundwater withdrawal finally entered the political stage. On 23 July 2020, the French administrative council of the region Grand Est announced a decree regarding groundwater scarcity in the URA http://www.bas-rhin.gouv.fr/Actualites/Environnement/Secheresse-le-Bas-Rhin-passe-en-etat-d-alerte, last accessed 25 July 2020). The governmental directives required to regulate water consumption in public, industrial, and agricultural domains, and to avoid all non-essential water consumption such as washing vehicles, buildings, and equipment not in contact with foodstuffs. Concerning water extraction from rivers and streams, the number of simultaneously operating pumps and the instantaneous flow rates of the pumps per section must be reduced. It further states a 30% reduction of groundwater extraction along the major river course of the river L’Ill-Rhine water basin (Agreste—Direction régionale de l’alimentation, de l’agriculture, 2019). These regulations became operative because the groundwater table showed dramatically dropping during summer 2020—despite frequent precipitation events during early July. This is strongly connected to spring temperature and precipitation anomalies in the URA [94]. The years 2018 and 2019 demonstrated strong temperature anomalies and severe long-term hot drought periods in summer [32]. The average precipitation in July 2018 in the Alsace hardly reached 35 mm and locally only 10–11 mm precipitation per month could have been detected. The long-term 30-year average for July (1970–2000) in the URA shows 149 mm (data processed from worldclim.org; last accessed 26 July 2020; data resolution 1 km, clipped to the study area URA), which proves the precipitation anomaly in 2018. In 2019, however, the average July rainfall in the URG locally reaches 150 mm in the region around Obernai and Strasbourg, partly caused by increased maximum daily precipitation events up to 60 mm a day, which also led to a delayed harvest by a month in the Alsatian part of the study area (Agreste—Direction régionale de l’alimentation, de l’agriculture, 2019). However, around the case study area, which is centered 50 km south of Obernai, the climate data does not confirm the high average precipitation numbers for July 2019. Furthermore, the average values for June 2019 show significantly lower values, which would have impacted plant growth behavior during the first third of July. The cloud-free Sentinel-2 image, which was chosen for optical analysis can thus show a delayed reaction to early summer rainfall anomalies and hence artificial irrigation activity during June and early July 2019.
To test the results of the decree and to evaluate the differences in crop physical condition in 2020, NDVI values from 19 July 2018, 09 July 2019, and 23 July 2020 were compared and analyzed for their spatial differentiation. The Sentinel-2 satellite imagery includes the following cloud-free scenes, which were acquired from the Copernicus Open Access Hub: S2B_MSIL2A_20180719T103019_ N0208_R108_T32ULU//S2A_MSIL2A_20190709T103031_N0213_R108_T32ULU//S2A_MSIL2A_20200723T103031_N0214_R108_T32ULU. To evaluate the short-term time series of three consequent years (2018–2020), a comparison time series was created, which is based on Landsat-7 and Landsat-OLI-8 imagery with a spectral resolution of 30 m in the visible and the infrared range (see Table 1). Landsat-7 imagery has been downloaded from the USGS (United States Geological Survey) for the period 2000–2013. Due to an irreversible mechanical failure of the SLC (Scan Line Corrector) in May 2003, the Landsat-7 imagery shows data gaps and striping effects from 2003 onwards. For the period 2013–2020, Landsat-8 data was downloaded from the USGS server. The comparison dataset was extracted from images spanning July and—in case of extreme cloud coverage—the first two weeks of August 2000–2020. Eventually, a random point distribution was created that covers forest stands, cropland in the Alsace, and cropland in BaWue (Figure 3). From the calculated NDVI raster, the NDVI values of each consequent year were added to the point datasets to enable the comparison of the long-term NDVI variation in relation to the period of extreme high summer temperature and low precipitation totals in July 2018–2020 despite the SLC failure of the Landsat-7 mission.
All scenes were equally processed using R software and QGIS. The time series of three consequent years allows to rapidly access landcover change and anthropogenic landscape modifications on the regional scale, which were triggered by spatially extensive irrigation activity—particularly in the Alsace.

2.3. Groundwater Height and River Rhine Water Level

Groundwater heights were plotted for the period 1 January 1995–31 July 2020 based on daily measurements from two piezometer stations in the Alsace at Holtzwihr (Lat 48.116138; Lon 7.419136; soil surface 182.70 m a.s.l.; average groundwater value 181.44 m a.s.l. (1955–2020); groundwater minimum value 180.72 m a.s.l. (13 July 1976)) and Hettenschlag (Lat 48.005469; Lon 7.456955; soil surface 197.51 m a.s.l.; average groundwater value 192.28 m a.s.l. (1955–2020); groundwater minimum value 190.74 (13 July 1976) m a.s.l.; data processed from Aprona; www.aprona.net; last accessed 2 August 2020). Only these two stations offered continuous data during summer 2020 at the time of performing the analyses. For the German part of the study area, six stations offered continuous data until 31 July 2020. The datasets were made available by Karin Burk and Michel Wingering from the LUBW (Landesanstalt für Umwelt Baden-Württemberg, Ref. 42, Karlsruhe). The station at Bad Krozingen (Lat 47.926868, Lon 7.670603; 0130/070-4, GWM1455 Bad Krozingen—Schlatt 2; soil surface 209 m a.s.l., average groundwater level 200.61 m a.s.l. (1987–2020)) served as long-term reference measurement station to evaluate recent groundwater changes and the trends of the periods 1995–2020 and 1 January 2018–31 July 2020. Parts of the data can be accessed via the LUBW (Landesamt für Umwelt Baden Württemberg (https://guq.lubw.baden-wuerttemberg.de/GuQWeb.dll/p79579.html?BerichtsMonat=202007&Mst=01300704#01300704, last accessed 7 August 2020)). The exceptional drought period from 2018–31 July 2020 was tracked in the groundwater levels of the stations at Bremgarten (GWM138020), Bremgarten (GWM3543), Merdingen (GWM1241), Oberrimsingen (GWM3225) and Breisach (GWM3544). The values were plotted with a locally estimated scatterplot smoother (LOESS) using R software [95]. Smoothing parameters were set to 0.15, 0.3, and 1 to demonstrate trends in annual and decadal groundwater oscillations. Precipitation patterns in the study area were evaluated using data from the DWD (Deutscher Wetterdienst, https://opendata.dwd.de/, last accessed 3 August 2020), Des Clics Nomades (https://www.historique-meteo.net/, last accessed 3 August 2020), and worldclim.org (last accessed 3 August 2020) [96]. In particular, the dramatic drop of groundwater height is the result of long-term intensive and continuous water withdrawal, which constantly lowered the aquifer and depleted the water storage capacities and the hydrologic system-internal buffers. Consequently, the resilience of the system collapsed rapidly during summer 2020.

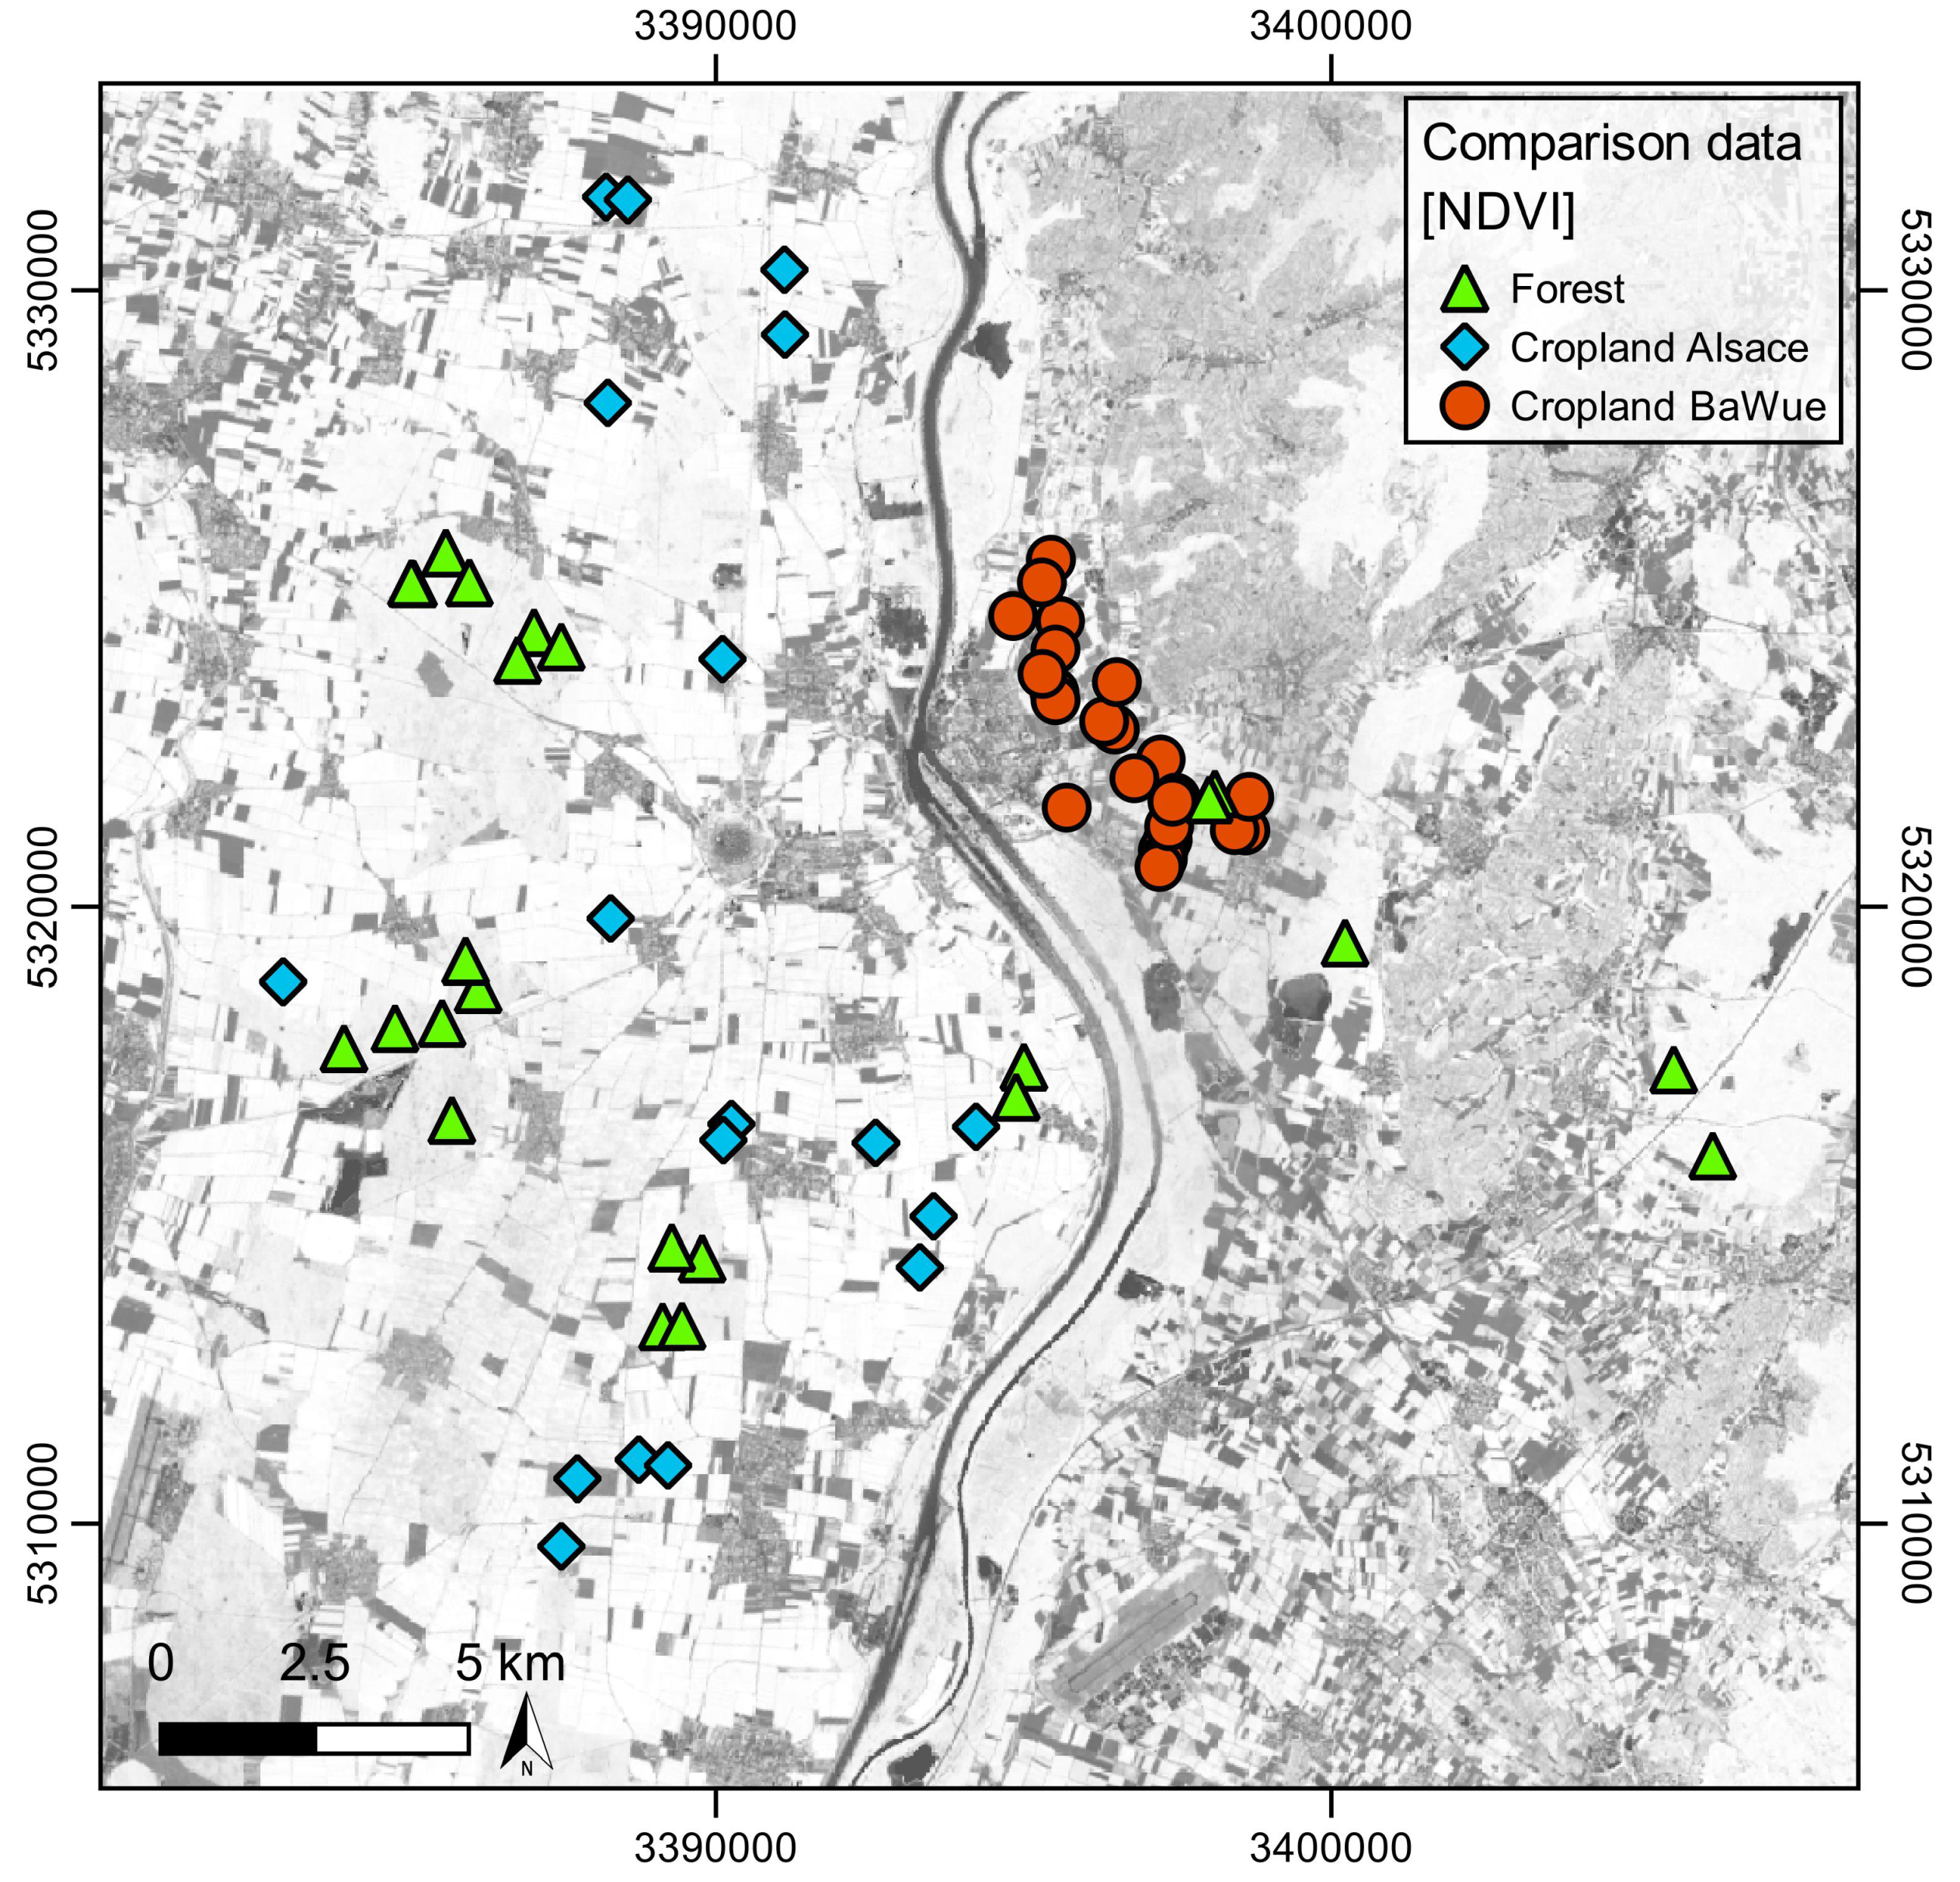
2.4. Spatial Modelling Techniques and Quantitative Statistics

A broad variety of spectral vegetation indices have been developed over the years that demonstrated their applicability in regional landcover observations and vegetation canopy monitoring [21,26,97,98,99,100]. Particularly open source Sentinel-2 hyperspectral imagery have proven to be useful tools to enable large-scale crop monitoring over long time periods and in near real-time [97,101,102,103]. In combination with open-source remote sensing software (SNAP, ESA toolbox; multispec, Purdue Research Foundation), Geographic Information Systems (QGIS, GRASS GIS), and a statistical computing environment (R software; R is a language and environment for statistical computing and graphics; https://www.r-project.org/about.html), a large number of digital image processing and spatial modelling can be integrated into environmental analyses. A common method to evaluate surface development and vegetation canopy is the calculation of vegetation indices such as the Normalized Difference Vegetation Index (NDVI), which is a combination of the surface reflectance band values of red and near infrared radiation (NDVI = NIR-Red/NIR+Red) [104]. High NDVI values indicate photosynthetically active vegetation [105]. However, as pointed out by Huete (1988), there is a potential bias by soil brightness variations and incomplete vegetation coverage [100].
For the case study, Sentinel-2 hyperspectral satellite imagery were downloaded from the Copernicus hub (https://scihub.copernicus.eu/dhus/#/home; last accessed 02 August 2020) and processed in a GIS (spatial and cartographic processing was performed in the stable versions of QGIS 2.1.8/3.4.15 and GRASS 7.4.0/7.8.2), R software, and in a multispectral software (Multispec©, Purdue Research Foundation) to change the image file format to single channel grayscale images (.tiff). Further spectral modifications, statistical evaluation, and plotting have been performed using R software. The images have been clipped to the spatial extent of the desired case study area. Both parts have undergone equal calculations and statistical procedures including NDVI value extraction, thresholding, and maximum value calculation and plotting (see Figure 4, Figure 5, Figure 6 and Figure 7). The composite was then clipped with the 2018 CLC dataset to distinguish non irrigated arable land surfaces, which extract forest-covered areas and parts of the artificial built-up from the data (Figure 5). The maximum values of the NDVI spatial distribution were distinguished from an unsupervised classification of the data spectra using 25 classes from −0.25 to 1 (see Figure 4, Figure 6, and Figure 7). Peak NDVI values were determined as 0.85–0.95 and plotted against the total agriculturally utilized areas of both parts of the study area to compare the differences in the ratio. The NDVI time series evaluation was performed from the NDVI value ranges spanning -1 to 1 to visualize the increase in extremely low values.
In a second step, all artificial built-up (residential and industrial areas), roads, railway tracks, and watercourses and water surfaces were merged in a single layer and buffered with the fixed distance buffer function in QGIS (r = 14.14). The buffer has been chosen to overcome the differences in spatial resolution between the vector data and the 10 m resolution of the Sentinel-2 images and represents the maximum distance from a line touching a 10 × 10 m pixel at one corner. That minimizes NDVI value falsification by roads, paths, and rivers, which show very low value ranges due to non-vegetation reflectance characteristics. Finally, the artificial surfaces were removed from the NDVI data.

3. Results and Discussion

Spatio-temporal variability in crop production in the URA was monitored through time series evaluation of different Sentinel-2 hyperspectral imagery and NDVI calculations of photosynthetically active vegetation canopy. The calculation and the statistics allowed to distinguish massively irrigated crop cultivation from less irrigated and non-irrigated agriculture plant compositions in a transnational section of the URA using a 20-year comparison dataset of Landsat-7 and Landsat-8 images and CLC data. The impact of modern global and regional climate change and the dramatic increase in persistent summer drought periods have strongly altered the ecological balances of the study area. Severe groundwater withdrawal for irrigation purposes of monoculture maize plantations led to a dramatic drop of groundwater level and eventually to governmental restrictions of water consumption in the private, agricultural, and industrial sector during summer 2020 (Agreste—Direction régionale de l’alimentation, de l’agriculture, 2019). The following results contribute to the discussion about ecological and political management of one of the most intensely utilized hydrologic systems in Europe.

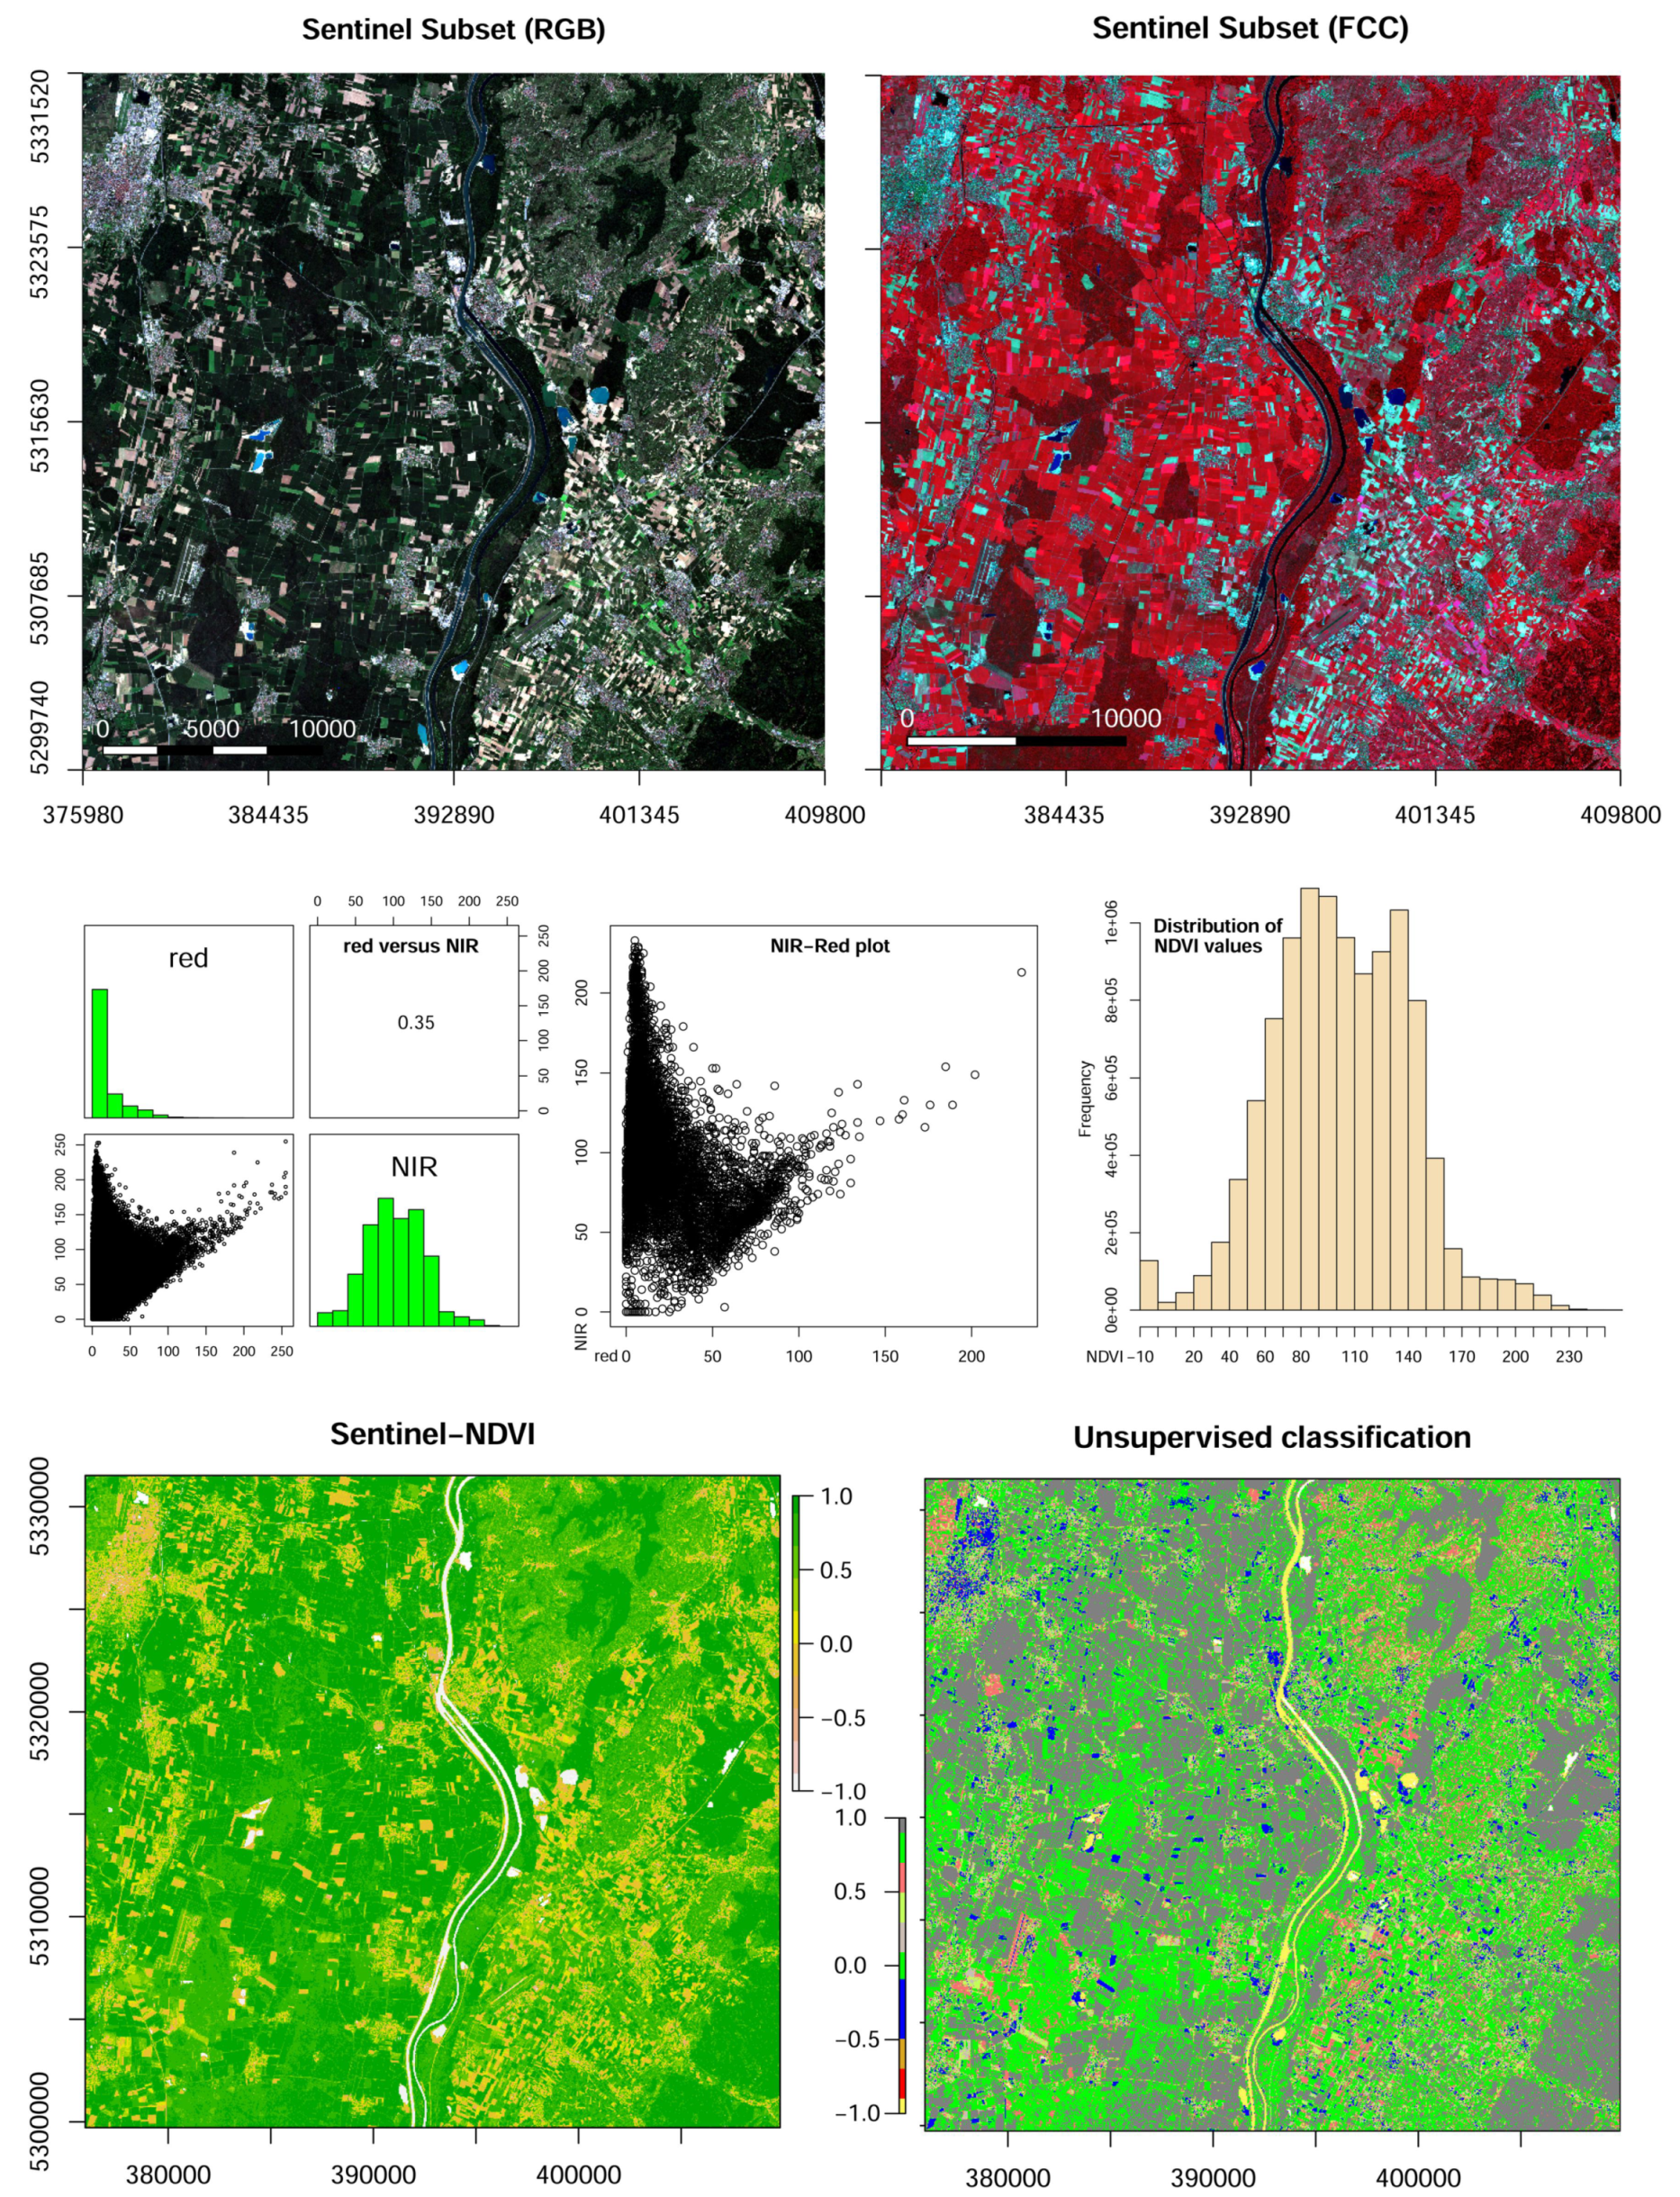
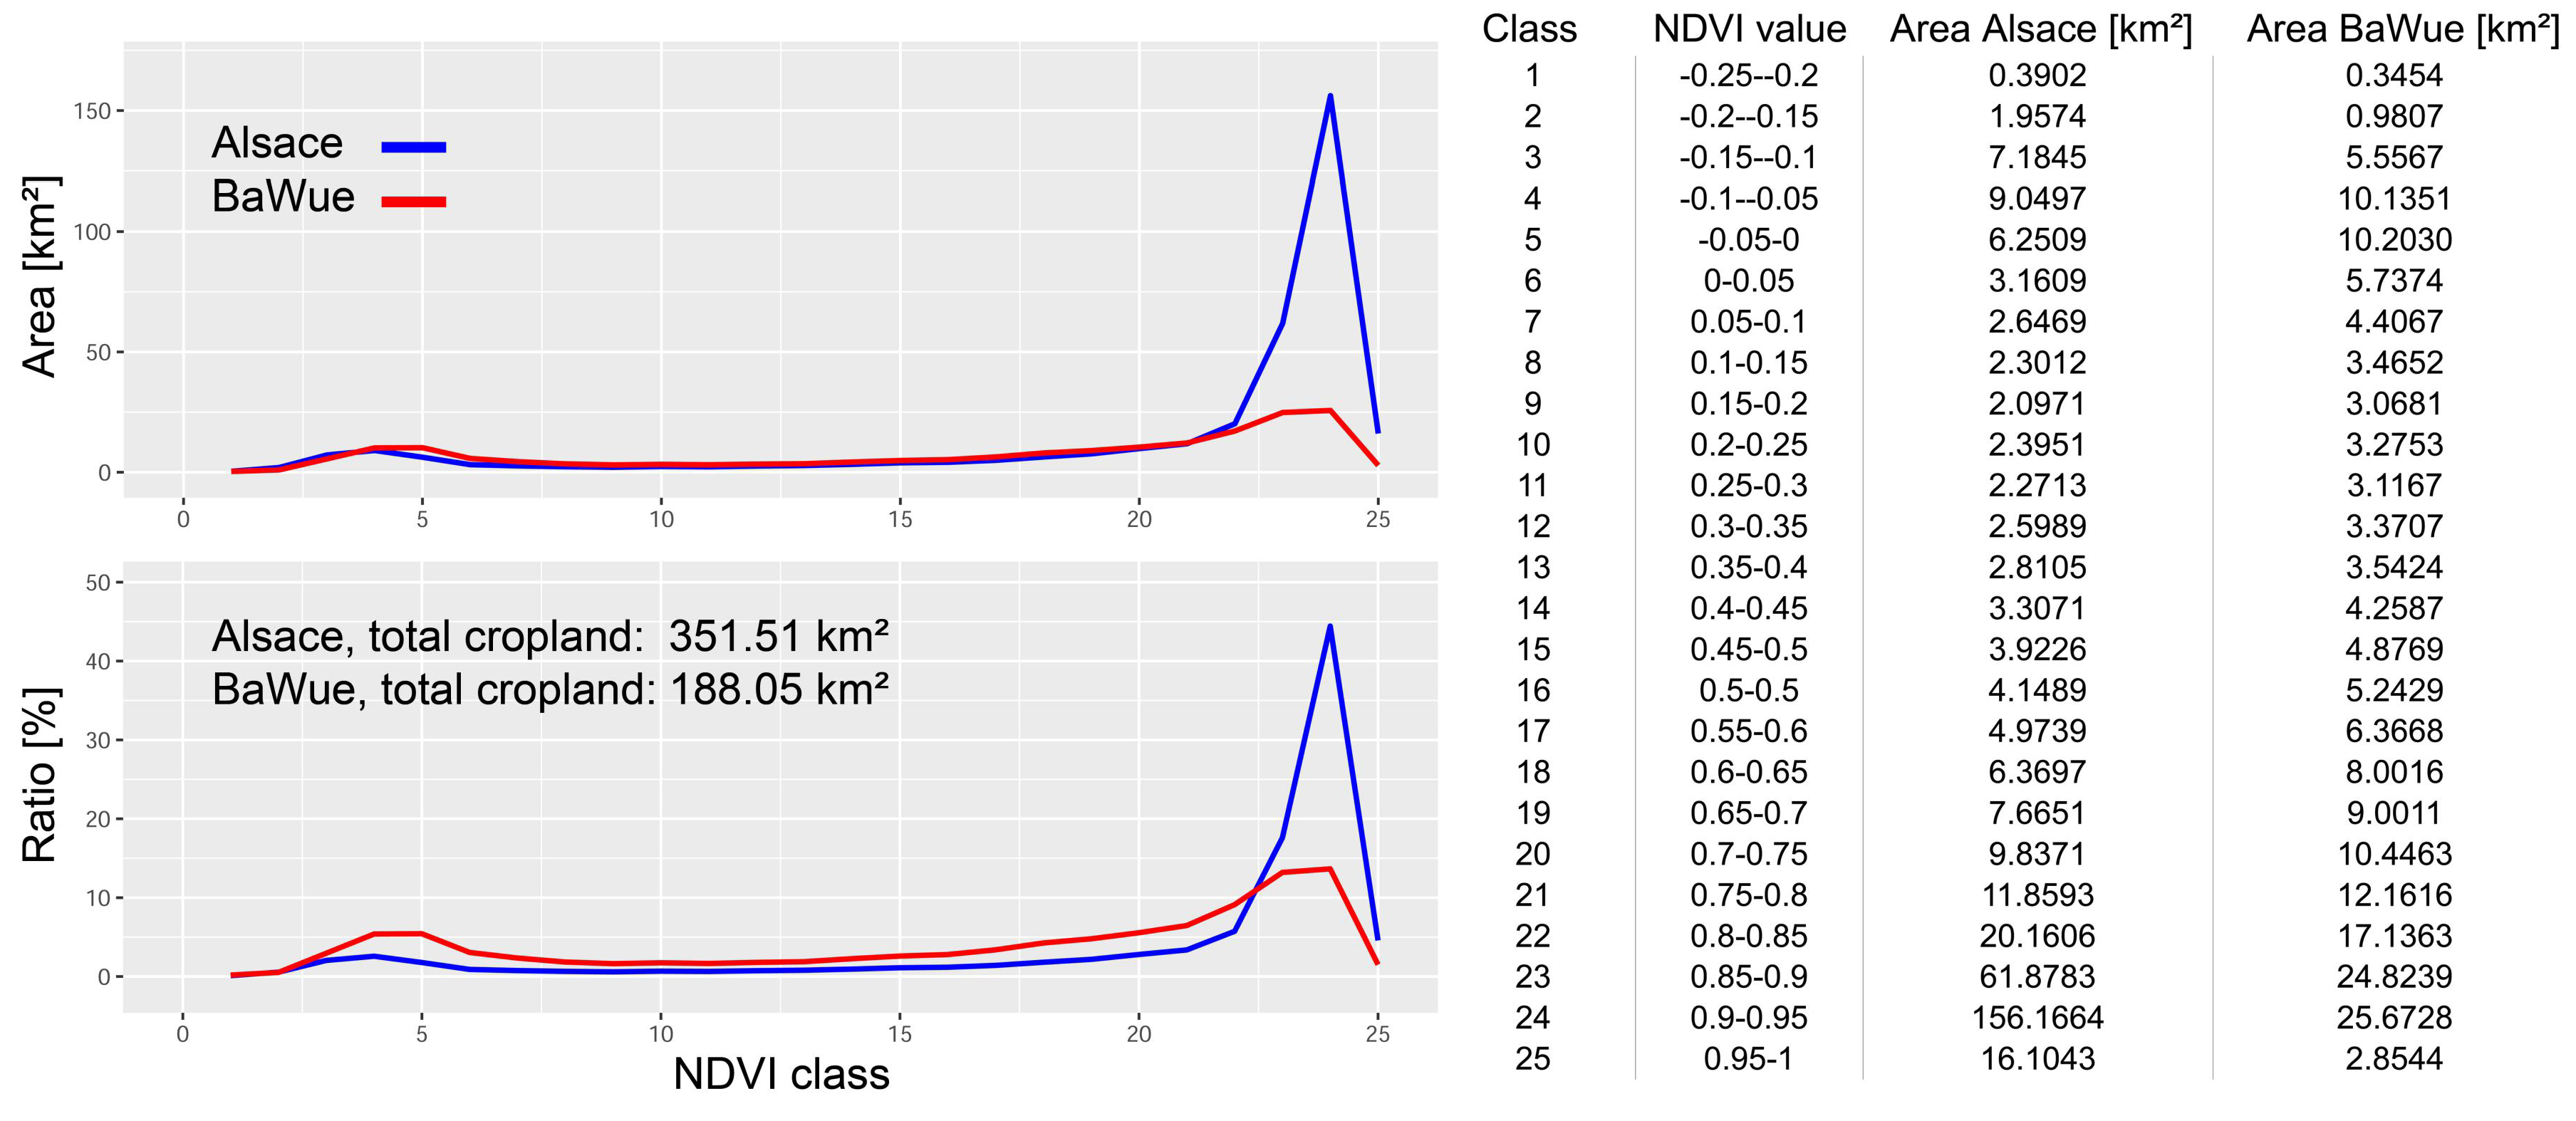
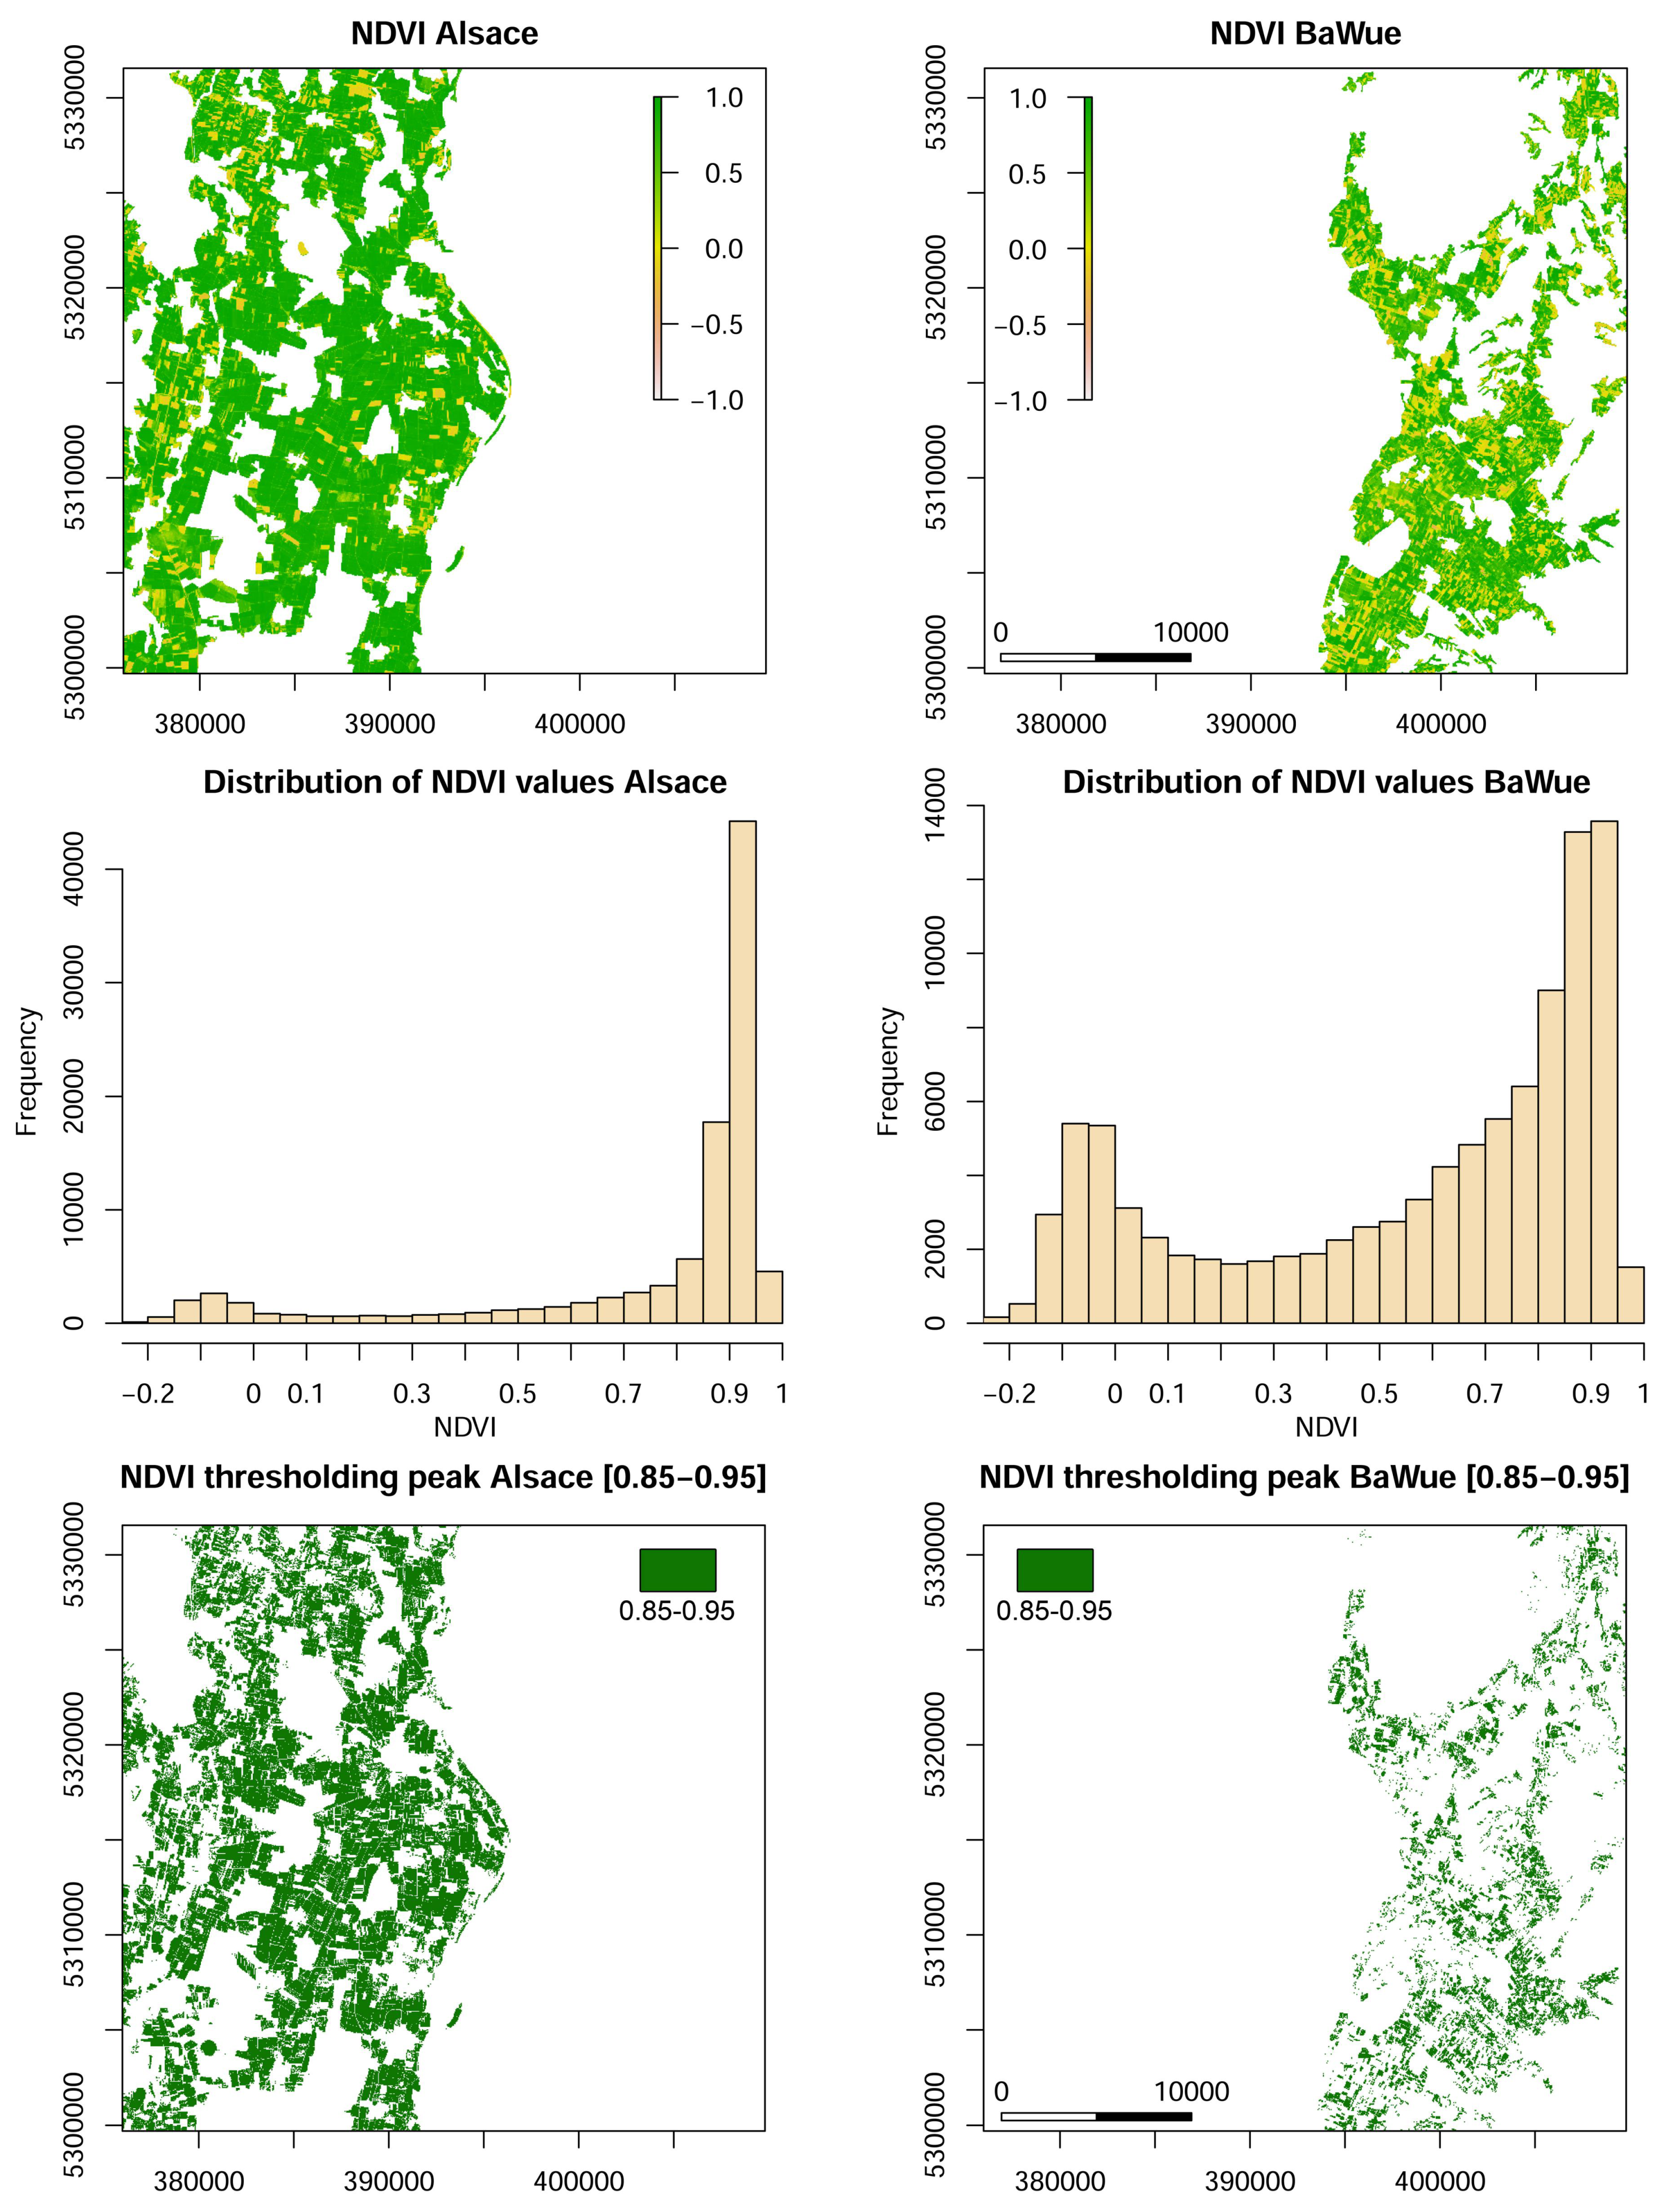
3.1. Crop Monitoring and Land-Use Differentiation

Vegetation-cover in the study site was monitored using a 2019 Sentinel-2 hyperspectral satellite image (Figure 4, Sentinel Subset RGB). The image was taken on 18 August 2019 and served as test data to determine maximum NDVI value distribution and peak threshold classifications. The image shows significant differences in the visible spectrum, ranging from large and coherent vegetation-covered areas in the French part of the URA to mosaic-like patterns in BaWue. The false-color image (FCC) allows a first evaluation of vegetation differentiation into forests stands (dark red) and agriculturally utilized areas (light red). From the spectral channel modifications of the near infrared and the red channel, the NDVI was calculated and the values of the study area were plotted. From the plots, an unsupervised classification of the NDVI values allows distinguishing classes from −1 to +1. The classification (Figure 4, unsupervised classification) demonstrates the difference in land-use strategies in both parts of the URA. It becomes visible that the Alsatian part holds large coherent vegetation zones, and the German part is rather characterized by fragmented cropland patches. The forested areas in the Alsace, which appear bright green in the image, are influenced by waterlogged soil conditions and frequent flooding events in the so-called Ried, an extensive wetland that is mostly fed by upwelling groundwater and a locally high aquifer [24]. These areas, however, are not affected by irrigated crop production and were deselected from the data sample. The data was merged and clipped with the CLC raster layer, which indicated non irrigated arable land (CLC 2018) (Figure 6, NDVI values Alsace and BaWue). From the clipped and classified data, the distribution of the NDVI values for both parts of the study area were plotted for the maximum threshold value of 0.85–0.95 (Figure 6, middle). The maximum peak NDVI value shows strong differences in land-use strategies in both parts of the study area. The French part shows extensive distribution of the maximum values, which indicates large and coherent irrigated cropland patches at high spatial resolution. The plot further reveals that there is a high frequency of maximum NDVI values in comparison to a nearly imperceptible number of low NDVI values. The German part is more heterogeneous with a peak at the maximum NDVI value of 0.85–0.95 and a smaller secondary peak at −0.1–0. The spatial distribution, however, is much smoother than in the French counterpart.
The spatially plotted NDVI maximum value thresholds (Figure 6, bottom) visualize the differences in irrigated and non-irrigated cropland patches in the URA. To test the spatial dependence of the crop-patch sizes and the NDVI distribution, the NDVI classification was split into 25 classes and the respective areas of the NDVI values were measured and plotted against the values and the total cropland ratio. Both parts of the URA behave equally in spatial differentiation until NDVI class 20/21, at which the Alsace begins to show increased spatial distribution of high NDVI values. The ratio (percent of total cropland) also increases, which excludes a mere spatial component of the value differences between the Alsace and BaWue (Figure 7).
During August 2019, no signal of harvest activity or changing physical vegetation condition in the French part of the study area could have been detected. The NDVI values remain at maximum peaks with high frequency. The German part shows considerable differences with generally lower frequency of maximum values (due to the lower ratio of arable land) but also more homogeneous value distribution throughout July and August 2019. In late August, however, the values show significant decrease of minimum value dispersal, probably due to more humid conditions and plant physiological recovery. The constant maximum value distribution in the Alsace can most likely be linked to continuous crop irrigation during July 2019 and consequently a high drought persistence and resilience. The German part would thus suffer from increased air temperature during summer 2019 with lower potential drought resilience and constantly increasing vulnerability to groundwater scarcity before precipitation onset during late July. The recovery trend at the end of August 2019 cannot be observed in the Alsatian plant communities, which would further strengthen the argument of continuous irrigation. NDVI value comparison for 19 July 2019 and 29 July 2019 were not possible due to extensive cloud coverage in the section of the case study.

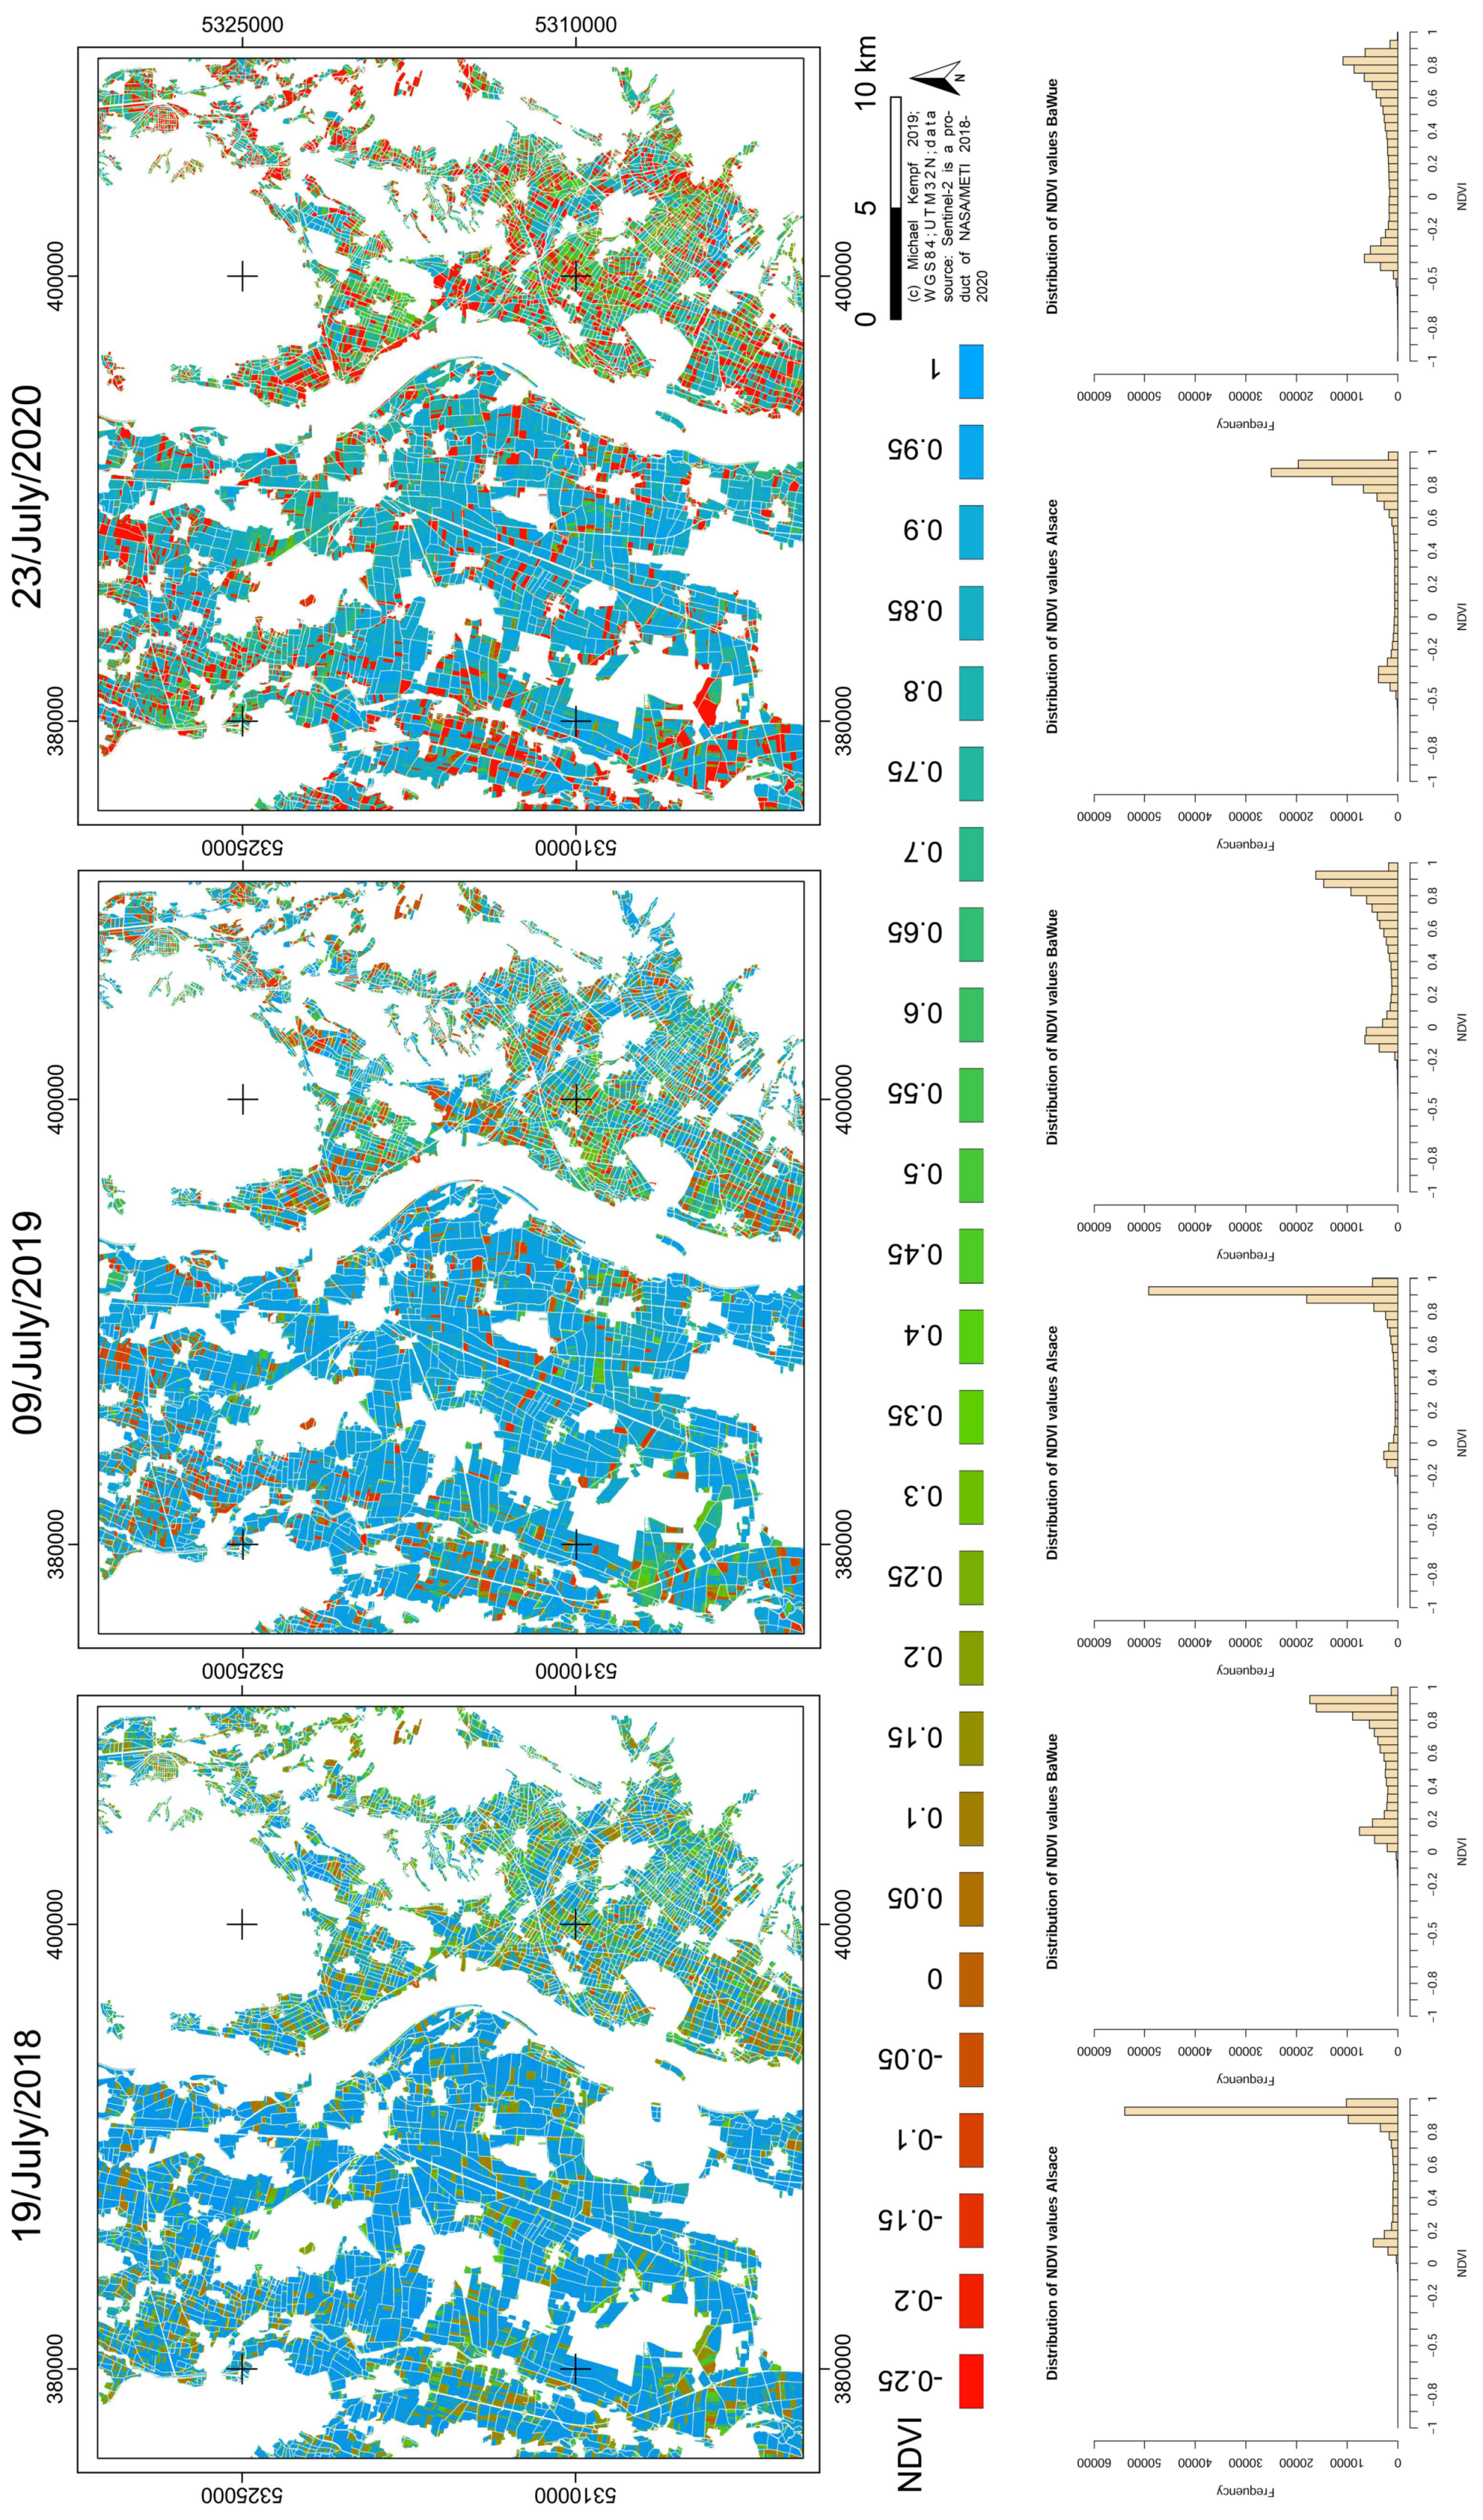
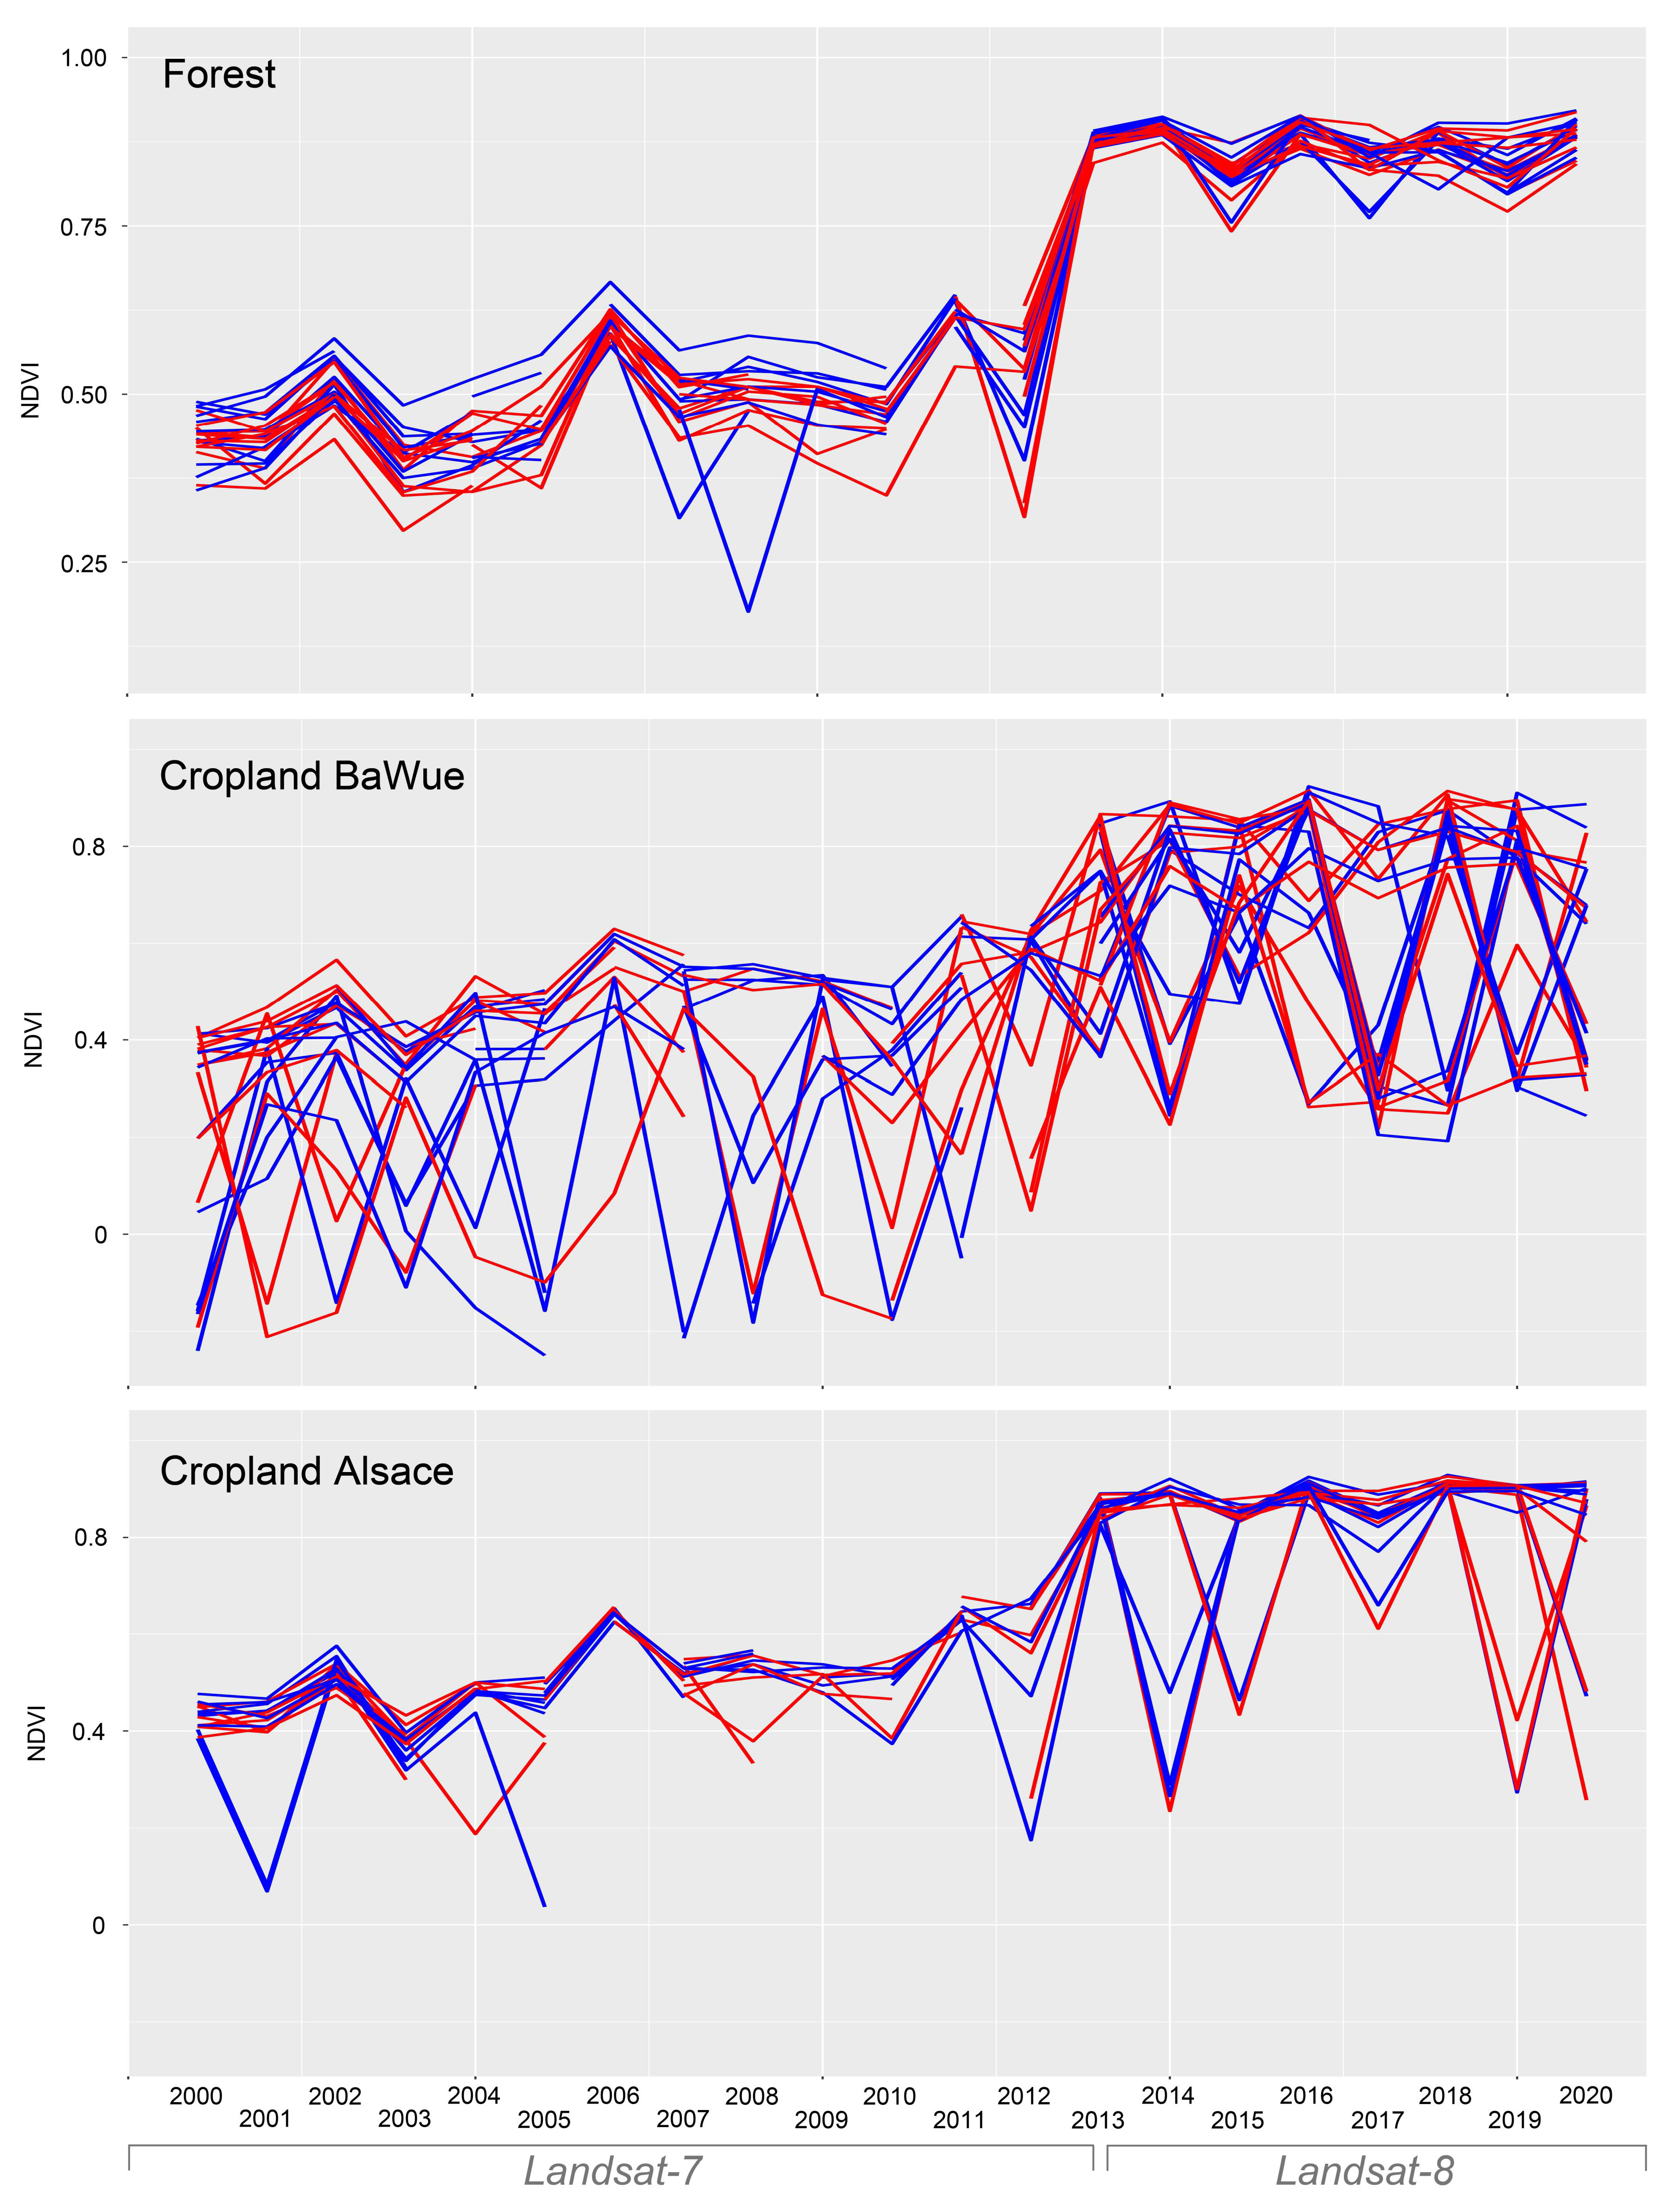
3.2. Temporal NDVI Series

Both parts of the study area were evaluated for vegetation canopy changes during July 2018, 2019, and 2020. To evaluate the dataset in its temporal depth, a 20-year time series of Landsat-7 and Landsat-8 NDVI values from July and early August serves as comparison dataset. The long-term medium resolution series (30 m in the visible and infrared range) covers forest stands to cross-check the natural feedbacks of the vegetation to the increased temperature and precipitation anomalies during 2018–2020. Particularly the Landsat-8 comparison data shows rather homogeneous value ranges during July and August with annual variation. However, after 2018, the values start to show increased variation and fuzziness (Figure 5). The cropland comparison data for BaWue remains heterogeneous over the entire period from 2000 to 2020, which points towards a large variation in crop production, harvest activity, irrigation strategies, and response to climate variability. The Alsatian part shows more homogeneous NDVI values ranges—despite a few outliers. A small trend towards increased fuzziness after 2018 is also visible in the comparison dataset. There is a general difference in Landsat-7 and Landsat-8 reflectance and the NDVI values, which is rooted in the different wavelengths of the channels on boards the two missions and the narrower bands of Landsat-8 [106,107]. The fragmented Landsat-7 data is caused by data gaps after 2003 but does not affect the trend of the comparison data.
In particular, the Alsatian part of the URA did not show any significant changes in the plant’s physical behavior during summer 2018 and 2019, which suggests strong irrigation activity. The constant freshwater withdrawal, however, led to a dramatic drop of groundwater level, which accumulated during the past three exceptionally warm dry years [2,32,108,109]. Consequently, the French administrative decree from July 2020 regulated the water outtake in the URA to prevent further lowering of the aquifer and the small-scale rivulets from drying out. The NDVI time series from 2018–2020 reveals significant changes in cropland productivity and physical plant vigor (Figure 8). In July 2018, both parts of the study area show almost only positive NDVI values, however their spatial distribution differ significantly from each other with very high frequency of maximum peak values in the Alsace and more continuous values ranges in BaWue. In 2019, the maximum peak distribution of the previous year could not be reached in the Alsace, although the values remained constantly very high compared to the ranges of the German part of the study area. In Baden-Württemberg, the earliest data of silage maize harvest is dated to after 19 August 2019 [110]. Consequently, data bias by maize harvest can be ruled out. Locally, the cropland showed severe impact from water scarcity and persistent heat waves during summer 2019, which triggered a slight increase in negative NDVI values. However, the persistently irrigated parts of the agriculturally utilized areas show no significant changes in physical plant conditions. This changed totally in July 2020, when in particular the German part of the URA showed dramatical effects of groundwater lowering amplified by drought periods that occurred during spring 2020 and in summer 2018 and 2019 [109]. High maximum peak values dropped significantly and the number of low and medium NDVI values increased accordingly. A noticeable number of negative values occurred in the Alsace and the secondary peak of low value ranges in BaWue shifted from +0.1 to −0.1 and finally −0.4 in 2020. In the Alsace, the frequency of maximum peak values decreased over 50% and the number of degraded agricultural areas increased. This can be due to an early onset of harvest on non-maize crop plantations or due to the massive groundwater outtake of the URA aquifer during the previous years. On the 5 August 2020, however, maize harvest has not yet started, which suggests that the increase in extremely low NDVI values most likely can be traced back to cereal harvest activity or crop failure and fallow. The drop of extreme values, however, cannot be explained by shifted crop species strategies and a decrease of maize cultivation in the Alsace but rather by the extensive decrease of groundwater availability, heat stress, increased evapotranspiration, and the very low precipitation values during July 2020 [94]. The governmental decree, which came into effect on 23 July 2020, (theoretically) reduced the water outtake by 30%, which could have strengthened the plant’s physical pressure.

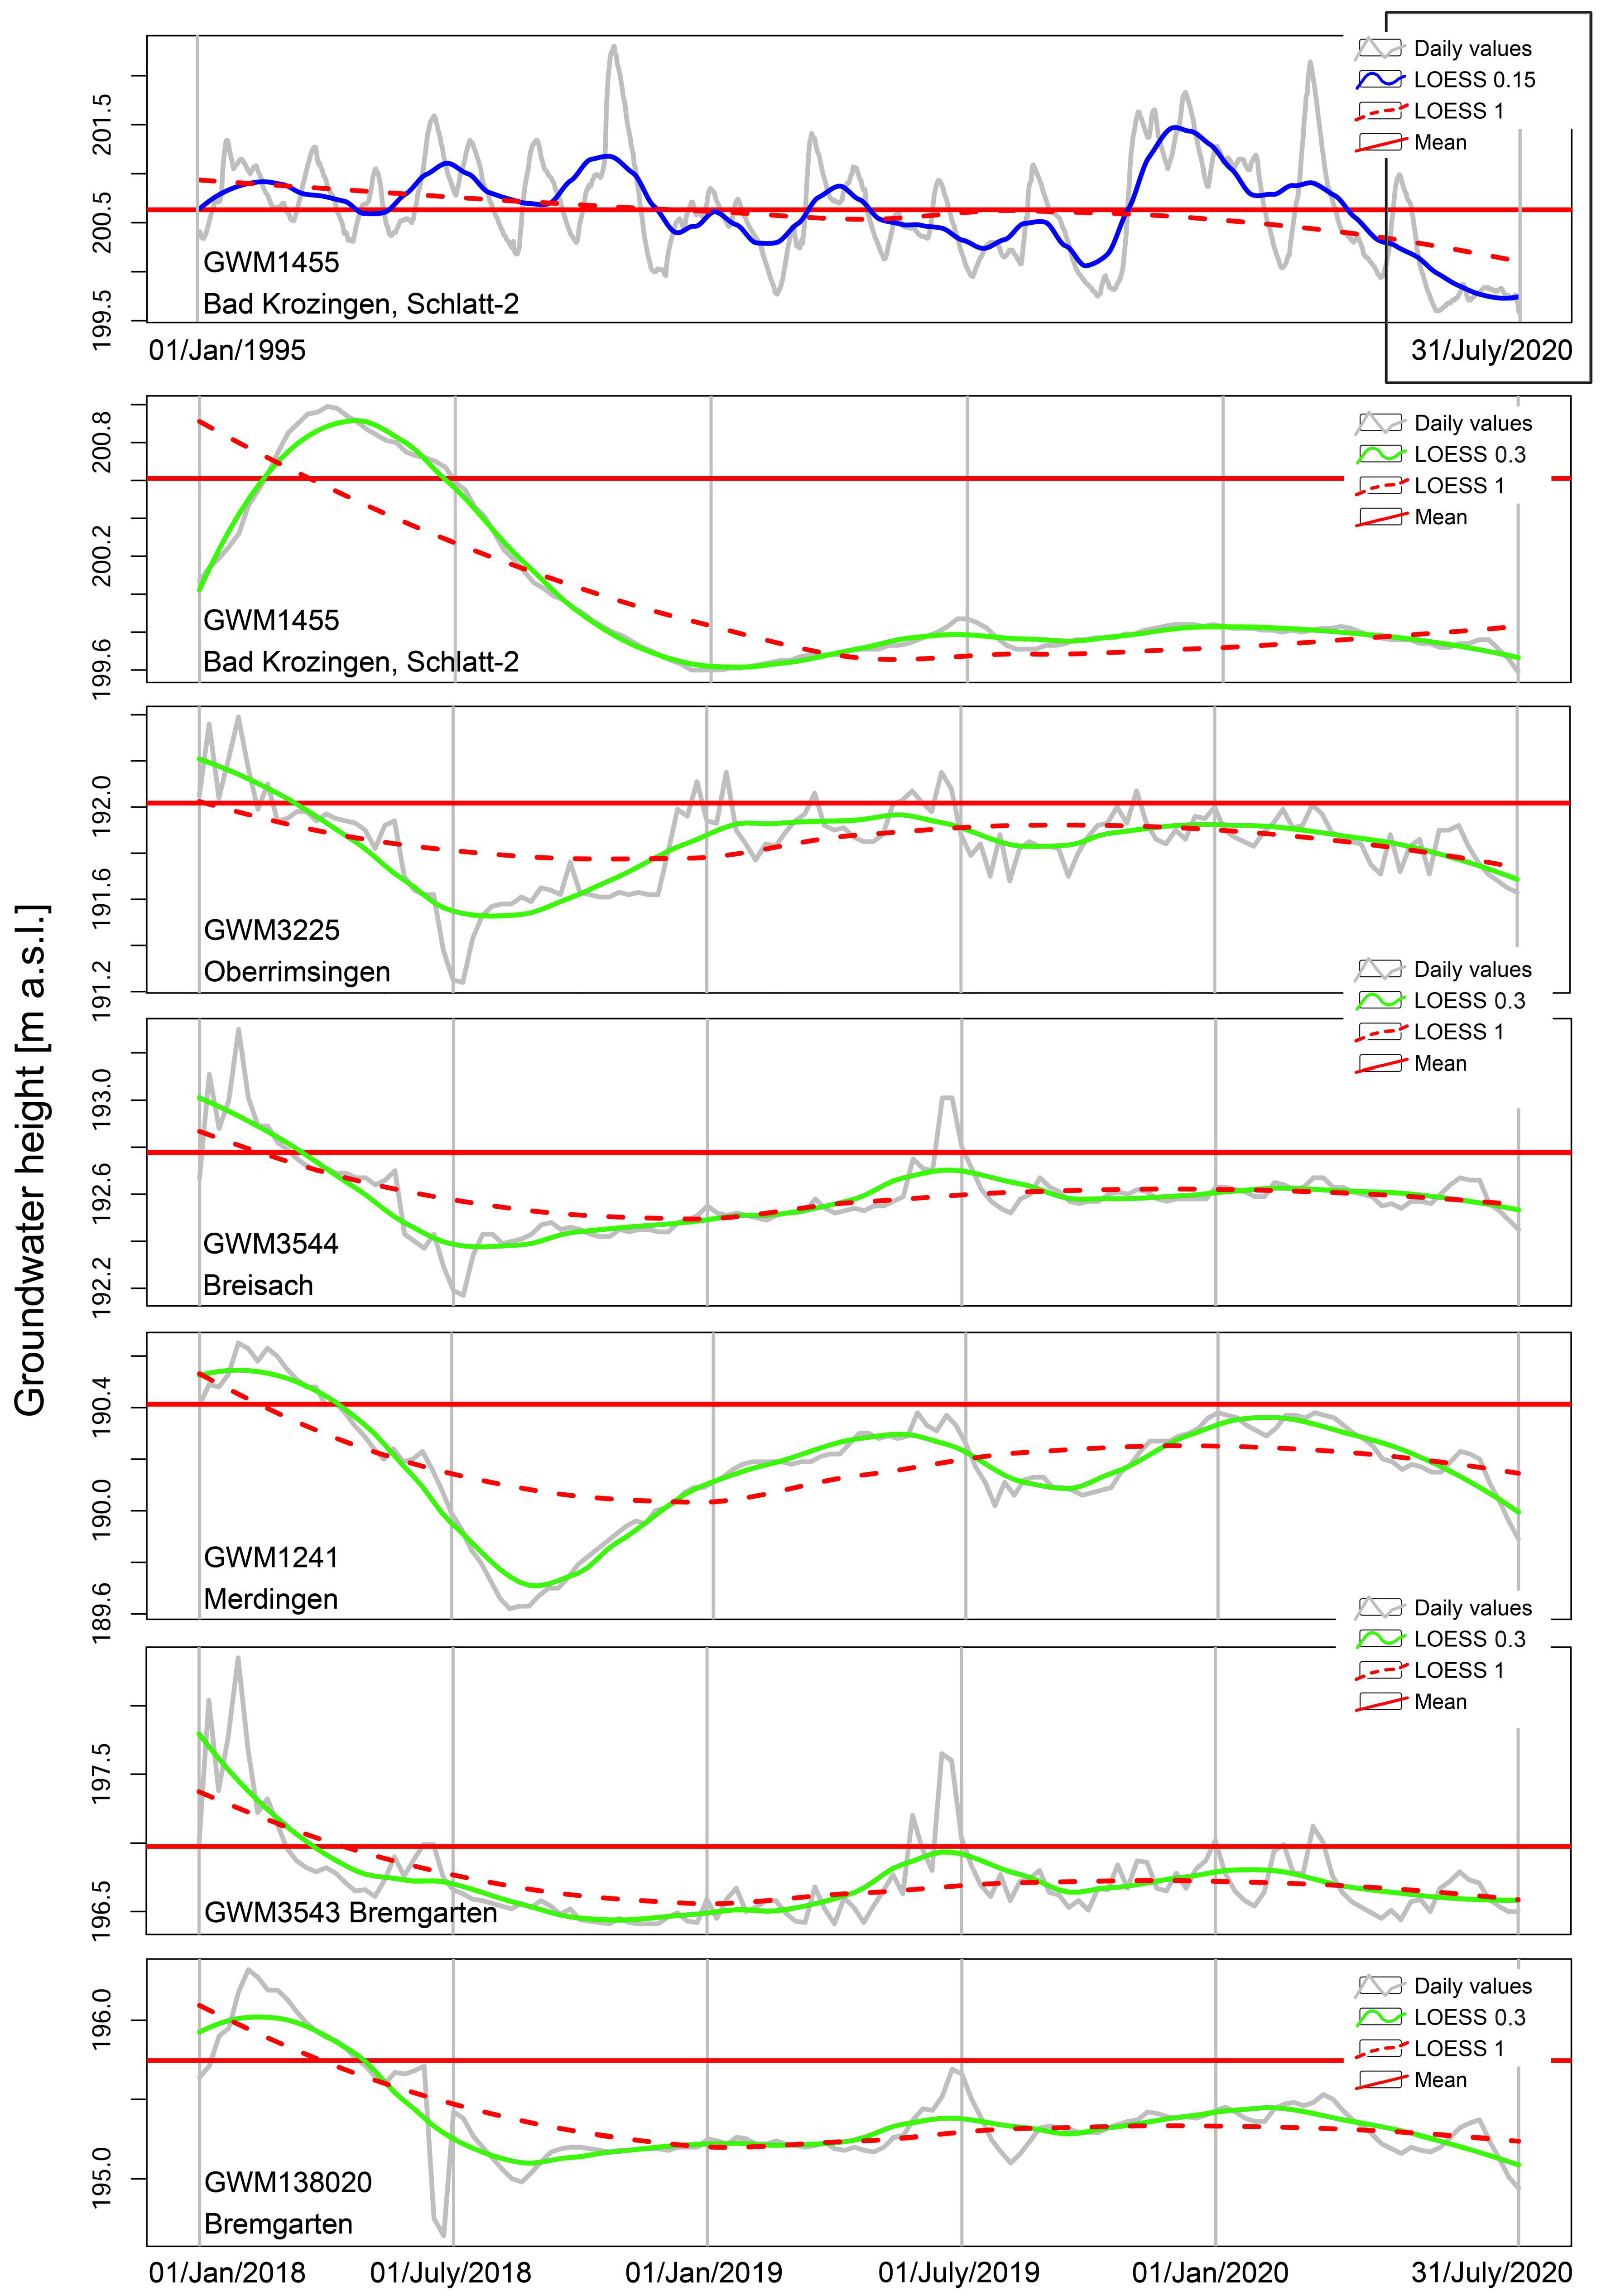
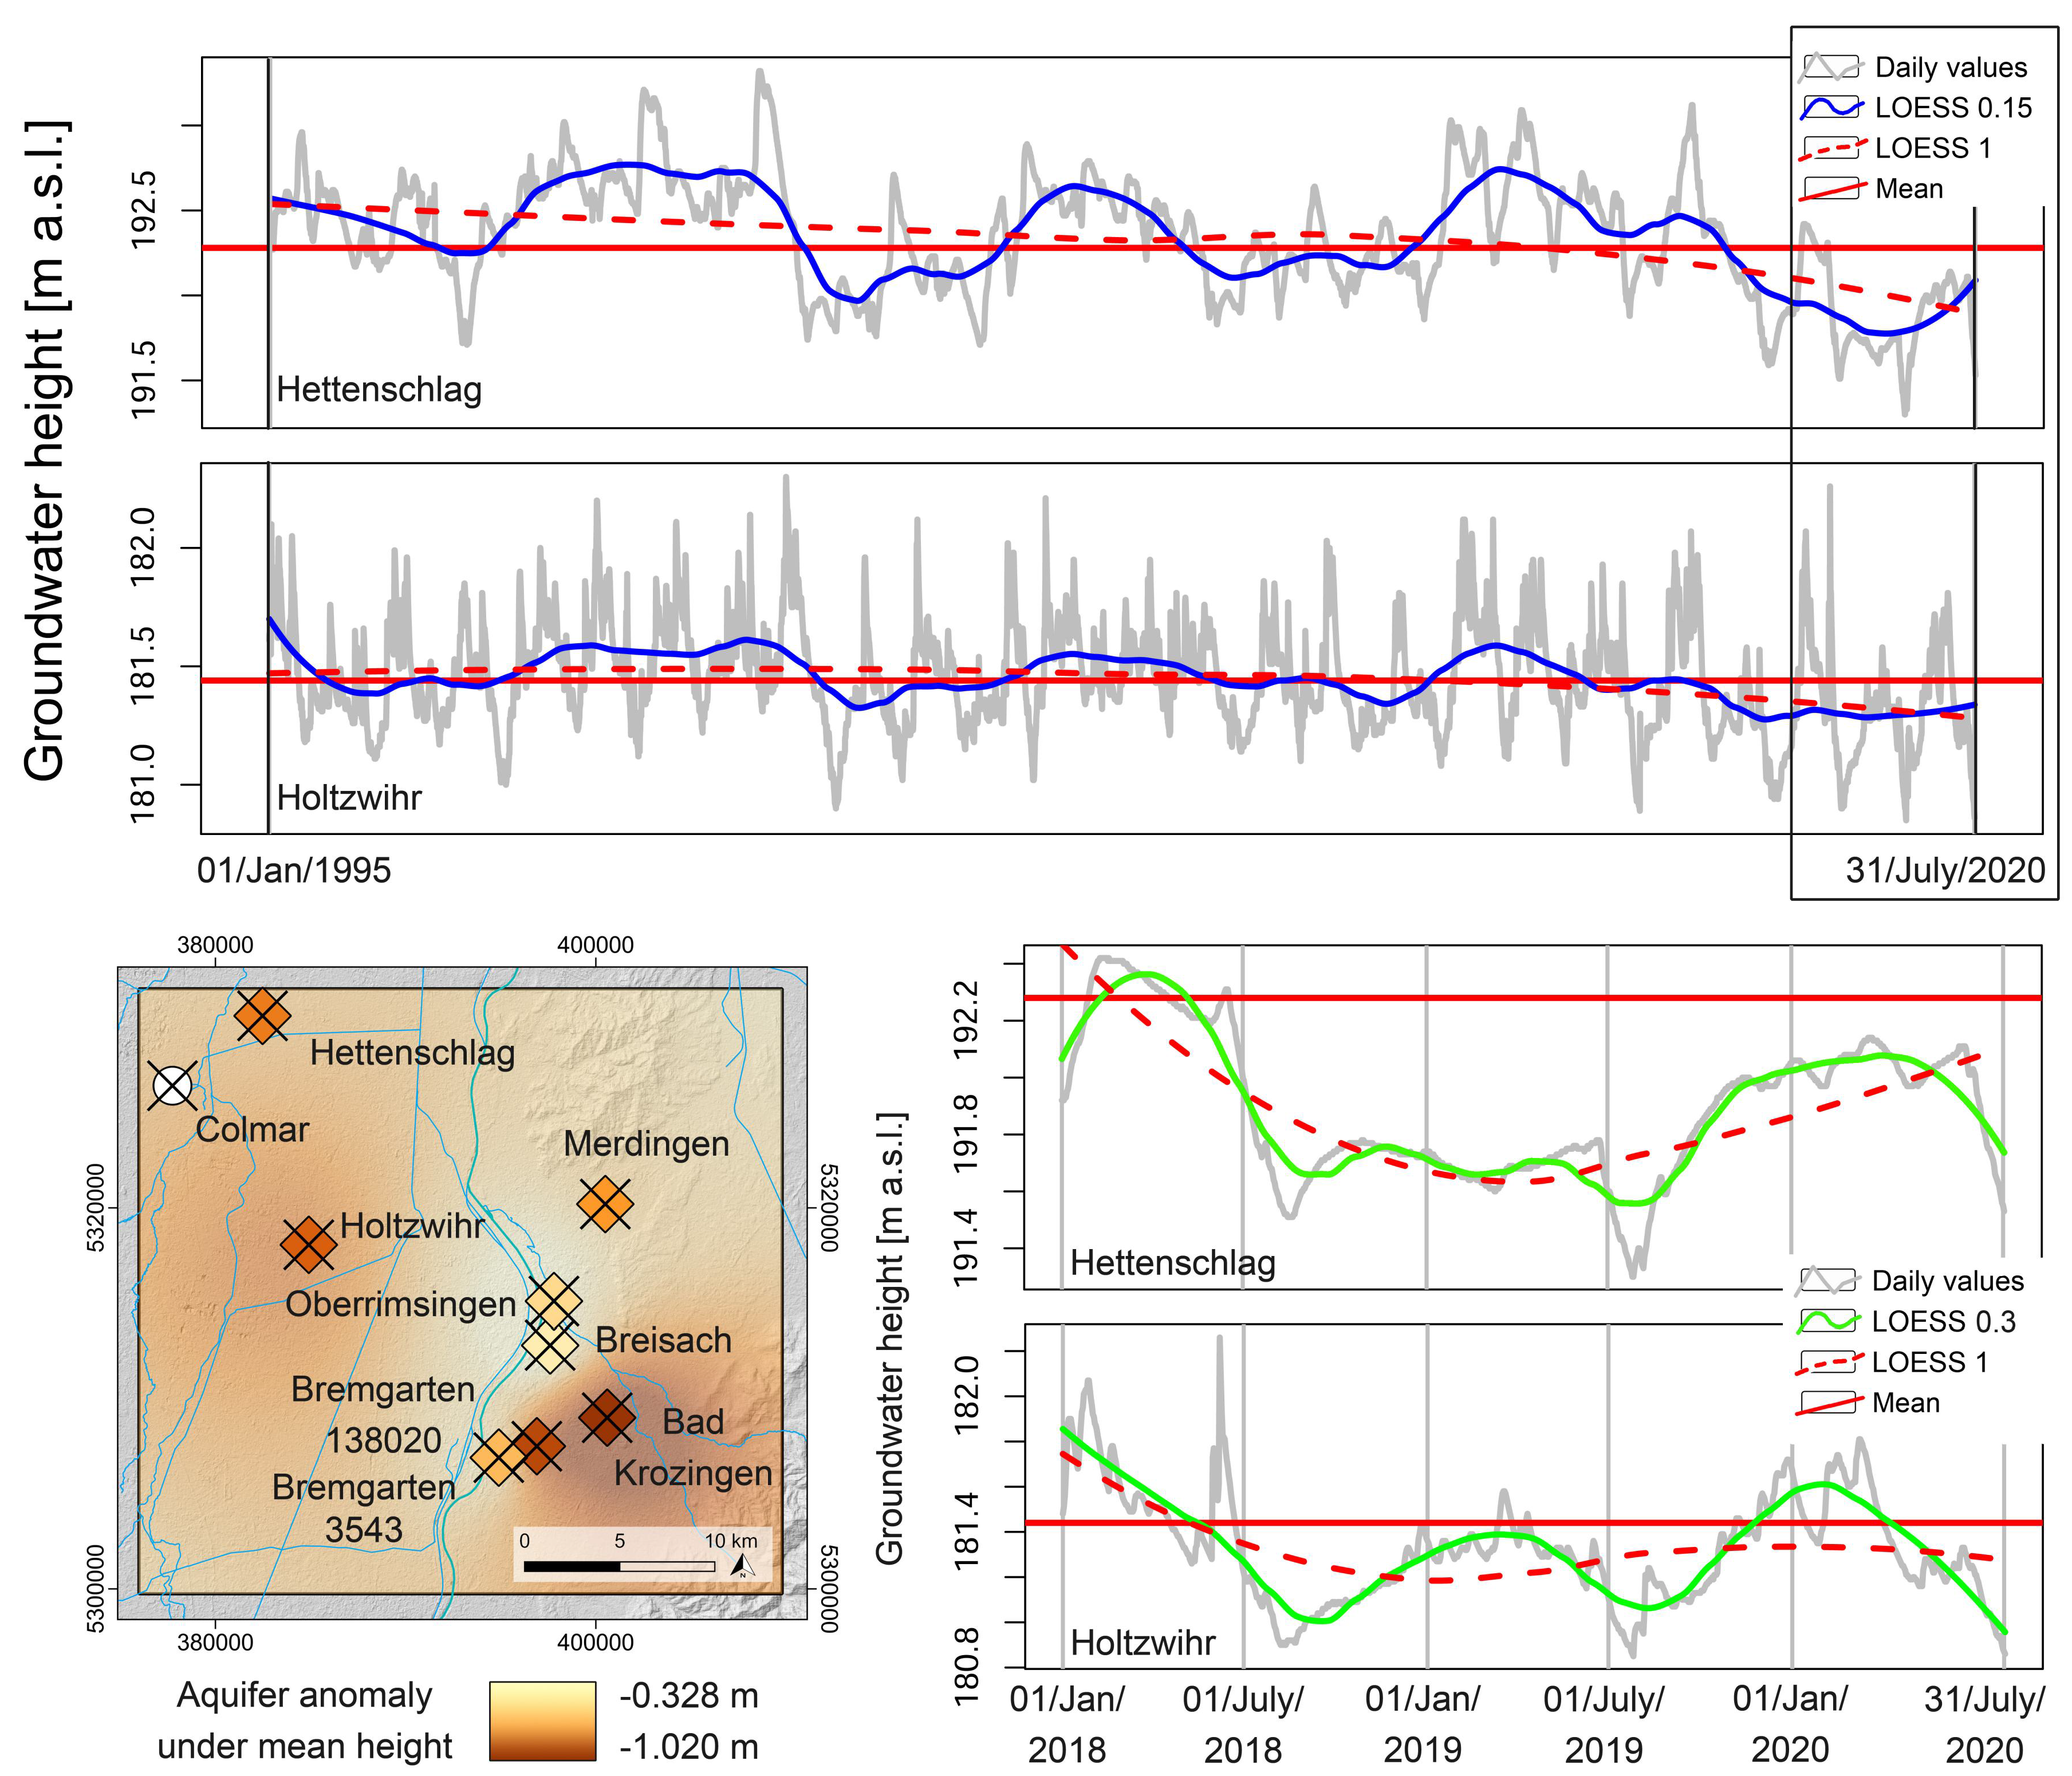
3.3. Time Series Groundwater Level

To cross-check the relationship between freshwater consumption, irrigation, and plant growth behavior, the groundwater height was modelled based on daily groundwater table measurements in the Alsace (Figure 9). Over the period January 1995 to July 2020, the water table shows significant differences in the annual cycle with sharp drops during summer and recovery during winter and spring when the Alpine aquifer shows increased runoff triggered by early snowmelt and high precipitation values [85,111,112]. On the short-term temporal scale, however, a significant recovery of the URA aquifer in 2019 cannot be observed. Both stations clearly show persistent low groundwater levels in late 2018 and the first half of 2019 followed by a strong decline during summer 2019. The aquifer recovered slightly from the end of July onwards until the end of the year when it drops again during January 2020. The following backfill, however, did not reach the average maximum values. In addition, in spring 2020 (April and May 2020), persistent warm and extremely dry conditions prevailed [94], which dramatically lowered the groundwater table. Consequently, the remaining buffers emptied rapidly in the course of extensive irrigation over spring and early summer growing period and the current flowering phase of maize (6 August 2020, personal comment from Anette Hartmann (STL, Baden-Württemberg)). Despite rather abundant precipitation in June 2020, the massive water withdrawal and the strongly decreased reservoir buffers led to a rapid and sharp decline of the URA aquifer at the end of July 2020 (Figure 9 and Figure 10).
The Alsatian signal is also confirmed by the measurement stations in Baden-Württemberg. Groundwater levels and discharges volumes at the end of July 2020 were significantly below average. The groundwater supply has declined due to below-average precipitation (30% of the long-term average) and high evaporation during July [94]. Soil moisture content decreased accordingly. Due to the current groundwater hydrological and meteorological boundary conditions, the groundwater recharge process is likely to be suspended until autumn, even under wet conditions and continuous precipitation [113]. According to the current status report of the LUBW, 90% of the measurement stations show declining groundwater levels and severe values in the URA. Spring discharge values also declined significantly compared to 2019, which underlined the tendency towards empty groundwater reservoirs in the entire Baden-Württemberg and the URA. Groundwater regeneration during fall 2020 cannot be expected [113]. Figure 10 demonstrates the trend of groundwater development during summer 2020. The stations at Bad Krozingen, Merdingen, Bremgarten, Oberrimsingen and Breisach show continuously low values throughout the period July 2018 to 2020. The long-term mean has been reached only locally for a short period since spring and early summer 2018. In particular, the station at Bad Krozingen demonstrates the severe drop in groundwater level since July 2018. Compared to the mean average, the groundwater level reached its minimum at the 31 July 2020 with over one meter below average (Figure 9 and Figure 10). However, not only the station at Bad Krozingen has declined sharply, but all stations also show significant decline in groundwater height during late July 2020 (Figure 10). It is particularly noteworthy that despite the more humid conditions during June 2020 [94], the groundwater levels were constantly declining, which resulted in empty reservoirs by early July. Amplified by the very low precipitation amounts during July 2020 and the massive groundwater withdrawal for irrigation purposes, the aquifer of the URA dropped dramatically to extremely low levels at the beginning of August 2020.
The URA aquifer depends to a large part on the runoff dynamics of the alpine aquifer, the snow-melt regime during spring and early summer, and the precipitation patterns in the alpine catchment area [111,112]. According to Pfister et al. (2006), the fluvial regime at Basel can be divided into an upstream part, which is controlled by the snow-melt rate and a downstream pluvial regime, which is mostly dominated by winter maximum precipitation patterns and the discharge of the various tributaries. In the course of climate change, however, these parameters are constantly shifted towards an earlier onset of runoff maximum from the high alpine catchments due to depleting glaciers [114]. Compared to a significant shift in onset of the phenological phases [115], this can have dramatic impact on the water balance of the river Rhine aquifer. A phenological shift in crop cultivation, as reported from flowering phase, tillage, and time of harvest of maize in the German part of the URA [110], would thus trigger an intensification of freshwater withdrawal during low runoff and discharge periods, which would further amplify the disbenefits of low precipitation means, monoculture crop cultivation, and extensive irrigation. In addition, the early onset of the flowering phases in April and May increases the vulnerability to frost damage—particularly in the elevated forest-covered mountain ranges, where temperature drops caused massive dying of beech trees in spring 2020 (see Figure 2D).

3.4. Open Source Data Potential and Limitations

Surface monitoring from open source data and particularly Sentinel-2 imagery allows for a rapid near real-time and low-cost access to evaluate climate change response on the local to the supraregional scale and on high temporal frequencies. In this context, the comparison of the Sentinel-2 data with data derived from the lower resolution Landsat-7 and Landsat-8 mission enables creating long time series to evaluate vegetation change in response to climate extremes, natural ecological variability, or anthropogenic overprints [99,106,116,117]. Particularly the Landsat-8 and Sentinel-2 spectral bands symmetry and radiometric resolution allows an integrative use of high to moderate resolution imagery [118,119]. However, differences in the surface reflectance in the NIR band has an influence on the comparison potential—especially in heterogeneous vegetation classes [119]. Because vegetation canopy monitoring over small temporal periods needs to be compared to long-term time series (>10 years), the differences in the return periods of the satellites and the resolution of the images can be considered a key limitation of multi-annual Landsat-8 and Sentinel-2 datasets [118]. The time series of this research, which has been created from Landsat-7 and Landsat-8 imagery in the study area has further demonstrated the discrepancies of the surface reflectance and the respective bands of the two sensors. However, despite these differences and the additional inaccuracies of the post 2003 data gaps caused by the Landsat-7 SLC failure, long-term time series of up to 20 years can be generated using point-based data extraction of each year and over specific surface coverage and land-use. In this context, the major limitation stems from the availability of cloud-free images from a particular month or season over a significantly long time period [120]. Eventually, the direct feedbacks between vegetation canopy changes, irrigation strategies, and climate extremes cannot be considered linear, which makes it particularly difficult to correlate physical plant behavior with periods of recurring drought events and declining groundwater tables—although recent results demonstrated that NDVI can serve as a potential predictor in groundwater recharge models [121].

4. Conclusions

Vegetation index (NDVI) analyses of three consequent years in the URA demonstrate a significant impact of irrigation activity on the hydrological system and in particular highlight the link between massive groundwater withdrawal and groundwater level development under climate and LUCC. Significant regional warming and a decrease of summer precipitation during the past years caused severe dropping of the groundwater table in the study area in late July 2020. This trend is amplified by a shift in the phenological phases, increased freshwater consumption and irrigation purposes, and the spread of monoculture crop production like intensely irrigated maize cultivation. However, the cross-border dataset also highlights clear differences in irrigation strategies in the French and the German parts of the study area. NDVI threshold analysis of peak maximum values from July 2018, 2019, and 2020 illustrate not only strong discrepancies in field sizes, but also in irrigation intensity during cloud-free conditions and increased summer maximum temperatures. The Alsace shows broad coherent and strongly irrigated field systems, which testify constant maximum vegetation vigor during July 2018 and 2019. The German part demonstrates more homogeneous distribution of NDVI values and a mosaic-like small-scale patterned field system. However, maize cultivation and persistent irrigation of special crops can also be observed in Baden-Württemberg. In July 2020, when the governmental authority of the region Grand Est released a decree that aimed at regulating groundwater withdrawal as a consequence of a dramatic drop of the water table, the NDVI maximum values of both parts of the study area decreased up to over 50%. A combination of a general trend in groundwater lowering, a shift in the onset of the phenological phases towards earlier flowering and tillage, low precipitation means during summer in the course of climate change, and an increase in freshwater consumption from the URA hydrologic system cause a massive degradation of the regional ecosystem. Future LUCC and climate change in the river Rhine catchment area and the Upper Rhine floodplain are capable to amplify the negative ecosystem response cycle and lead to a further decrease of ecological resilience—with unpredictable consequences for the local and the regional hydrologic functionalities and the ecosystem composition in the lower Rhine basin. Syndrome-like hot droughts in the near future can eventually lead to ecological destruction. Future governmental regulations and political and socio-ecological decision-making need to be encouraged to address alternatives in land-use strategies and freshwater consumption to maintain the regional hydrologic connectivity.

Author Contributions

Conceptualization: M.K. Analyses: M.K. Writing original draft: M.K., R.G. Editing and revising: M.K. All authors have read and agreed to the published version of the manuscript.

Funding

This research received no external funding.

Acknowledgments

This article benefitted greatly from the constructive input and critical comments of three anonymous reviewers. We are particularly grateful to Karin Burk (LUBW, Referat 42, Karlsruhe), Michel Wingering (LUBW, Referat 42, Karlsruhe), and Erich Mattes (AHK, Freiburg), who provided extremely helpful data about current groundwater fluctuations in Baden-Württemberg. Thanks to Joël Schregenberger (BAFU, Bern, CH), who provided data on the river Rhine water gauge level at Basel, Rheinhalle. We would also like to thank Anette Hartmann (Statistisches Landesamt Baden-Württemberg, Referat 62, Landwirtschaft, Stuttgart) for her comments on maize cultivation and harvest onset in the research area.

Conflicts of Interest

The authors declare no conflict of interest.

References

  1. Lambin, E.F.; Geist, H. Land-Use and Land-Cover Change. Local Processes and Global Impacts; Springer-Verlag: Berlin/Heidelberg, Germany, 2006; ISBN 9783540322016. [Google Scholar]
  2. Buras, A.; Rammig, A.; Zang, C.S. Quantifying impacts of the 2018 drought on European ecosystems in comparison to 2003. Biogeosciences 2020, 17, 1655–1672. [Google Scholar] [CrossRef] [Green Version]
  3. Bréda, N.; Badeau, V. Forest tree responses to extreme drought and some biotic events: Towards a selection according to hazard tolerance? Comptes Rendus Geosci. 2008, 340, 651–662. [Google Scholar] [CrossRef]
  4. Blauhut, V.; Stahl, K.; Stagge, J.H.; Tallaksen, L.M.; Stefano, L.d.; Vogt, J. Estimating drought risk across Europe from reported drought impacts, hazard indicators and vulnerability factors. Hydrol. Earth Syst. Sci. Discuss. 2015, 12, 12515–12566. [Google Scholar] [CrossRef] [Green Version]
  5. Verburg, P.H.; Groot, W.T.d.; Veldkamp, A.J. Methodology for multi-scale land-use change modelling: Concepts and challenges. In Global Environmental Change and Land Use; Dolman, A.J., Verhagen, A., Rovers, C.A., Eds.; Springer Netherlands: Dordrecht, The Netherlands, 2003; pp. 17–51. ISBN 9789048163083. [Google Scholar]
  6. Crumley, C.L.; Marquardt, W.H. Landscape: A Unifying Concept in Regional Analysis. In Interpreting space: GIS and Archaeology; Allen, K.M., Green, S.W., Zubrow, E.B.W., Eds.; Taylor & Francis: London, UK, 1990; pp. 73–79. ISBN 0850668247. [Google Scholar]
  7. Baguette, M.; Blanchet, S.; Legrand, D.; Stevens, V.M.; Turlure, C. Individual dispersal, landscape connectivity and ecological networks. Biol. Rev. Camb. Philos. Soc. 2013, 88, 310–326. [Google Scholar] [CrossRef] [PubMed]
  8. Scholze, N.; Riach, N.; Glaser, R. Assessing Climate Change in the Trinational Upper Rhine Region: How Can We Operationalize Vulnerability Using an Indicator-Based, Meso-Scale Approach? Sustainability 2020, 12, 6323. [Google Scholar] [CrossRef]
  9. Labarchède, A.; Jong, C.d.; Giuglaris, É.; Dumont, S. Resilience of the Alsatian aquifer, France to Climate and Anthropogenic Change: A Case Study of the Grand Ried. Available online: https://meetingorganizer.copernicus.org/EGU2020/EGU2020-1178.html (accessed on 1 October 2020).
  10. Brèteau-Amores, S. Drought Effects on Early Growth and Mortality of Three Oak Species in the Upper Rhine Valley. AJCC 2018, 7, 336–354. [Google Scholar] [CrossRef] [Green Version]
  11. Tramberend, S.; Fischer, G.; Bruckner, M.; van Velthuizen, H. Our Common Cropland: Quantifying Global Agricultural Land Use from a Consumption Perspective. Ecol. Econ. 2019, 157, 332–341. [Google Scholar] [CrossRef] [Green Version]
  12. Zhang, X.; Wu, S.; Yan, X.; Chen, Z. A global classification of vegetation based on NDVI, rainfall and temperature. Int. J. Climatol. 2017, 37, 2318–2324. [Google Scholar] [CrossRef]
  13. Taylor, P.D.; Fahrig, L.; With, K.A. Landscape connectivity: A return to the basics. In Connectivity Conservation; Crooks, K.R., Sanjayan, M., Eds.; Cambridge University Press: Cambridge, MA, USA, 2006; pp. 29–43. ISBN 9780511754821. [Google Scholar]
  14. Taylor, P.D.; Fahrig, L.; Henein, K.; Merriam, G. Connectivity Is a Vital Element of Landscape Structure. Oikos 1993, 68, 571–573. [Google Scholar] [CrossRef] [Green Version]
  15. Anderson, S.J.; Kierepka, E.M.; Swihart, R.K.; Latch, E.K.; Rhodes, O.E. Assessing the permeability of landscape features to animal movement: Using genetic structure to infer functional connectivity. PLoS ONE 2015, 10, e0117500. [Google Scholar] [CrossRef] [Green Version]
  16. Li, Z.; Chen, H.; White, J.C.; Wulder, M.A.; Hermosilla, T. Discriminating treed and non-treed wetlands in boreal ecosystems using time series Sentinel-1 data. Int. J. Appl. Earth Obs. Geoinf. 2020, 85, 102007. [Google Scholar] [CrossRef]
  17. Endo, Y.; Halabisky, M.; Moskal, L.M.; Koshimura, S. Wetland Surface Water Detection from Multipath SAR Images Using Gaussian Process-Based Temporal Interpolation. Remote Sens. 2020, 12, 1756. [Google Scholar] [CrossRef]
  18. Verhulst, N.; Govaerts, B.; Sayre, K.D.; Deckers, J.; François, I.M.; Dendooven, L. Using NDVI and soil quality analysis to assess influence of agronomic management on within-plot spatial variability and factors limiting production. Plant Soil 2009, 317, 41–59. [Google Scholar] [CrossRef]
  19. Mleczko, M.; Mróz, M. Wetland Mapping Using SAR Data from the Sentinel-1A and TanDEM-X Missions: A Comparative Study in the Biebrza Floodplain (Poland). Remote Sens. 2018, 10, 78. [Google Scholar] [CrossRef] [Green Version]
  20. Kaplan, G.; Avdan, U. Mapping and monitoring wetlands using Sentinel-2 satellite imagery. ISPRS Ann. Photogramm. Remote Sens. Spatial Inf. Sci. 2017, IV-4/W4, 271–277. [Google Scholar] [CrossRef] [Green Version]
  21. Pulvirenti, L.; Squicciarino, G.; Fiori, E.; Fiorucci, P.; Ferraris, L.; Negro, D.; Gollini, A.; Severino, M.; Puca, S. An Automatic Processing Chain for Near Real-Time Mapping of Burned Forest Areas Using Sentinel-2 Data. Remote Sens. 2020, 12, 674. [Google Scholar] [CrossRef] [Green Version]
  22. Madruga de Brito, M.; Kuhlicke, C.; Marx, A. Near-real-time drought impact assessment: A text mining approach on the 2018/19 drought in Germany. Environ. Res. Lett. 2020, 15, 1040a9. [Google Scholar] [CrossRef]
  23. Le Page, M.; Toumi, J.; Khabba, S.; Hagolle, O.; Tavernier, A.; Kharrou, M.; Er-Raki, S.; Huc, M.; Kasbani, M.; Moutamanni, A.; et al. A Life-Size and Near Real-Time Test of Irrigation Scheduling with a Sentinel-2 Like Time Series (SPOT4-Take5) in Morocco. Remote Sens. 2014, 6, 11182–11203. [Google Scholar] [CrossRef] [Green Version]
  24. Kempf, M. Modelling multivariate landscape affordances and functional ecosystem connectivity in landscape archaeology. Archaeol. Anthropol. Sci. 2020, 12. [Google Scholar] [CrossRef]
  25. Caballero, I.; Ruiz, J.; Navarro, G. Sentinel-2 Satellites Provide Near-Real Time Evaluation of Catastrophic Floods in the West Mediterranean. Water 2019, 11, 2499. [Google Scholar] [CrossRef] [Green Version]
  26. Wieland, M.; Martinis, S. Large-scale surface water change observed by Sentinel-2 during the 2018 drought in Germany. Int. J. Remote Sens. 2020, 41, 4742–4756. [Google Scholar] [CrossRef]
  27. Vrieling, A.; Meroni, M.; Darvishzadeh, R.; Skidmore, A.K.; Wang, T.; Zurita-Milla, R.; Oosterbeek, K.; O’Connor, B.; Paganini, M. Vegetation phenology from Sentinel-2 and field cameras for a Dutch barrier island. Remote Sens. Environ. 2018, 215, 517–529. [Google Scholar] [CrossRef]
  28. Malenovský, Z.; Rott, H.; Cihlar, J.; Schaepman, M.E.; García-Santos, G.; Fernandes, R.; Berger, M. Sentinels for science: Potential of Sentinel-1, -2, and -3 missions for scientific observations of ocean, cryosphere, and land. Remote Sens. Environ. 2012, 120, 91–101. [Google Scholar] [CrossRef]
  29. Chrysafis, I.; Mallinis, G.; Siachalou, S.; Patias, P. Assessing the relationships between growing stock volume and Sentinel-2 imagery in a Mediterranean forest ecosystem. Remote Sens. Lett. 2017, 8, 508–517. [Google Scholar] [CrossRef]
  30. Ansper, A.; Alikas, K. Retrieval of Chlorophyll a from Sentinel-2 MSI Data for the European Union Water Framework Directive Reporting Purposes. Remote Sens. 2019, 11, 64. [Google Scholar] [CrossRef] [Green Version]
  31. Abate, N.; Elfadaly, A.; Masini, N.; Lasaponara, R. Multitemporal 2016-2018 Sentinel-2 Data Enhancement for Landscape Archaeology: The Case Study of the Foggia Province, Southern Italy. Remote Sens. 2020, 12, 1309. [Google Scholar] [CrossRef] [Green Version]
  32. Hari, V.; Rakovec, O.; Markonis, Y.; Hanel, M.; Kumar, R. Increased future occurrences of the exceptional 2018–2019 Central European drought under global warming. Sci. Rep. 2020, 10, 382. [Google Scholar] [CrossRef]
  33. Glaser, R.; Kahle, M. Reconstructions of droughts in Germany since 1500–combining hermeneutic information and instrumental records in historical and modern perspectives. Clim. Past 2020, 16, 1207–1222. [Google Scholar] [CrossRef]
  34. Stork, M.; Menzel, L. Analysis and simulation of the water and energy balance of intense agriculture in the Upper Rhine valley, south-west Germany. Environ. Earth Sci. 2016, 75, 57. [Google Scholar] [CrossRef]
  35. Martin, B.; Giacona, F.; Furst, B.; Edelblutte, C.; Holleville, N.; With, L.; Heitz, C.; Glaser, R.; Himmelsbach, I.; Schönbein, J.; et al. La variabilité spatio-temporelle des inondations dans le Fossé rhénan à la lumière de l’évolution de la vulnérabilité. VertigO La revue électronique en sciences de l’environnement 2017, 17. [Google Scholar] [CrossRef]
  36. Kempf, M. Fables of the past: Landscape (Re-)constructions and the Bias in the Data. Documenta Praehistorica. 2020. Available online: https://link.springer.com/article/10.1007/s12520-020-01127-w (accessed on 1 October 2020).
  37. Kempf, M. The designed landscape: Spatial concepts of human-environmental interactions in Early Medieval southern Germany. In Human-Made Environments-The Development of Landscapes as Resource Assemblages; Bartelheim, M., Garcia Sanjuan, L., Hardenberg, R., Eds.; University of Tübingen: Tübingen, Germany, 2021; (forthcoming). [Google Scholar]
  38. Koltzer, N.; Scheck-Wenderoth, M.; Cacace, M.; Frick, M.; Bott, J. Regional hydraulic model of the Upper Rhine Graben. Adv. Geosci. 2019, 49, 197–206. [Google Scholar] [CrossRef] [Green Version]
  39. Kempf, M. Paradigm and pragmatism: GIS-based spatial analyses of Roman infrastructure networks and land-use concepts in the Upper Rhine Valley. Geoarchaeology 2019, 74, 1–12. [Google Scholar] [CrossRef]
  40. Kempf, M. Migration or landscape fragmentation in Early Medieval eastern France? A case study from Niedernai. J. Archaeol. Sci. Rep. 2018, 21, 593–605. [Google Scholar] [CrossRef]
  41. Himmelsbach, I.; Glaser, R.; Schoenbein, J.; Riemann, D.; Martin, B. Reconstruction of flood events based on documentary data and transnational flood risk analysis of the Upper Rhine and its French and German tributaries since AD 1480. Hydrol. Earth Syst. Sci. 2015, 19, 4149–4164. [Google Scholar] [CrossRef] [Green Version]
  42. Himmelsbach, I.; Glaser, R.; Schoenbein, J.; Riemann, D.; Martin, B. Flood risk along the upper Rhine since AD 1480. Hydrol. Earth Syst. Sci. Discuss. 2015, 12, 177–211. [Google Scholar] [CrossRef]
  43. Giacona, F.; Martin, B.; Furst, B.; Glaser, R.; Eckert, N.; Himmelsbach, I.; Edelblutte, C.; Christiany, L. Improving the understanding of flood risk in the Alsatian region by knowledge capitalization: The ORRION participative observatory. Nat. Hazards Earth Syst. Sci. Discuss. 2018, 1–49. [Google Scholar] [CrossRef] [Green Version]
  44. Casper, M.C.; Vohland, M. Validation of a large scale hydrological model with data fields retrieved from reflective and thermal optical remote sensing data–A case study for the Upper Rhine Valley. Phys. Chem. Earth 2008, 17–18, 1061–1067. [Google Scholar] [CrossRef]
  45. Haidu, I.; Nistor, M.-M. Groundwater vulnerability assessment in the Grand Est region, France. Quat. Int. 2019. [Google Scholar] [CrossRef]
  46. Menzies, J.; Ellwanger, D. Climate and paleo-environmental change within the Mannheim Formation near Heidelberg, Upper Rhine Valley, Germany: A case study based upon microsedimentological analyses. Quat. Int. 2015, 386, 137–147. [Google Scholar] [CrossRef]
  47. Kempf, M. The application of GIS and satellite imagery in archaeological land-use reconstruction: A predictive model? J. Archaeol. Sci. Rep. 2019, 25, 116–128. [Google Scholar] [CrossRef]
  48. Asselman, N.E.M.; Middelkoop, H.; van Dijk, P.M. The impact of changes in climate and land use on soil erosion, transport and deposition of suspended sediment in the River Rhine. Hydrol. Process. 2003, 17, 3225–3244. [Google Scholar] [CrossRef]
  49. Glaser, R. Klimageschichte Mitteleuropas. 1200 Jahre Wetter, Klima, Katastrophen, 3. Auflage; WBG Wissenschaftliche Buchgesellschaft: Darmstadt, Germany, 2013; ISBN 9783534261741. [Google Scholar]
  50. Erfurt, M.; Glaser, R.; Blauhut, V. Changing impacts and societal responses to drought in southwestern Germany since 1800. Reg. Environ. Chang. 2019, 19, 2311–2323. [Google Scholar] [CrossRef] [Green Version]
  51. Scholze, N.; Glaser, R.; Roy, S. Klimavulnerabilität von Unternehmen in der Metropolregion Oberrhein und ihre Visualisierung anhand von Wirkpfaden. Revue d‘Allemagne et Des pays de Langue Allemande 2018, 50, 325–335. [Google Scholar] [CrossRef] [Green Version]
  52. Riach, N.; Scholze, N.; Glaser, R.; Roy, S.; Stern, B. Klimawandel am Oberrhein: Ein Zweisprachiges Dossier mit 24 Karten und 6 Begleittexten/Changement Climatique Dans le Rhin Superieur: un Dossier Bilingue avec 24 Cartes et 6 textes D’accompagnement 2019. Available online: http://www.georhena.eu/de/Kartensammlung (accessed on 1 October 2020).
  53. Glaser, R.; Scholze, N.; Jergentz, S. Klimavulnerabilität. In Geographie: Physische Geographie und Humangeographie; Gebhardt, H., Glaser, R., Radtke, U., Reuber, P., Vött, A., Eds.; Springer: New York, NY, USA, 2020; pp. 324–330. [Google Scholar]
  54. Tischendorf, L.; Fahrig, L. How should we measure landscape connectivity? Landscape Ecol. 2000, 15, 633–641. [Google Scholar] [CrossRef]
  55. Tischendorf, L.; Fahrig, L. On the usage and measurement of landscape connectivity. Oikos 2000, 90, 7–19. [Google Scholar] [CrossRef] [Green Version]
  56. Taylor, K. Landscape and meaning: Context for a global discourse on cultural landscape values. In Managing Cultural Landscapes; Taylor, K., Lennon, J., Eds.; Routledge: London, UK, 2012; pp. 21–44. ISBN 9780415672252. [Google Scholar]
  57. Kempf, M. From landscape affordances to landscape connectivity: Contextualizing an archaeology of human ecology. Archaeol. Anthropol. Sci. 2020, 12, 310. [Google Scholar] [CrossRef]
  58. van Loon, A.F.; Stahl, K.; Di Baldassarre, G.; Clark, J.; Rangecroft, S.; Wanders, N.; Gleeson, T.; van Dijk, A.I.J.M.; Tallaksen, L.M.; Hannaford, J.; et al. Drought in a human-modified world: Reframing drought definitions, understanding, and analysis approaches. Hydrol. Earth Syst. Sci. 2016, 20, 3631–3650. [Google Scholar] [CrossRef] [Green Version]
  59. Renner, R.; Schneider, F.; Hohenwallner, D.; Kopeinig, C.; Kruse, S.; Lienert, J.; Link, S.; Muhar, S. Meeting the Challenges of Transdisciplinary Knowledge Production for Sustainable Water Governance. Mt. Res. Dev. 2013, 33, 234–247. [Google Scholar] [CrossRef] [Green Version]
  60. Kruse, S.; Seidl, I. Social capacities for drought risk management in Switzerland. Nat. Hazards Earth Syst. Sci. 2013, 13, 3429–3441. [Google Scholar] [CrossRef] [Green Version]
  61. Minářová, J.; Müller, M.; Clappier, A. Seasonality of mean and heavy precipitation in the area of the Vosges Mountains: Dependence on the selection criterion. Int. J. Climatol. 2017, 37, 2654–2666. [Google Scholar] [CrossRef]
  62. Minářová, J.; Müller, M.; Clappier, A.; Kašpar, M. Characteristics of extreme precipitation in the Vosges Mountains region (north-eastern France). Int. J. Climatol 2017, 37, 4529–4542. [Google Scholar] [CrossRef]
  63. Hellwig, J.; Graaf, I.E.M.d.; Weiler, M.; Stahl, K. Large-Scale Assessment of Delayed Groundwater Responses to Drought. Water Resour. Res. 2020, 56. [Google Scholar] [CrossRef] [Green Version]
  64. Erfurt, M.; Skiadaresis, G.; Tijdeman, E.; Blauhut, V.; Bauhus, J.; Glaser, R.; Schwarz, J.; Tegel, W.; Stahl, K. Exploring the added value of a long-term multidisciplinary dataset in drought research–a drought catalogue for southwestern Germany dating back to 1801. Nat. Hazards Earth Syst. Sci. Discuss. 2020. [Google Scholar] [CrossRef] [Green Version]
  65. Averbeck, P.; Frör, O.; Gartiser, N.; Lützel, N.; Rudolf, F. Climate change preparedness of enterprises in the Upper Rhine region from a business perspective—A multidisciplinary, transboundary analysis. NachhaltigkeitsManagementForum 2019, 27, 83–93. [Google Scholar] [CrossRef] [Green Version]
  66. Preusser, F.; May, J.-H.; Eschbach, D.; Trauerstein, M.; Schmitt, L. Infrared stimulated luminescence dating of 19th century fluvial deposits from the upper Rhine River. Geochronometria 2016, 43, 131–142. [Google Scholar] [CrossRef] [Green Version]
  67. Preusser, F. Characterisation and evolution of the River Rhine system. Neth. J. Geosci. 2008, 87, 7–19. [Google Scholar] [CrossRef] [Green Version]
  68. Lehmkuhl, F.; Zens, J.; Krauß, L.; Schulte, P.; Kels, H. Loess-paleosol sequences at the northern European loess belt in Germany: Distribution, geomorphology and stratigraphy. Quat. Sci. Rev. 2016, 153, 11–30. [Google Scholar] [CrossRef]
  69. Schmitt, L.; Maire, G.; Nobelis, P.; Humbert, J. Quantitative morphodynamic typology of rivers: A methodological study based on the French Upper Rhine basin. Earth Surf. Process. Landf. 2007, 32, 1726–1746. [Google Scholar] [CrossRef]
  70. Przyrowski, R.; Schäfer, A. Quaternary fluvial basin of northern Upper Rhine Graben. Zeitschrift der Dtsch. Ges. für Geowiss. 2015, 166, 71–98. [Google Scholar] [CrossRef]
  71. Carbiener, R.; Schnitzler, A. Evolution of major pattern models and processes of alluvial forest of the Rhine in the rift valley (France/Germany). Vegetatio 1990, 88, 115–129. [Google Scholar] [CrossRef]
  72. Martin, B.; Himmelsbach, I.; Glaser, R.; With, L.; Guerrouah, O. French–German flood risk geohistory in the Rhine Graben. International Disaster Risk Conference, Davos 2010. hal-00530788. Available online: https://halshs.archives-ouvertes.fr/hal-00530788/ (accessed on 1 October 2020).
  73. Mischka, D. Methodische Aspekte zur Rekonstruktion prähistorischer Siedlungsmuster. Landschaftsgenese vom Ende des Neolithikums bis zur Eisenzeit im Gebiet des südlichen Oberrheins; Zugl.: Freiburg (Breisgau), Univ., Diss., 2004; Leidorf: Rahden, Westfalen, Germany, 2007; ISBN 9783896467935. Available online: https://journals.ub.uni-heidelberg.de/index.php/bjb/article/view/36130 (accessed on 1 October 2020).
  74. Koehler, H.; Angevin, R.; Bignon-Lau, O.; Griselin, S. Découverte de plusieurs occupations du Paléolithique supérieur récent dans le Sud de l’Alsace. Bulletin de la Société Préhistorique Française 2013, 110, 356–359. [Google Scholar] [CrossRef]
  75. Faustmann, A.C. Besiedlungswandel im südlichen Oberrheingebiet von der Römerzeit bis zum Mittelalter; Zugl.: Freiburg (Breisgau) Univ., Diss., 2005; Leidorf: Rahden, Westfalen, Germany, 2007; ISBN 9783896467706. Available online: https://www.vml.de/d/detail.php?ISBN=978-3-89646-770-6&hl=faustmann (accessed on 1 October 2020).
  76. Brönnimann, D.; Wimmer, J.; Müller-Kissing, M.; Stopp, B.; Rissanen, H.; Spichtig, N. One man’s trash is another man’s treasure. Interdisciplinary examination of taphonomic aspects of ceramic sherds, animal bones and sediments from the La Tène period settlement at Basel-Gasfabrik. PLoS ONE 2020, 15, e0236272. [Google Scholar] [CrossRef] [PubMed]
  77. Blöck, L.A. Die römerzeitliche Besiedlung im Rechten Südlichen Oberrheingebiet; Dissertation; Dr. Ludwig Reichert Verlag: Wiesbaden, Germany, 2016; ISBN 9783954902156. [Google Scholar]
  78. Mäckel, R.; Schneider, R.; Seidel, J. Anthropogenic Impact on the Landscape of Southern Badenia (Germany) During the Holocene—Documented by Colluvial and Alluvial Sediments. Archaeometry 2003, 45, 487–501. [Google Scholar] [CrossRef]
  79. Mäckel, R.; Schneider, R.; Friedmann, A.; Seidel, J. Environmental changes and human impact on the relief development in the Upper Rhine valley and Black Forest (South-West germany) during the Holocene. Zeitschrift für Geomorphologie N.F. 2002, 2002, 31–45. [Google Scholar]
  80. Lang, A.; Bork, H.-R.; Mäckel, R.; Preston, N.; Wunderlich, J.; Dikau, R. Changes in sediment flux and storage within a fluvial system: Some examples from the Rhine catchment. Hydrol. Process. 2003, 17, 3321–3334. [Google Scholar] [CrossRef]
  81. Frings, R.M.; Gehres, N.; Promny, M.; Middelkoop, H.; Schüttrumpf, H.; Vollmer, S. Today’s sediment budget of the Rhine River channel, focusing on the Upper Rhine Graben and Rhenish Massif. Geomorphology 2014, 204, 573–587. [Google Scholar] [CrossRef]
  82. Mariet, A.-L.; Walter-Simonnet, A.-V.; Gimbert, F.; Cloquet, C.; Bégeot, C. High-temporal resolution landscape changes related to anthropogenic activities over the past millennium in the Vosges Mountains (France). Ambio 2018, 47, 893–907. [Google Scholar] [CrossRef]
  83. Mariet, A.-L.; Bégeot, C.; Gimbert, F.; Gauthier, J.; Fluck, P.; Walter-Simonnet, A.-V. Past mining activities in the Vosges Mountains (eastern France): Impact on vegetation and metal contamination over the past millennium. Holocene 2016, 26, 1225–1236. [Google Scholar] [CrossRef]
  84. Koerner, W.; Dupouey, J.L.; Dambrine, E.; Benoit, M. Influence of Past Land Use on the Vegetation and Soils of Present Day Forest in the Vosges Mountains, France. J. Ecol. 1997, 85, 351–358. [Google Scholar] [CrossRef]
  85. Wetter, O.; Pfister, C.; Weingartner, R.; Luterbacher, J.; Reist, T.; Trösch, J. The largest floods in the High Rhine basin since 1268 assessed from documentary and instrumental evidence. Hydrol. Sci. J. 2011, 56, 733–758. [Google Scholar] [CrossRef]
  86. Metzger, A.; Jacob-Rousseau, N. The 1857–1858 drought in Alsace: From water shortage to a socio-political extreme event. Reg. Environ. Chang. 2020, 20, 195. [Google Scholar] [CrossRef]
  87. Tenaillon, M.I.; Charcosset, A. A European perspective on maize history. C. R. Biol. 2011, 334, 221–228. [Google Scholar] [CrossRef] [PubMed]
  88. Hölker, A.C.; Schipprack, W.; Utz, H.F.; Molenaar, W.S.; Melchinger, A.E. Progress for testcross performance within the flint heterotic pool of a public maize breeding program since the onset of hybrid breeding. Euphytica 2019, 215, 435. [Google Scholar] [CrossRef]
  89. Dubreuil, P.; Warburton, M.; Chastanet, M.; Hoisington, D.; Charcosset, A. More on the introduction of temperate maize into Europe: Large-scale bulk SSR genotyping and new historical elements. Maydica 2006, 51, 281–291. [Google Scholar]
  90. Brauner, P.C.; Schipprack, W.; Utz, H.F.; Bauer, E.; Mayer, M.; Schön, C.-C.; Melchinger, A.E. Testcross performance of doubled haploid lines from European flint maize landraces is promising for broadening the genetic base of elite germplasm. Theor. Appl. Genet. 2019, 132, 1897–1908. [Google Scholar] [CrossRef] [PubMed]
  91. Mirschel, W.; Berg-Mohnicke, M.; Wieland, R.; Wenkel, K.-O.; Terleev, V.V.; Topaj, A.; Mueller, L. Modelling and Simulation of Agricultural Landscapes. In Landscape Modelling and Decision Support; Mirschel, W., Terleev, V.V., Wenkel, K.-O., Eds.; Springer: Cham, Switzerland, 2020; pp. 3–21. ISBN 978-3-030-37420-4. [Google Scholar]
  92. Huynh, H.T.; Hufnagel, J.; Wurbs, A.; Bellingrath-Kimura, S.D. Influences of soil tillage, irrigation and crop rotation on maize biomass yield in a 9-year field study in Müncheberg, Germany. Field Crops Res. 2019, 241, 107565. [Google Scholar] [CrossRef]
  93. DMK. Karten zum Maisanbau. Available online: https://www.maiskomitee.de/Fakten/Statistik/Deutschland/Maisanbau (accessed on 1 October 2020).
  94. DWD. Monatliche, saisonale und jährliche Bewertung mit der Analyse des Klima- und Witterungsverlaufs: April-Juli 2020. Available online: https://www.dwd.de/DE/klimaumwelt/klimaueberwachung/deutschland/brdmap_ubr_text_aktl_zz.html (accessed on 1 October 2020).
  95. Cleveland, W.S. Robust Locally Weighted Regression and Smoothing Scatterplots. J. Am. Stat. Assoc. 1979, 74, 829–836. [Google Scholar] [CrossRef]
  96. Fick, S.E.; Hijmans, R.J. WorldClim 2: New 1-km spatial resolution climate surfaces for global land areas. Int. J. Climatol. 2017, 37, 4302–4315. [Google Scholar] [CrossRef]
  97. Veloso, A.; Mermoz, S.; Bouvet, A.; Le Toan, T.; Planells, M.; Dejoux, J.-F.; Ceschia, E. Understanding the temporal behavior of crops using Sentinel-1 and Sentinel-2-like data for agricultural applications. Remote Sens. Environ. 2017, 199, 415–426. [Google Scholar] [CrossRef]
  98. Cuba, N.; Rogan, J.; Lawrence, D.; Williams, C. Cross-Scale Correlation between In Situ Measurements of Canopy Gap Fraction and Landsat-Derived Vegetation Indices with Implications for Monitoring the Seasonal Phenology in Tropical Forests Using MODIS Data. Remote Sens. 2018, 10, 979. [Google Scholar] [CrossRef] [Green Version]
  99. Schultz, M.; Clevers, J.G.P.W.; Carter, S.; Verbesselt, J.; Avitabile, V.; Quang, H.V.; Herold, M. Performance of vegetation indices from Landsat time series in deforestation monitoring. Int. J. Appl. Earth Obs. Geoinf. 2016, 52, 318–327. [Google Scholar] [CrossRef]
  100. Huete, A.R. A soil-adjusted vegetation index (SAVI). Remote Sens. Environ. 1988, 25, 295–309. [Google Scholar] [CrossRef]
  101. Stroppiana, D.; Boschetti, M.; Azar, R.; Barbieri, M.; Collivignarelli, F.; Gatti, L.; Fontanelli, G.; Busetto, L.; Holecz, F. In-season early mapping of rice area and flooding dynamics from optical and SAR satellite data. Eur. J. Remote Sens. 2019, 52, 206–220. [Google Scholar] [CrossRef] [Green Version]
  102. Chandna, P.K.; Mondal, S. Analyzing multi-year rice-fallow dynamics in Odisha using multi-temporal Landsat-8 OLI and Sentinel-1 Data. GIScience Remote Sens. 2020, 57, 431–449. [Google Scholar] [CrossRef]
  103. Cao, H.; Zhang, H.; Wang, C.; Zhang, B. Operational Flood Detection Using Sentinel-1 SAR Data over Large Areas. Water 2019, 11, 786. [Google Scholar] [CrossRef] [Green Version]
  104. Tucker, C.J. Red and Photographic Infrared Linear Combinations for Monitoring Vegetation. Remote Sens. Environ. 1979, 8, 127–150. [Google Scholar] [CrossRef] [Green Version]
  105. Peters, A.J.; Walter-Shea, E.A.; Ji, L.; Viña, A.; Hayes, M.; Svoboda, M.D. Drought Monitoring with NDVI-Based Standardized Vegetation Index. Photgramm. Eng. Remote Sens. 2002, 68, 71–75. [Google Scholar]
  106. Roy, D.P.; Kovalskyy, V.; Zhang, H.K.; Vermote, E.F.; Yan, L.; Kumar, S.S.; Egorov, A. Characterization of Landsat-7 to Landsat-8 reflective wavelength and normalized difference vegetation index continuity. Remote Sens. Environ. 2016, 185, 57–70. [Google Scholar] [CrossRef] [PubMed] [Green Version]
  107. Xu, D. Compare NDVI Extracted from Landsat 8 Imagery with that from Landsat 7 Imagery. AJRS 2014, 2, 10. [Google Scholar] [CrossRef] [Green Version]
  108. Schuldt, B.; Buras, A.; Arend, M.; Vitasse, Y.; Beierkuhnlein, C.; Damm, A.; Gharun, M.; Grams, T.E.E.; Hauck, M.; Hajek, P.; et al. A first assessment of the impact of the extreme 2018 summer drought on Central European forests. Basic Appl. Ecol. 2020, 45, 86–103. [Google Scholar] [CrossRef]
  109. Boergens, E.; Güntner, A.; Dobslaw, H.; Dahle, C. Quantifying the Central European Droughts in 2018 and 2019 With GRACE Follow-On. Geophys. Res. Lett. 2020, 47, 1672. [Google Scholar] [CrossRef]
  110. DWD. Aktuelle Phänologie: Mais: Mais: Blühbeginn, Bestellung, Silage-Ernte Baden Württemberg 2019. Available online: https://www.dwd.de/DE/leistungen/phaeno_akt/phaenoakt.html#buehneTop (accessed on 1 October 2020).
  111. Pfister, C.; Weingartner, R.; Luterbacher, J. Hydrological winter droughts over the last 450 years in the Upper Rhine basin: A methodological approach. Hydrol. Sci. J. 2006, 51, 966–985. [Google Scholar] [CrossRef] [Green Version]
  112. Junghans, N.; Cullmann, J.; Huss, M. Evaluating the Effect of Snow and Ice Melt in an Alpine Headwater Catchment and Further Downstream in the River Rhine. Hydrol. Sci. J. 2011, 56, 981–993. [Google Scholar] [CrossRef]
  113. LUBW. Zustandsbericht über die Grundwasservorräte: Juli 2020. Available online: https://guq.lubw.baden-wuerttemberg.de/GuQWeb.dll/p79197.html (accessed on 1 October 2020).
  114. Bavay, M.; Grünewald, T.; Lehning, M. Response of snow cover and runoff to climate change in high Alpine catchments of Eastern Switzerland. Adv. Water Resour. 2013, 55, 4–16. [Google Scholar] [CrossRef]
  115. DWD. Aktuelle Phänologie Apfel: Blühbeginn: Apfel Blühbeginn, mittlere Beobachtungstermine in Deutschland. Available online: https://www.dwd.de/DE/leistungen/phaeno_akt/phaenoakt.html#buehneTop (accessed on 1 October 2020).
  116. Jansen, V.; Kolden, C.; Schmalz, H. The Development of Near Real-Time Biomass and Cover Estimates for Adaptive Rangeland Management Using Landsat 7 and Landsat 8 Surface Reflectance Products. Remote Sens. 2018, 10, 1057. [Google Scholar] [CrossRef] [Green Version]
  117. Flood, N. Comparing Sentinel-2A and Landsat 7 and 8 Using Surface Reflectance over Australia. Remote Sens. 2017, 9, 659. [Google Scholar] [CrossRef] [Green Version]
  118. Bolton, D.K.; Gray, J.M.; Melaas, E.K.; Moon, M.; Eklundh, L.; Friedl, M.A. Continental-scale land surface phenology from harmonized Landsat 8 and Sentinel-2 imagery. Remote Sens. Environ. 2020, 240, 111685. [Google Scholar] [CrossRef]
  119. Gosh, S.; Behera, D.; Jayakumar, S.; Das, P. Comparison of Sentinel-2 Multispectral Imager (MSI) and Landsat 8 Operational Land Imager (OLI) for Vegetation Monitoring. In Spatial Modeling in Forest Resources Management: Rural Livelihood and Sustainable Development; Shit, P.K., Pourghasemi, H.R., Das, P., Bhunia, G.S., Eds.; Springer Nature: Cham, Switzerland, 2020; pp. 175–192. ISBN 978-3-030-56542-8. [Google Scholar]
  120. Guo, Y.; Wang, C.; Lei, S.; Yang, J.; Zhao, Y. A Framework of Spatio-Temporal Fusion Algorithm Selection for Landsat NDVI Time Series Construction. IJGI 2020, 9, 665. [Google Scholar] [CrossRef]
  121. Parizi, E.; Hosseini, S.M.; Ataie-Ashtiani, B.; Simmons, C.T. Normalized difference vegetation index as the dominant predicting factor of groundwater recharge in phreatic aquifers: Case studies across Iran. Sci. Rep. 2020, 10, 17473. [Google Scholar] [CrossRef]
Figure 1. Study area (URG, black polygon) and location of the trans-national case study (black rectangle) with Corine Landcover data (CLC 2018). Red polygons show the larger settlements and urban areas in the Upper Rhine Area (URA). The fluvial system is controlled by the south-north running river Rhine and the tributaries in the French (blue) and German (grey) part of the region.
Water 12 03298 g001
Figure 2. Extensive summer irrigation (31 July 2020) on maize in the Upper Rhine Area at noon during a sunny day (A) and low-altitude degradation of forest stands (spruce) in the western part of the Vosges Mountains at Contz-les-Bains (12 July 2020) (B). Intensive summer irrigation on maize and special crops (background) on 31 July 2020 (Tmax 38 °C) south-west of Freiburg (BaWue) (C) and frost damage in a beech forest stand at the Belchen (southern Black Forest) from 31 May 2020 (D). All images by the authors.
Water 12 03298 g002
Figure 3. Location of the comparison dataset, which is composed of forest stands, Alsatian cropland, and cropland in BaWue.
Water 12 03298 g003
Figure 4. Vegetation-cover monitoring workflow for a Sentinel-2 hyperspectral satellite image (sensing date 18 August 2019), 10 m spatial resolution in R (ch4), G (ch3), B (ch2), NIR (ch8). RGB and FCC (false color composite) subsets were plotted from the original data. Reflection characteristics of the red (ch4) and the near infrared (NIR, ch8) bands were used to generate the Normalized Difference Vegetation Index (NDVI). NDVI values were plotted against an unsupervised 10-class classification with 500 random iterations. Both plots visualize the strong differences in land-use strategies, condition of the physical vegetation, and irrigation activity in the western (France) and eastern (Germany) part of the Upper Rhine Area.
Water 12 03298 g004
Figure 5. Comparison dataset for July and early August 2000–2020 based on Landsat-7 and Landsat-8 satellite imagery. Forest stands show rather homogeneous reflectance characteristics with increasing fuzziness during the period 2018–2020. BaWue cropland behaves significantly fuzzy compared to the Alsace, which highlights the continuous and static crop cultivation strategy in the French part of the Upper Rhine Area. Landsat-7 and Landsat-8 show a general difference in NDVI value characteristics.
Water 12 03298 g005
Figure 6. NDVI thresholding and peak value model of CLC non irrigated arable land surfaces, 18 August 2019. The Alsace and the German part of the URA show significant differences in NDVI value distribution and frequency. The thresholding model of the maximum peak values (0.85–0.95) shows the extensive abundance of physically high vegetation performance in the Alsace. The German part shows small-scale land-use systems, less productive crop cultivation, and failure (total size of cropland, Alsace = 351.5 km², BaWue = 188.0 km²).
Water 12 03298 g006
Figure 7. Distribution of NDVI values in the study area plotted from the Sentinel-2 test data (18 August 2019). The total cropland area in the Alsace (3,515,079 km²) and in Baden-Württemberg (1,880,467 km²) is split into 25 NDVI classes ranging from −0.25–1. Both parts of the URA behave equally in spatial differentiation until NDVI class 20/21 where the Alsace begins to show increased spatial distribution of high NDVI values. The ratio (percent of total cropland) also increases, which excludes a mere spatial component of the value differences between the Alsace and BaWue.
Water 12 03298 g007
Figure 8. NDVI times series from 19 July 2018, 9 July 2019, and 23 July 2020 showing strong regional differences in plant species physical conditions. In the image from the 19 July 2018, cloud coverage deriving from emitted water vapor of the nuclear power plant at Fessenheim (Alsace) has been removed. All artificial built-up, roads, railway tracks, water courses, and water surfaces were buffered and removed from the data to minimize NDVI value falsification.
Water 12 03298 g008
Figure 9. Groundwater fluctuations in the Upper Rhine Area modeled for two piezometer stations in the Alsace (Holtzwihr, Hettenschlag) over the measurement series 1 January 1995–31 July 2020. The daily measurements (grey line) were smoothed using R software and a local regression scatterplot smoothing algorithm (LOESS) with the parameters 0.15 (blue line), 1 (dashed red line), and 0.3 (green line). The period 1 January 2018–31 July 2020 is displayed in detail to visualize the current trend in groundwater level decrease during the subsequent drought years 2018, 2019, and 2020 in the study area. Mean values for both stations indicate the general trend in groundwater lowering in the URA (red line is the mean value; the dashed red line is the long-term trend). The map shows the distribution of the measurement stations in the case study area. Colmar has the lowest precipitation record in the URA (550 mm/year).
Water 12 03298 g009
Figure 10. Groundwater level changes at six stations in Baden-Württemberg. Weekly groundwater data was plotted from 1 January 1995–31 July 2020 and for the period 1 January 2018–31 July 2020. The data was smoothed using a local regression smoothing operation with parameters 0.15, 0.3, and 1. All groundwater stations in Baden-Württemberg show severely declining values during July 2020 (data processed from LUBW 2020, last accessed 4 August 2020; additional data provided by Karin Burk and Michel Wingering (LUBW, Ref. 42, Karlsruhe).
Water 12 03298 g010
Table 1. Landsat-7, Landsat-8, and Sentinel-2 images, which were used to calculate the NDVI time series 2000–2020 and for monitoring the drought period monitoring during 2018–2020.
Landsat-7 scene-idWRS PathWRS RowDate
LE71950272000225EDC001952712/Aug/2000
LE71950272001227NSG001952715/Aug/2001
LE71960272002189NSG001962708/July/2002
LE71950272003217EDC021952705/Aug/2003
LE71950272004204ASN011952722/July/2004
LE71950272005222EDC001952710/Aug/2005
LE71960262006200ASN001962619/July/2006
LE71950272007196ASN001952715/July/2007
LE71960272008206ASN001962724/July/2008
LE71960262009208ASN001962627/July/2009
LE71960272010195ASN001962714/July/2010
LE71960272011214ASN001962702/Aug/2011
LE71960272012217ASN001962704/Aug/2012
Landsat-8 scene-idWRS PathWRS RowDate
LC08_L1TP_196027_20130714_20170503_01_T11962714/July/2013
LC08_L1TP_196027_20140717_20170421_01_T11962717/July/2014
LC08_L1TP_196027_20150704_20170407_01_T11962704/July/2015
LC08_L1TP_196027_20160706_20170323_01_T11962706/July/2016
LC08_L1TP_195027_20170718_20170727_01_T11952718/July/2017
LC08_L1TP_196027_20180712_20180717_01_T11962712/July/2018
LC08_L1TP_195027_20190724_20190801_01_T11952724/July/2019
LC08_L1TP_196027_20200701_20200708_01_T11962701/July/2020
Sentinel-2 tile-id Date
S2B_OPER_MSI_L2A_TL_SGS__20180719T145501_A007141_T32ULU_N02.0819/July/2018
S2A_OPER_MSI_L2A_TL_MPS__20190709T140909_A021126_T32ULU_N02.1309/July/2019
S2A_OPER_MSI_L2A_TL_MPS__20200723T142801_A026560_T32ULU_N02.1423/July/2020
Publisher’s Note: MDPI stays neutral with regard to jurisdictional claims in published maps and institutional affiliations.

