Article

Short-Term Impact of Tillage on Soil and the Hydrological Response within a Fig (Ficus Carica) Orchard in Croatia

1
Faculty of Agriculture, University of Zagreb, Svetosimunska 25, 10000 Zagreb, Croatia
2
Environmental Management Laboratory, Mykolas Romeris University, LT-08303 Vilnius, Lithuania
3
Department of Physical Geography and Bolin Centre for Climate Research, Stockholm University, SE-106 91 Stockholm, Sweden
4
Navarino Environmental Observatory, Costa Navarino, Navarino Dunes, 24001 Messinia, Greece
*
Author to whom correspondence should be addressed.
Water 2020, 12(11), 3295; https://doi.org/10.3390/w12113295
Submission received: 19 October 2020 / Revised: 16 November 2020 / Accepted: 18 November 2020 / Published: 23 November 2020
(This article belongs to the Special Issue Impact of Land-Use Changes on Surface Hydrology and Water Quality)

Abstract

:
Tillage is well known to have impacts on soil properties and hydrological responses. This work aims to study the short-term impacts of tillage (0–3 months) on soil and hydrological responses in fig orchards located in Croatia. Understanding the soil hydrological response in the study area is crucial for soil management due to frequent autumn floods. The hydrological response was investigated using rainfall simulation experiments (58 mm h−1, for 30 min, over 0.785 m2 plots). The results show that the bulk density was significantly higher 3 months after tillage than at 0 and 1 months. The water holding capacity and amount of soil organic matter decreased with time. The water runoff and phosphorous loss (P loss) increased over time. The sediment concentration (SC) was significantly higher 3 months after tillage than in the previous monitoring periods, while sediment loss (SL) and carbon loss (C loss) were significantly lower 0 months after tillage than 3 months after tillage. Overall, there was an increase in soil erodibility with time (high SC, SL, C loss, and P loss), attributed to the precipitation patterns that increase the soil water content and therefore the hydrological response. Therefore, sustainable agricultural practices are needed to avoid sediment translocation and to mitigate floods and land degradation.

1. Introduction

Historically, tillage has been used as a soil management practice for various reasons. In Mediterranean permanent plantations, tillage is often used to control weeds and prevent competition for water by undesirable plants [1,2]. Tillage reduces soil compaction temporarily [3], but with soil consolidation, soil compaction increases over time [4,5]. However, tillage has some detrimental impacts on soil properties and hydrological responses [6,7,8,9,10], enhancing land degradation [11], such as aggregate breaking and exposure to the air as aggregates entrap soil organic matter (SOM). Aggregate exposure to air increases microbial activity and mineralization, enhancing SOM losses through CO2 emissions [12,13,14]. For instance, tillage especially affects topsoil SOM [15], decreasing root biomass [16], water-extractable SOM [17] and nutrient availability (including soil phosphorous, P) [18,19]. Overall, tillage reduces soil quality [20].
Tillage alters the soil structure and decreases the aggregate size. Intensively tilled soils are more prone to consolidation, compaction, and surface crust [21]. Tillage induces temporal changes in the bulk density (BD), structure, and differential porosity, affecting hydrological properties [22,23,24,25,26]. Shortly after tillage, soils have a high water storage capacity, which decreases during re-compaction [27]. The soil pore system is modified by tillage, which creates large macro-pores that are temporally unstable and susceptible to compaction [28,29]. The hydrological response of tilled soils is tied to soil structure [16,19].
So far, the literature has shown that tillage strongly modifies the soil system and has residual effects in the following weeks [30]. In this context, it is clear that overland flow and erosion are tied to soil properties and their spatial and temporal variability [31,32,33,34]. Previous research focusing on soil erosion was carried out in cereal croplands [3,35], vineyards [11,31,36], and olive [37,38], avocado [39], citrus [40], almond [41], persimmon [42], apple [43], and apricot [44] orchards. Nevertheless, to our knowledge, no study has been carried out in fig orchards, which is an essential issue since these types of orchards are traditional crops in the Mediterranean region [45,46].
This study aims to assess the short-term impacts of tillage on soil properties and hydrological response in a fig orchard installed in young and underdeveloped soils with very high calcareous content. Therefore, the current work is highly novel and relevant for understanding the impact of tillage on land degradation in this type of soil.

2. Materials and Methods

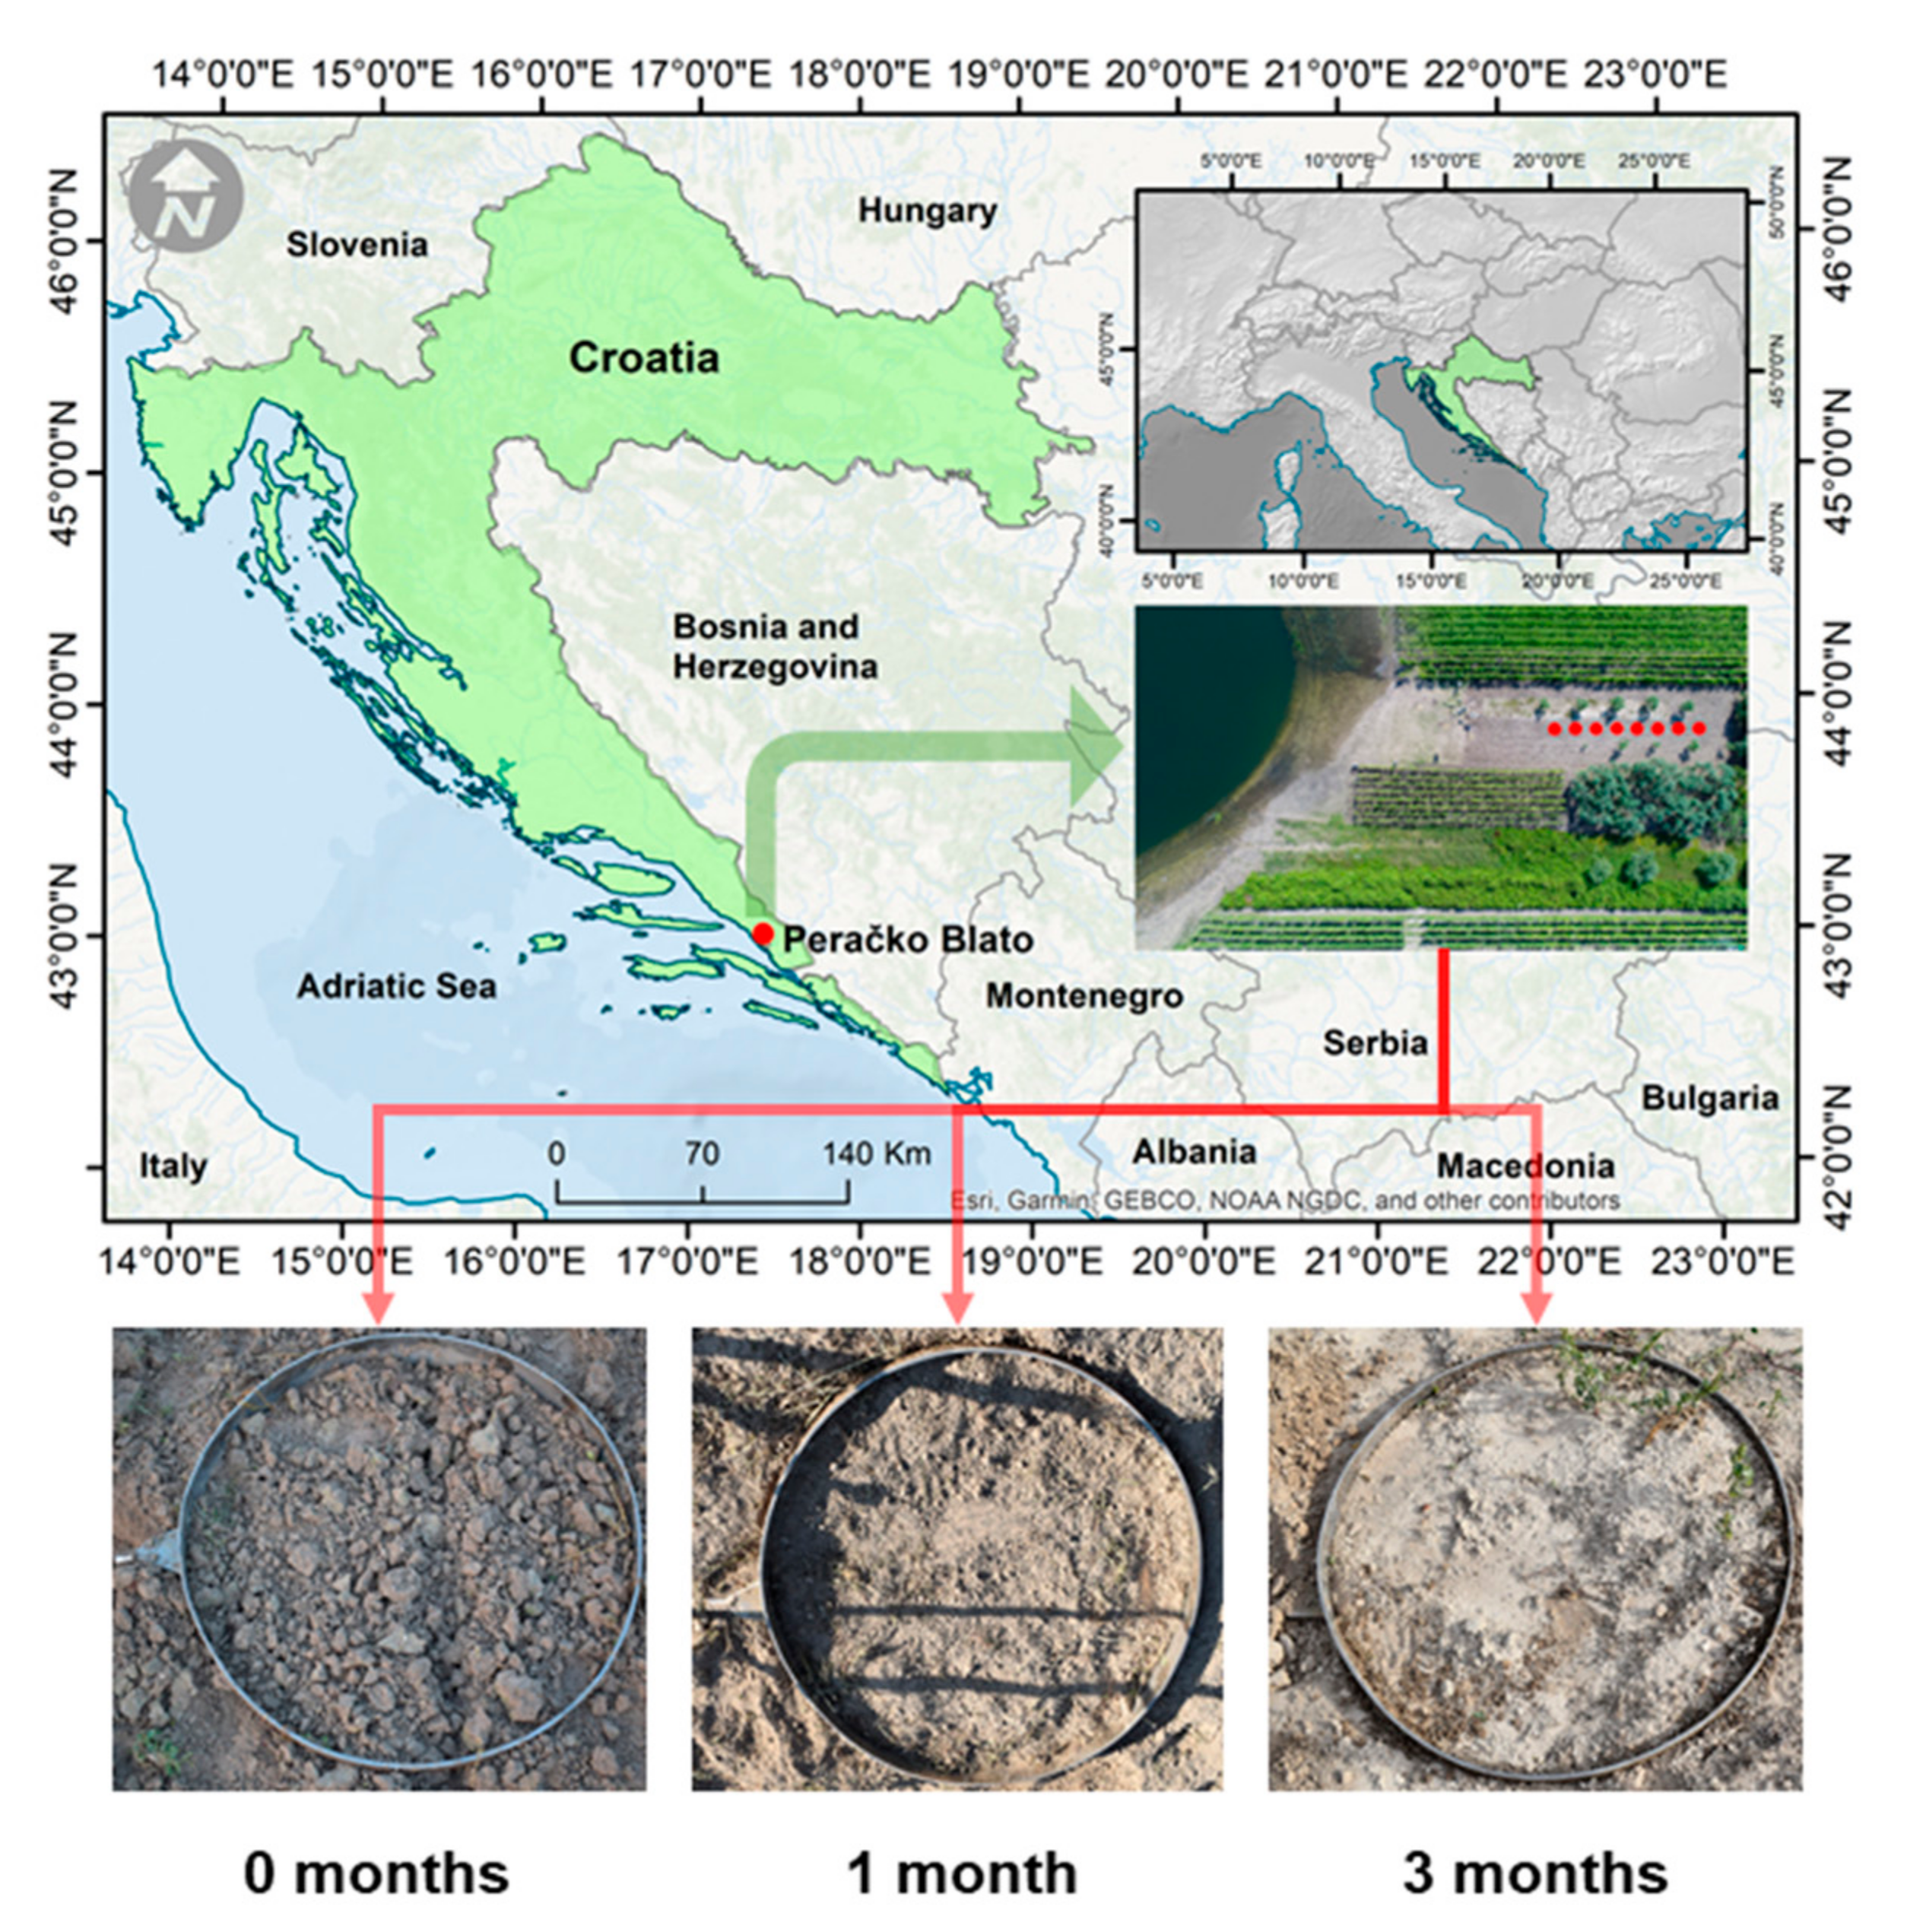
2.1. Study Area, Climate, and Soil Properties

The study area is located in Peračko Blato, Croatia (43°4′ N, 17°26′ E, average 7 m a.s.l.), and has an average slope of 5.5° (Figure 1). The climate is Mediterranean, with an average annual precipitation (1998–2018) of 1123.6 mm, and the intra-annual differences range between July as the driest month (26.7 mm) and November as the wettest month (148.3 mm) (Figure 2). The average annual temperature is 16 °C, with the coldest weather in January (6.9 °C) and the warmest in July (26 °C) [47].
The soil in the study area is classified as a Calcic Fluvisol [48], developed on calcareous lake sediments with a high content of carbonates (>80%) and cation exchange capacity saturation (90% domination of exchangeable Ca2+). The general soil properties are summarized in Table 1. The research area was formerly under a freshwater lake, which was partially drained in 1912 when a tunnel connecting the lake with the sea was constructed. After the construction of this infrastructure, the lake water level was reduced by ~12 m. However, floods often affect the lands near the lakes in the autumn-winter period. The new areas uncovered by water were used for cropping vegetables, vines, olives, figs, and citrus.

2.2. Experimental Design, Treatments, Sampling, and Rainfall Simulations

Eight plots separated by 4 m were established in a 5-year-old fig (Ficus carica) orchard. The fig variety is Petrovača bijela, planted with a distance of 7 × 8 m. The plots had a similar slope (mean 5.5°) and north exposition. The fig orchard is managed with shallow rotation tillage (manually guided rotating spading machine) 2 times a year (spring and late summer or early fall) as a weeding method to a depth of 10 cm. No herbicide was applied in this orchard. All plant protection, soil management, and pomo-technical practices were performed manually without the use of machinery. Field experiments were carried out in 2018 during August (2 days after tillage—0 months), September (one month after tillage), and November (three months after tillage). During the experiments, the soil was bare. A set of rainfall experiments was carried out using a pressurized rainfall simulator (UGT Rainmaker, Müncheberg, Germany), previously calibrated using a plastic vessel of known dimensions. Rainfall simulations were 30 min long, with the rainfall intensity set to 58 mm h−1 because 93% of the annual soil loss was measured in a single rainstorm event at a rainfall intensity of 59 mm h−1 [31]. Before the simulations, undisturbed soil samples (0–10 cm) and soil core samples (0–10 cm) were taken in the vicinity of each plot. To enclose the plot catchment area, a metal ring (0.785 m2) with a faucet was stuck 5 cm into the soil with the faucet facing downslope. At the end of the faucet, a plastic canister was connected to collect the overland flow. During each simulation, the time to ponding (TP) and time to runoff (TR) were measured using a chronometer. The experimental rainfall events were performed in August 2018, 2 days after shallow rotational tillage management (0 months). The measurements in September and November were performed in the same orchard 1 and 3 months after tillage. In each rainfall experiment, the catchment area was established in the vicinity of the previous measurement area (2 m).

2.3. Laboratory Analyses

The soil water content (SWC), bulk density (BD), and water holding capacity (WHC) were analysed according to the soil core method (weighting, wetting, and drying) [49]. For the undisturbed soil samples, we followed soil structure assessment preparation guidelines, according to Diaz-Zorita et al. [50]. Samples were carefully manipulated by hand, ensuring that the formed aggregates were not broken. During this preparation, all stones, roots, and other non-soil fragments were removed. Following aggregate separation, the samples were air-dried in the greenhouse at ~30 °C for 3 days and sieved with an auto-sieve shaker for 30 seconds [46] to separate particle fractions with diameters >8, 5, 4, 2, 1, 0.5, 0.25 and <0.25 mm. After weighing, the mean weight diameter (MWD) was determined using the following equation:
i = 1 n x i   × w i
where “xi is the mean diameter of any particular size range of aggregates separated by sieving, and wi is the weight of aggregates in that size range, as a fraction of the total dry weight of soil used” [51]. The 1–2 mm fraction was separated after weighing for water-stable aggregate (WSA) analyses, while the rest of the sample was milled and passed through a 2 mm sieve in preparation for chemical analyses. The WSAs were determined on Eijkelkamp’s wet sieving apparatus following Kemper and Rosenau [52]. The chemical analyses were performed as follows: SOM using the Walkley and Black [53] method and soil and sediment available P (P2O5) by the ammonium lactate (AL) method [54].
Canisters filled with the overland flow were weighed, and the sediment was filtered through filter paper (0.45 microns) to calculate the mass of sediment loss (SL) after air drying for 72 h. The sediment mass was subtracted from the mass of the overland flow to obtain the water runoff (WR). The sediment concentration (SC) was calculated by dividing the mass of the sediment by the mass of the water in overland flow. Data were converted to g L−1. Sediments collected from the filter paper were finely milled and passed through a 2 mm sieve to evaluate carbon loss (C loss) and P loss. C in sediments was measured using dry combustion with an Elementar Vario Macro CHNS analyser.

2.4. Data Analyses

Data normality and homogeneity of the variances were assessed using Shapiro–Wilk and Levene’s tests, respectively. Data were considered a normal distribution, and heteroscedasticity was considered at p > 0.05. Natural logarithm (Ln), logarithm (log), and Box Cox (BC) were applied to normalize the data (SWC, WSA, P2O5, TP, SC, SL, C loss, and P loss). Except for the SWC and WSA, all other variables followed a normal distribution after BC transformation. One-way analysis of variance (ANOVA) was applied to identify significant differences between sampling dates. In the case of SWC and WSA, the non-parametric Kruskal–Wallis ANOVA test was applied. In the figures, the original data are shown. If significant differences were observed at p < 0.05, a Tukey Least Significant Difference (LSD) post hoc test was applied to identify differences within treatments. In the case of SWC and WSA, a multiple comparison mean rank test was applied. Principal component analysis (PCA) based on the correlation matrix was performed using BC transformed datasets. No rotational procedures were applied. Statistical analysis was carried out using Statistica 12.0. Graphical representation of the results was performed using Plotly software [55].

3. Results

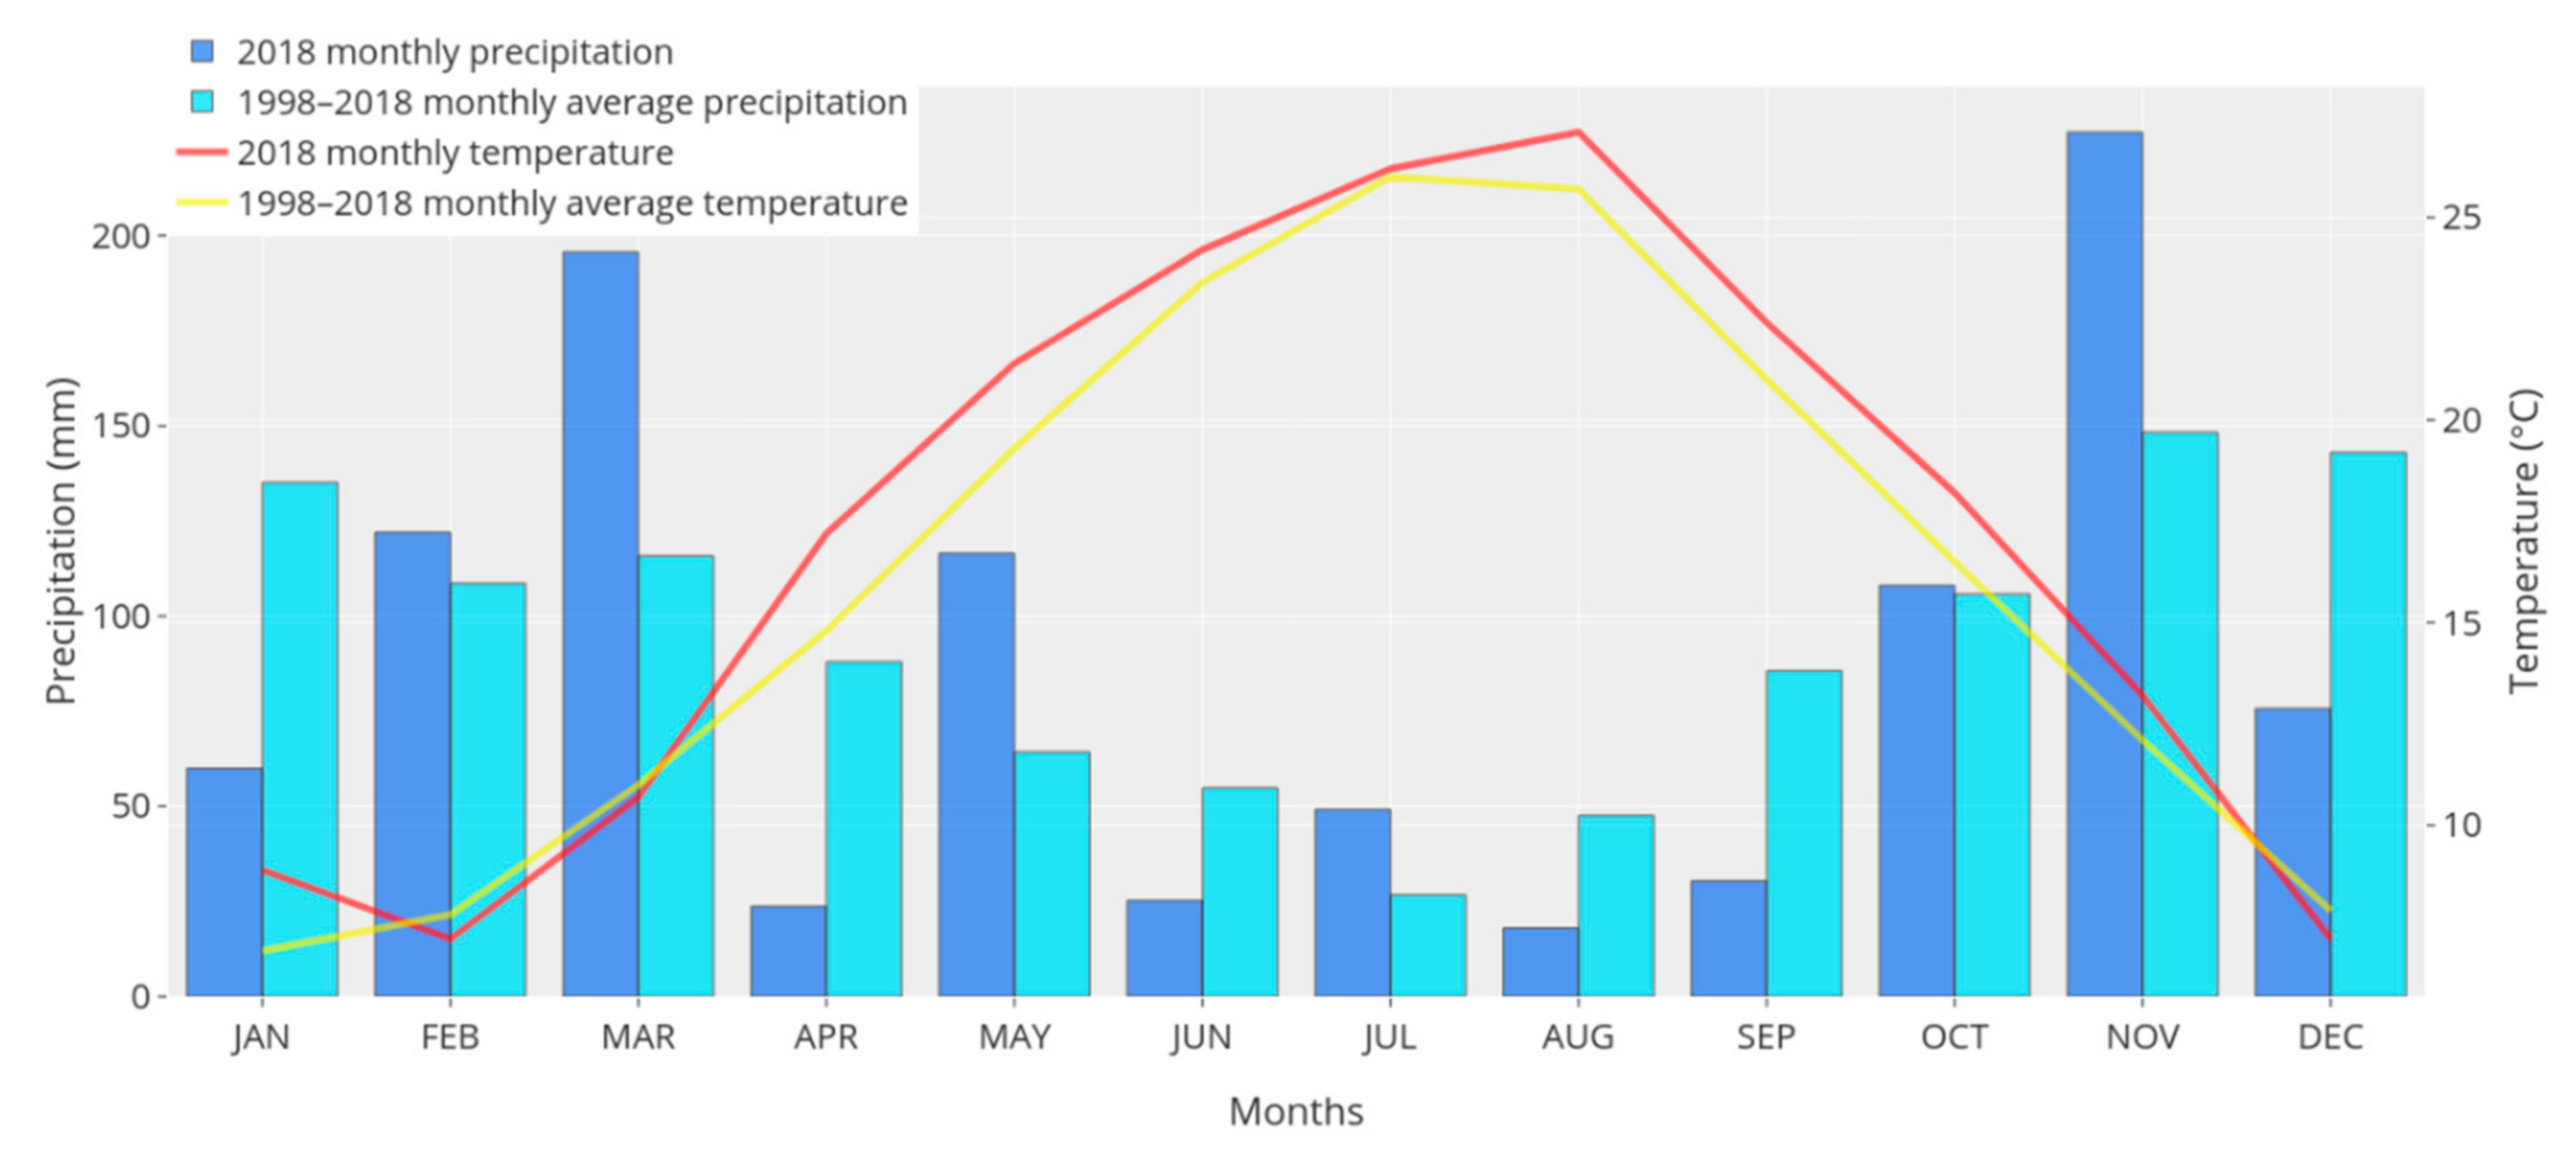
3.1. Rainfall Patterns

During the study period, lower rainfall was observed in August and September 2018 than in the monthly average from 1998–2018 (Figure 2). In November 2018, however, rainfall was substantially higher than that observed in the climatological normal. Regarding the temperature, the monthly average in 2018 was slightly higher than that in 1998–2018 (Figure 2).

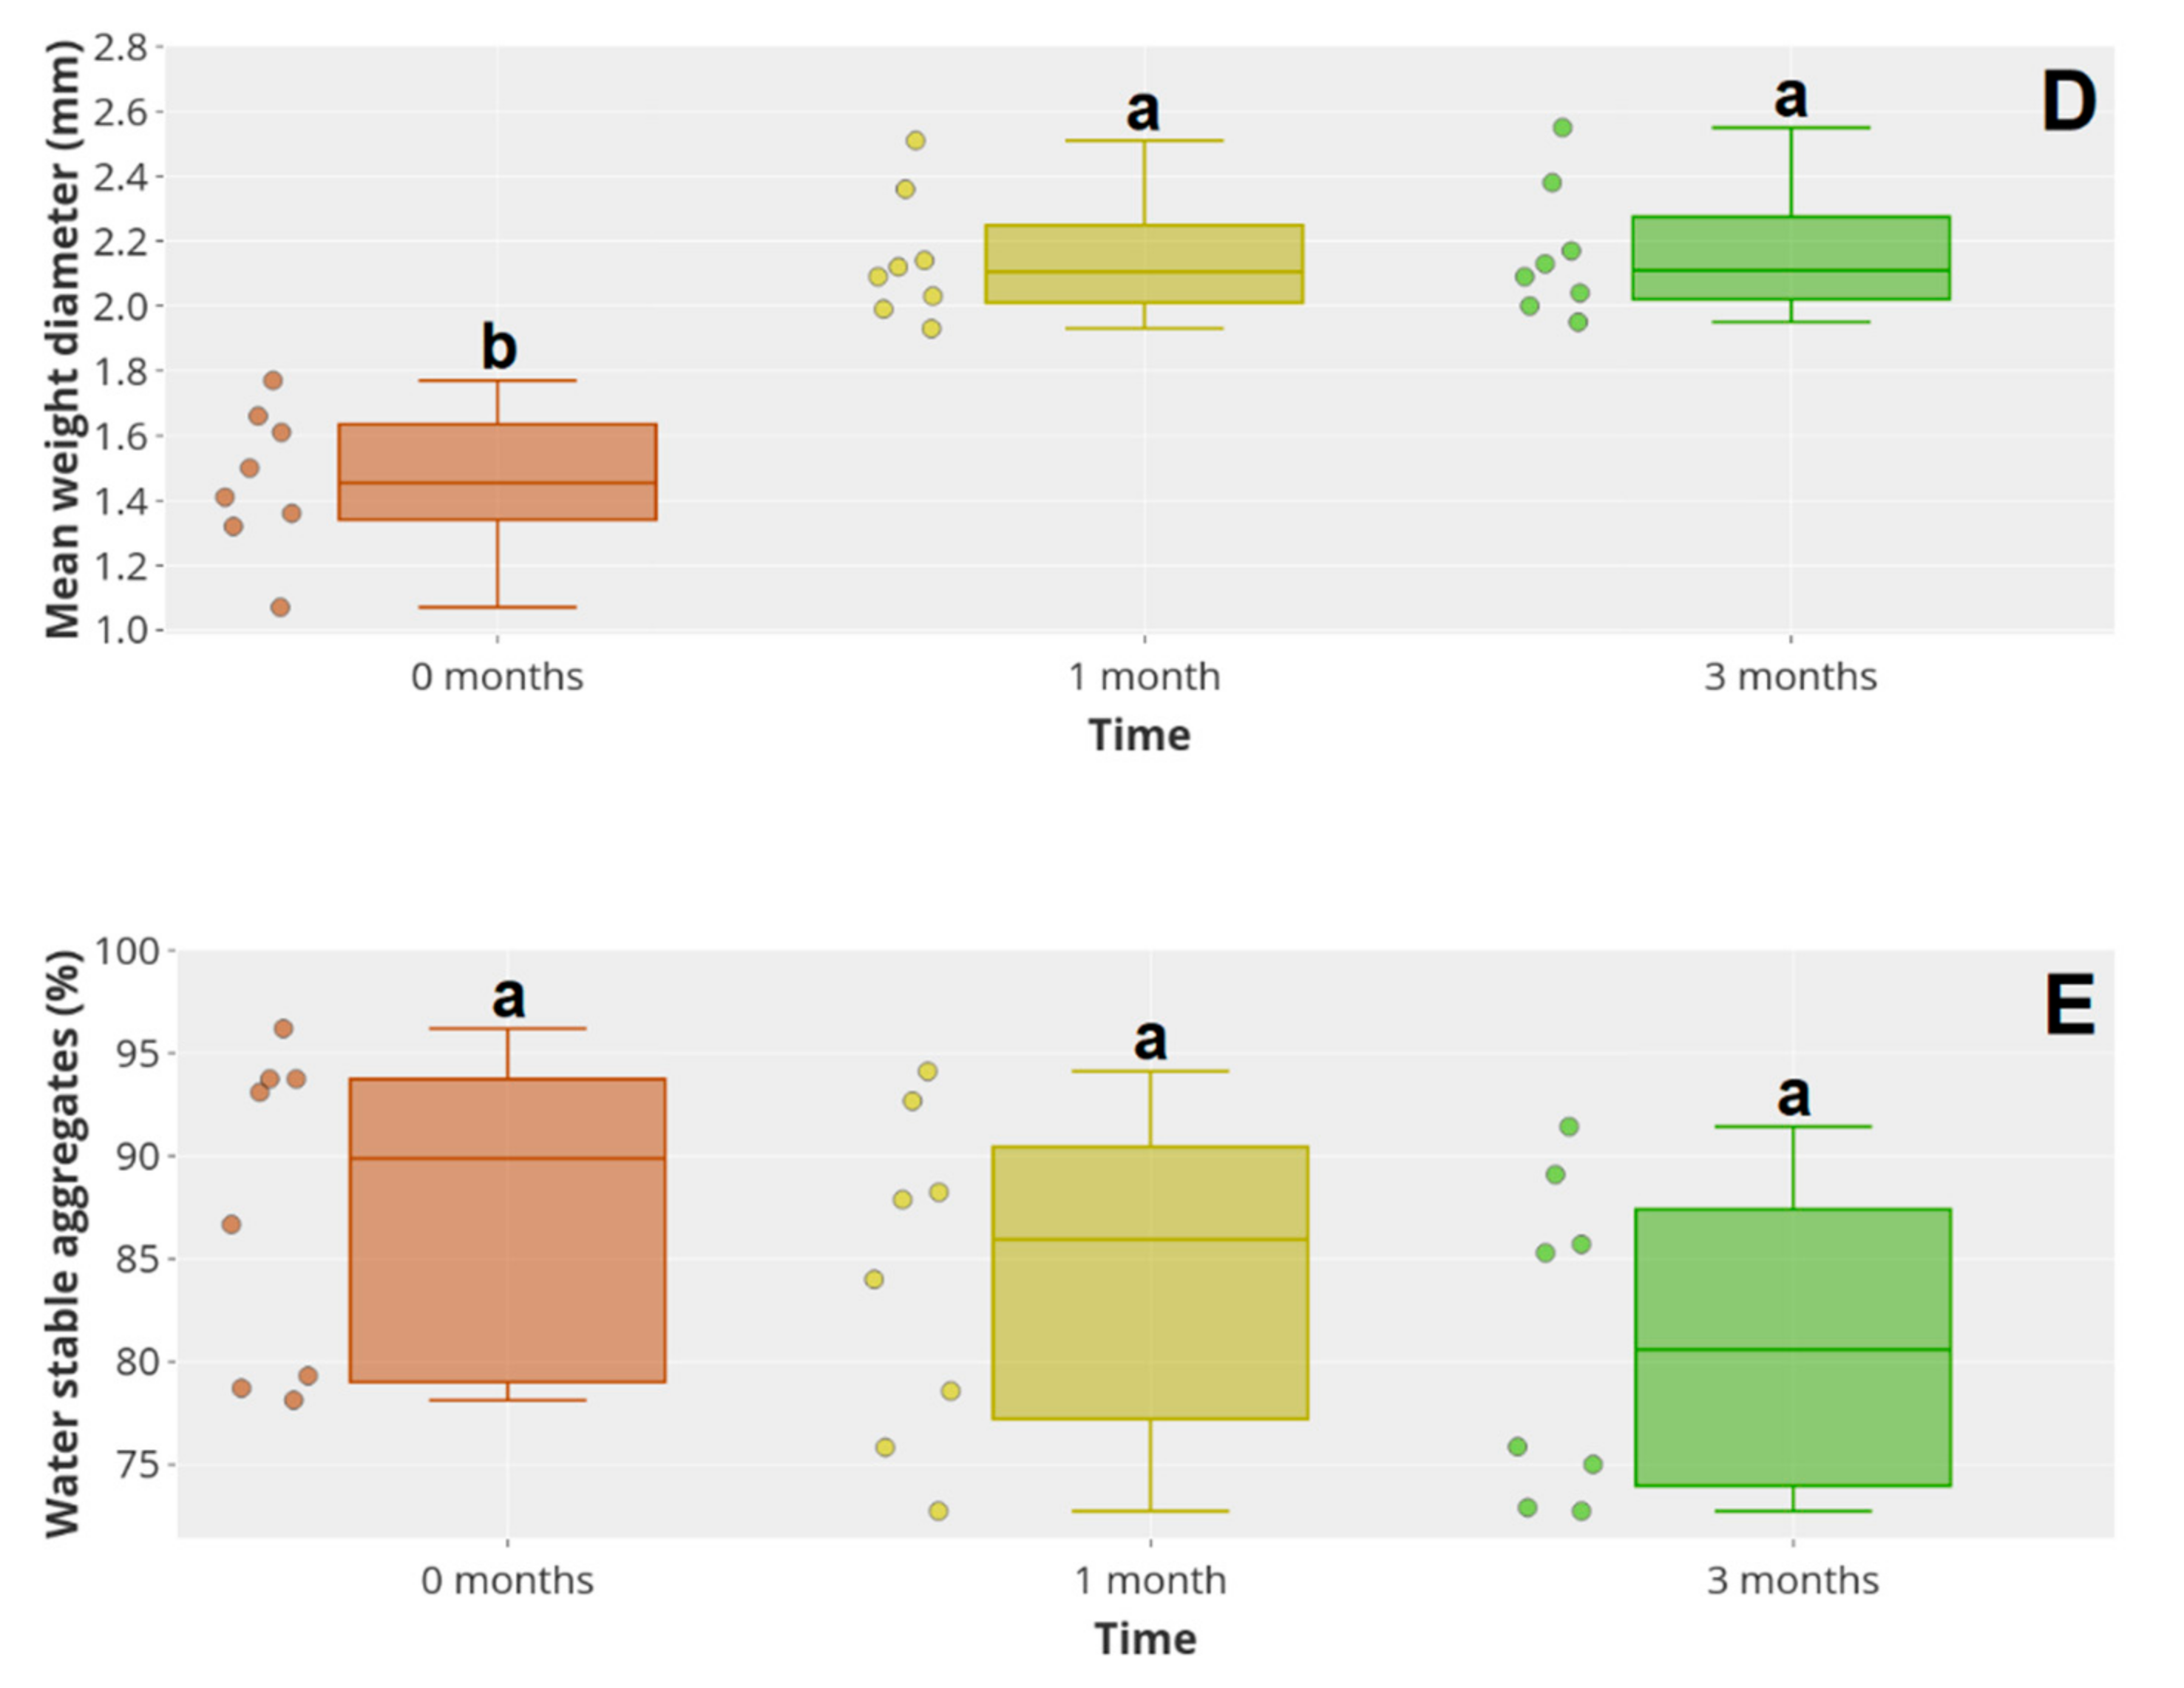
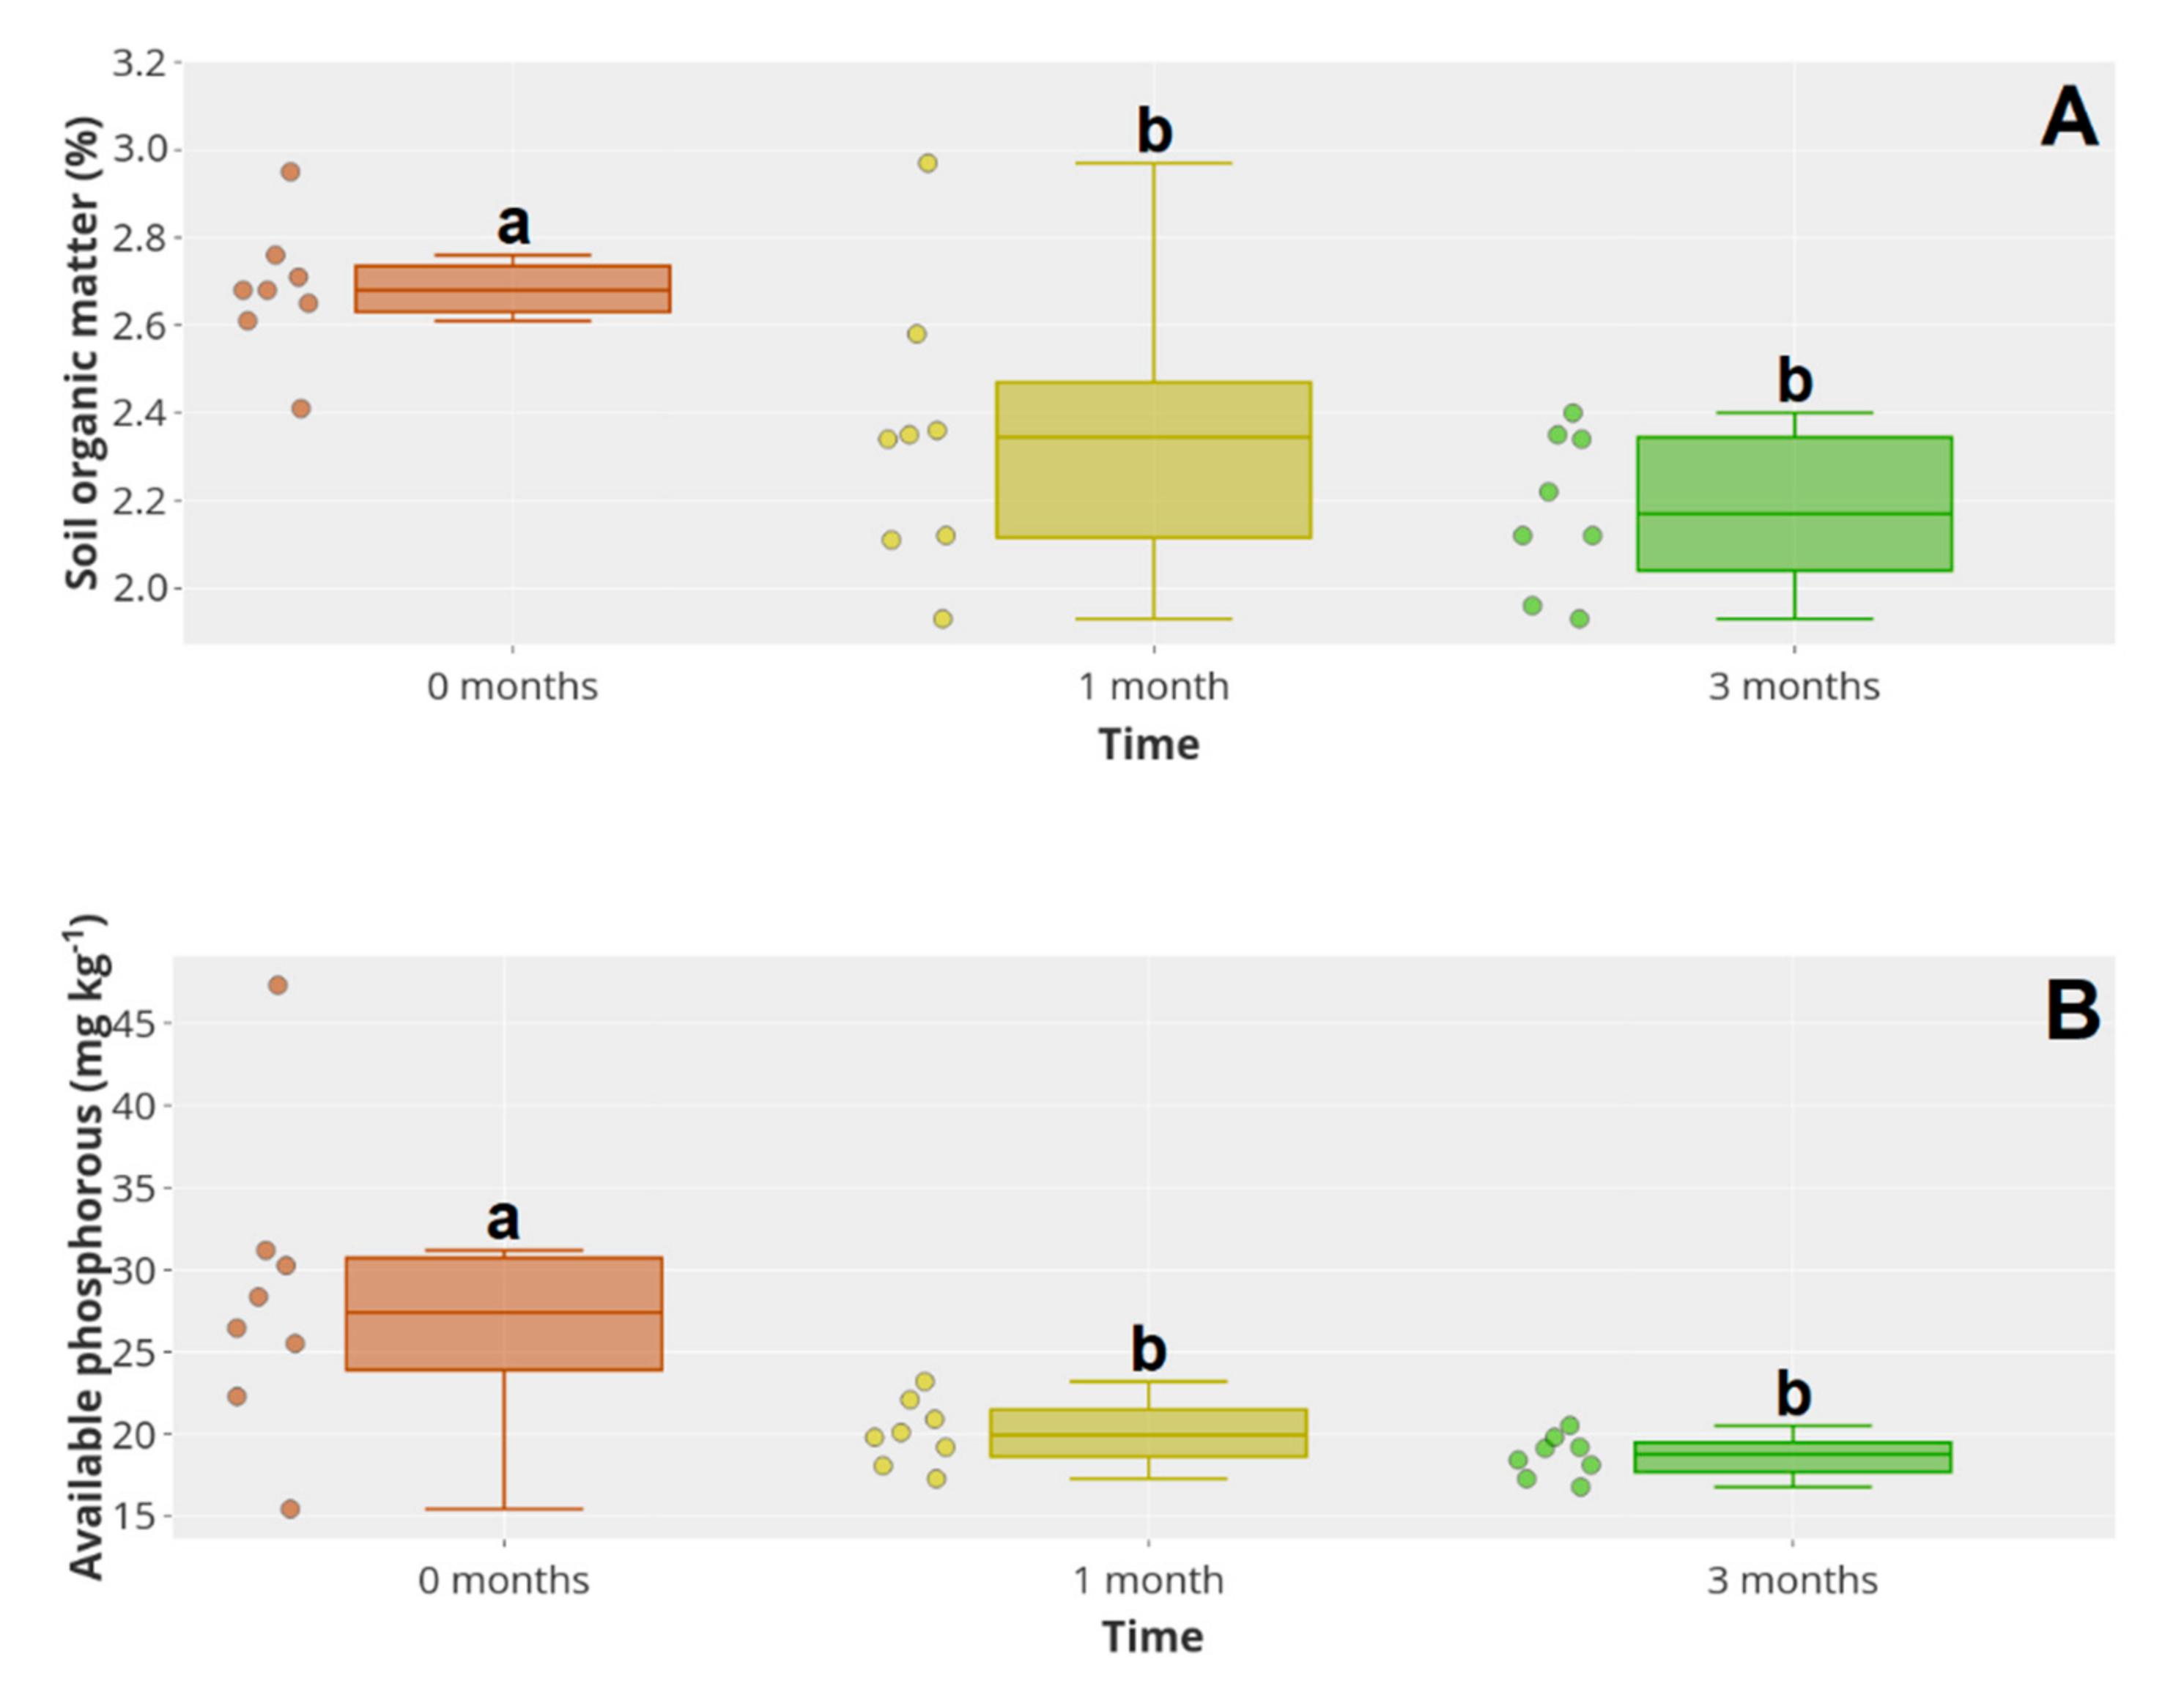
3.2. Topsoil Properties

The SWC was approximately four times higher in month 3 than in months 0 and 1 (p < 0.05), following the precipitation pattern (Figure 2). The BD was also significantly higher at month 3 than before. No significant differences were identified in either the SWC or BD between 0 and 1 month after tillage (Figure 3A,C). The WHC had an inverse dynamic; it was significantly higher 0 months after tillage than at 1 and 3 months (Figure 3B). Additionally, no differences were identified between 1 and 3 months. The MWD was significantly higher 1 and 3 months after tillage than at 0 months (Figure 3D). Although the WSA content showed a decreasing tendency over the study period, no differences among the different months were observed in the WSAs. Finally, SOM and P2O5 had similar behaviour. In both cases, the values observed were significantly higher at 0 than at 1 and 3 months after tillage (Figure 4A,B).

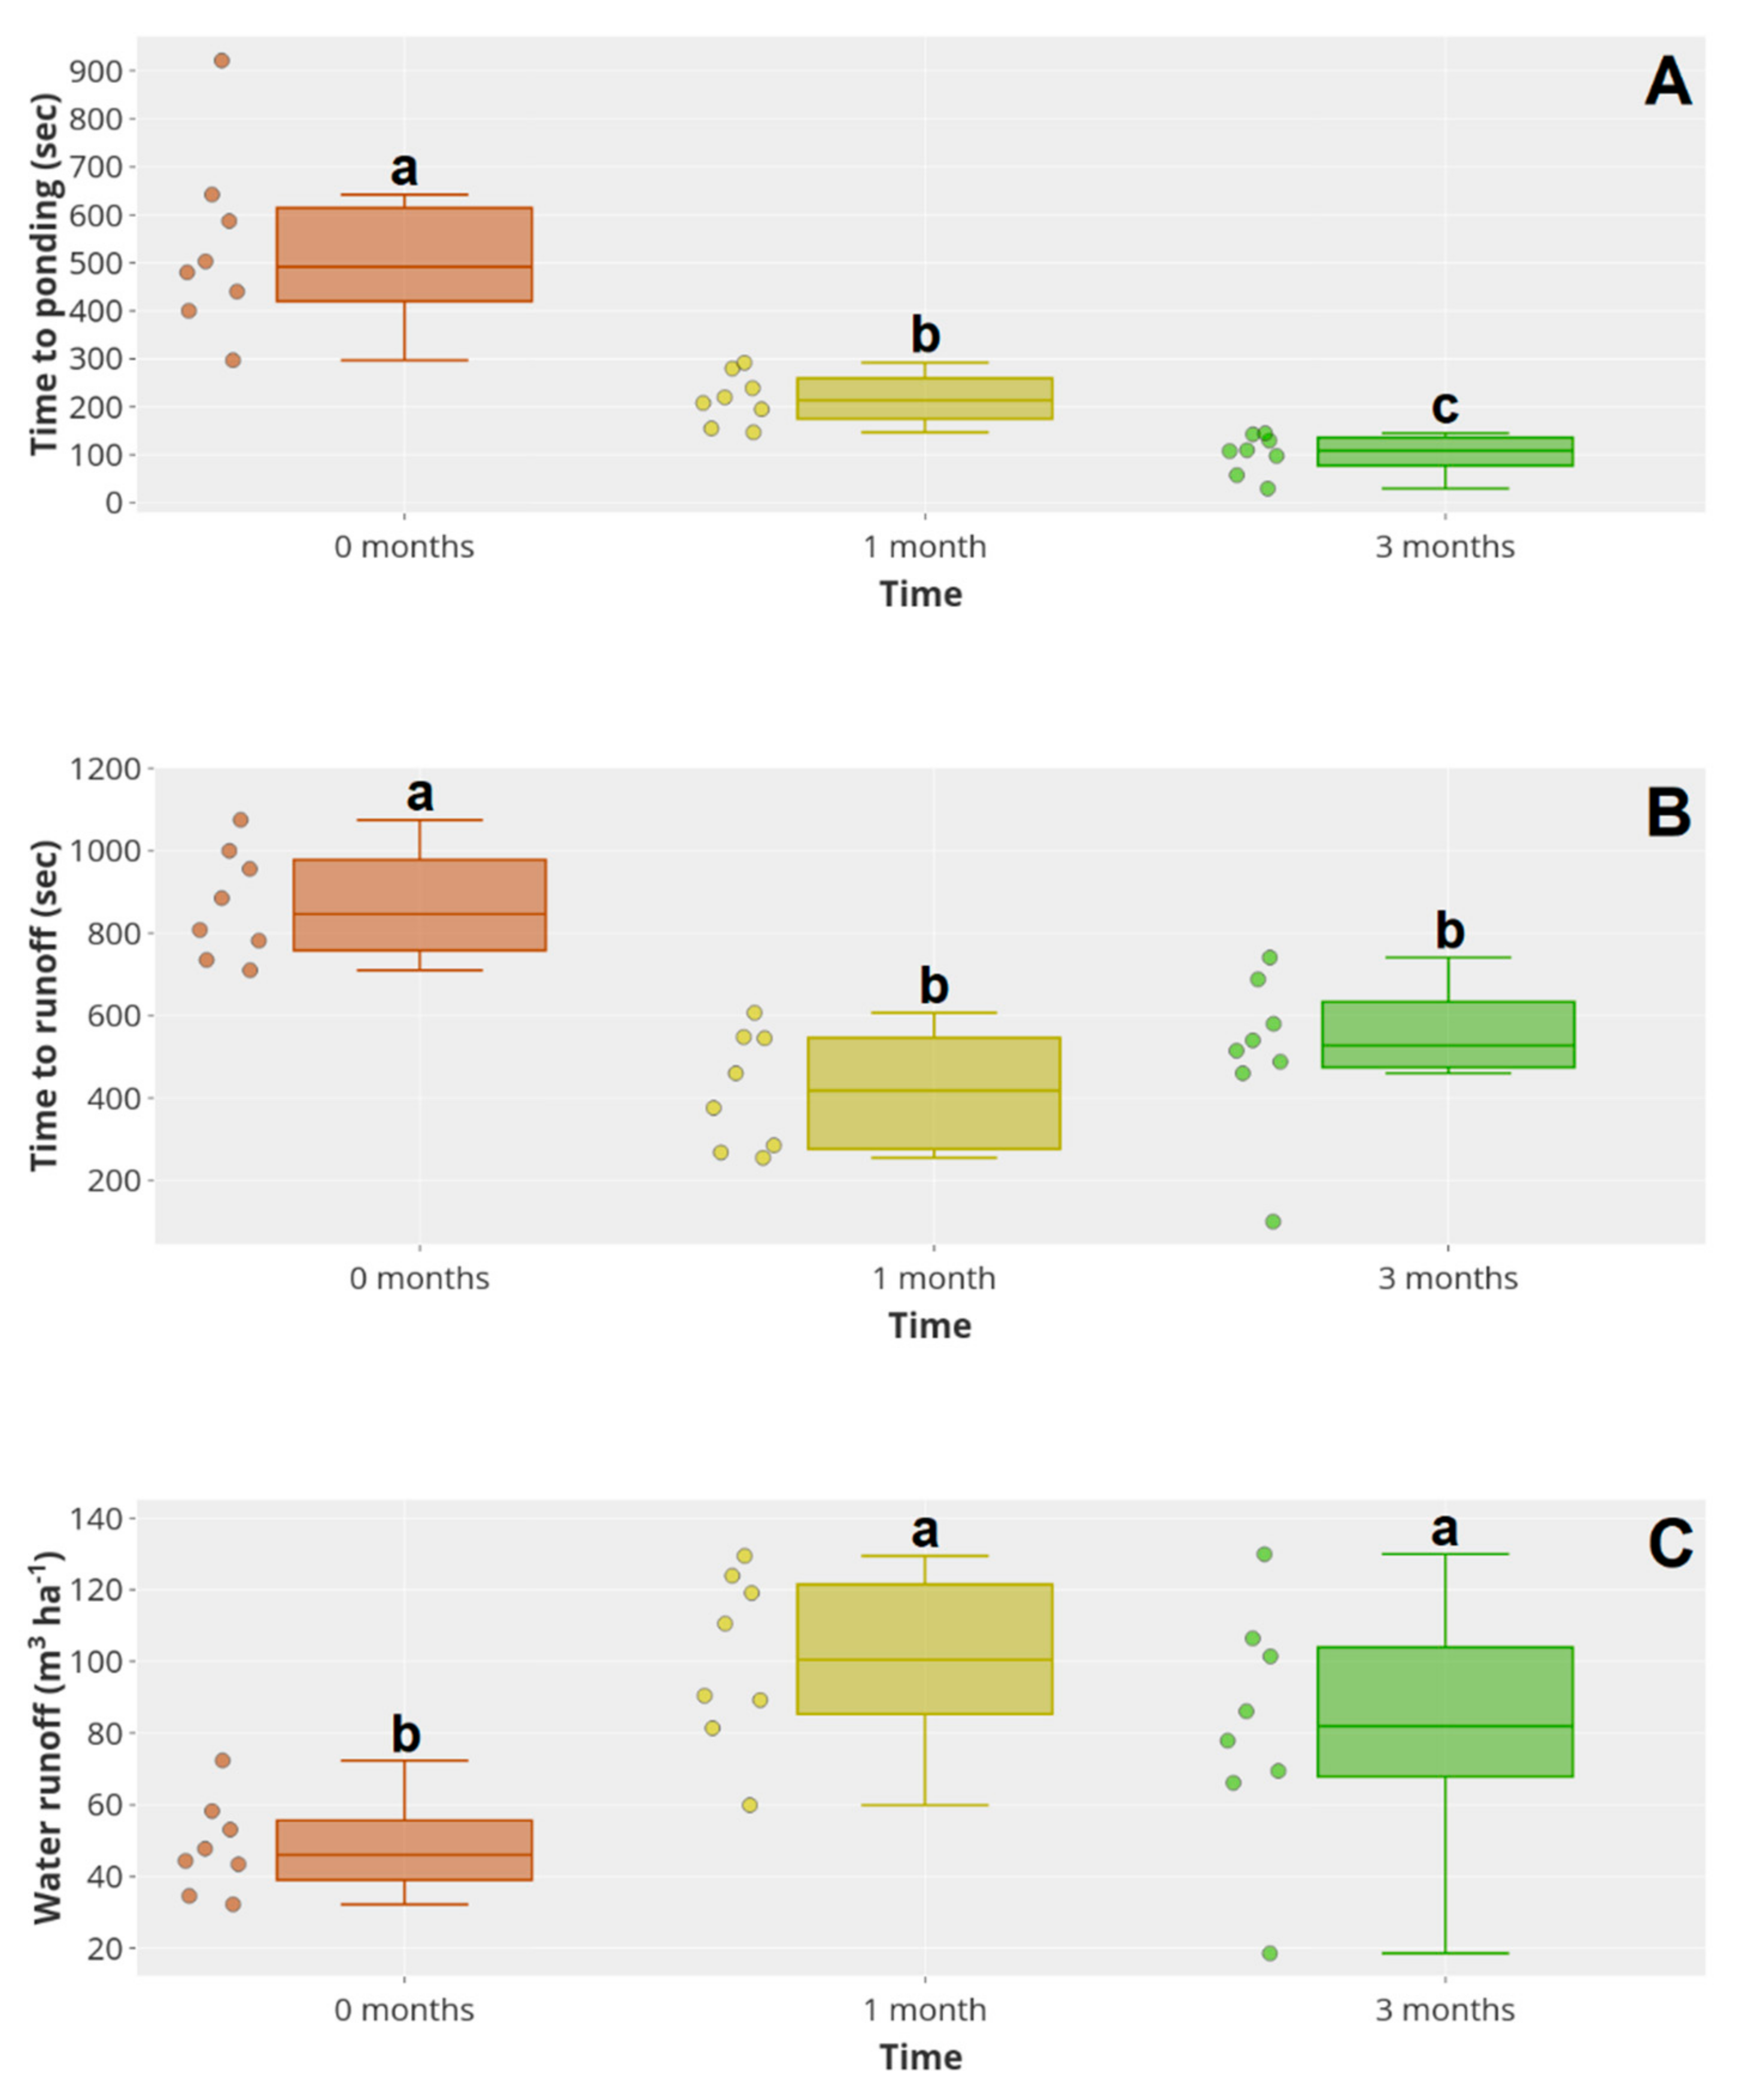
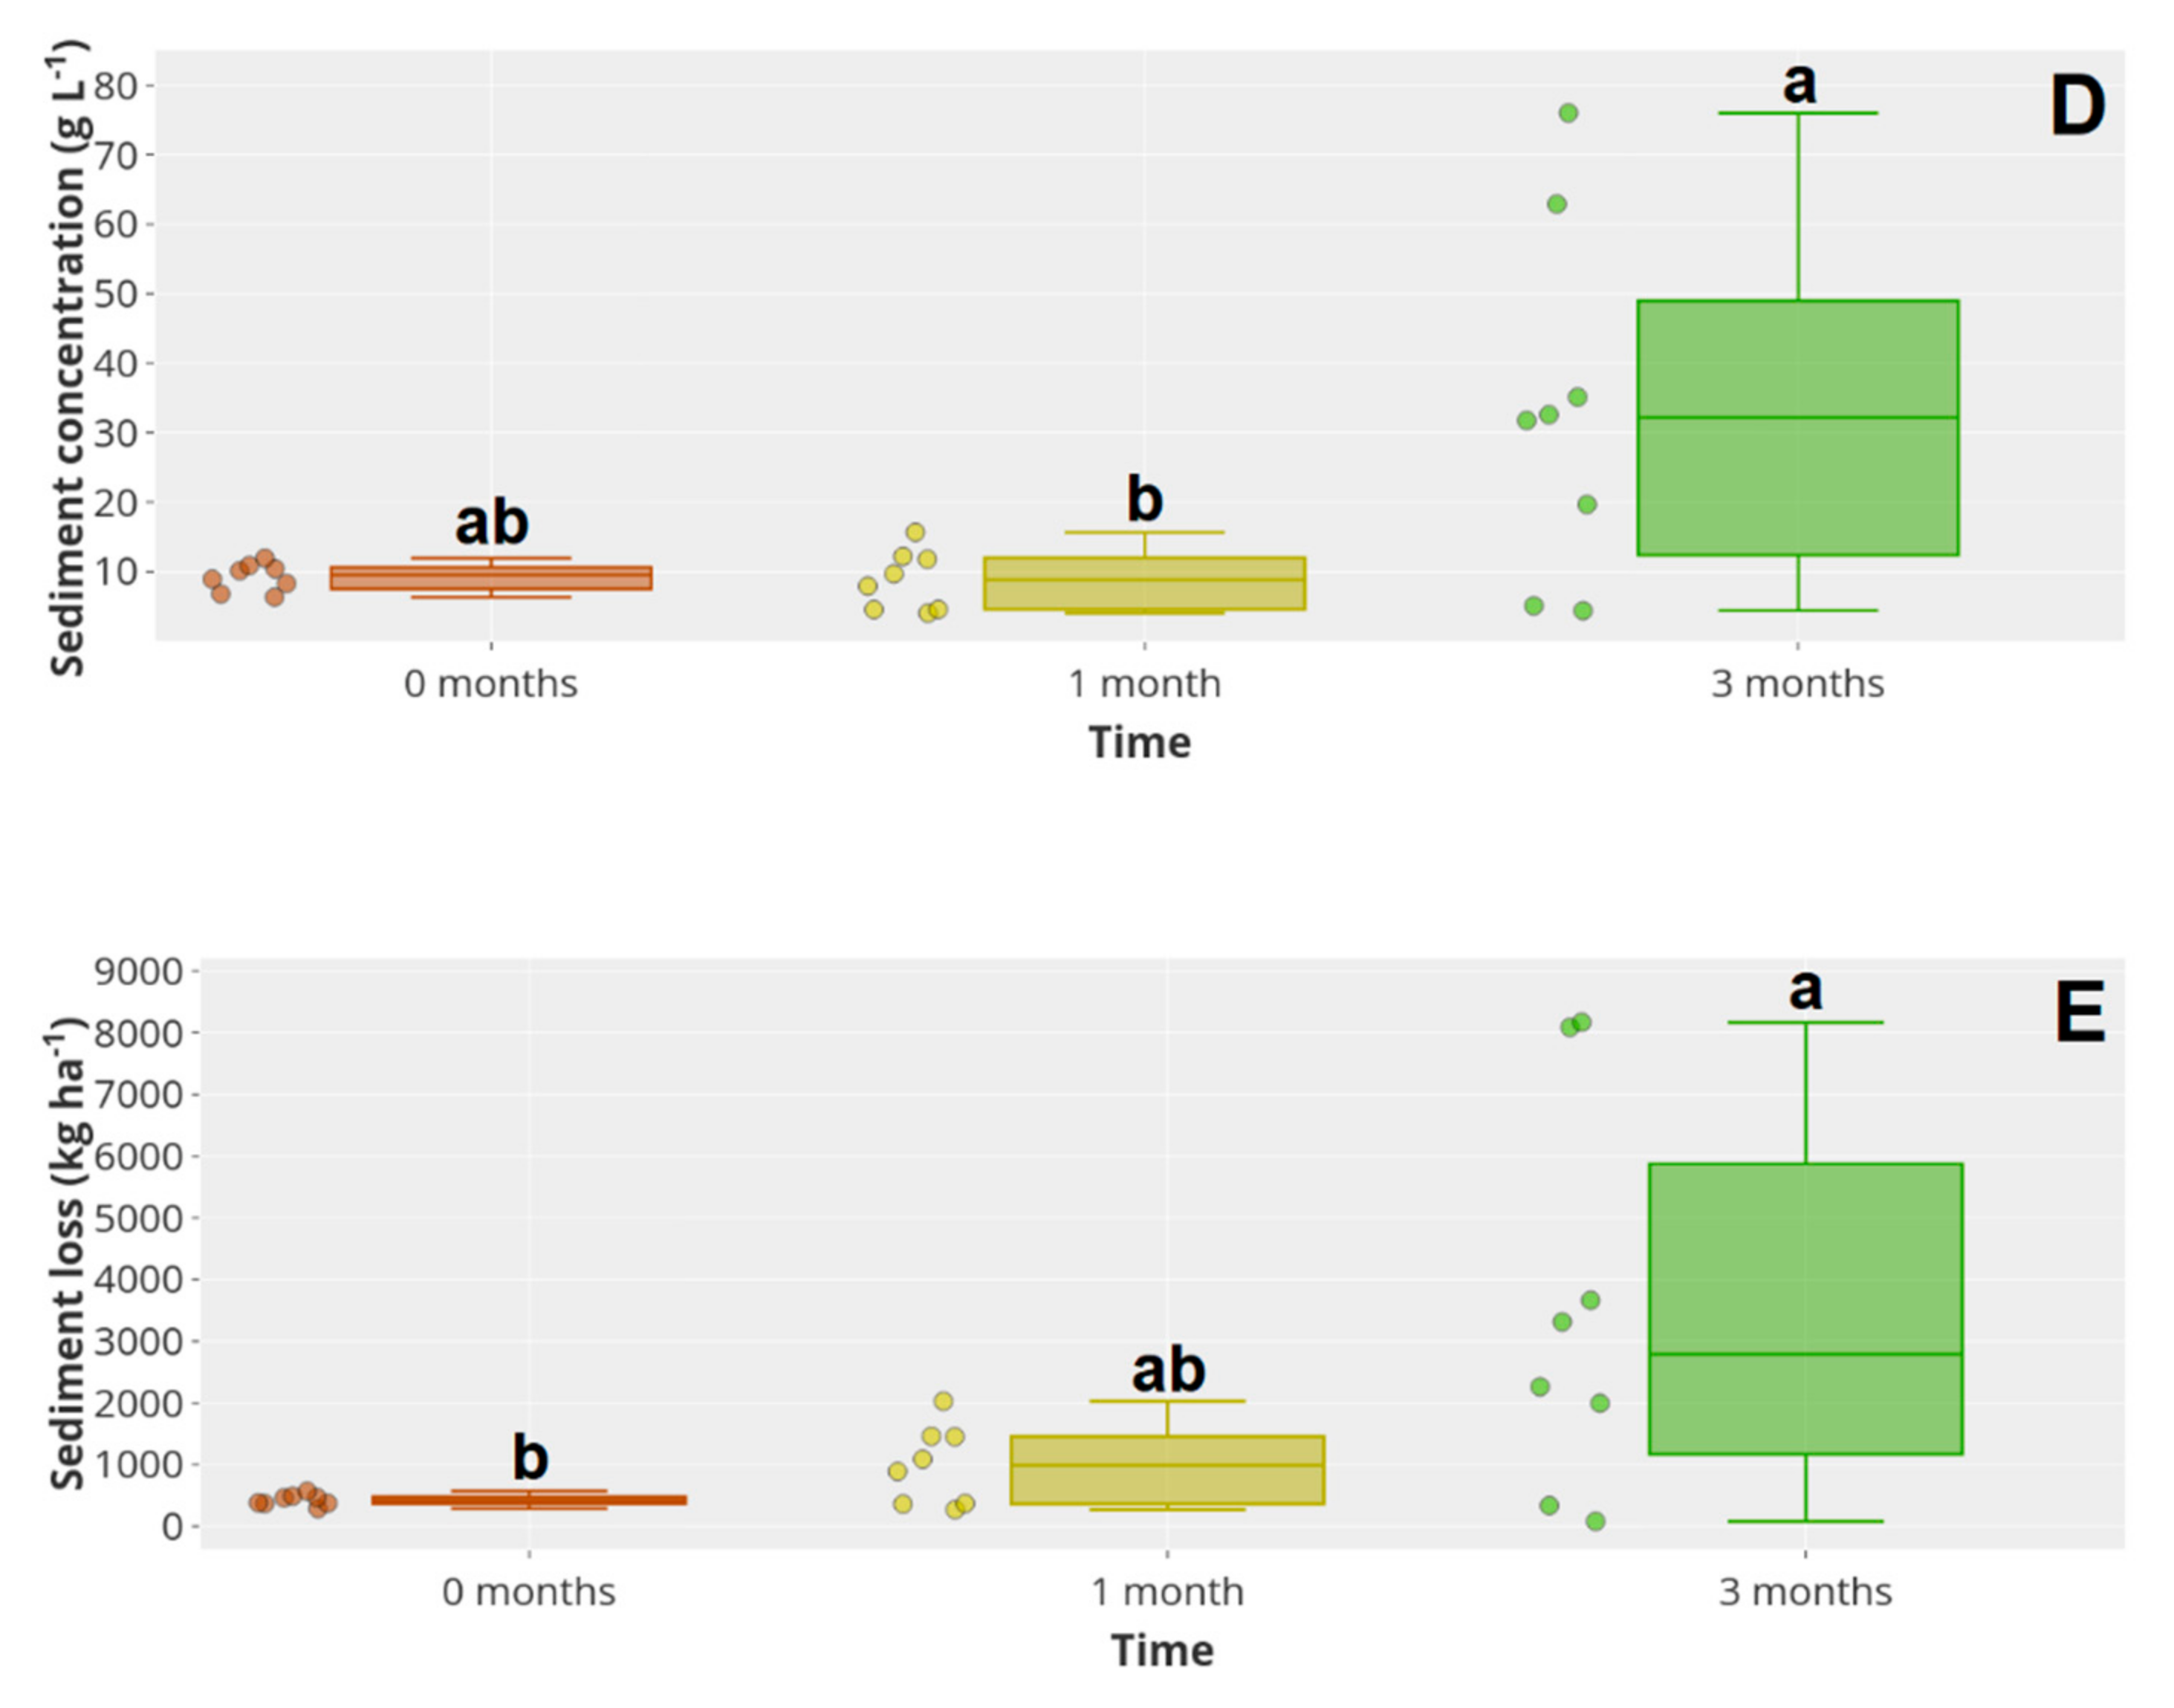
3.3. Overland Flow Properties

The hydrological response to rainfall simulation on the different study dates is summarized in Figure 5 and Figure 6. The TP was significantly higher 0 months after tillage than 1 and 3 months after tillage. Additionally, the PT was significantly lower 3 months after tillage than 1 month after tillage (Figure 5A). The TR decreased significantly from 0 months to 1 and 3 months after tillage (Figure 5B). One and 3 months after tillage, the WR was significantly higher than at 0 months (Figure 5C). The SC and SL were significantly higher 3 months after tillage than at 0 and 1 month (Figure 5D,E). C loss was significantly lower at 0 than at 3 months after tillage (Figure 6A). Finally, P loss was significantly lower at 0 than at 1 and 3 months after tillage (Figure 6B).

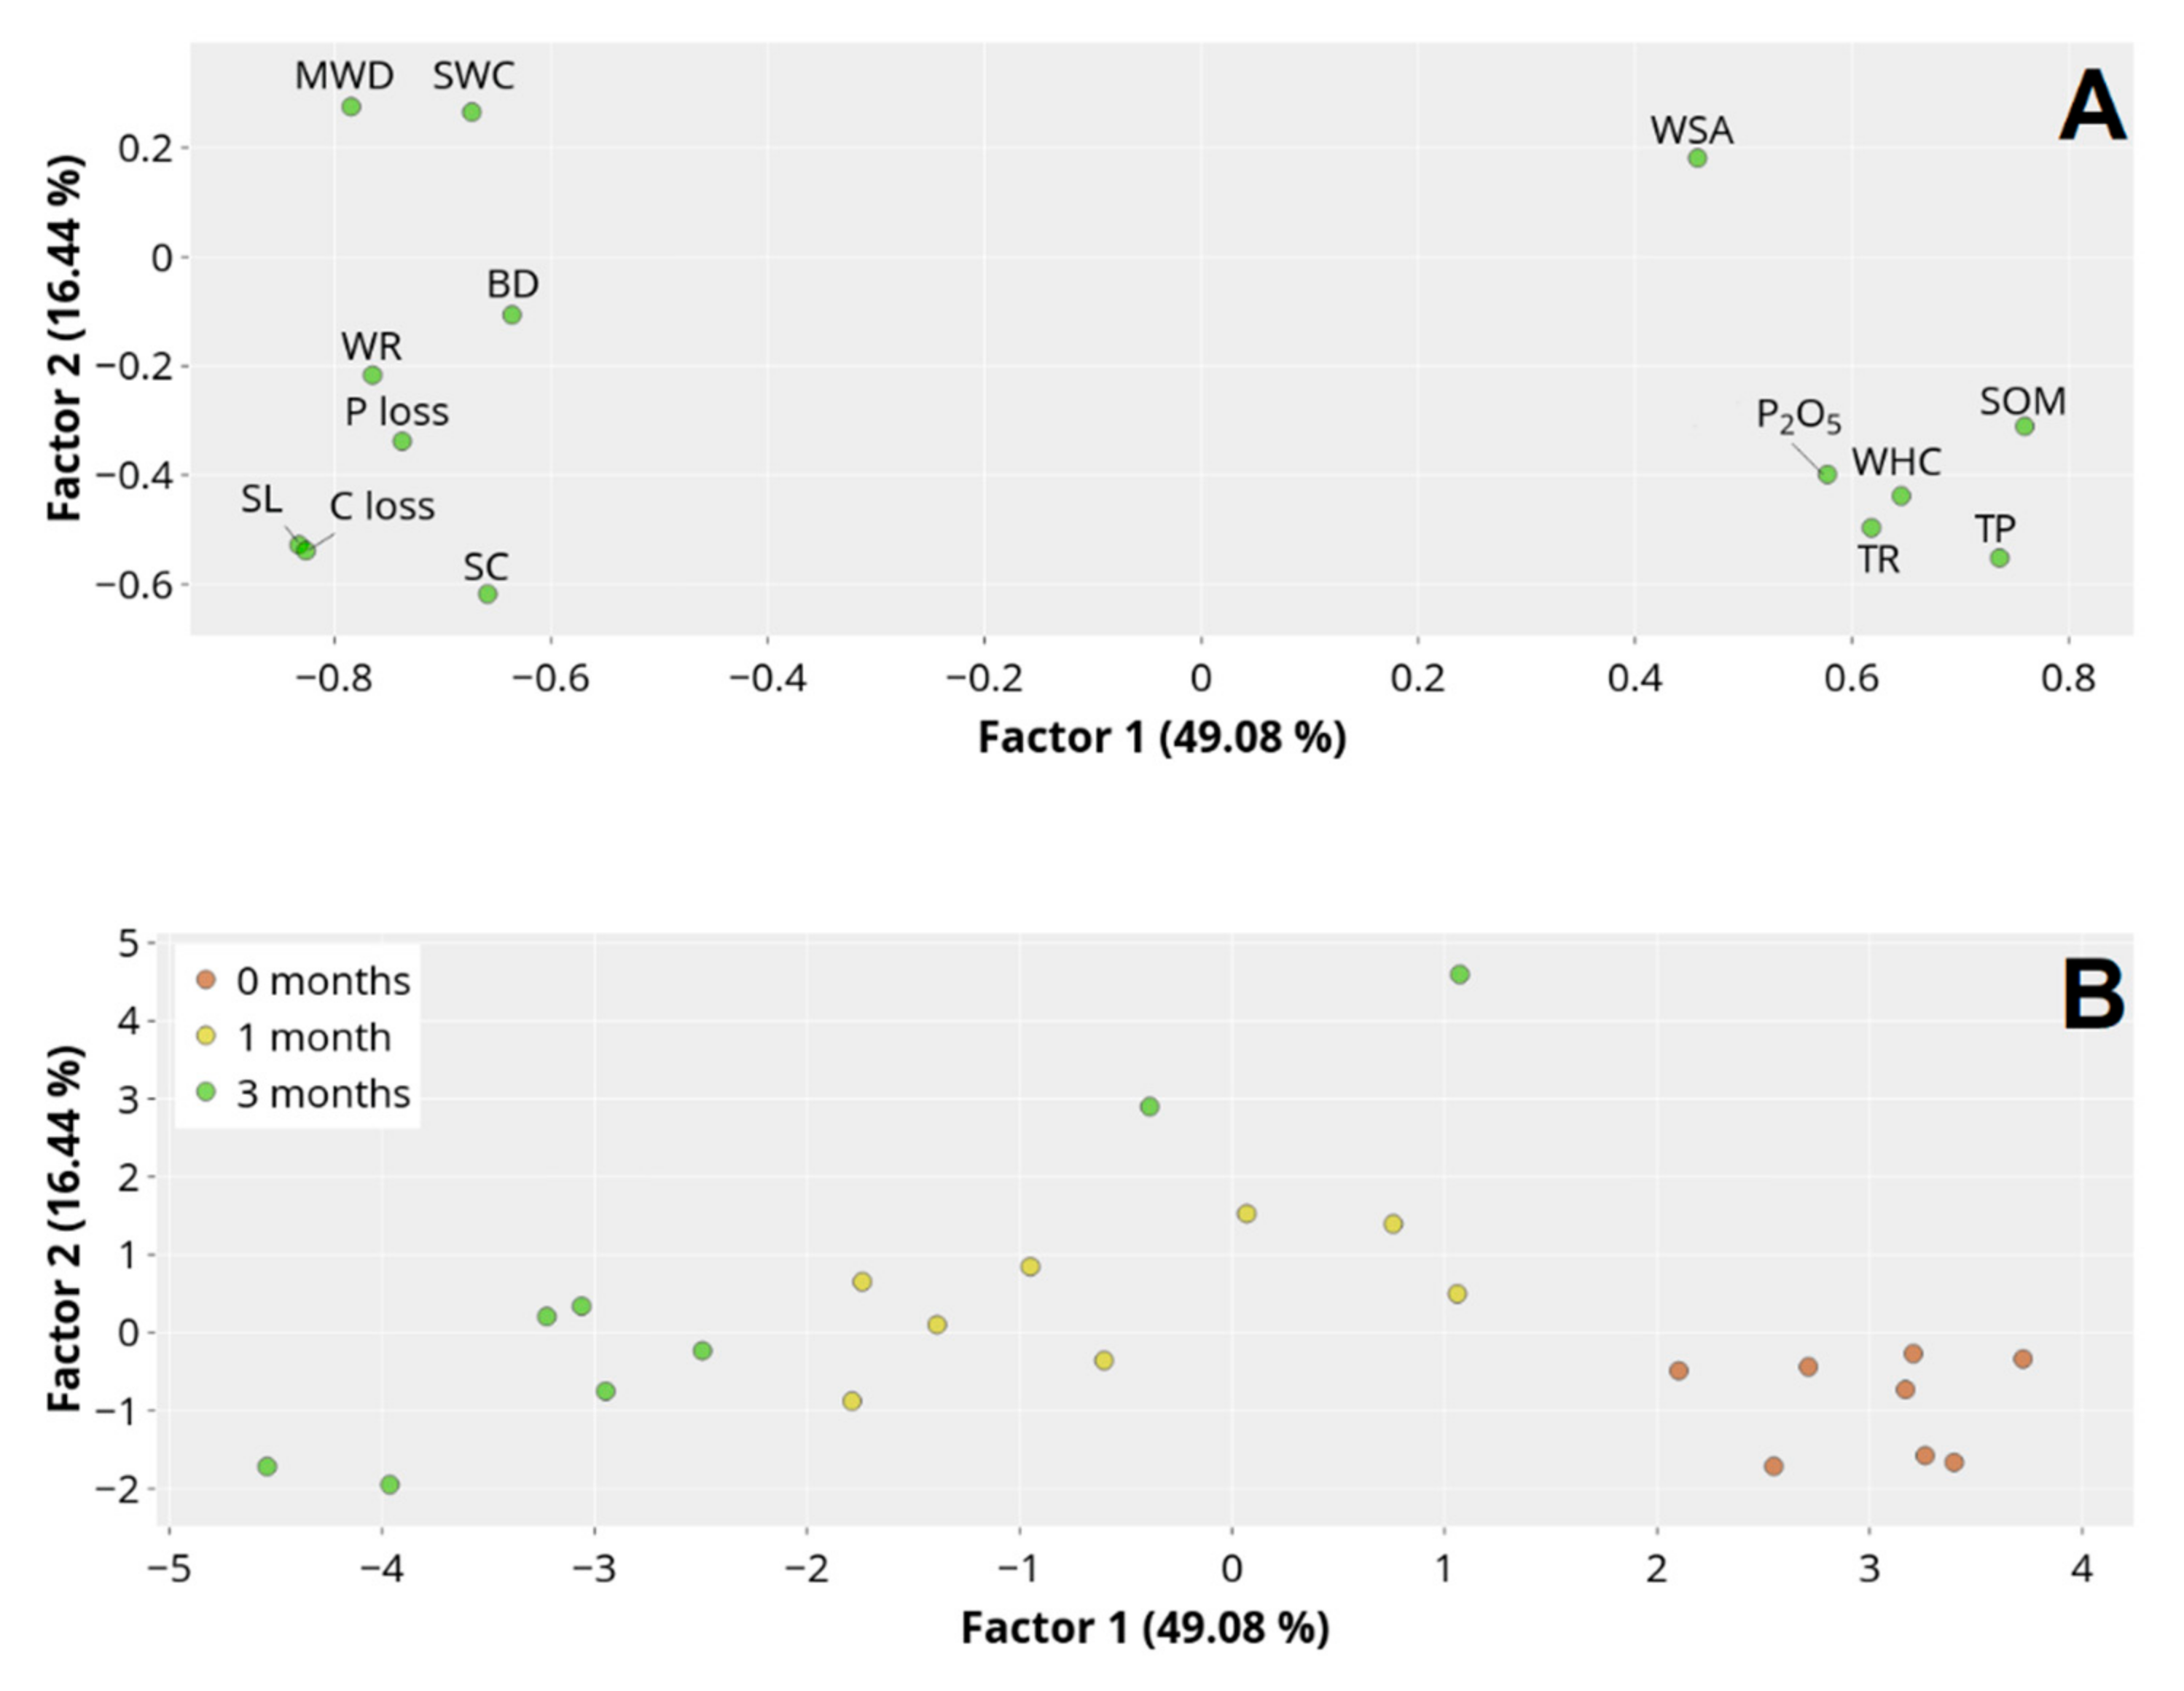
3.4. Principal Component Analyses

PCA identified four major factors that explained 84.99% of the total variance. Factor 1 explained 49.08%, while Factor 2, Factor 3, and Factor 4 explained 16.44%, 10.79%, and 8.69% of the total variance, respectively (Appendix A, Table A1). Most of the variables were explained by the factor 1 (Appendix A, Table A2). The relation between Factor 1 and Factor 2 is shown in Figure 7A. The BD, SWC, MWD, WR, SC, SL, C loss, and P loss were highly associated. On the other hand, these variables exhibited the opposite behaviour of the WSA content, SOM, P2O5, WHC, TR and TP. The differences between variables are more marked between 0 and 1/3 months after tillage. Between the last two months, the differences are minimal (Figure 7B).

4. Discussion

The results obtained in this work show that there is an increase in soil consolidation over time (increasing BD), similar to that identified by others [56,57,58]. These previous studies reported the highest increases in BD a few weeks after tillage, while, in our case, we observed this effect only 3 months later.
Soil consolidation is affected by gravity, traffic, trampling, and rainfall [27]. No traffic or trampling occurred during the period studied. Therefore, the causes of the increase in soil consolidation 3 months after tillage are very likely due to the high precipitation that occurred in November. At 0 and 1 month after tillage, the precipitation was low (Figure 2). This effect may have contributed to the increase in the BD. It is well known that rain kinetic energy increases soil disaggregation, settling, and compaction [3,55]. Such a scenario supports the study of Busscher [59], who confirmed that 67–91% of re-compaction after tillage could be attributed to rainfall.
Changes in soil BD affected the relations between water and air in the soil pore system. In the present study, the WHC was significantly lower 3 months after tillage than at 0 months, which is likely a consequence of the increased BD modifying the pore size, shape, tortuosity, and continuity [23,24] but also affecting the MWD. In this study, the WHC had an inverse pattern when compared to BD and MWD. Tillage reduces aggregate sizes, which increase with time after disturbance. Usually, a reduced pore size and low MWD decrease water infiltration, while a high percentage of large pores reduces water retention [34]. This effect may explain the low WHC 1 and 3 months after tillage.
Despite the lack of statistical significance in the WSA content over the study period, there was a decreasing trend after tillage, which is very likely related to the SOM decrease and SWC increase [60]. The decreased amounts of SOM and P2O5 in the soil can be attributed to the mixture of vegetation cover with rotation-type tillage at 0 months after tillage. Later, the still-high temperatures during August, September, and October and tillage-induced oxidation contribute to SOM mineralization [61,62]. Additionally, SOM has a great capacity to hold water [63], and the decreasing SOM content may also contribute to the decreased WHC. Previous studies have shown relations between SOM and both MWD and WHC [64], as observed in this study. SOM acts as a binding agent for aggregates [21,65] and is considered a vital parameter in aggregate stability [66,67]. Such behaviour can be attributed to the initially low tillage-induced MWD and aggregation induced by consolidation and the high level of exchangeable Ca (93.8%) on the soil cation exchange capacity (Table 1), which acts as a cation bridge, connecting organic matter and clay minerals [68]. The decrease in SOM after tillage has implications for sediment loss (as discussed below).
The PT and RT were significantly higher at 0 than at 3 months after tillage. This result can be attributed to the WHC decrease and the increase in SWC (as a consequence of precipitation) that affects soil saturation, as reported in previous studies [69]. Tillage management that leaves crop residues on the soil surface reduces soil losses [3,31,44]. However, in the study site, this was not the case, and intensive tillage was applied. The soil was bare in all study periods. As a consequence of the high soil saturation and high BD, the overland flow properties (WR, SC, SL, C loss, and P loss) increased. Biddoccu et al. [31] identified a higher runoff in winter than in summer in Italian vineyards due to increasing antecedent soil moisture content. Another reason that may explain the high hydrological response 3 months after tillage is the decrease in soil roughness from 0 to 3 months after tillage (Figure 1). Additionally, even though not significant, the lower WSA content 0 months after tillage compared to 3 months after tillage may have influenced the increase in SL, SC, C loss, and P loss. A reduced aggregate stability increases the soil erodibility [46]. Previous studies observed that soil surface roughness constitutes an impediment to overland flow and retains sediments [70,71]. One month after tillage, an impermeable surface crust was observed in the soil within the fig orchard, likely created after the first rainfall events following tillage, and this crust became thicker 3 months later. This result may have reduced the infiltration capacity and increased overland flow, sediment transport, and nutrient losses, as identified elsewhere [72,73].
The PCA results highlight that tillage impacts on the soil are different between 0 and 3 months after tillage. At 0 months after tillage, the PT, RT, WSA, WHC, SOM, and P2O5 had high values. In contrast, 3 months after tillage, the BD (as a result of soil consolidation), MWD (as a consequence of time after tillage), and SWC (due to the precipitation pattern) were high. The soil consolidation (compaction), roughness reduction, crust formation and moisture content increased the hydrological response and nutrient losses (WR, SC, SL, C loss, and P loss) (Figure 7A). The variability was high 1 and 3 months after tillage, showing that the soil properties and hydrological response heterogeneity increased after disturbance. This effect is likely influenced by rainfall patterns, especially in month 3, after tillage (Figure 7B). The kinetic energy impact from seasonal rainfall on the soil surface affects the spatial variability of the soil properties [74,75,76].
The present results highlight the importance of precipitation in the impact on soil properties. The change in soil properties and surface conditions altered the hydrological response and erosion. In the case of this fig orchard, the combination of high rainfall and intensive management was revealed to be very damaging for the soil properties, sediments, and nutrient losses. For instance, 3 months after tillage, we observed a loss of >3 t ha−1 of soil in a single rainstorm event. This finding reveals unsustainable soil management practices at the study location considering other data describing tolerable soil loss in Europe at a rate of 1 t ha−1 year−1 [77]. The loss of sediments and nutrients implies decreased soil fertility, which enhances land degradation [78,79]. Additionally, the P losses in soils with a low content of this element may negatively impact plant growth and yields since phosphorus is a crucial nutrient [80]. In these soil types, with high exchangeable Ca and high pH (Table 1), the P availability is naturally low [81]. With current practices, the presence of this element will likely be reduced, limiting plant growth. Intensive management is likely to have offsite impacts such as the siltation and eutrophication of surface water bodies [82,83]. More sustainable practices (e.g., cover crops, reduced tillage) are needed to ensure that these soils continue to provide long-term ecosystem services and avoid the disservices (e.g., high erosion rates) produced by the current practices [84]. This short-term study reveals that improved soil management is required to mitigate land degradation, and more research is needed in fig orchards, which have been overlooked by the scientific community. Further research will focus on studying a large temporal scale and applying different types of management to reduce the impacts of agriculture on the soil properties and hydrological response.

5. Conclusions

This short-term study shows that the SWC, BD, MWD, TP, and TR were significantly higher 3 months after tillage than immediately after tillage. The WHC, WSA (despite the lack of statistical significance) SOM, P2O5 content, WR, SC, SL, C loss, and P loss showed the opposite dynamics. With time, the variability in the parameters studied increased, and the seasonal rainfall kinetic energy impact increased. Overall, with time, there was an increase in post-tillage consolidation that, together with soil saturation, a reduction in surface roughness, and crust formation, augmented the loss of sediments and nutrients. The current management practices have negative impacts on soil properties, which lead to increasing land degradation, with potential site impacts on fig yields and offsite environmental impacts, such as lake siltation and eutrophication. It is urgent to apply more sustainable agricultural management practices to avoid runoff, nutrient translocation, and floods.

Author Contributions

Conceptualization, I.B. and P.P.; methodology, I.B., L.J.T.; validation, I.B., P.P., C.F.; formal analysis, L.J.T.; investigation, L.J.T., I.B.; data curation, L.J.T., I.B.; writing—original draft preparation, L.J.T.; writing—review and editing, P.P., C.S.S.F., V.F., L.F., I.B.; visualization, L.J.T., P.P., L.F.; supervision, P.P., I.B.; project administration, I.B.; funding acquisition, I.B. All authors have read and agreed to the published version of the manuscript.

Funding

This research was supported by the Croatian Science Foundation through the project “Soil erosion and degradation in Croatia” (UIP-2017-05-7834) (SEDCRO) and COST Action LAND4FLOOD (CA16209) supported by European Cooperation in Science and Technology, www.cost.eu.

Acknowledgments

Manuel Matišić is acknowledged for assistance with the field research.

Conflicts of Interest

The authors declare no conflict of interest. The funders had no role in the design of the study; in the collection, analyses, or interpretation of data; in the writing of the manuscript; or in the decision to publish the results.

Appendix A

Table A1. Principal component analysis (PCA): eigenvalues of the correlation matrix and related statistics.
FactorsEigenvalues of Correlation Matrix and Related Statistics
Eigenvalue% TotalCumulativeCumulative
16.87055949.075426.8705649.0754
22.30152816.439489.1720965.5149
31.50993010.7852110.6820276.3001
41.2162298.6873511.8982584.9875
50.9217996.5842812.8200491.5717
60.3734132.6672313.1934694.2390
70.3315622.3683013.5250296.6073
80.2102591.5018513.7352898.1091
90.1506731.0762413.8859599.1854
100.0598380.4274213.9457999.6128
110.0342980.2449813.9800999.8578
120.0123290.0880613.9924299.9458
130.0074930.0535213.9999199.9994
140.0000910.0006514.00000100.0000
Bold values represent the factors that at least explain one variable.
Table A2. PCA: factor weight of the variables.
VariableFactor 1Factor 2Factor 3Factor 4
BD (g cm−3)−0.635970−0.106389−0.6718900.289905
WHC (%)0.645557−0.4382370.2973010.179958
SWC (%)−0.6730380.265434−0.624049−0.025846
MWD (mm)−0.7843660.275267−0.0339610.425271
WSA (%)0.4576840.1811810.0009510.669754
SOM (%)0.759445−0.310617−0.1788190.323267
P2O5 (mg kg-1)0.577460−0.398762−0.3586180.272733
PT (sec)0.736282−0.5520680.0385460.017696
RT (sec)0.618064−0.496640−0.414612−0.148541
WR (m3 ha−1)−0.764620−0.2167380.4220210.351363
SC (g kg-1)−0.658483−0.618021−0.128423−0.232881
SL (kg ha−1)−0.832526−0.5279280.056611−0.050388
C loss (kg ha−1)−0.826036−0.5387930.069739−0.051622
P loss (g ha−1)−0.737336−0.3380060.2070750.292488
Bold values represent the variables explained by each factor.

References

  1. Bordoni, M.; Vercesi, A.; Maeker, M.; Ganimede, C.; Reguzzi, M.C.; Capelli, E.; Wei, X.; Mazzoni, E.; Simoni, S.; Gagnarli, E.; et al. Effects of vineyard soil management on the characteristics of soils and roots in the lower Oltrepo Apennines (Lombardy, Italy). Sci. Total Environ. 2019, 693, 133390. [Google Scholar] [CrossRef]
  2. Pardini, A.; Faiello, C.; Longhi, F.; Mancuso, S.; Snowball, R. Cover crop species and their management in vineyards and olive groves. Adv. Hortic. Sci. 2002, 16, 225–234. [Google Scholar]
  3. Bogunovic, I.; Pereira, P.; Kisic, I.; Sajko, K.; Sraka, M. Tillage management impacts on soil compaction, erosion and crop yield in Stagnosols (Croatia). Catena 2018, 160, 376–384. [Google Scholar] [CrossRef]
  4. Al-Jabri, S.A.; Lee, J.; Gaur, A.; Horton, R.; Jaynes, D.B. A dripper-TDR method for in situ determination of hydraulic conductivity and chemical transport properties of surface soils. Adv. Water Resour. 2006, 29, 239–249. [Google Scholar] [CrossRef] [Green Version]
  5. Alletto, L.; Coquet, Y. Temporal and spatial variability of soil bulk density and near-saturated hydraulic conductivity under two contrasted tillage management systems. Geoderma 2009, 152, 85–94. [Google Scholar] [CrossRef]
  6. Blavet, D.; De Noni, G.; Le Bissonnais, Y.; Leonard, M.; Maillo, L.; Laurent, J.Y.; Asseline, J.; Leprun, J.C.; Arshad, M.A.; Roose, E. Effect of land use and management on the early stages of soil water erosion in French Mediterranean vineyards. Soil Till. Res. 2009, 106, 124–136. [Google Scholar] [CrossRef]
  7. Heshmati, M.; Arifin, A.; Shamshuddin, J.; Majid, N.M. Predicting N, P, K and organic carbon depletion in soils using MPSIAC model at the Merek catchment, Iran. Geoderma 2012, 175–176, 64–77. [Google Scholar] [CrossRef]
  8. Navas, A.; Gaspar, L.; Quijano, L.; Lopez-Vicente, M.; Machin, J. Patterns of soil organic carbon and nitrogen in relation to soil movement under different land uses in mountain fields (South Central Pyrenees). Catena 2012, 94, 43–52. [Google Scholar] [CrossRef]
  9. Zhang, C.; Liu, G.B.; Xue, S.; Sun, C.L. Soil organic carbon and total nitrogen storage as affected by land use in a small watershed of the Loess Plateau, China. Eur. J. Soil Biol. 2013, 54, 16–24. [Google Scholar] [CrossRef]
  10. Niu, X.Y.; Wang, Y.H.; Yang, H.; Zheng, J.W.; Zou, J.; Xu, M.N.; Wu, S.S.; Xie, B. Effect of Land Use on Soil Erosion and Nutrients in Dianchi Lake Watershed, China. Pedosphere 2015, 25, 103–111. [Google Scholar] [CrossRef]
  11. Ferreira, C.S.S.; Keizer, J.J.; Santos, L.M.B.; Serpa, D.; Silva, V.; Cerqueira, M.; Ferreira, A.J.D.; Abrantes, N. Runoff, sediment and nutrient exports from a Mediterranean vineyard under integrated production: An experiment at plot scale. Agric. Ecosyst. Environ. 2018, 256, 184–193. [Google Scholar] [CrossRef]
  12. Blair, N.; Faulkner, R.D.; Till, A.R.; Korschens, M.; Schulz, E. Long-term management impacts on soil C, N and physical fertility: Part I: Broad balk experiment. Soil Till. Res. 2006, 91, 30–38. [Google Scholar] [CrossRef]
  13. La Scala, N.; Bolonhezi, D.; Pereira, G.T. Short-term soil CO2 emission after conventional and reduced tillage of a no-till sugar cane area in southern Brazil. Soil Till. Res. 2006, 91, 244–248. [Google Scholar] [CrossRef]
  14. Bogunovic, I.; Andabaka, Z.; Stupic, D.; Pereira, P.; Galic, M.; Novak, K.; Telak, L.J. Continuous grass coverage as a management practice in humid environment vineyards increases compaction and CO2 emissions but does not modify must quality. Land Degrad Dev. 2019, 30, 2347–2359. [Google Scholar] [CrossRef]
  15. Kibet, K.C.; Blanco-Canqui, H.; Jasa, P. Long-term tillage impacts on soil organic matter components and related properties on a Typic Argiudoll. Soil Till. Res. 2016, 155, 78–84. [Google Scholar] [CrossRef]
  16. Yeboah, S.; Zhang, R.; Cai, L.; Li, L.; Xie, J.; Luo, Z.; Liu, J.; Wu, J. Tillage effect on soil organic carbon, microbial biomass carbon and crop yield in spring wheat-field pea rotation. Plant Environ. 2016, 6, 279–285. [Google Scholar] [CrossRef] [Green Version]
  17. Bartos, A.; Szymański, W.; Klimek, M. Impact of conventional agriculture on the concentration and quality of water-extractable organic matter (WEOM) in the surface horizons of Retisols—A case study from the Carpathian Foothills in Poland. Soil Till. Res. 2020, 204, 104750. [Google Scholar] [CrossRef]
  18. Margenot, A.J.; Paul, B.K.; Sommer, R.R.; Pulleman, M.M.; Parikh, S.S.; Jackson, L.E.; Fonte, S.J. Can conservation agriculture improve phosphorus (P) availability in weathered soils? Effects of tillage and residue management on soil P status after 9 years in a Kenyan Oxisol. Soil Till. Res. 2017, 166, 157–166. [Google Scholar] [CrossRef]
  19. Xiao, S.S.; Ye, Y.Y.; Xiao, D.; Zhang, W.; Wang, K.L. Effects of tillage on soil N availability, aggregate size, and microbial biomass in a subtropical karst region. Soil Till. Res. 2019, 192, 187–195. [Google Scholar] [CrossRef]
  20. Bongiorno, G.; Bünemann, E.K.; Oguejiofor, C.U.; Meier, J.; Gort, G.; Comans, R.; Mader, P.; Brussaard, L.; de Goede, R. Sensitivity of labile carbon fractions to tillage and organic matter management and their potential as comprehensive soil quality indicators across pedoclimatic conditions in Europe. Ecol Indic. 2019, 99, 38–50. [Google Scholar] [CrossRef]
  21. Bronick, C.J.; Lal, R. Soil structure and management: A review. Geoderma 2005, 124, 3–22. [Google Scholar] [CrossRef]
  22. Chan, K.Y.; Heenan, D.P.; Ashley, R. Seasonal changes in surface aggregate stability under different tillage and crops. Soil Till. Res. 1994, 28, 301–314. [Google Scholar] [CrossRef]
  23. Horton, R.; Ankeny, M.D.; Allmaras, R.R. Effects of compaction on soil hydraulic properties. In Soil Compaction in Crop Production; Soane, B.D., van Ouwerkerk, C., Eds.; Elsevier: Amsterdam, The Netherlands, 1994; pp. 141–165. [Google Scholar]
  24. Dec, D.; Dörner, J.; Becker-Fazekas, O.; Horn, R. Effect of bulk density on hydraulic properties of homogenized and structured soils. J. Soil Sci. Plant Nutr. 2008, 8, 1–13. [Google Scholar]
  25. Strudley, W.M.; Green, T.R.; Ascough, J.C., II. Tillage effects on soil hydraulic properties in space and time: State of the science. Soil Till. Res. 2008, 99, 4–48. [Google Scholar] [CrossRef]
  26. Jirků, V.; Kodešová, R.; Nikodem, A.; Mühlhanselová, M.; Žigová, A. Temporal variability of structure and hydraulic properties of topsoil of three soil types. Geoderma 2013, 204, 43–58. [Google Scholar] [CrossRef]
  27. Kool, D.; Tong, B.; Tian, Z.; Heitman, J.L.; Sauer, T.J.; Horton, R. Soil water retention and hydraulic conductivity dynamics following tillage. Soil Till. Res. 2019, 193, 95–100. [Google Scholar] [CrossRef] [Green Version]
  28. Keller, T.; Colombi, T.; Ruiz, S.; Manalili, M.P.; Rek, J.; Stadelmann, V.; Wunderli, H.; Breitenstein, D.; Reiser, R.; Oberholzer, H.; et al. Long-term soil structure observatory for monitoring post-compaction evolution of soil structure. Vadose Zone J. 2017, 16, 1–16. [Google Scholar] [CrossRef] [Green Version]
  29. Chandrasekhar, P.; Kreiselmeier, J.; Schwen, A.; Weninger, T.; Julich, S.; Feger, K.H.; Schwarel, K. Modeling the evolution of soil structural pore space in agricultural soils following tillage. Geoderma 2019, 353, 401–414. [Google Scholar] [CrossRef]
  30. Birkas, M.; Szemők, A.; Antos, G.; Neményi, M. Environmentally-Sound Adaptable Tillage; Akadémiai Kiadó: Budapest, Hungary, 2008. [Google Scholar]
  31. Biddoccu, M.; Ferraris, S.; Pitacco, A.; Cavallo, E. Temporal variability of soil management effects on soil hydrological properties, runoff and erosion at the field scale in a hillslope vineyard, North-West Italy. Soil Till. Res. 2017, 165, 46–48. [Google Scholar] [CrossRef] [Green Version]
  32. Rodrigo-Comino, J.; Novara, A.; Gyasi-Agyei, Y.; Terol, E.; Cerda, A. Effects of parent material on soil erosion within Mediterranean new vineyard plantations. Eng. Geol. 2018, 246, 255–261. [Google Scholar] [CrossRef] [Green Version]
  33. Ouyang, W.; Wu, Y.; Hao, Z.; Zhang, Q.; Bu, Q.; Gao, X. Combined impacts of land use and soil property changes on soil erosion in a mollisol area under long-term agricultural development. Sci. Total Environ. 2018, 613, 298–809. [Google Scholar] [CrossRef] [PubMed]
  34. Bogunovic, I.; Telak, L.J.; Pereira, P. Agriculture management impacts on soil properties and hydrological response in Istria (Croatia). Agronomy 2020, 10, 282. [Google Scholar]
  35. Kisic, I.; Bogunovic, I.; Birkás, M.; Jurisic, A.; Spalevic, V. The role of tillage and crops on a soil loss of an arable Stagnic Luvisol. Arch. Agron. Soil Sci. 2017, 63, 403–413. [Google Scholar] [CrossRef]
  36. Rodrigo-Comino, J. Five decades of soil erosion research in “terroir”. The State-of-the-Art. Earth-Sci. Rev. 2018, 179, 436–447. [Google Scholar] [CrossRef]
  37. Gómez, J.A.; Sobrinho, T.A.; Giráldez, J.V.; Fereres, E. Soil management effects on runoff, erosion and soil properties in an olive grove of Southern Spain. Soil Till. Res. 2009, 102, 5–13. [Google Scholar] [CrossRef]
  38. Rodrigo-Comino, J.; Giménez-Morera, A.; Panagos, P.; Pourghasemi, H.R.; Pulido, M.; Cerdà, A. The potential of straw mulch as a nature-based solution for soil erosion in olive plantation treated with glyphosate: A biophysical and socioeconomic assessment. Land Degrad. Develop. 2019, 31, 1877–1889. [Google Scholar] [CrossRef]
  39. Atucha, A.; Merwin, I.A.; Brown, M.G.; Gardiazabal, F.; Mena, F.; Adriazola, C.; Lehmann, J. Soil erosion, runoff and nutrient losses in an avocado (Persea americana Mill) hillside orchard under different groundcover management systems. Plant Soil 2013, 368, 393–406. [Google Scholar] [CrossRef] [Green Version]
  40. Li, X.H.; Yang, J.; Zhao, C.Y.; Wang, B. Runoff and sediment from orchard terraces in south-eastern China. Land Degrad. Develop. 2014, 25, 184–192. [Google Scholar] [CrossRef]
  41. Marzolff, I.; Ries, J.B.; Poesen, J. Short-term versus medium-term monitoring for detecting gully-erosion variability in a Mediterranean environment. Earth Surf. Process. Landf. 2011, 36, 1604–1623. [Google Scholar] [CrossRef]
  42. Da Silva, A.M.; Moradi, E.; Rodrigo-Comino, J.; Cerdà, A. Spatial variability of soil roughness in persimmon plantations: A new combined ISUM (improved stock unearthing method) approach. Ecol. Indic. 2019, 106, 105528. [Google Scholar] [CrossRef]
  43. Sanchez, L.A.; Ataroff, M.; Lopez, R. Soil erosion under different vegetation covers in the Venezuelan Andes. Environmentalist 2002, 22, 161–172. [Google Scholar] [CrossRef]
  44. Abrisqueta, J.M.; Plana, V.; Mounzer, O.H.; Mendez, J.; Ruiz-Sanchez, M.C. Effects of soil tillage on runoff generation in a Mediterranean apricot orchard. Agric. Water Manag. 2007, 93, 11–18. [Google Scholar] [CrossRef]
  45. Veberic, R.; Colaric, M.; Stampar, F. Phenolic acids and flavonoids of fig fruit (Ficus carica L.) in the northern Mediterranean region. Food Chem. 2008, 16, 153–157. [Google Scholar] [CrossRef]
  46. Pereira, C.; Serradilla, M.J.; Pérez-Gragera, F.; Martín, A.; Villalobos, M.C.; López-Corrales, M. Evaluation of agronomic and fruit quality traits of fig tree varieties (Ficus carica L.) grown in Mediterranean conditions. Span. J. Agric. Res. 2017, 15, e0903. [Google Scholar] [CrossRef] [Green Version]
  47. Croatian Meteorological and Hydrological Service. Available online: https://meteo.hr/index_en.php (accessed on 21 May 2020).
  48. IUSS Working Group WRB. World Reference Base for Soil Resources 2014, Update 2015: International Soil Classification System for Naming Soils and Creating Legends for Soil Maps; World Soil Resources Reports No. 106, 192; IUSS: Vienna, Austria, 2015. [Google Scholar]
  49. Casanova, M.; Tapia, E.; Seguel, O.; Salazar, O. Direct measurement and prediction of bulk density on alluvial soils of central Chile. Chilean J. Agric. Res. 2016, 76, 105–113. [Google Scholar] [CrossRef] [Green Version]
  50. Diaz-Zorita, M.; Perfect, E.; Grove, J.H. Disruptive methods for assessing soil structure. Soil Till. Res. 2002, 64, 3–22. [Google Scholar] [CrossRef]
  51. Le Bissonnais, Y. Aggregate stability and assessment of soil crustability and erodibility: Theory and methodology. Eur. J. Soil Sci. 1996, 47, 425–437. [Google Scholar] [CrossRef]
  52. Kemper, W.D.; Rosenau, R.C. Aggregate Stability and Size Distribution, Methods of Soil Analysis; Klute, A., Ed.; Soil Science Society of America: Madison, WI, USA, 1986; pp. 425–442. [Google Scholar]
  53. Walkley, A.J.; Black, I.A. Estimation of soil organic carbon by the chromic acid titration method. Soil Sci. 1934, 37, 29–38. [Google Scholar] [CrossRef]
  54. Egner, H.; Riehm, H.; Domingo, W.R. Untersuchungen über die chemische Bodenanalyse als Grundlage für die Beurteilung des Nahrstoffzustandes der Boden, II. Chem. Extr. Metod. Phosphorund Kaliumbestimmung K. Lantbr. Ann. 1960, 26, 199–215. [Google Scholar]
  55. Plotly. Chart Studio. Available online: https://chart-studio.plotly.com (accessed on 9 May 2020).
  56. Osunbitan, J.A.; Oyedele, D.J.; Adekalu, K.O. Tillage effects on bulk density, hydraulic conductivity and strength of a loamy sand soil in southwestern Nigeria. Soil Till. Res. 2005, 82, 57–64. [Google Scholar] [CrossRef]
  57. Mubarak, I.; Mailhol, J.C.; Angulo-Jaramillo, R.; Ruelle, P.; Boivin, P.; Khaledian, M. Temporal variability in soil hydraulic properties under drip irrigation. Geoderma 2009, 150, 158–165. [Google Scholar] [CrossRef] [Green Version]
  58. Tian, Z.; Gao, W.; Kool, D.; Ren, T.; Horton, R.; Heitman, J.L. Approaches for estimating soil water retention curves at various bulk densities with the extended van Genuchten model. Water Resour. Res. 2018, 54, 5584–5601. [Google Scholar] [CrossRef]
  59. Busscher, W.J.; Bauer, P.J.; Frederick, J.R. Recompaction of a coastal loamy sand after deep tillage as a function of subsequent cumulative rainfall. Soil Till. Res. 2002, 68, 49–57. [Google Scholar] [CrossRef]
  60. Heikkinen, J.; Keskinen, R.; Soinne, H.; Hyväluoma, J.; Nikama, J.; Wikberg, H.; Källi, A.; Siipola, V.; Melkior, T.; Dupont, C.; et al. Possibilities to improve soil aggregate stability using biochars derived from various biomasses through slow pyrolysis, hydrothermal carbonization, or torrefaction. Geoderma 2019, 344, 40–49. [Google Scholar] [CrossRef]
  61. Calderón, F.J.; Jackson, L.E.; Scow, K.M.; Rolston, D.E. Microbial responses to simulated tillage in cultivated and uncultivated soils. Soil Biol. Biochem. 2000, 32, 1547–1559. [Google Scholar] [CrossRef]
  62. Lal, R. Carbon Sequestration, Terrestrial. In Reference Module in Earth Systems and Environmental Sciences; Elsevier: Amsterdam, The Netherlands, 2013; Volume 1, pp. 289–298. [Google Scholar]
  63. Yang, F.; Zhang, G.L.; Yang, J.L.; Li, D.C.; Zhao, Y.G.; Liu, F.; Yang, R.M.; Yang, F. Organic matter controls of soil water retention in an alpine grassland and its significance for hydrological processes. J. Hydrol. 2014, 519, 3086–3093. [Google Scholar] [CrossRef]
  64. Zhao, J.; Chen, S.; Hu, R.; Li, Y. Aggregate stability and size distribution of red soils under different land uses integrally regulated by soil organic matter, and iron and aluminium oxides. Soil Till. Res. 2017, 167, 73–79. [Google Scholar] [CrossRef] [Green Version]
  65. Šimansky, V.; Juriga, M.; Jonczak, J.; Uzarowicz, L.; Stepien, W. How relationships between soil organic matter parameters and soil structure characteristics are affected by the long-term fertilization of a sandy soil. Geoderma 2019, 342, 75–84. [Google Scholar] [CrossRef]
  66. Peng, X.; Yan, X.; Zhou, H.; Zhang, Y.Z.; Sun, H. Assessing the contributions of sesquioxides and soil organic matter to aggregation in an Ultisol under long-term fertilization. Soil Till. Res. 2014, 146, 89–98. [Google Scholar] [CrossRef]
  67. Yu, Z.; Zhang, J.; Zhang, C.; Xin, X.; Li, H. The coupling effects of soil organic matter and particle interaction forces on soil aggregate stability. Soil Till. Res. 2017, 174, 251–260. [Google Scholar] [CrossRef]
  68. Wuddivira, M.N.; Camps-Roach, G. Effects of organic matter and calcium on soil structural stability. Eur. J. Soil Sci. 2006, 58, 722–727. [Google Scholar] [CrossRef]
  69. Assouline, S.; Selker, J.S.; Parlange, J.Y. A simple accurate method to predict time of ponding under variable intensity rainfall. Water Resour. Res. 2007, 43. Available online: https://agupubs.onlinelibrary.wiley.com/doi/10.1029/2006WR005138 (accessed on 20 November 2020). [CrossRef] [Green Version]
  70. Mu, H.; Yu, X.; Fu, S.; Yu, B.; Liu, Y.; Zhang, G. Effect of stem basal cover on the sediment transport capacity of overland flows. Geoderma 2019, 337, 384–393. [Google Scholar] [CrossRef]
  71. Nicosia, A.; Di Stefano, C.; Palmeri, V.; Pampalone, V.; Ferro, V. Flow resistance of overland flow on a smooth bed under simulated rainfall. Catena 2020, 187, 104351. [Google Scholar] [CrossRef]
  72. Ribolzi, O.; Evrard, O.; Huon, S.; de Rouw, A.; Silvera, N.; Latsachack, O.; Soulileuth, B.; Lefèvre, I.; Pierret, A.; Lacombe, G.; et al. From shifting cultivation to teak plantation: Effect on overland flow and sediment yield in a montane tropical catchment. Sci. Rep. 2017, 7, 3987. [Google Scholar] [CrossRef] [PubMed]
  73. Lacombe, G.; Valentin, C.; Sounyafong, P.; de Rouw, A.; Soulileuth, B.; Silvera, N.; Pierret, A.; Sengtaheuanghoung, O.; Ribolzi, O. Linking crop structure, throughfall, soil surface conditions, runoff and soil detachment: 10 land uses analyzed in Northern Laos. Sci. Total Environ. 2018, 616, 1330–1338. [Google Scholar] [CrossRef]
  74. Sadeghi, S.H.; Harchegani, M.K.; Asadi, H. Variability of particle size distributions of upward/downward splashed materials in different rainfall intensities and slopes. Geoderma 2017, 290, 100–106. [Google Scholar] [CrossRef]
  75. Shiedung, H.; Bornemann, L.; Welp, G. Seasonal Variability of Soil Organic Carbon Fractions Under Arable Land. Pedosphere 2017, 27, 380–386. [Google Scholar] [CrossRef]
  76. Zumr, D.; Jeřábek, J.; Klípa, V.; Dohnal, M.; Sněhota, M. Estimates of Tillage and Rainfall Effects on Unsaturated Hydraulic Conductivity in a Small Central European Agricultural Catchment. Water 2019, 11, 740. [Google Scholar] [CrossRef] [Green Version]
  77. Verheijen, F.G.A.; Jones, R.J.A.; Rickson, R.J.; Smith, C.J.; Bastos, A.C.; Nunes, J.P.; Keizer, J.J. Concise overview of European soil erosion research and evaluation. Acta Agric. Scand. B 2012, 62, 185–190. [Google Scholar] [CrossRef]
  78. Meinen, B.U.; Robinson, D.T. Where did the soil go? Quantifying one year of soil erosion on a steep tile-drained agricultural field. Sci. Total Environ. 2020, 729, 138320. [Google Scholar] [CrossRef] [PubMed]
  79. Pereira, P.; Barcelo, D.; Panagos, P. Soil and water threats in a changing environment. Environ. Res. 2020, 186, 109501. [Google Scholar] [CrossRef] [PubMed]
  80. Shabnam, R.; Hasan Tarek, M.; Toufiq Iqbal, M. Understanding phosphorus dynamics in wheat plant and growth response in a split-root system in acidic soil. Agric. Nat. Resour. 2018, 52, 259–265. [Google Scholar] [CrossRef]
  81. Li, F.R.; Liu, L.L.; Liu, J.L.; Yang, Y. Abiotic and biotic controls on dynamics of labile phosphorus fractions in calcareous soils under agricultural cultivation. Sci. Total Environ. 2019, 81, 163–174. [Google Scholar] [CrossRef]
  82. Komissarov, M.; Ogura, S.I. Siltation and radiocesium pollution of small lakes in different catchment types far from the Fukushima Daiichi nuclear power plant accident site. Int. Soil Water Conserv. Res. 2020, 8, 56–65. [Google Scholar] [CrossRef]
  83. Ulrich, A.E.; Malley, D.F.; Watts, P.D. Lake Winnipeg Basin: Advocacy, challenges and progress for sustainable phosphorus and eutrophication control. Sci. Total Environ. 2016, 542, 1030–1039. [Google Scholar] [CrossRef]
  84. Pereira, P.; Bogunovic, I.; Munoz-Rojas, M.; Brevik, E. Soil ecosystem services, sustainability, valuation and management. Curr. Opin. Environ. Sci. Health 2018, 5, 7–13. [Google Scholar] [CrossRef]
Figure 1. Location of the Peračko Blato study area, the eight experimental plots, and temporal changes in the soil surface within the fig orchard.
Water 12 03295 g001
Figure 2. Monthly average precipitation and temperature between 1998 and 2018 and during the study year (2018). Data from the Ploče city meteorological station (43°2′ N, 17°26′ E, 2 m a.s.l.). The meteorological station is located 2.9 km from the studied fig orchard.
Water 12 03295 g002
Figure 3. Differences in soil physical properties within the fig orchard study site over the study period: (A) soil water content, (B) water holding capacity, (C) bulk density, (D) mean weight diameter, and (E) water-stable aggregate distribution. Upper hanging bar (maximum), lower hanging bar (minimum), upper box line (quartile 3), line (median) and lower box line (quartile 1). Different lower-case letters represent significant differences between monitoring periods (p < 0.05). Dots next to a boxplot represent measured values.
Water 12 03295 g003aWater 12 03295 g003b
Figure 4. Differences in soil chemical properties within the fig orchard study site over the study period: (A) soil organic matter and (B) available phosphorus according to the time after tillage. Upper hanging bar (maximum), lower hanging bar (minimum), upper box line (quartile 3), line (median), and lower box line (quartile 1). Different lower-case letters represent significant differences between treatments (p < 0.05). Dots next to a boxplot represent measured values.
Water 12 03295 g004
Figure 5. Hydrological response over the study period: (A) time to ponding, (B) time to runoff, (C) water runoff, (D) sediment concentration, and (E) sediment loss distribution according to the time after tillage. Upper hanging bar (maximum), lower hanging bar (minimum), upper box line (quartile 3), line (median), and lower box line (quartile 1). Different lower-case letters represent significant differences between treatments (p < 0.05). Dots next to a boxplot represent measured values.
Water 12 03295 g005aWater 12 03295 g005b
Figure 6. Nutrient loss during the rainfall simulation experiments: (A) carbon loss and (B) phosphorus loss distribution according to the time after tillage. Upper hanging bar (maximum), lower hanging bar (minimum), upper box line (quartile 3), line (median), and lower box line (quartile 1). Different lower-case letters represent significant differences between treatments (p < 0.05). Dots next to a boxplot represent measured values.
Water 12 03295 g006
Figure 7. Results of the principal component analyses. Relation between Factors 1 and 2, (A) variables and (B) cases. Bulk density (BD); water holding capacity (WHC); soil water content (SWC); mean weight diameter (MWD); water-stable aggregate (WSA) content; soil organic matter (SOM); available phosphorous (P2O5); time to ponding (TP); time to runoff (TR); water runoff (WR), sediment concentration (SC); sediment loss (SL); carbon loss (C loss) and available phosphorous loss (P loss).
Water 12 03295 g007
Table 1. General soil properties of the study location. Abbreviations: carbonates (CaCO3), soil organic matter (SOM), calcium (Ca), magnesium (Mg), potassium (K), sodium (Na), and cation exchange capacity (CEC).
PropertiesTexture (%)pHCaCO3 (%)SOM (%)Exchangeable Cations
(cmol kg−1)
CEC (cmol kg−1)
SandSiltClayCaMgKNa
Value11.677.211.27.5283.452.6818.910.700.300.2520.16
Publisher’s Note: MDPI stays neutral with regard to jurisdictional claims in published maps and institutional affiliations.

