Article

Investigation on the Water Flow Evolution in a Filled Fracture under Seepage-Induced Erosion

1
State Key Laboratory of Mining Disaster Prevention and Control, Shandong University of Science and Technology, Qingdao 266590, China
2
Department of Civil and Environmental Engineering, Stanford University, Stanford, CA 94305, USA
*
Author to whom correspondence should be addressed.
Water 2020, 12(11), 3188; https://doi.org/10.3390/w12113188
Submission received: 20 October 2020 / Revised: 12 November 2020 / Accepted: 12 November 2020 / Published: 14 November 2020
(This article belongs to the Special Issue Erosion Processes in Hydraulic Engineering)

Abstract

:
Water inrush is a major geological hazard for safe mining and tunnel construction. For the water inrush channel containing mud, sand, and other sediments, it is difficult to predict the change of permeability and water surge, which makes disaster prevention difficult. As a typical water inrush channel, a filled fracture under seepage-induced erosion needs to be focused. In this work, a numerical model for the evolution of flow in a filled fracture under seepage-induced erosion was established, which included the seepage velocity, hydraulic erosion, and permeability of the filling medium. The effects of joint roughness coefficient (JRC) and homogeneity of the filling medium on the seepage evolution are discussed. The results showed that the fracture seepage properties experienced a non-linear change process, and the evolution can be divided into three phases: the slowly varying phase, the rapidly varying phase, and the stable phase. The increase of the JRC hindered the development in flow velocity and erosion. Compared with low homogeneous filling medium, pores in the high homogeneous filling medium were easier to expand and connect, and the seepage characteristics evolved faster. The model established in this study will help to understand the seepage evolution of filled fractures, and can be used to predict the permeability of filled fractures in engineering geology.

1. Introduction

Since the 21st century, geotechnical engineering has flourished in China, and the quantity and scale of underground engineering projects has dramatically increased. Due to the unprecedented complexity of geological and hydrological conditions, water inrush has become one of the most serious geological hazards, seriously threatening safety. As the emphasis of traffic construction gradually shifted to mountainous and karst areas, there are more and more tunnel projects with strong karst and complex structure [1]. When there are excavation-induced fissures in front of the tunnel, the permeability of these fractures increases gradually under the seepage erosion of groundwater, finally resulting in water inrush accompanied by the outflow of solid fillings (see Figure 1).
At the same time, it is pointed out that over 90% of the groundwater inrush accidents are caused by the groundwater flow from karst aquifers [2]. Due to strong erosion of the groundwater flow, a large number of cavities are easily formed in the underlying soluble rock stratum. Subsequently, the overlying strata lose their stability, and the rock fragments fall into the cavitation space, eventually forming the karst collapse pillar (KCP). The KCP zone contains a significant amount of rock fragments (granular rocks), which can be continuously eroded under water pressure [3]. As shown in Figure 2a, the KCP zone plays the role of water inrush channel in underground mining. In addition, after the adequate extraction of the coal seam in the longwall mining, the overlying strata are deformed, forming the caved zone, fractured zone, and continuous bending zone [4]. When mining-induced fractures develop upwards into unconsolidated sandy aquifer, water and sand will continuously gush out to the working face under the action of seepage (see Figure 2b). The common feature of these hazards is not only the fractures connecting groundwater and workspace, but also the infiltration and erosion of filling medium such as fine sand, silt, and other sediments.
Recently, scholars have conducted extensive studies into water inrush hazard from different professional perspectives, with important findings having been made. Li et al. [5] carried out a true triaxial mechanical similar model to gain the precursor information of water inrush in karst tunnels. Bai et al. [6] established a mechanical model of groundwater seepage in the karst collapse pillars. Ma et al. [7] carried out a series of seepage-induced particle erosion experiments to investigate the nonlinear hydraulic properties of fractured red sandstones. By considering the process of infilling loss, Li et al. [8] proposed the vadose conversion theory of “from pore-scale flow to fracture-scale flow to piping” in the water inrush channels. On the basis of the disaster-causing structures formed due to water inrush and mud inrush in tunnels, Li et al. [9] developed a system for testing the instability of filling structures due to seepage and revealed the law of changes in the stability and permeability of the filling medium. Yang et al. [10] simulated fractured rock masses using smooth steel balls and performed non-linear seepage experiments in unconsolidated porous media under a high hydraulic gradient. As such, the effect of filling medium on water flow in water inrush channel has been widely concerned, but the evolution of flow in filled fractures are not investigated clearly.
For a long time, the flow behavior of fluid is an intriguing research topic for seepage theory of fractured rock mass [11,12,13]. On the one hand, the structural form of fractures and the connectivity of the fracture network effectively control the fluid flow [14,15,16,17]. Chen et al. [14] proposed a quantitative model to represent the relationship between the fracture geometric characteristics and the non-Darcy coefficient. The smoother the fracture surfaces and the greater the connectivity of the fracture network, the lower the hydraulic gradient for the onset of nonlinear flows [15]. Larger apertures, rougher fracture surfaces, and a greater number of intersections in a discrete fracture network would result in the onset of nonlinear flow at a lower critical hydraulic gradient [16]. On the other hand, the seepage pressure will result in a seepage damage effect on the rock mass structure, which may lead to a gradual change in the properties of fracture structures and affect the flow state accordingly [18,19,20,21]. Ma et al. [7] observed that with the seepage erosion processes, porosity and permeability of all samples increase, while non-Darcy factor decreases in the experiment. A mechanism by which natural fractures may impact reservoir flow is by the reactivation of natural fractures that become extensions of the hydraulic fracture network [18]. Shan and Lai [19] proposed a numerical approach to the simulation of fluid–solid coupling during the failure of a fractured coal–rock mass. Recently, according the spatial characteristics of the non-Darcy flow, flow regime transformation in the process of water inrush have been specifically described [22,23,24].
In fact, due to the erosion caused by water flow, fine particles can constantly migrate from the rock mass to fluid, resulting in local variations of porosity and permeability with time. This process may lead to changes in the seepage field, with any increase in flow rate promoting the erosion effects. This is a process of mutual influence and mutual promotion. In recent years, some scholars [25,26,27] have investigated the nonlinear hydraulic properties of variable mass flow by genetic algorithm. Although a series of data can be obtained under seepage-induced erosion, the evolution process of seepage has not been observed.
Rapid outflows of water from the rock mass usually begin with micro-infiltration. The aim of this paper was to establish a seepage erosion-coupled model and reveal water flow evolution in a filled fracture under seepage-induced erosion. This paper mainly presents the process of pores extending to the whole fracture domain under seepage erosion in a single filled fracture by numerical simulation. The effects of different JRCs (joint roughness coefficients) and homogeneity of filling medium on seepage evolution in fractures are analyzed. According the evolution of nonlinear hydraulic characteristics, the seepage process can be divided into three phases. The numerical simulation and experiment results are in good agreement, which provide a reference for permeability prediction of filled fractures in engineering geology.

2. Mathematical Model

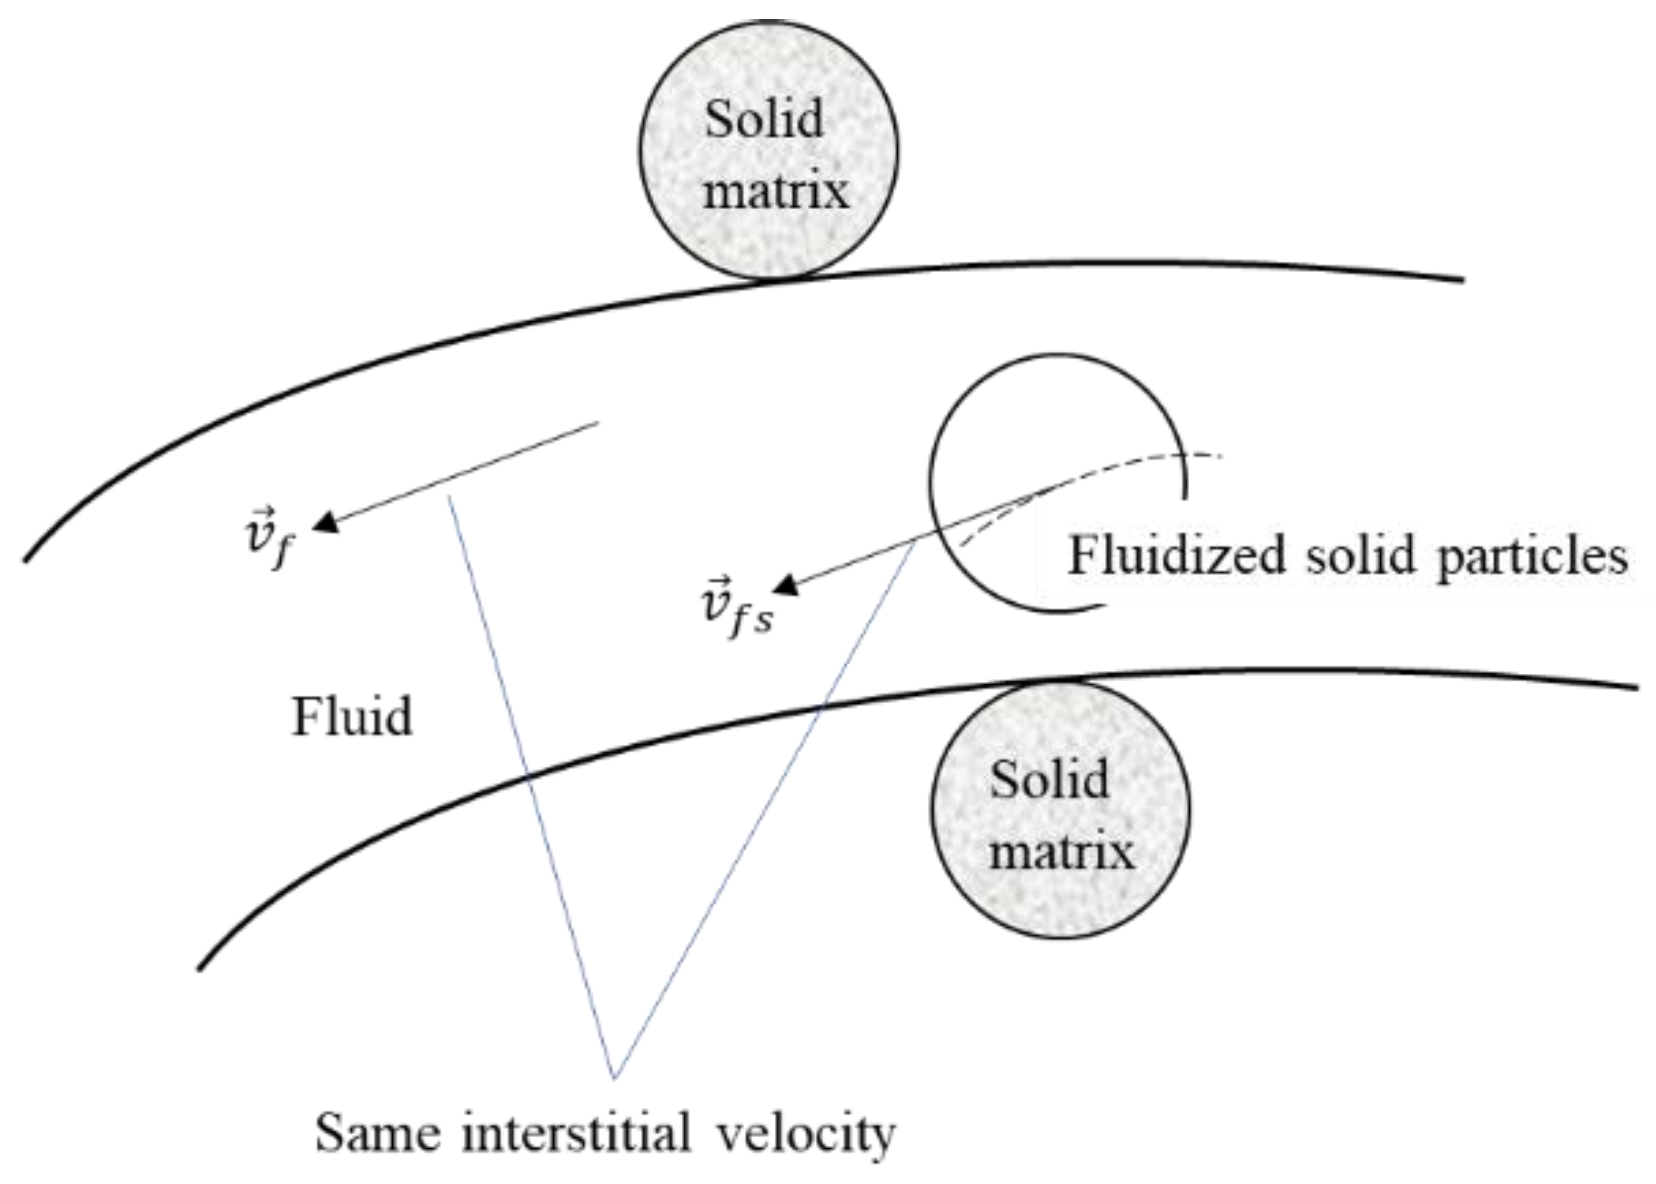
2.1. Basic Assumptions

In order to establish a mathematical model for the seepage evolution of filled fractures, we made the following assumptions: (1) fracture filling medium is regarded as a rigid (non-deformable) porous medium; (2) the fluid flow through the filling medium follows Darcy’s law; (3) fluids and fluidized solid particles are incompressible, which means the fluid density ρ f and solid density ρ s are constants; (4) the mass and size of the fluidized solid particles generated by erosion are so small that the they share the same velocity field with the fluid (see Figure 3); (5) the erosion effect of water flow is proportional to the fluid flow velocity. It is worth noting that these assumptions are idealized and there are more complex factors in the actual situation that have not been considered.

2.2. Governing Equations

2.2.1. Mass Conservation

Suppose there is a spatial representative elementary volume (REV) in the fracture flow domain, which contains solid matrix, fluid, and fluidized solid particles. According to the mass conservation law, the continuity equations could be established. Let us denote the volume of REV as V b , and in this REV, the volumes of fluid and fluidized solid particles are V f and V f s , respectively, which means the volume of solid matrix in this REV is V s m = V b V s V f s . The porosity φ is defined as
φ = V f + V f s V b
The pore fraction C of solid particles is defined as
C = V f s V f + V f s
Note that C φ = V f s / V b and ( 1 C ) φ = V f / V b . The general form of the convection–diffusion equation is given as
c t = · ( D · c ) · ( c v ) + R
where c is the variable of interest (species concentration for mass transfer, temperature for heat transfer), D is the second-order tensor for diffusion and mechanical dispersion, v is the velocity field that quantity is moving with, R describes sources or sinks of the quantity c, represents gradient, and represents divergence. We therefore apply Equation (3) to both the motion of fluid and the motion of fluidized solid particles.
For fluidized solid particles, we replace c in Equation (3) with ρ s C φ , and replace R in Equation (3) with ρ s φ / t , obtaining
( ρ s C φ ) t = · [ D · ( ρ s C φ ) ] · ( ρ s C φ v ) + ρ s φ t
The velocity v in Equation (4) is interpreted as the interstitial (true) velocity of the flow field, and we define Darcy (superficial) velocity q as
q = φ v
The source term ρ s φ / t represents the particle mass density that migrates into the flow system from the solid matrix or deposits from the flow system per unit time. Since ρ s is a constant, we further simplify Equation (4) as
( C φ ) t = · [ D · ( C φ ) ] · ( C q ) + φ t
In this work, we assume the diffusion and mechanical dispersion can be neglected due to the tiny particle size, i.e., D 0 [28].
For fluid flow, similar to Equation (4), we replace c in Equation (3) with ρ f ( 1 C ) φ , and ignore the diffusivity tensor D and source/sink term R, obtaining
[ ρ f ( 1 C ) φ ] t + · [ ρ f ( 1 C ) φ v ] = 0
According to the fourth assumption, the velocity v in Equation (7) is the same as that in Equation (4); therefore, by adopting the definition of Darcy velocity and the fact that ρ f is a constant, we can simplify Equation (7) as
[ ( 1 C ) φ ] t + · [ ( 1 C ) q ] = 0

2.2.2. Darcy’s Law

Darcy’s Law was obtained from the seepage experiments of homogeneous sand beds [29]. This law describes the linear seepage behavior in porous media and is suitable for the seepage that occurs in the fracture filling medium. The general Darcy’s law is given as follows
q = k η · ( p ρ f g )
where k is the second-order permeability, η is the dynamic viscosity of the fluid, p is the pore pressure, and g is the gravity acceleration vector. In this work, we only consider the case when k is isotropic, i.e., k = k1, where k is the scalar permeability and 1 is the second-order identity tensor. We will leave the anisotropic case in the future publications.

2.2.3. Seepage Erosion Equation

The loss of infilling particles under hydraulic erosion is actually a process of expansion and interconnection of infilling pores. Vardoulakis et al. [30] summarized the studies of porous media erosion and revealed the effect of hydraulic erosion on the porosity and permeability of porous media. Considering the seepage-induced erosion, the porosity evolution of porous media is given as [31]
φ t = λ ( 1 φ ) C | q |
where λ is the erosion coefficient that has the dimension of inverse length, and | q | = q x 2 + q y 2 + q z 2 is the magnitude of fluid flow velocity. We can see that Equation (10) satisfies the fifth assumption.

2.2.4. Permeability Evolution

The Kozeny–Carman (K-C) equation reflects the relationship between permeability and porosity [32]. Chapuis and Aubertin evaluated the applicability and feasibility of the K-C equation through permeability experiments [33]. The K-C equation is given as follows [28]:
k = k 0 ( φ φ 0 ) 3 ( 1 φ 0 1 φ ) 2
where k 0 is the reference permeability and φ 0 is the reference porosity.

2.2.5. Equation Coupling and (Initial) Boundary Conditions

Equations (6), (8)–(11) jointly comprise the mathematical model for the flow evolution of fracture with filling medium under the seepage-induced erosion. The equations can be solved with given initial and boundary conditions for p, φ , and C.
In this paper, the C automatically satisfies the no-flux boundary condition, and we prescribe the value of C at the inlet boundary. For pore pressure p, we prescribe its value at the inlet and the outlet boundaries, and we assume zero flux other boundaries. The initial conditions for p, φ , and C are set as
p ( X , t = 0 ) = p ¯ ( X )   C ( X , t = 0 ) = C ¯   φ ( X , t = 0 ) = φ ¯ ( X )
where X represents the spatial coordinate, p ¯ ( X ) and φ ¯ ( X ) are given functions of X , and C ¯ is a given constant.

3. Model Implementation

A wave-shaped artificial fissure is designed to facilitate the fabrication of specimens for experimental verification. The physical model discussed in this section is shown in Figure 4. The length of this two-dimensional rough fracture was 20 cm. The out-of-plane thickness of this model was 1.5 cm. The rock fractures were full of infilling material. The minimum aperture in the fracture was 1.5 cm, and the maximum aperture was 3 cm, as shown in Figure 4a. The boundary condition for the model are shown in Figure 4b. To the left is the pressure inlet boundary, where the water pressure was 1 kPa. The outlet pressure on the right side of the model was 0. The initial pressure distribution p ¯ ( X ) = 1 x / L (kPa), where x is the horizontal coordinate and L is the model length (20 cm in this model). In our setting, x = 0 means the inlet boundary and x = L means the outlet boundary. Ignoring the seepage of rock matrix (grey region), the other boundaries of the model were set as no-flux boundaries. The inlet pore fraction C was also assumed to be C ¯ . The parameters of the numerical simulation are shown in Table 1. Gravity is not considered in our simulation since the flow direction was always horizontal.
In order to ensure the two-dimensional roughness index reflects the directional characteristics of a rock joint profile, many scholars have conducted many related studies [34,35,36,37]. The JRC of the fracture contour line in this model was calculated as 22.6, and the computing formula adopted was as follows [37]:
JRC = 32.69 + 32.98 log Z 2
Z 2 = [ 1 L 0 L ( d y d x ) 2 d x ] 1 / 2 = [ 1 ( N 1 ) ( Δ x ) 2 i = 1 N 1 ( y i + 1 y i ) 2 ] 1 / 2
where L is the borderline horizontal length (20 cm in this model); ∆x is the sampling interval in the horizontal direction, which is 0.5 mm; y is the vertical coordinate; and N is the total number of samples taken (400 in this model).
In fact, the mud, sand, and other sediments were filled in the fractures, which resulted in the non-uniform distribution of pores and also had a complex effect on the permeability. However, due to the interaction between the solid and the fluid, it is very difficult to realize a high-precision simulation in seepage process [38]. Previous studies use statistical methods to show that the heterogeneity of geotechnical materials could be described by the Weibull distribution [39,40]. Therefore, the heterogeneity generated by discrete particles was considered to be equivalent to the Weibull distribution of the initial porosity, and the Weibull distribution probability density function was as follows:
f ( φ ˜ ) = m φ 0 ( φ ˜ φ 0 ) m 1 exp [ ( φ ˜ φ 0 ) m ]
where φ ˜ > 0 is a random variable, φ 0 represents the reference porosity which is the same as that in Equation (11), and m represents the homogeneity coefficient. The initial porosity distribution φ ¯ ( X ) generated by the Weibull distribution is shown in Figure 5.

4. Results and Model Validation

In this section, the evolution of seepage characteristics based on the simulation results was analyzed, and the feasibility of the model was verified through experiments.

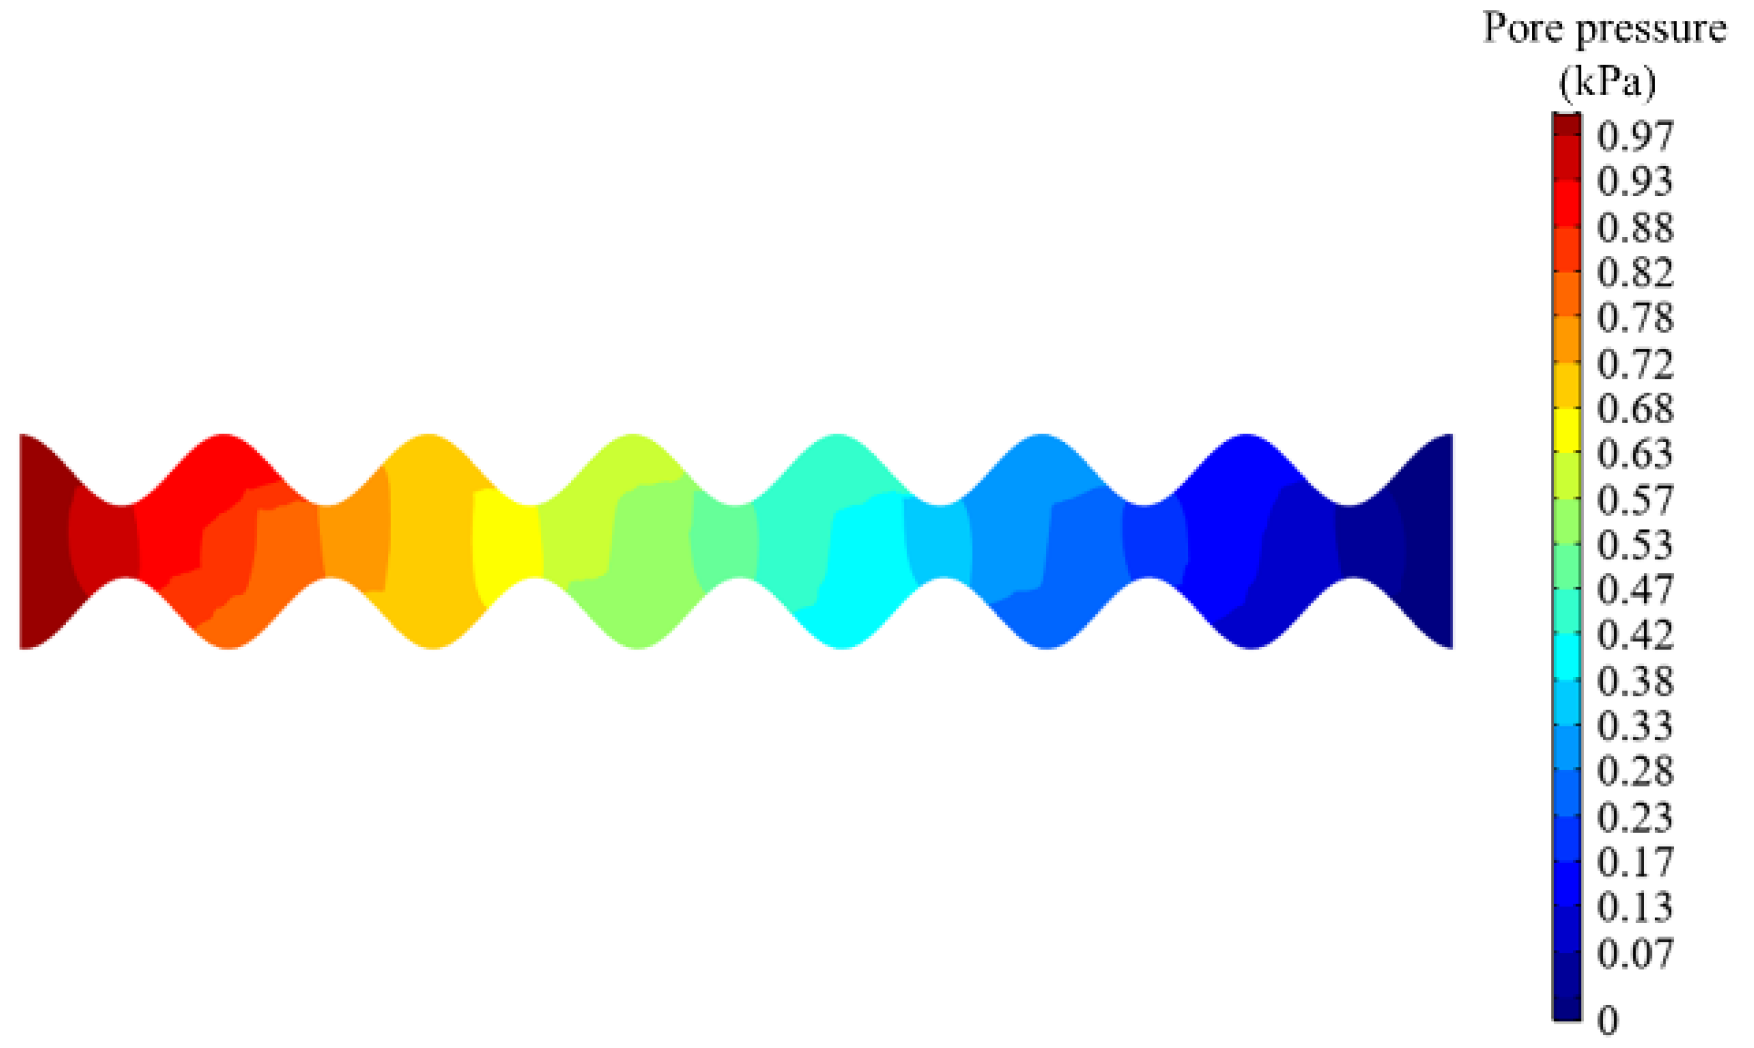
4.1. Pore Pressure Distribution

If we add Equation (6) with Equation (8), we get
· q = 0
which is the incompressible flow equation of the mixture that contains water and fluidized solid particles. Due to this incompressible nature, the resulting pore pressure distribution was almost stable with varying time, as shown in Figure 6. From Figure 6, we can see that the contour line was always perpendicular to the fracture boundary which is consistent with our expectation since the fluid cannot flow across that boundary.
In fact, by using Equation (16), we can further simplify Equation (6) as
φ C t + q · C = ( 1 C ) φ t
which demonstrates the convective nature of C. Now we can state that for this seepage erosion problem, it is equivalent to solve Equations (9)–(11), (16), and (17) with the proper initial and boundary conditions given in Section 2.2.5.

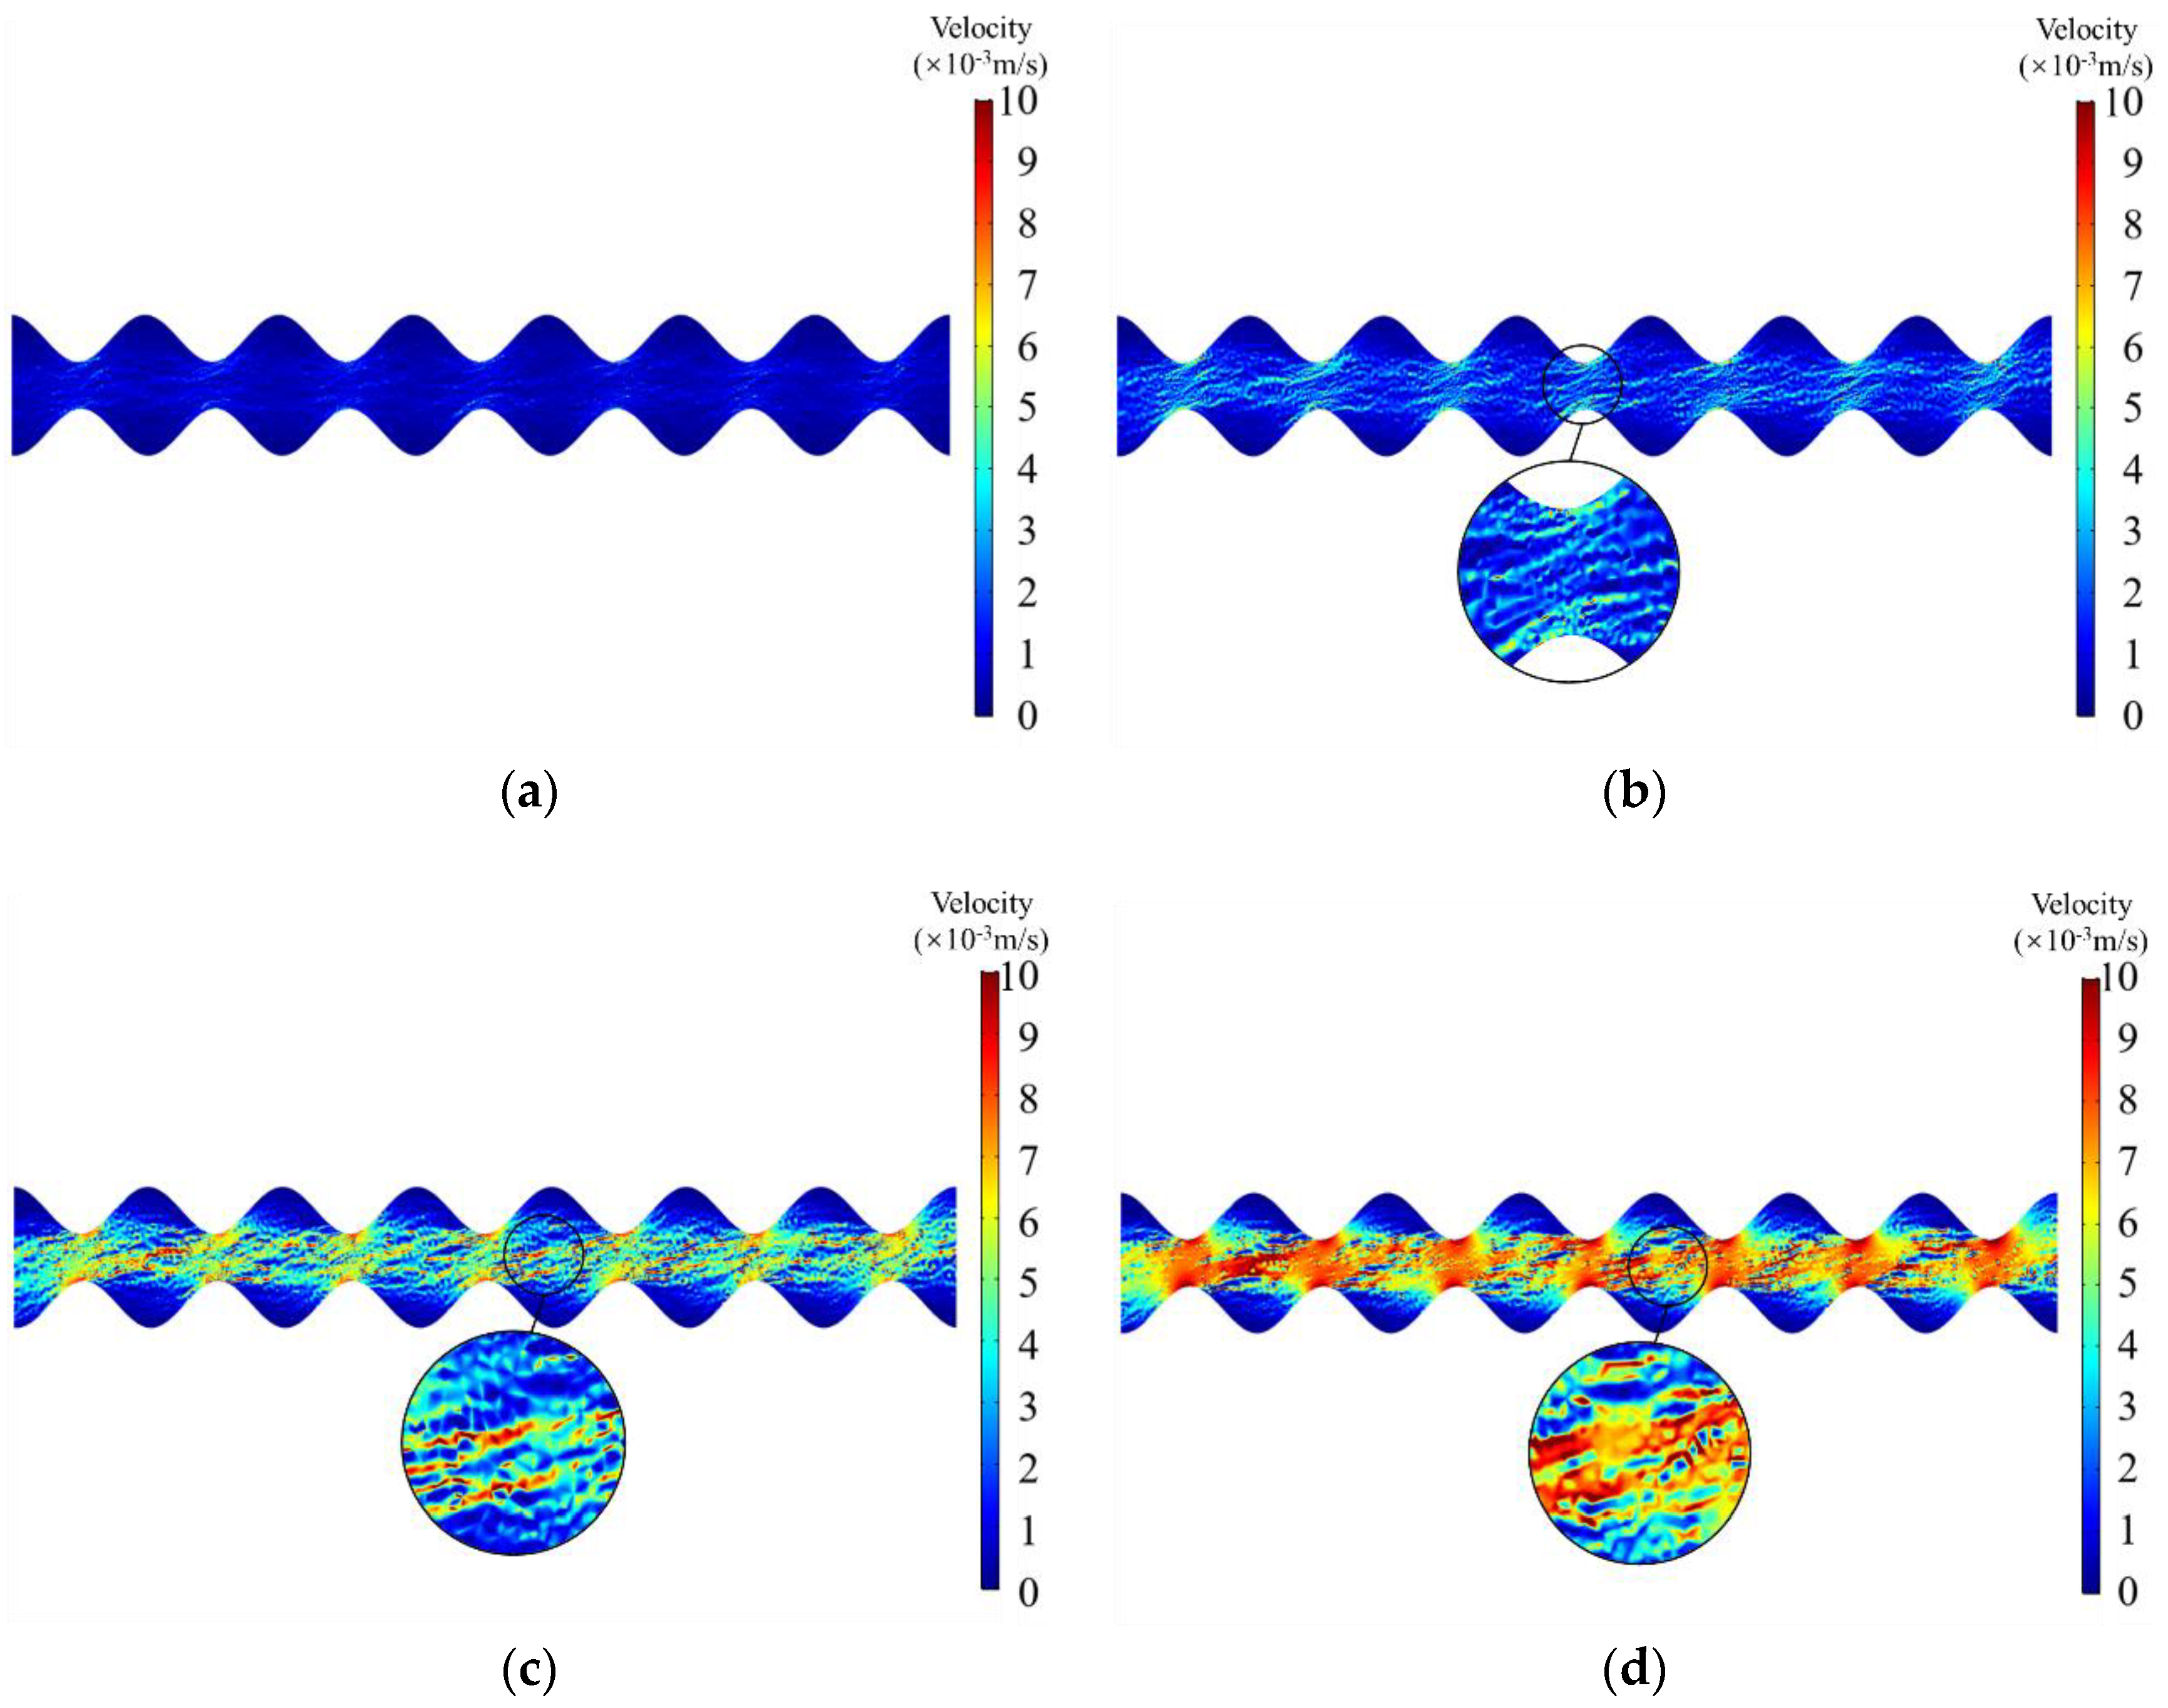
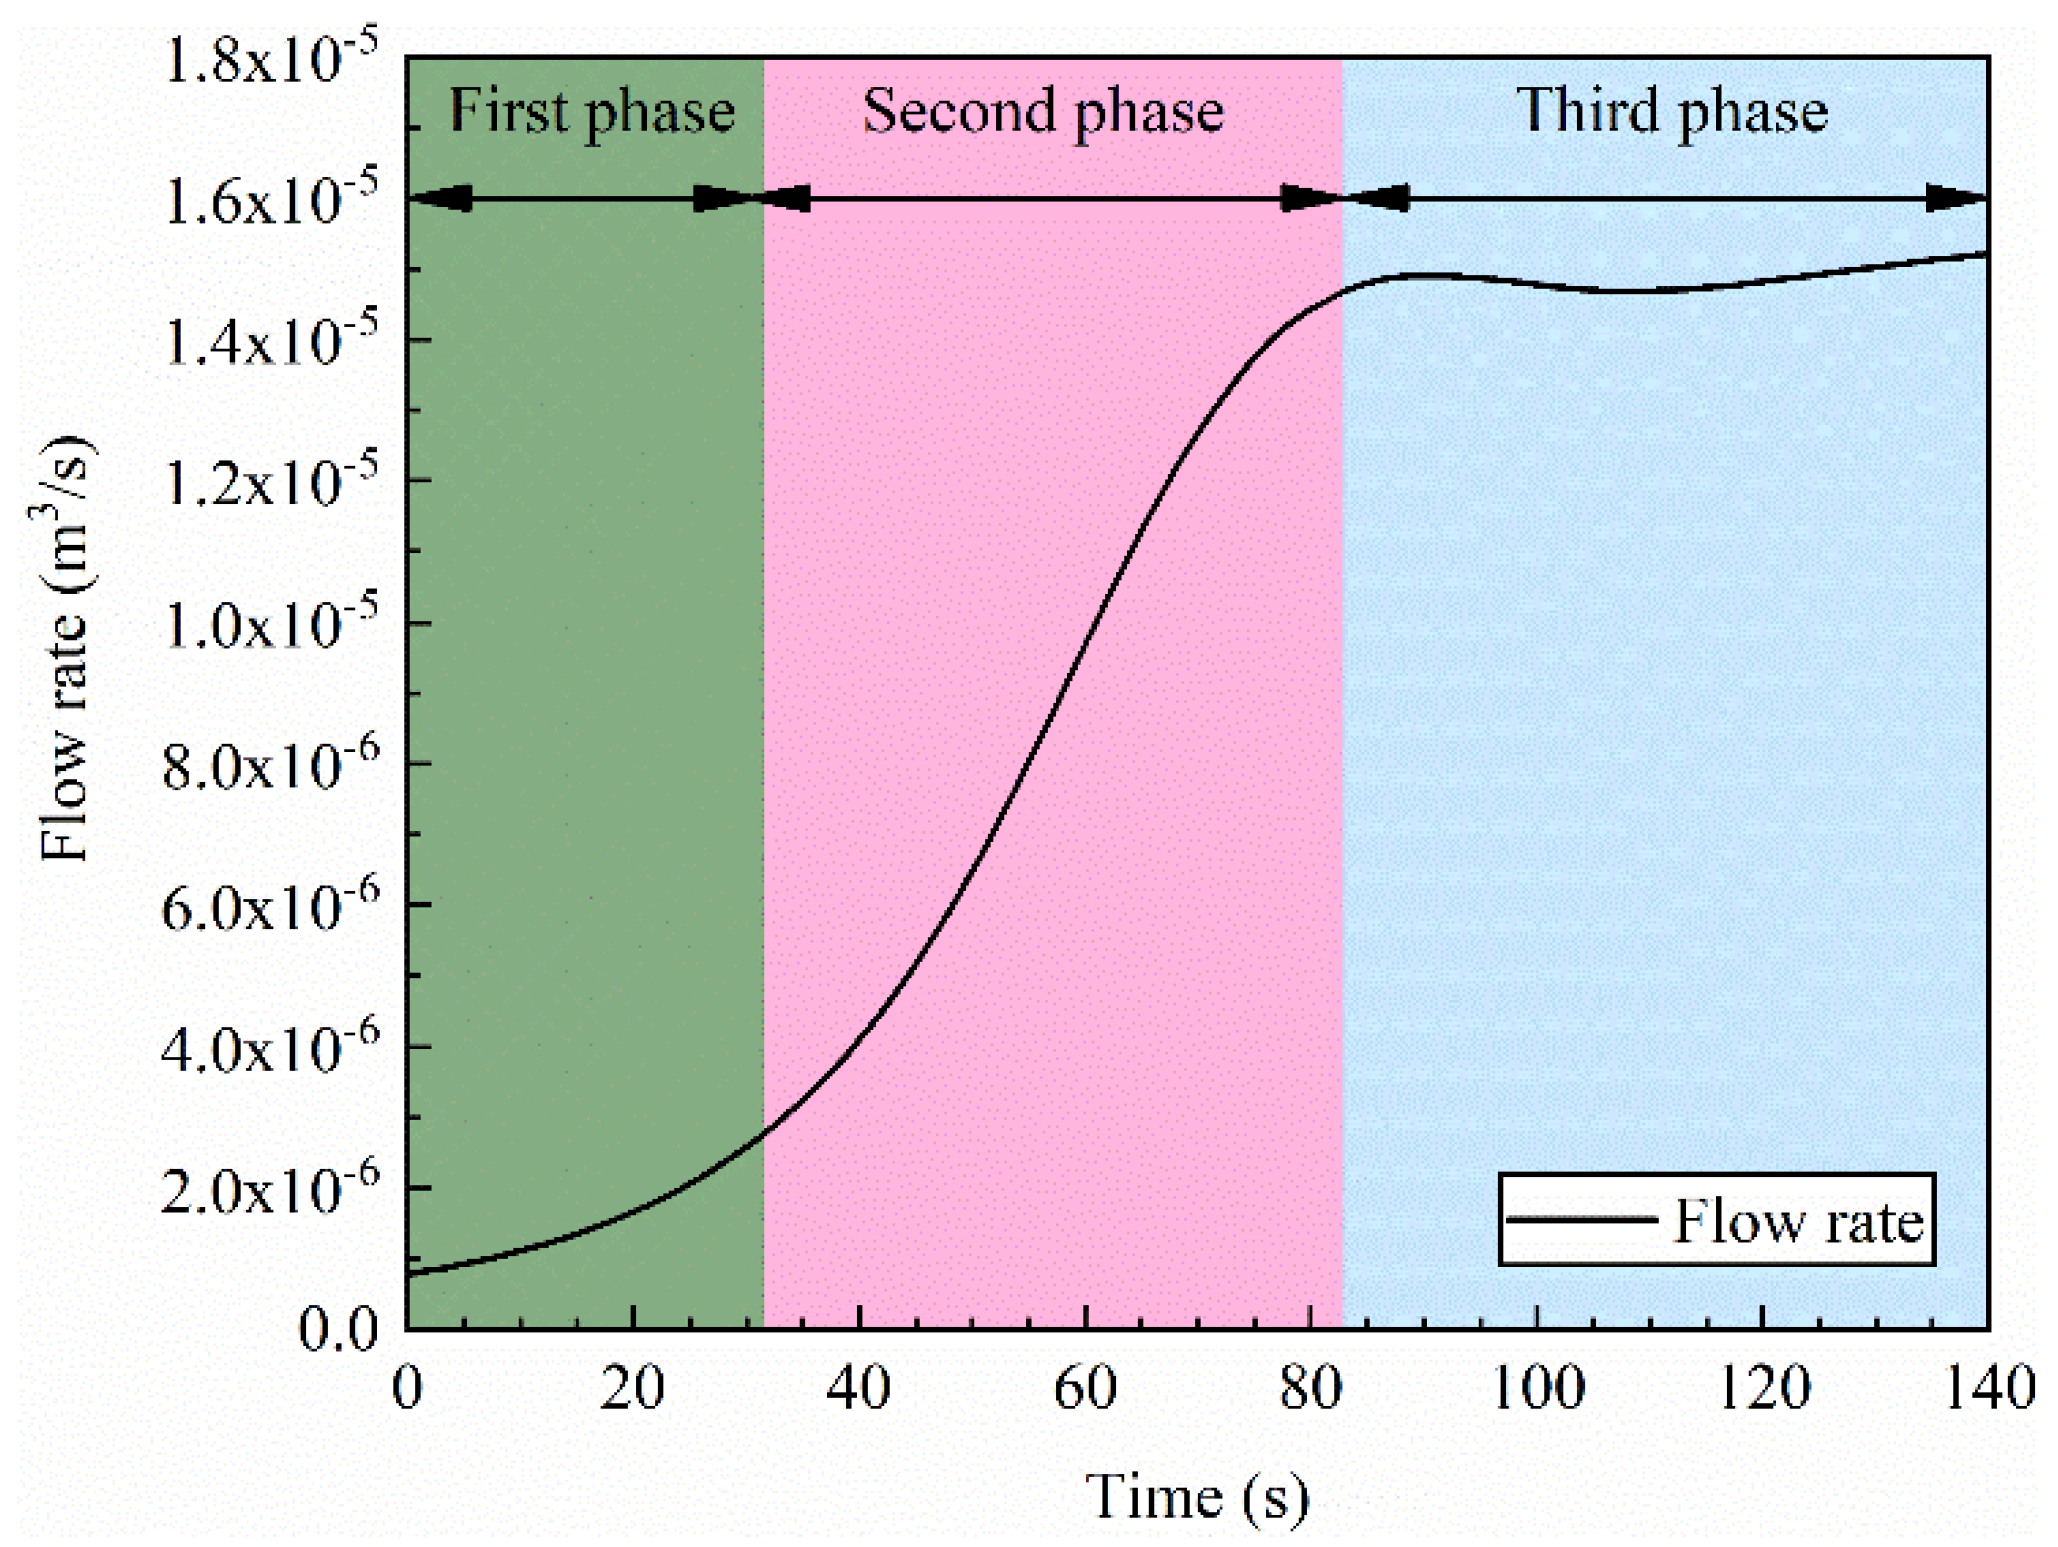
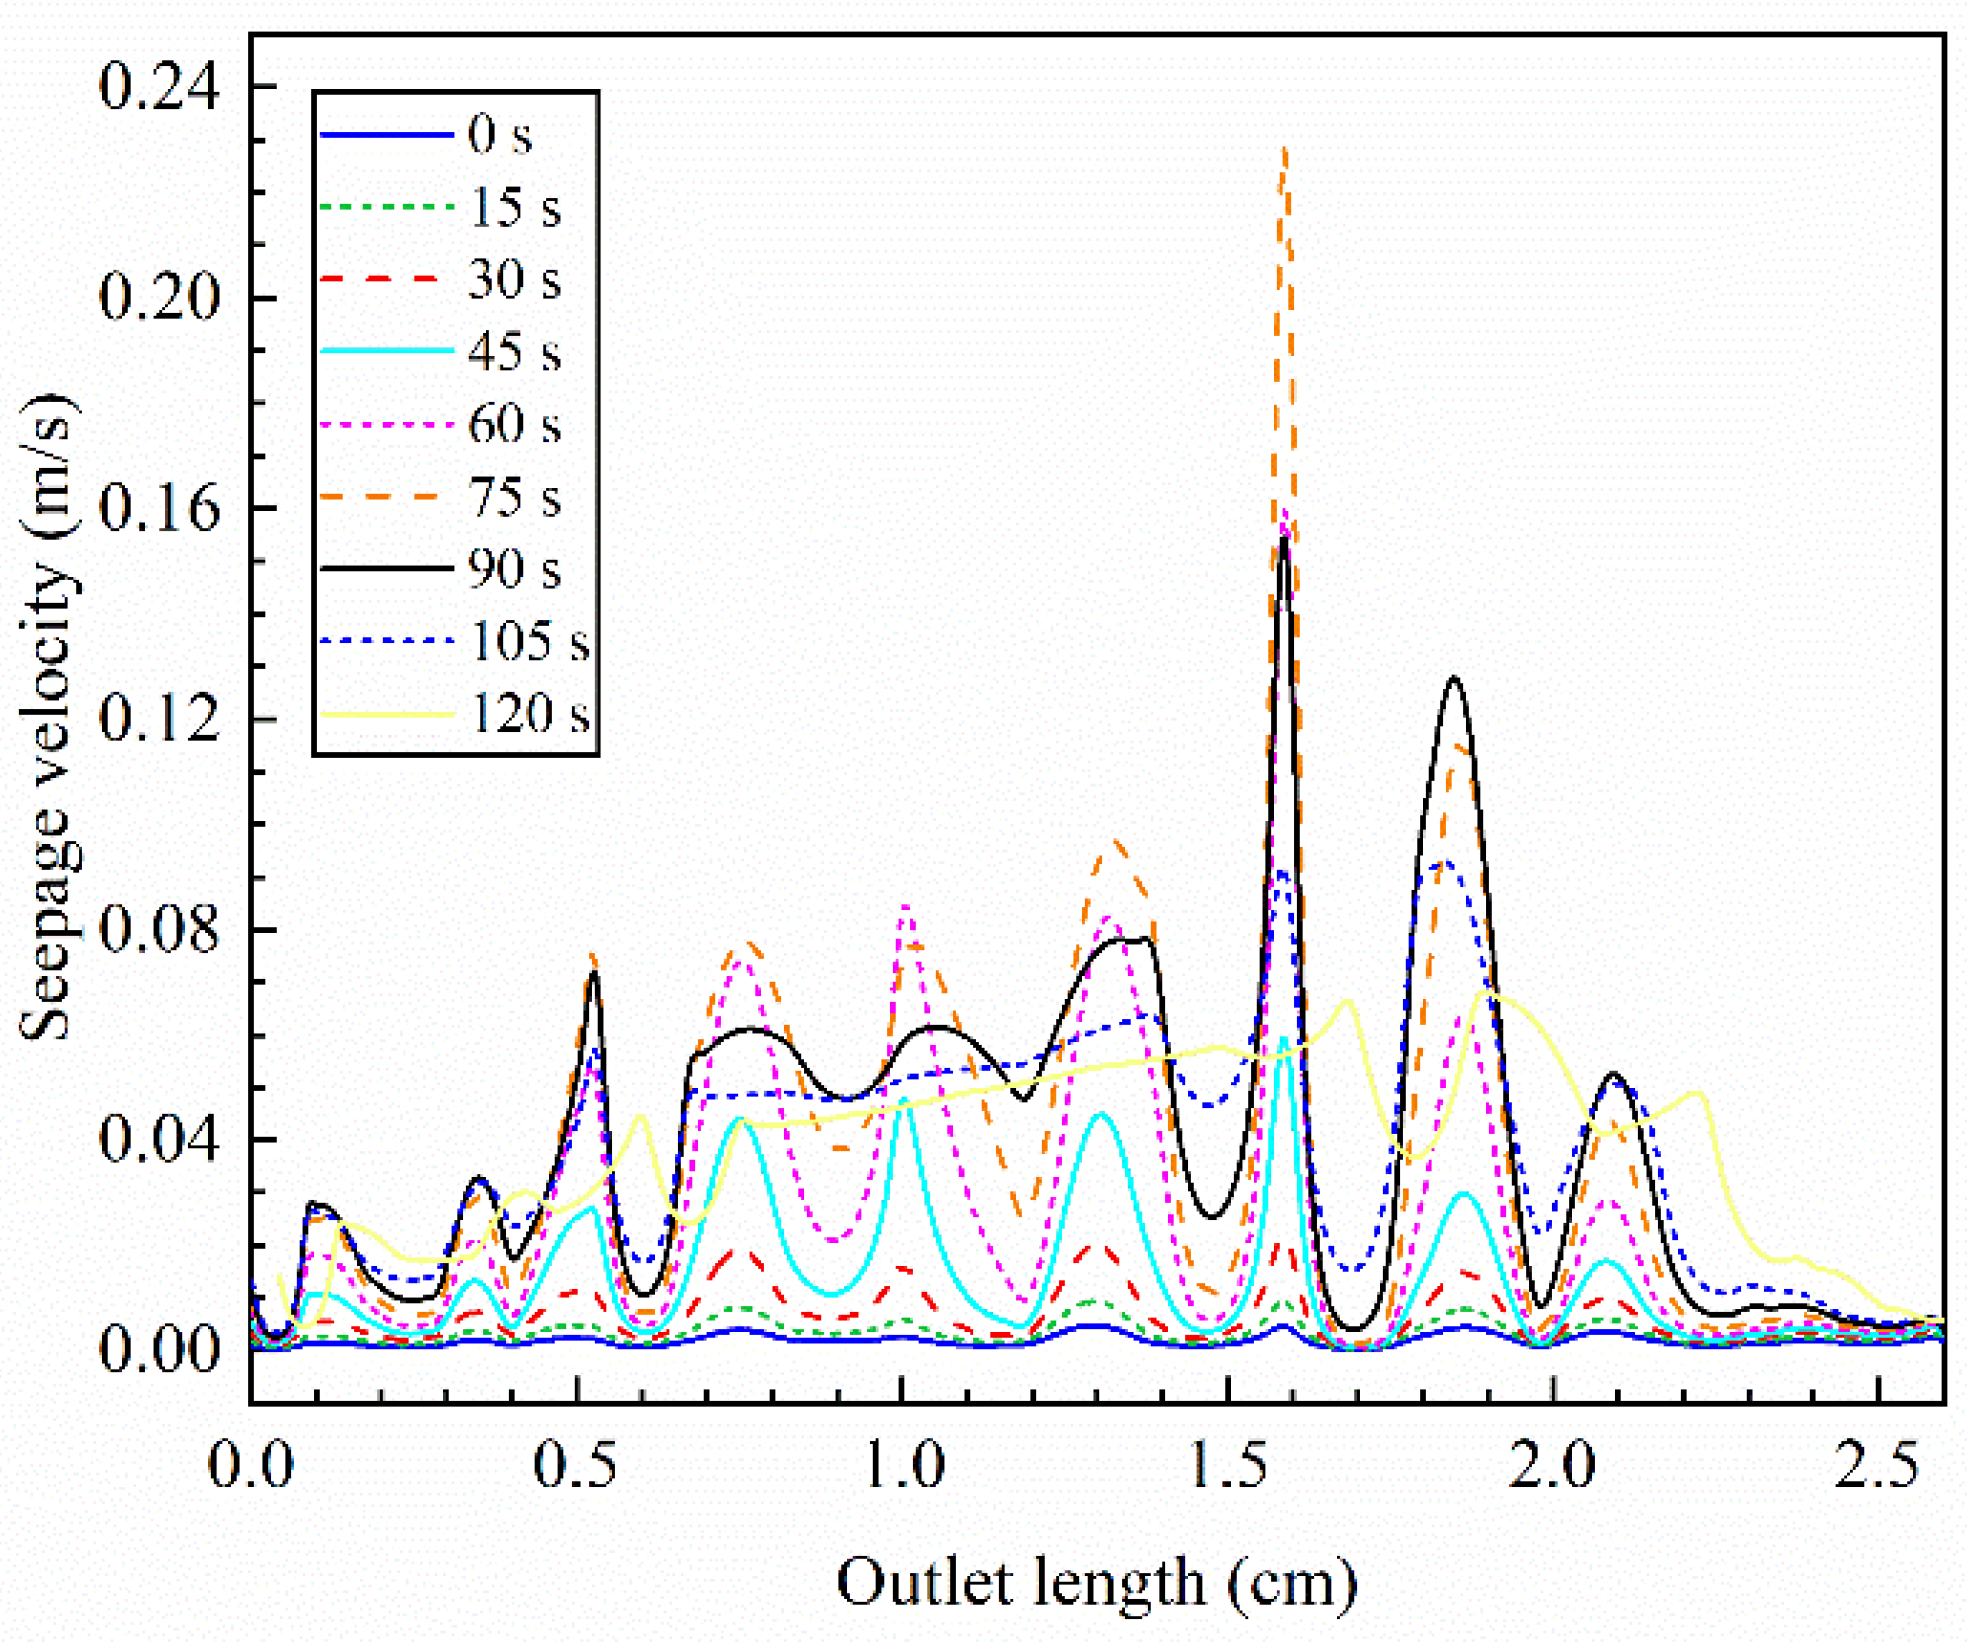
4.2. Evolution of Seepage Velocity

Figure 7 shows the evolution of the seepage velocity. As can be seen, at 20 s (Figure 7a), the fractures generally showed a low-velocity flow distribution, but local fractures with small apertures showed higher flow velocities. With the seepage, the velocity distribution at 40 s (Figure 7b) showed obvious differences, and local fractures with small apertures still had high seepage velocities, with many micro-channels with relatively high flow velocities forming at the same time. At 60 s (Figure 7c), the interconnected high-velocity channels began to form at the small aperture position, and the fractures showed obvious seepage velocity differences, with the maximum seepage velocity reaching 9 × 10⁻³ m/s. At 80 s (Figure 7d), channels with significantly higher seepage velocity were formed in the fracture. Due to the influence of fracture geometry and residual filling medium, the seepage velocity remained unevenly distributed.
The flow rate curve and the seepage velocity curves along the outlet boundary of numerical simulation are shown in Figure 8 and Figure 9. As filling medium was eroded with seepage, the flow rate showed a non-linear increase, which could be divided into three phases as per the change trend (Figure 8): the slowly varying phase, the rapidly varying phase, and the stable phase. The early seepage period mainly involved the low-velocity flow through pores, and thus the seepage erosion effect was faint, with a phase of slowly increasing flow rate. The seepage velocity curves from 0 to 30 s in Figure 9 also reflected this process. As seepage progressed, filling medium was continuously eroded and lost. The coupling effect of filling erosion and flow rate increase became more significant, showing the phase of rapidly increasing flow rate as the seepage velocity curves changed between 30 and 75 s in Figure 9. With the increased flow rate, most of the filling medium was eroded and lost, and the fluid channel tended to become stable, while any residual filling remained subject to faint erosion and loss, showing the phase of stable flow velocity, as the seepage velocity curves changed between 75 and 120 s in Figure 9.

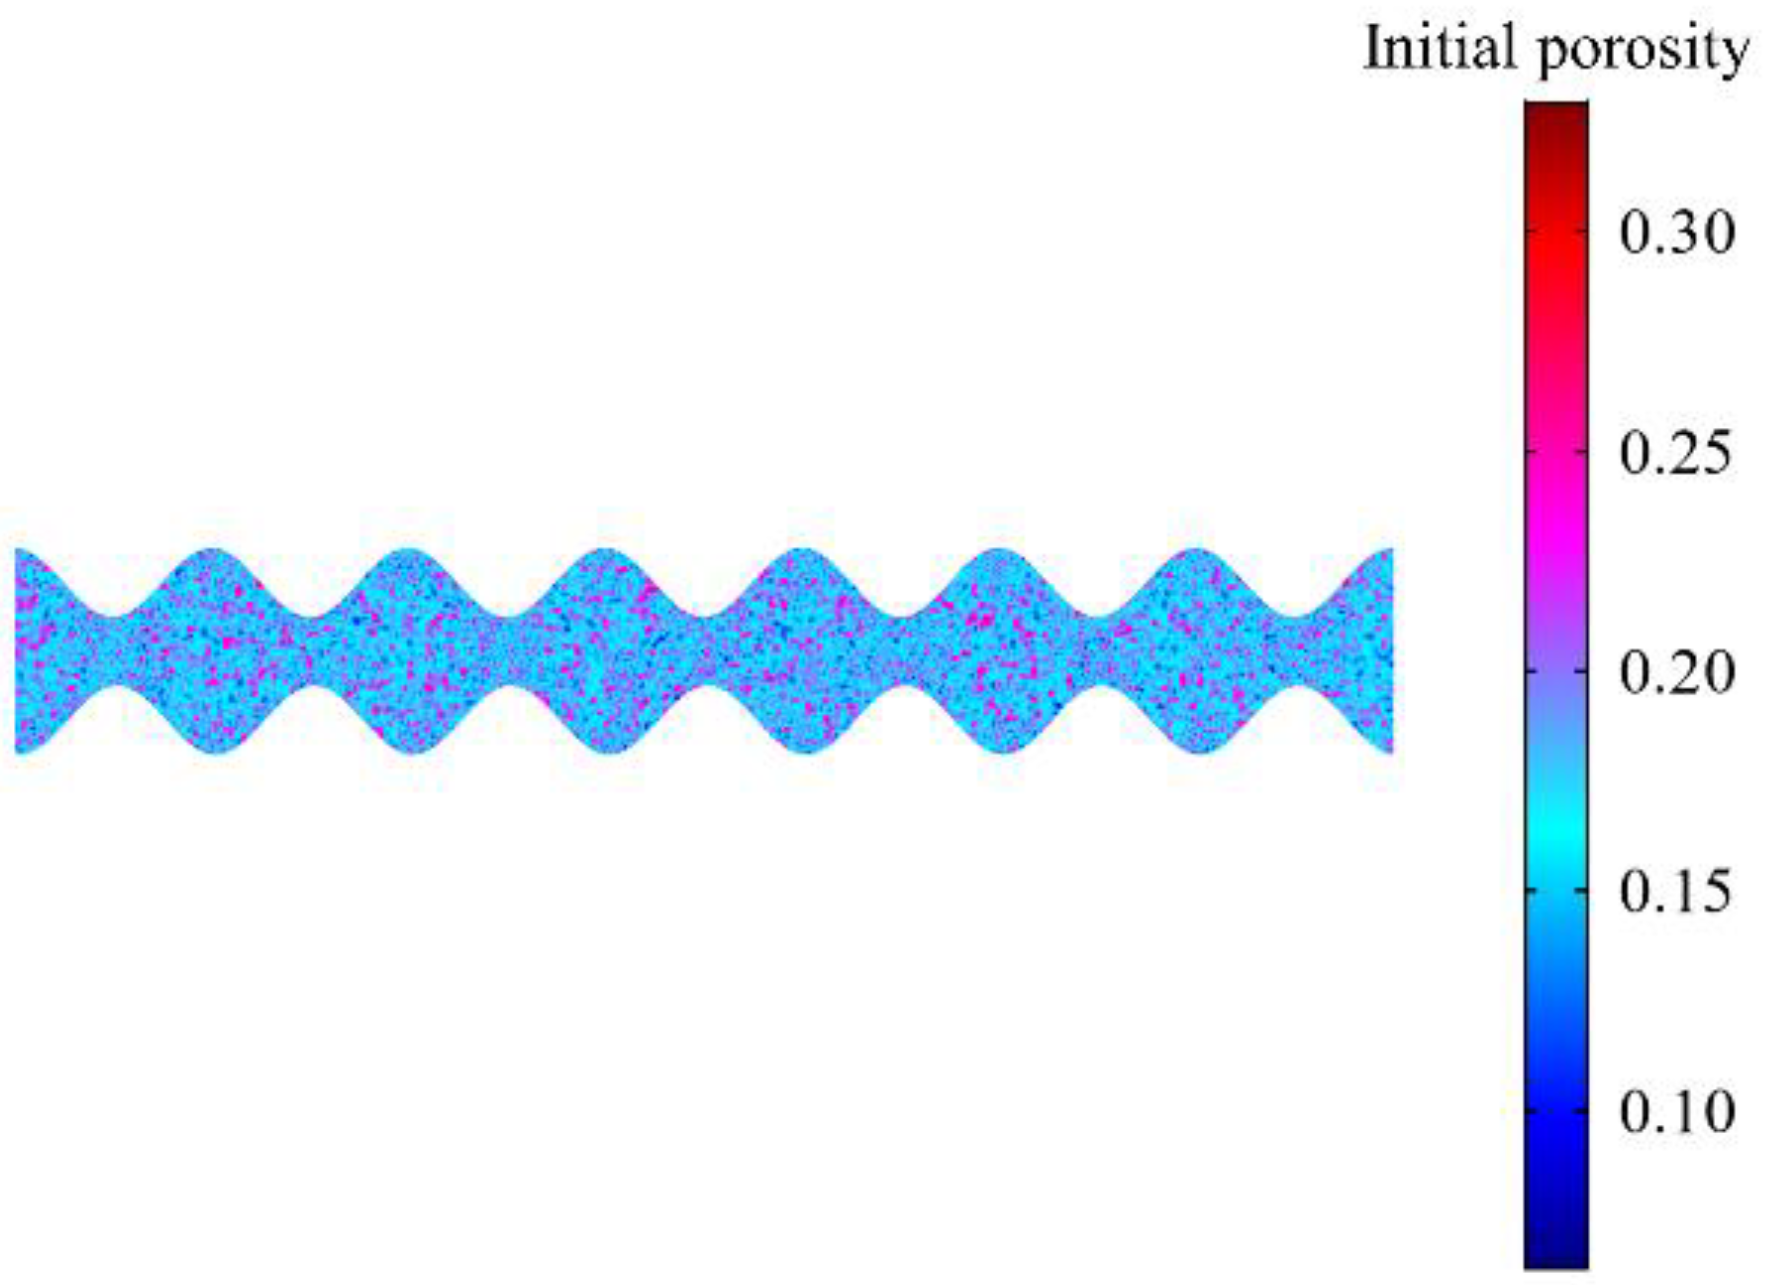
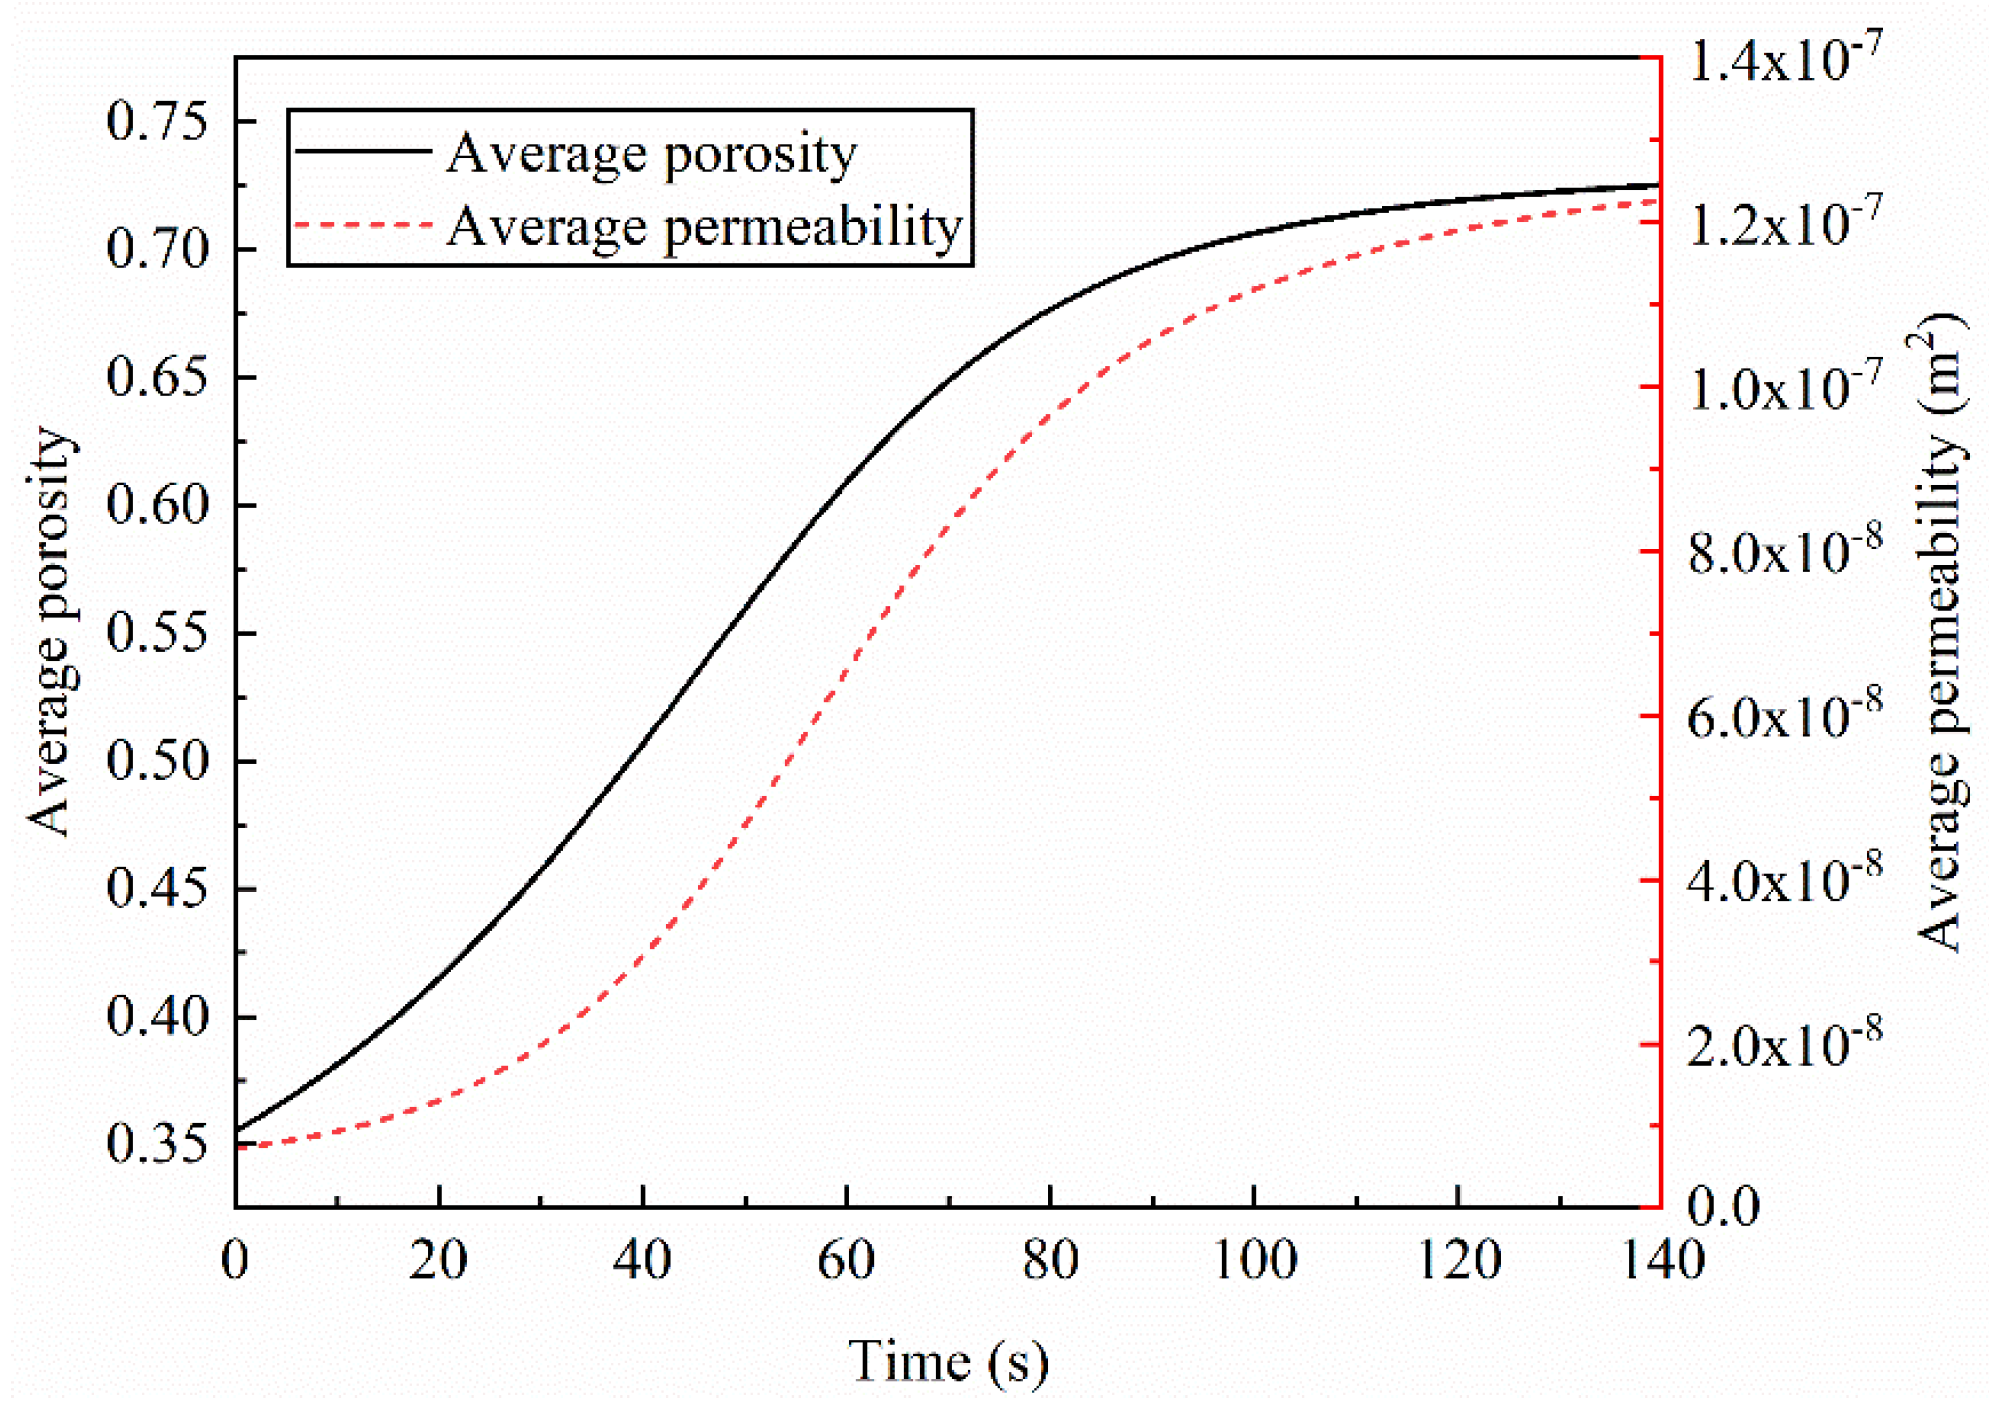
4.3. Evolution of Porosity and Permeability

Figure 10 shows the contours of porosity at different times of the numerical simulation. At the beginning of seepage, the initial porosity was subject to Weibull distribution and represented the characteristics of heterogeneous pores in the filling medium. As seepage progressed, the fluid passed through the pores between the filling particles relatively easily, which led to erosion at large porosity positions in the filling medium. Erosion in areas with higher velocity was more severe due to the seepage velocity difference caused by the fracture geometry. Filling medium was eroded and lost, and the pores gradually expanded and interconnected with other pores to form micro-channels, as shown in Figure 10b. The fluid flowed faster through these micro-channels, resulting in enhanced erosion and increased permeability, which in turn promoted an increase in flow rate. With the evolution of the seepage field, the coupling effect of erosion and seepage became increasingly violent, enabling the pores to expand faster and run through the entire fracture space, as shown in Figure 10c. Once most porosity had evolved to 1.0, most of the filling had been eroded and obvious fluid channels had formed, while the remaining areas of low porosity contained residual filling that had not been completely eroded, as shown in Figure 10d. The areas with residual filling always consisted of low-velocity areas where the filling had been subjected to extremely faint erosion.
Figure 11 shows the variations of average porosity and average permeability. It can be seen that both of these parameters showed a non-linear increase. A positive correlation between average permeability and porosity was shown by Equation (11), which is reflected in Figure 11. Once the seepage had proceeded to 140 s, the average porosity increased to 0.725, which is approximately double the initial average porosity of 0.355, and the average permeability increased to 1.23 × 10⁻⁷ m2, an increase of 17 times compared with the initial average permeability of 7.23 × 10⁻⁹ m2. Therefore, it is obvious that the filling erosion leads to a great increase in fracture permeability.
To sum up, the seepage characteristics of fractures experienced a complete evolution process under the coupled seepage erosion effect. At the initial phase of low-velocity seepage, the coupled seepage erosion effect was weak, and the seepage characteristics evolved slowly. As the filling medium was constantly eroded by seepage, the pores gradually expanded and joined together to form micro-channels, and then the permeability significantly increased. The increase in permeability in turn increased the seepage velocity and the erosion effect. With the development of porosity to the maximum, the flow channel and seepage characteristics became stable, and the coupled seepage erosion effect was no longer significant.

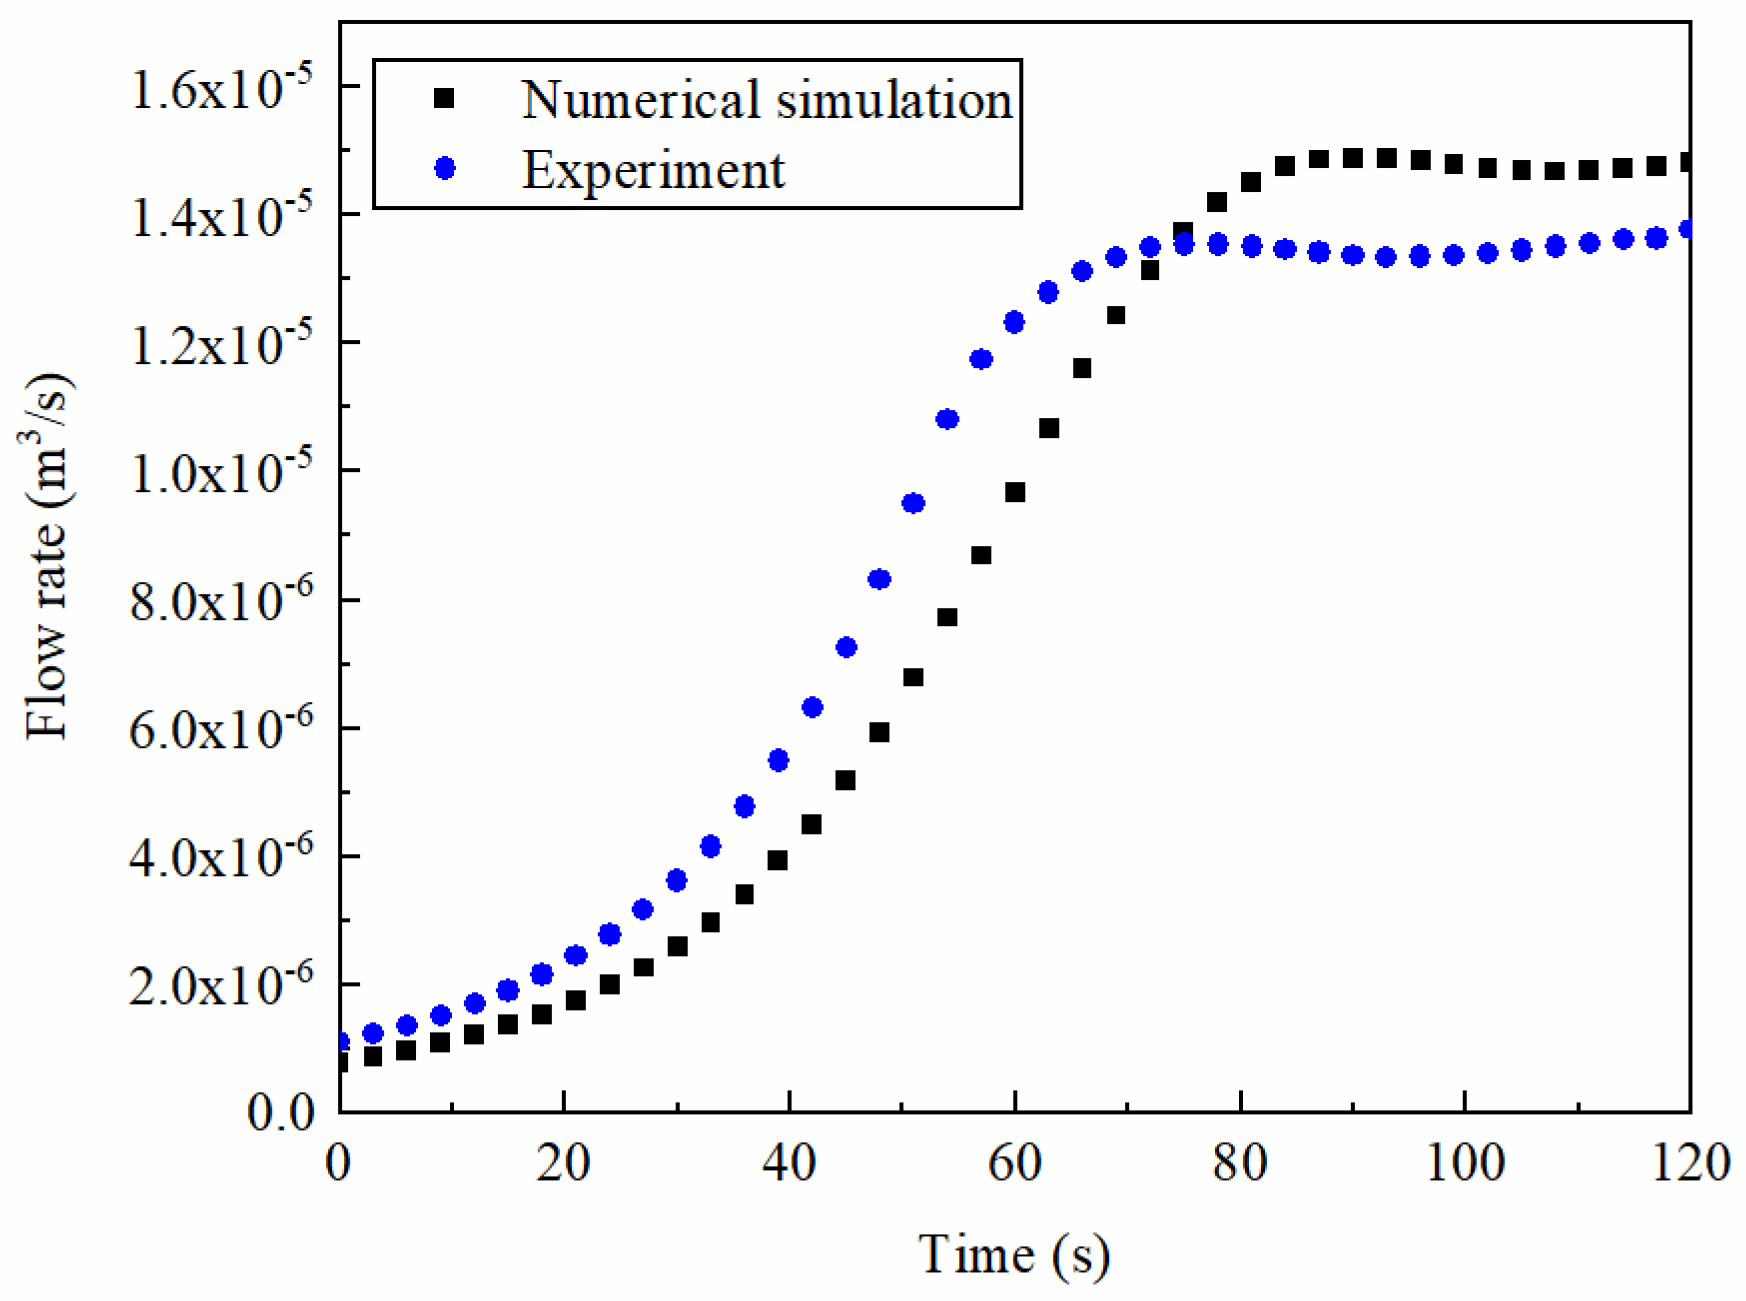
4.4. Model Validation

This section presents the validation of the numerical simulation. As shown in Figure 12a–c, an artificial fracture was embedded in a sample with the size of 200 × 100 × 100 mm. Then, the fracture was filled with fine sediment particles. After the top of the sample was sealed, the water injection experiment was conducted. The comparison of experimental results is shown in Figure 13. The artificial fracture had the same size as the model in the numerical simulation, as shown in Figure 13a. The sediment mixture in the fracture restored the heterogeneity of the filling medium. The boundary conditions of the artificial fracture in the experiment were consistent with those in the numerical model. Water was continuously injected into the fracture at a pressure of 1 kPa. When it was observed that sediment fillings were no longer being lost, the injection of water was stopped. The filling medium following erosion is shown in Figure 13b. When the sand particles no longer flowed out obviously, it meant that the fracture seepage channel was stable and had entered the later stable phase of seepage evolution. From Figure 13b, it can be seen that the surface of the specimen was exposed in many areas at the bottom of the fractures, indicating that the fillings here had been completely eroded, while filling residues remained in many areas, with a fracture aperture of 3 cm.
The flow rate curves of the numerical simulation versus the experiment are shown in Figure 14. As shown in Figure 14, the two curves show a similar trend. The experimental results are in good agreement with the simulation results, which verified the feasibility of this model.

5. Discussion

The evolution of fracture seepage characteristics can be controlled or affected by a variety of factors. As the earlier analysis showed, the geometric characteristics of fractures can cause flow velocity differences in the seepage field [41], which inevitably affect the evolution of the seepage characteristics of infilling loss. In addition, the degree of heterogeneity within the pores of filling itself is also an inherent condition for the evolution of seepage characteristics. Therefore, this section will discuss the factors affecting the model; the simulation scheme is listed in Table 2.

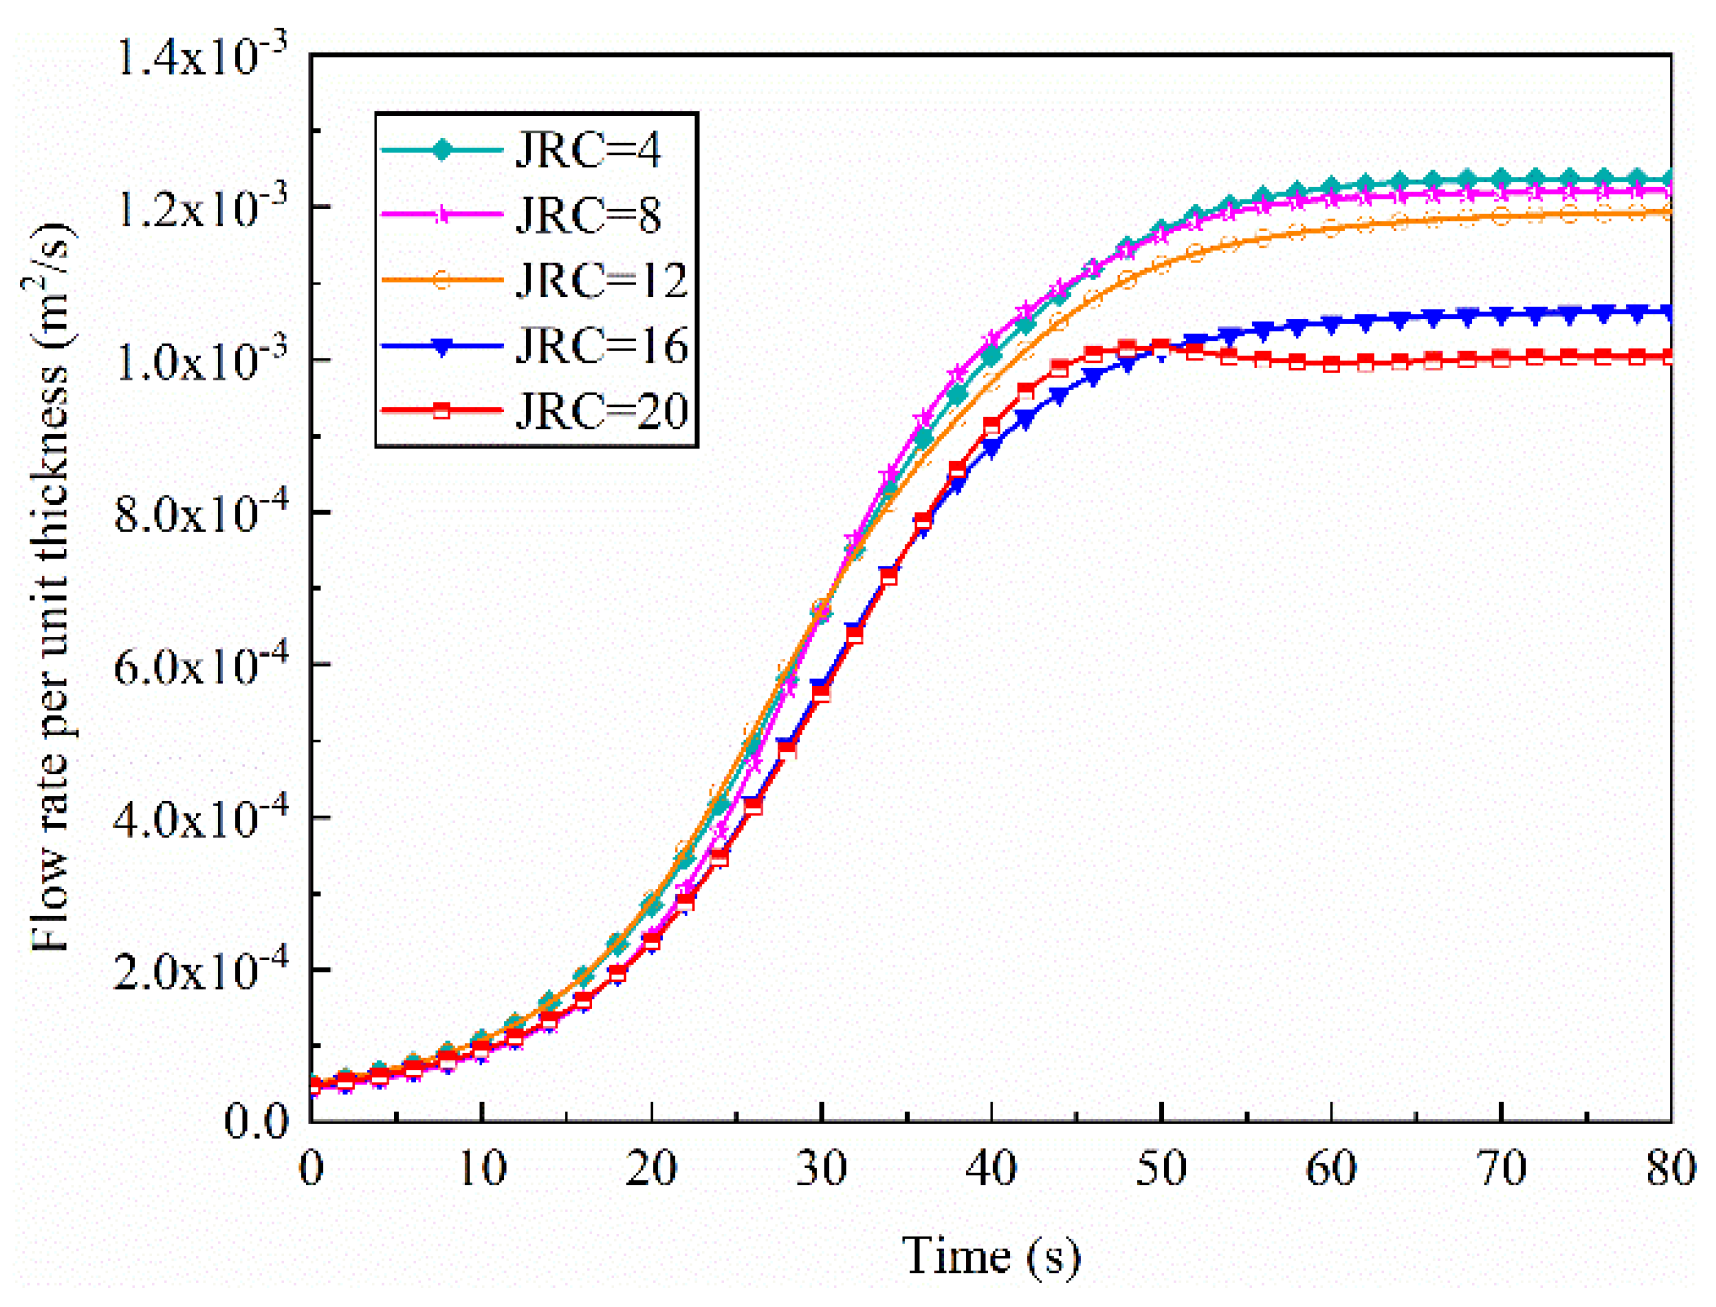
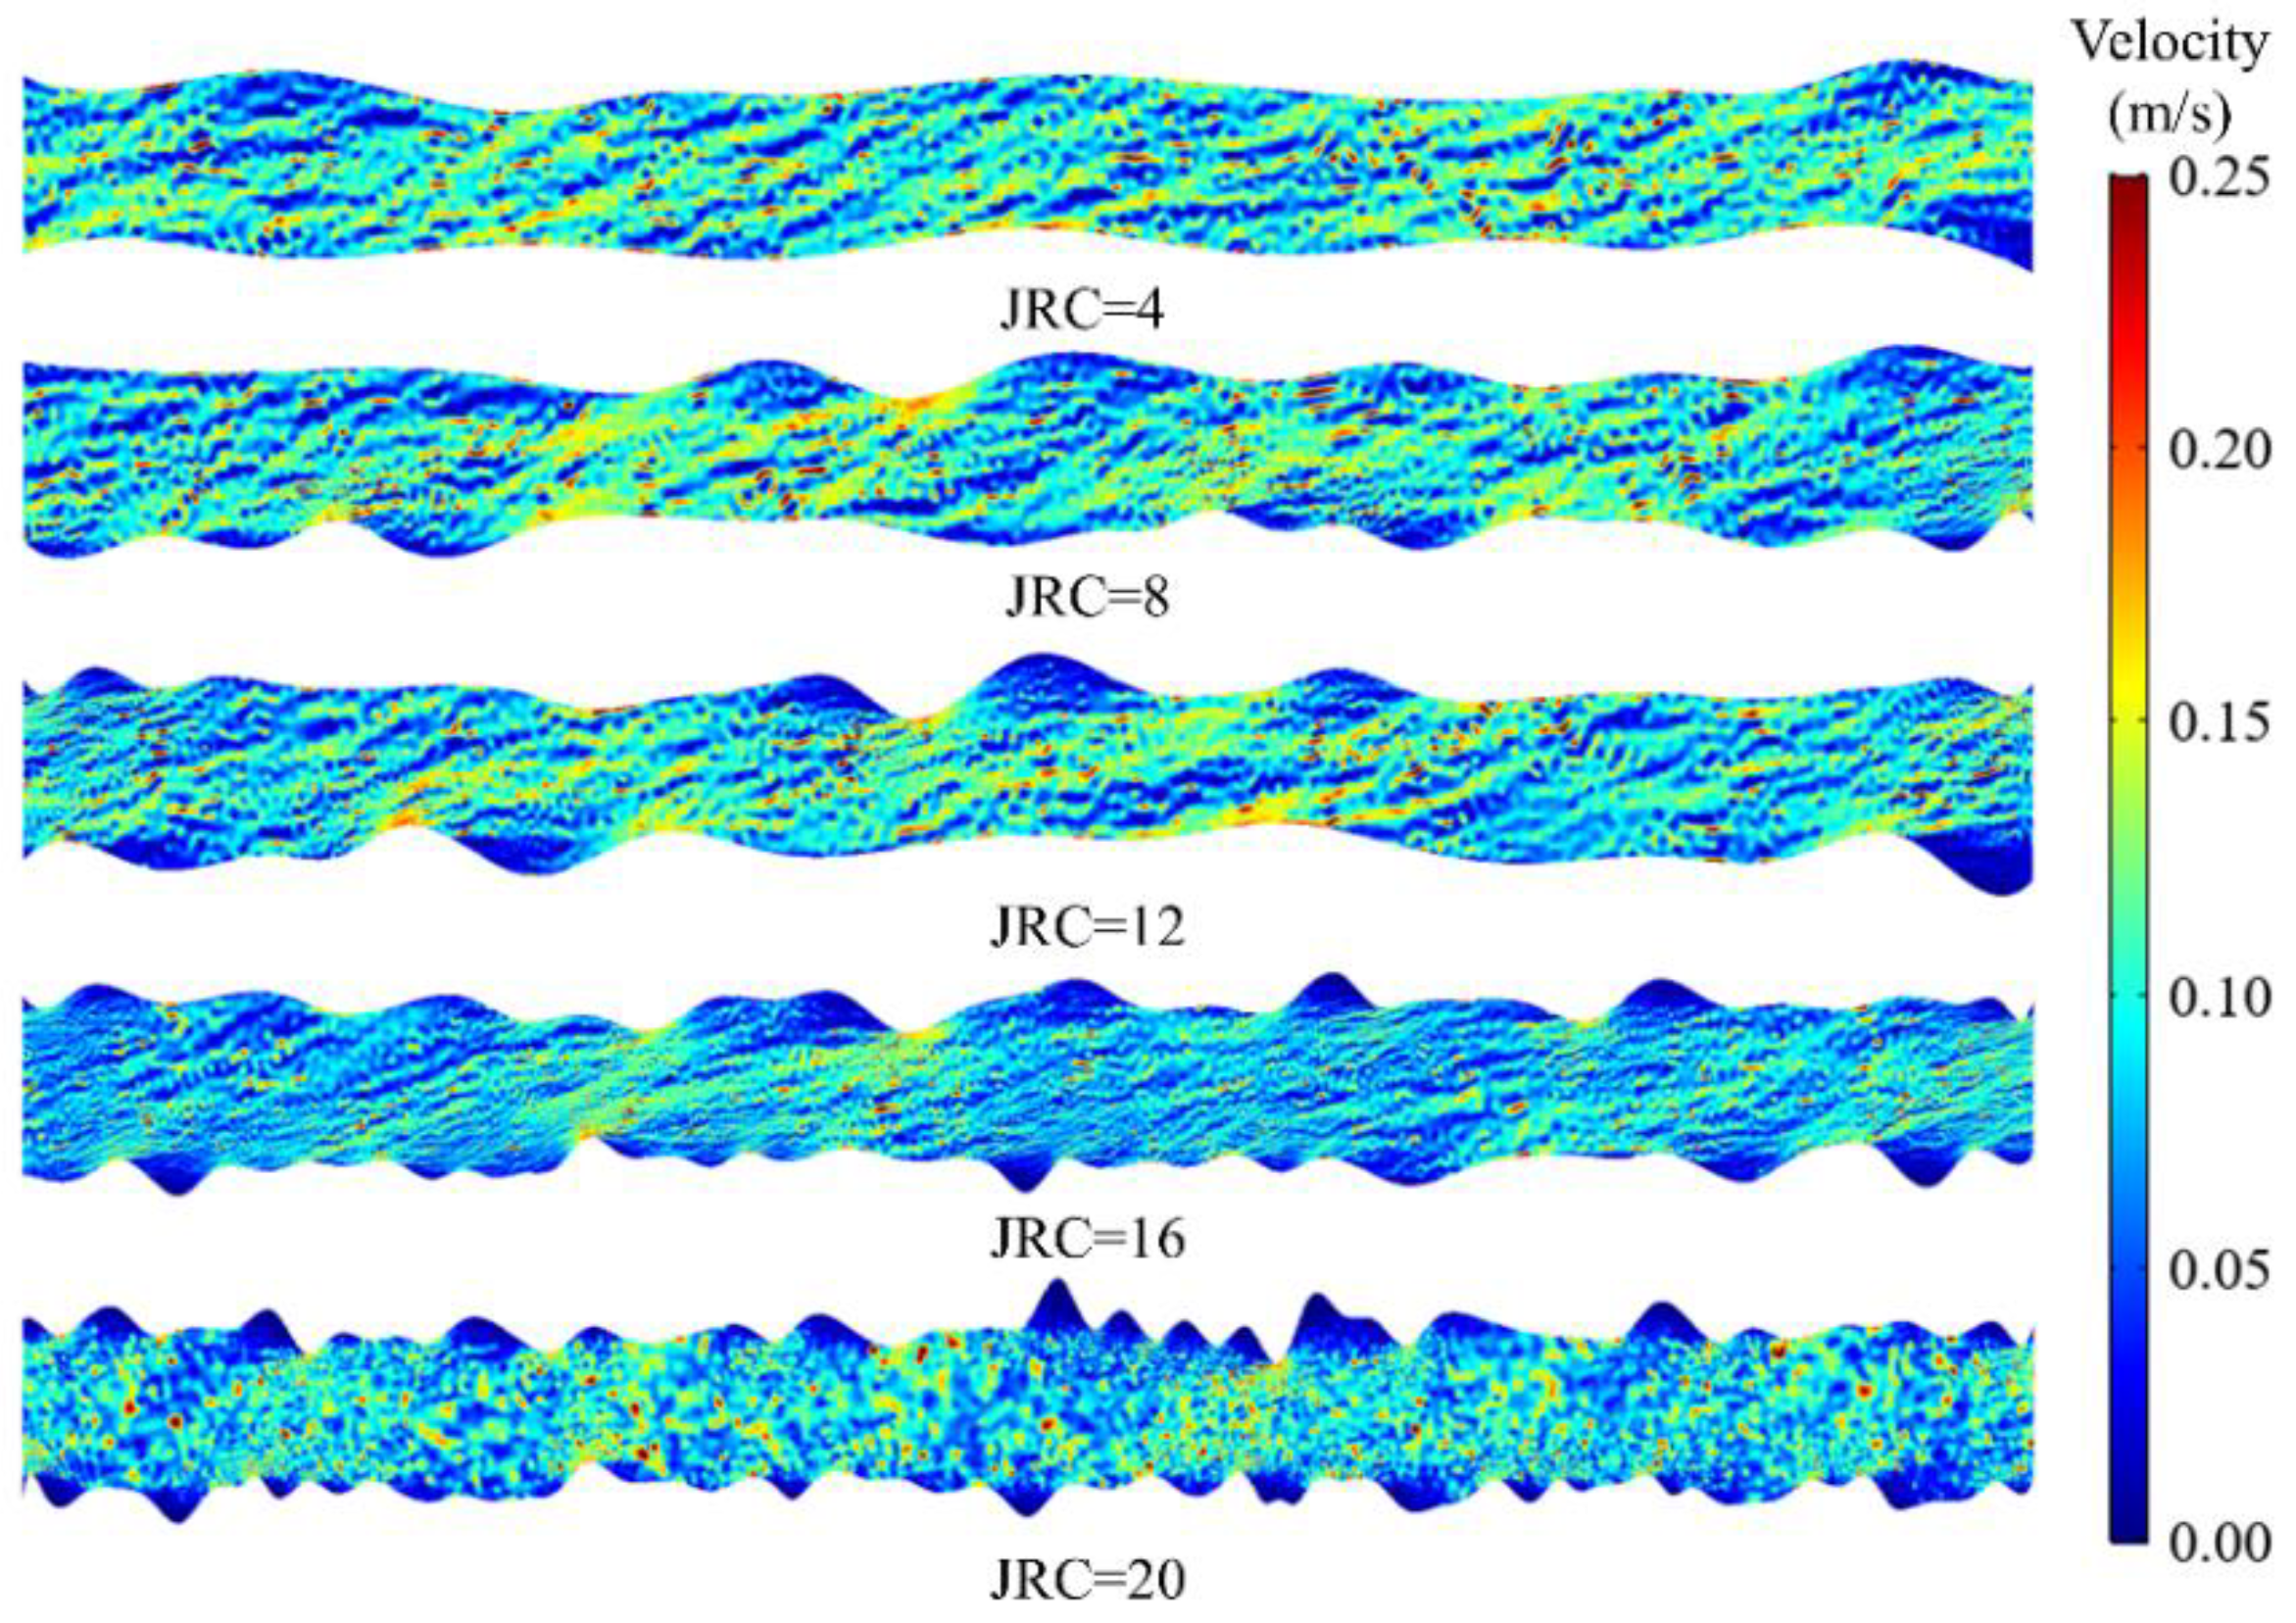
5.1. The Effect of JRC

In this section, we fix the value of m as 2. The flow rate curves of numerical simulations for different JRCs are shown in Figure 15. As seen in Figure 15, with the seepage-induced erosion, the flow rate in fractures of different JRCs still presented the non-linear increase, which can be divided into three phases. The different JRCs resulted in significant differences in flow rate between the rapidly varying and stable phases, but these differences were small in the first phase. In the rapidly varying phase, with the increase of JRC, there was no obvious synchronous change in the fracture flow, but it had a decreasing trend. In the stable phase, the flow rate showed a decrease with increased JRC.
The seepage velocity contours of numerical simulations for different JRCs at 30 s are shown in Figure 16, and we can see from Figure 15 that the seepage field entered into the rapidly varying phase. Due to the seepage-induced erosion, the seepage velocity showed a chaotic distribution, and local interconnections in the higher velocity areas were considered to be the result of formation of micro-channels after the erosion. At this time, many locally interconnected micro-channels were formed in the fractures with JRC = 4, 8, and 12. This phenomenon was relatively weak in fracture with JRC = 16, while it was virtually absent in fracture of JRC = 20. These results show that the seepage of filled fracture with low JRC tends to evolve more rapidly.

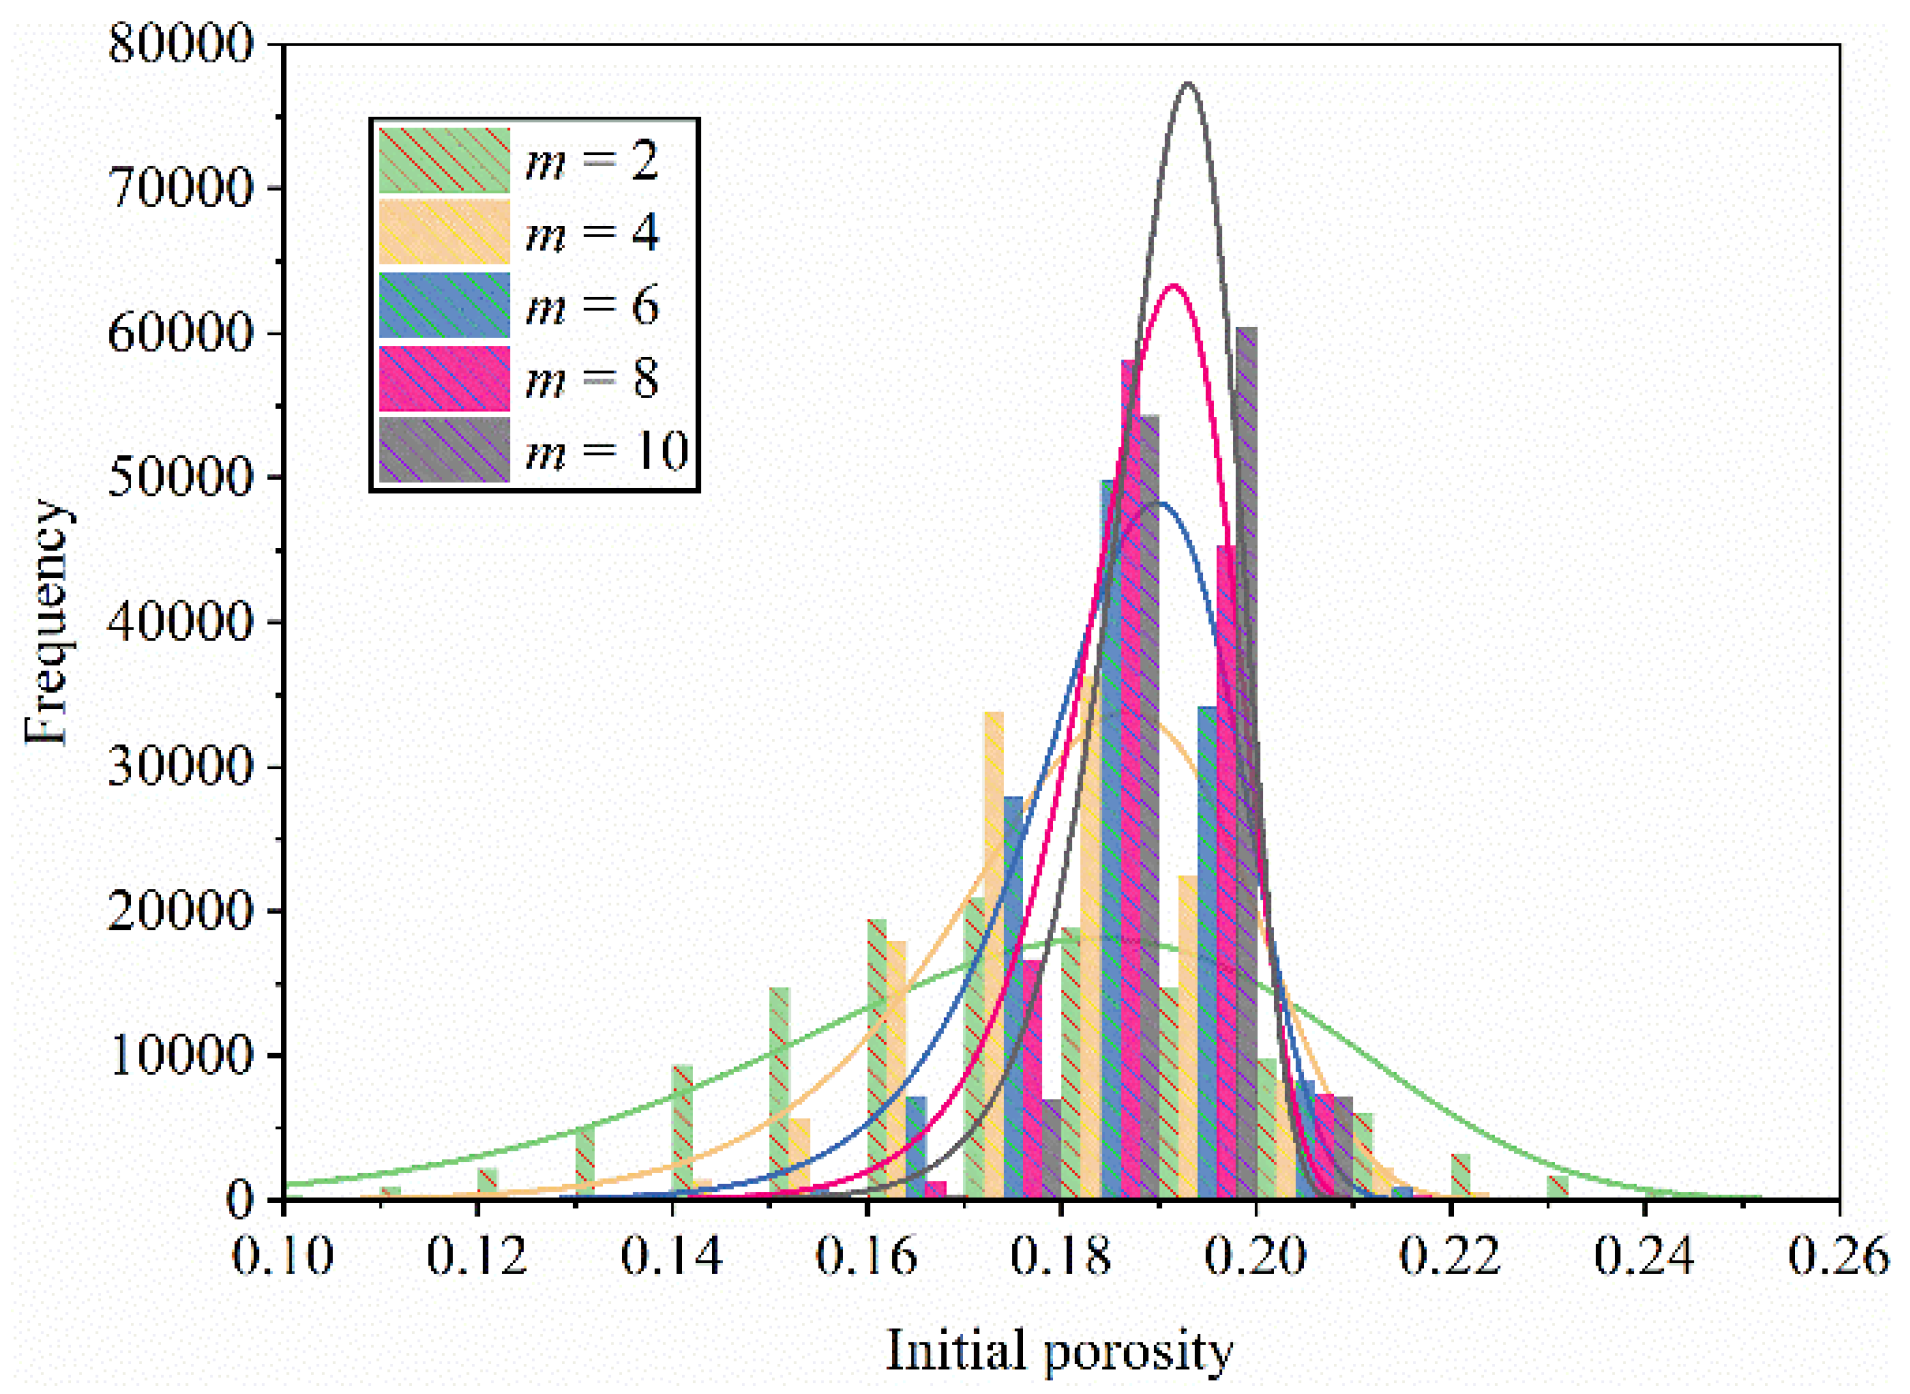
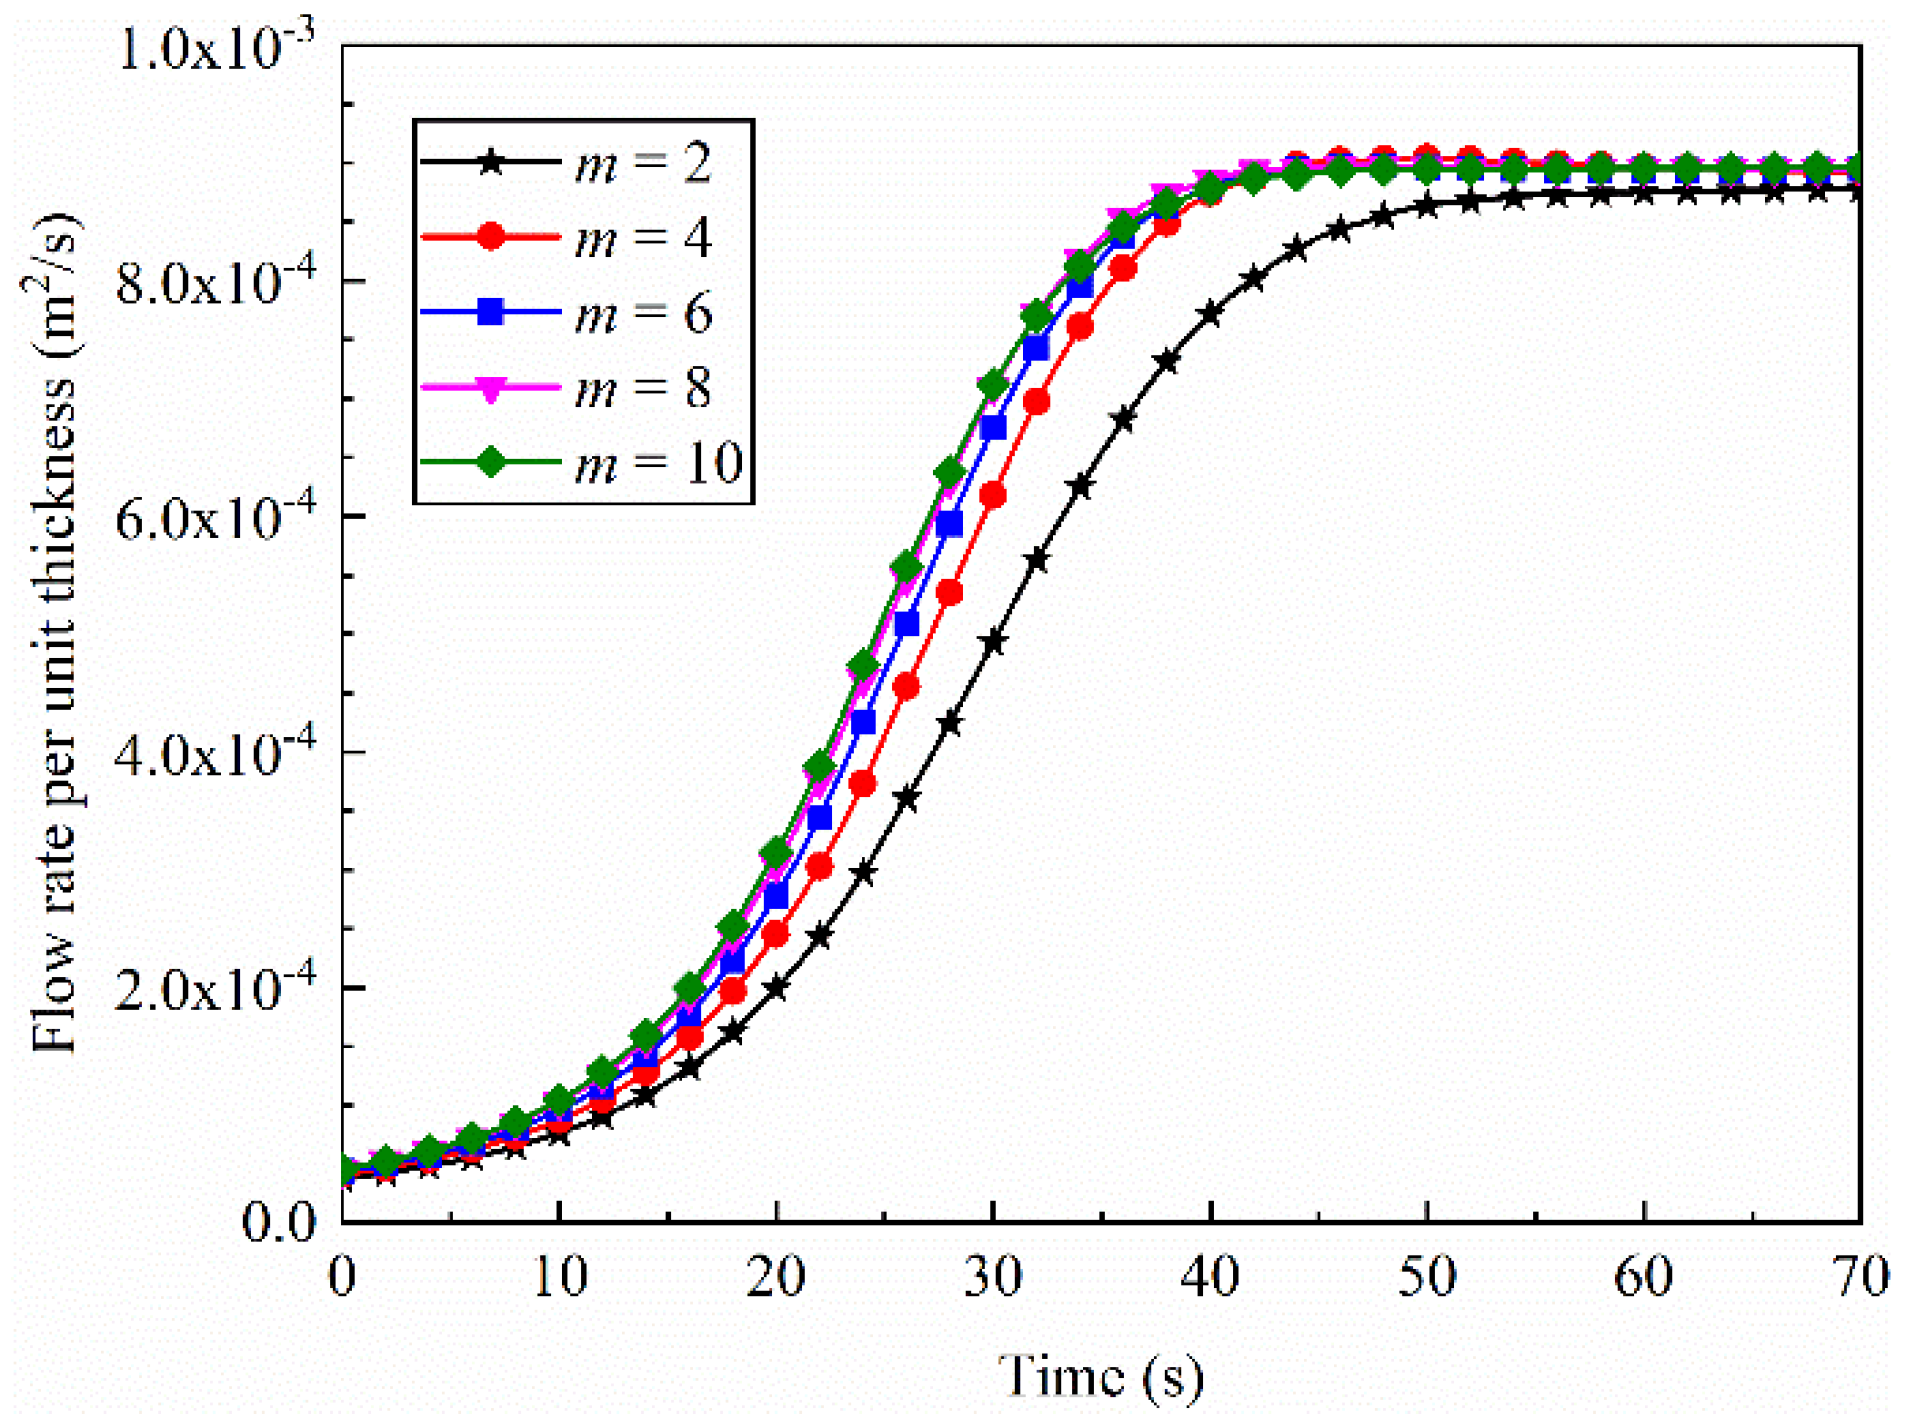
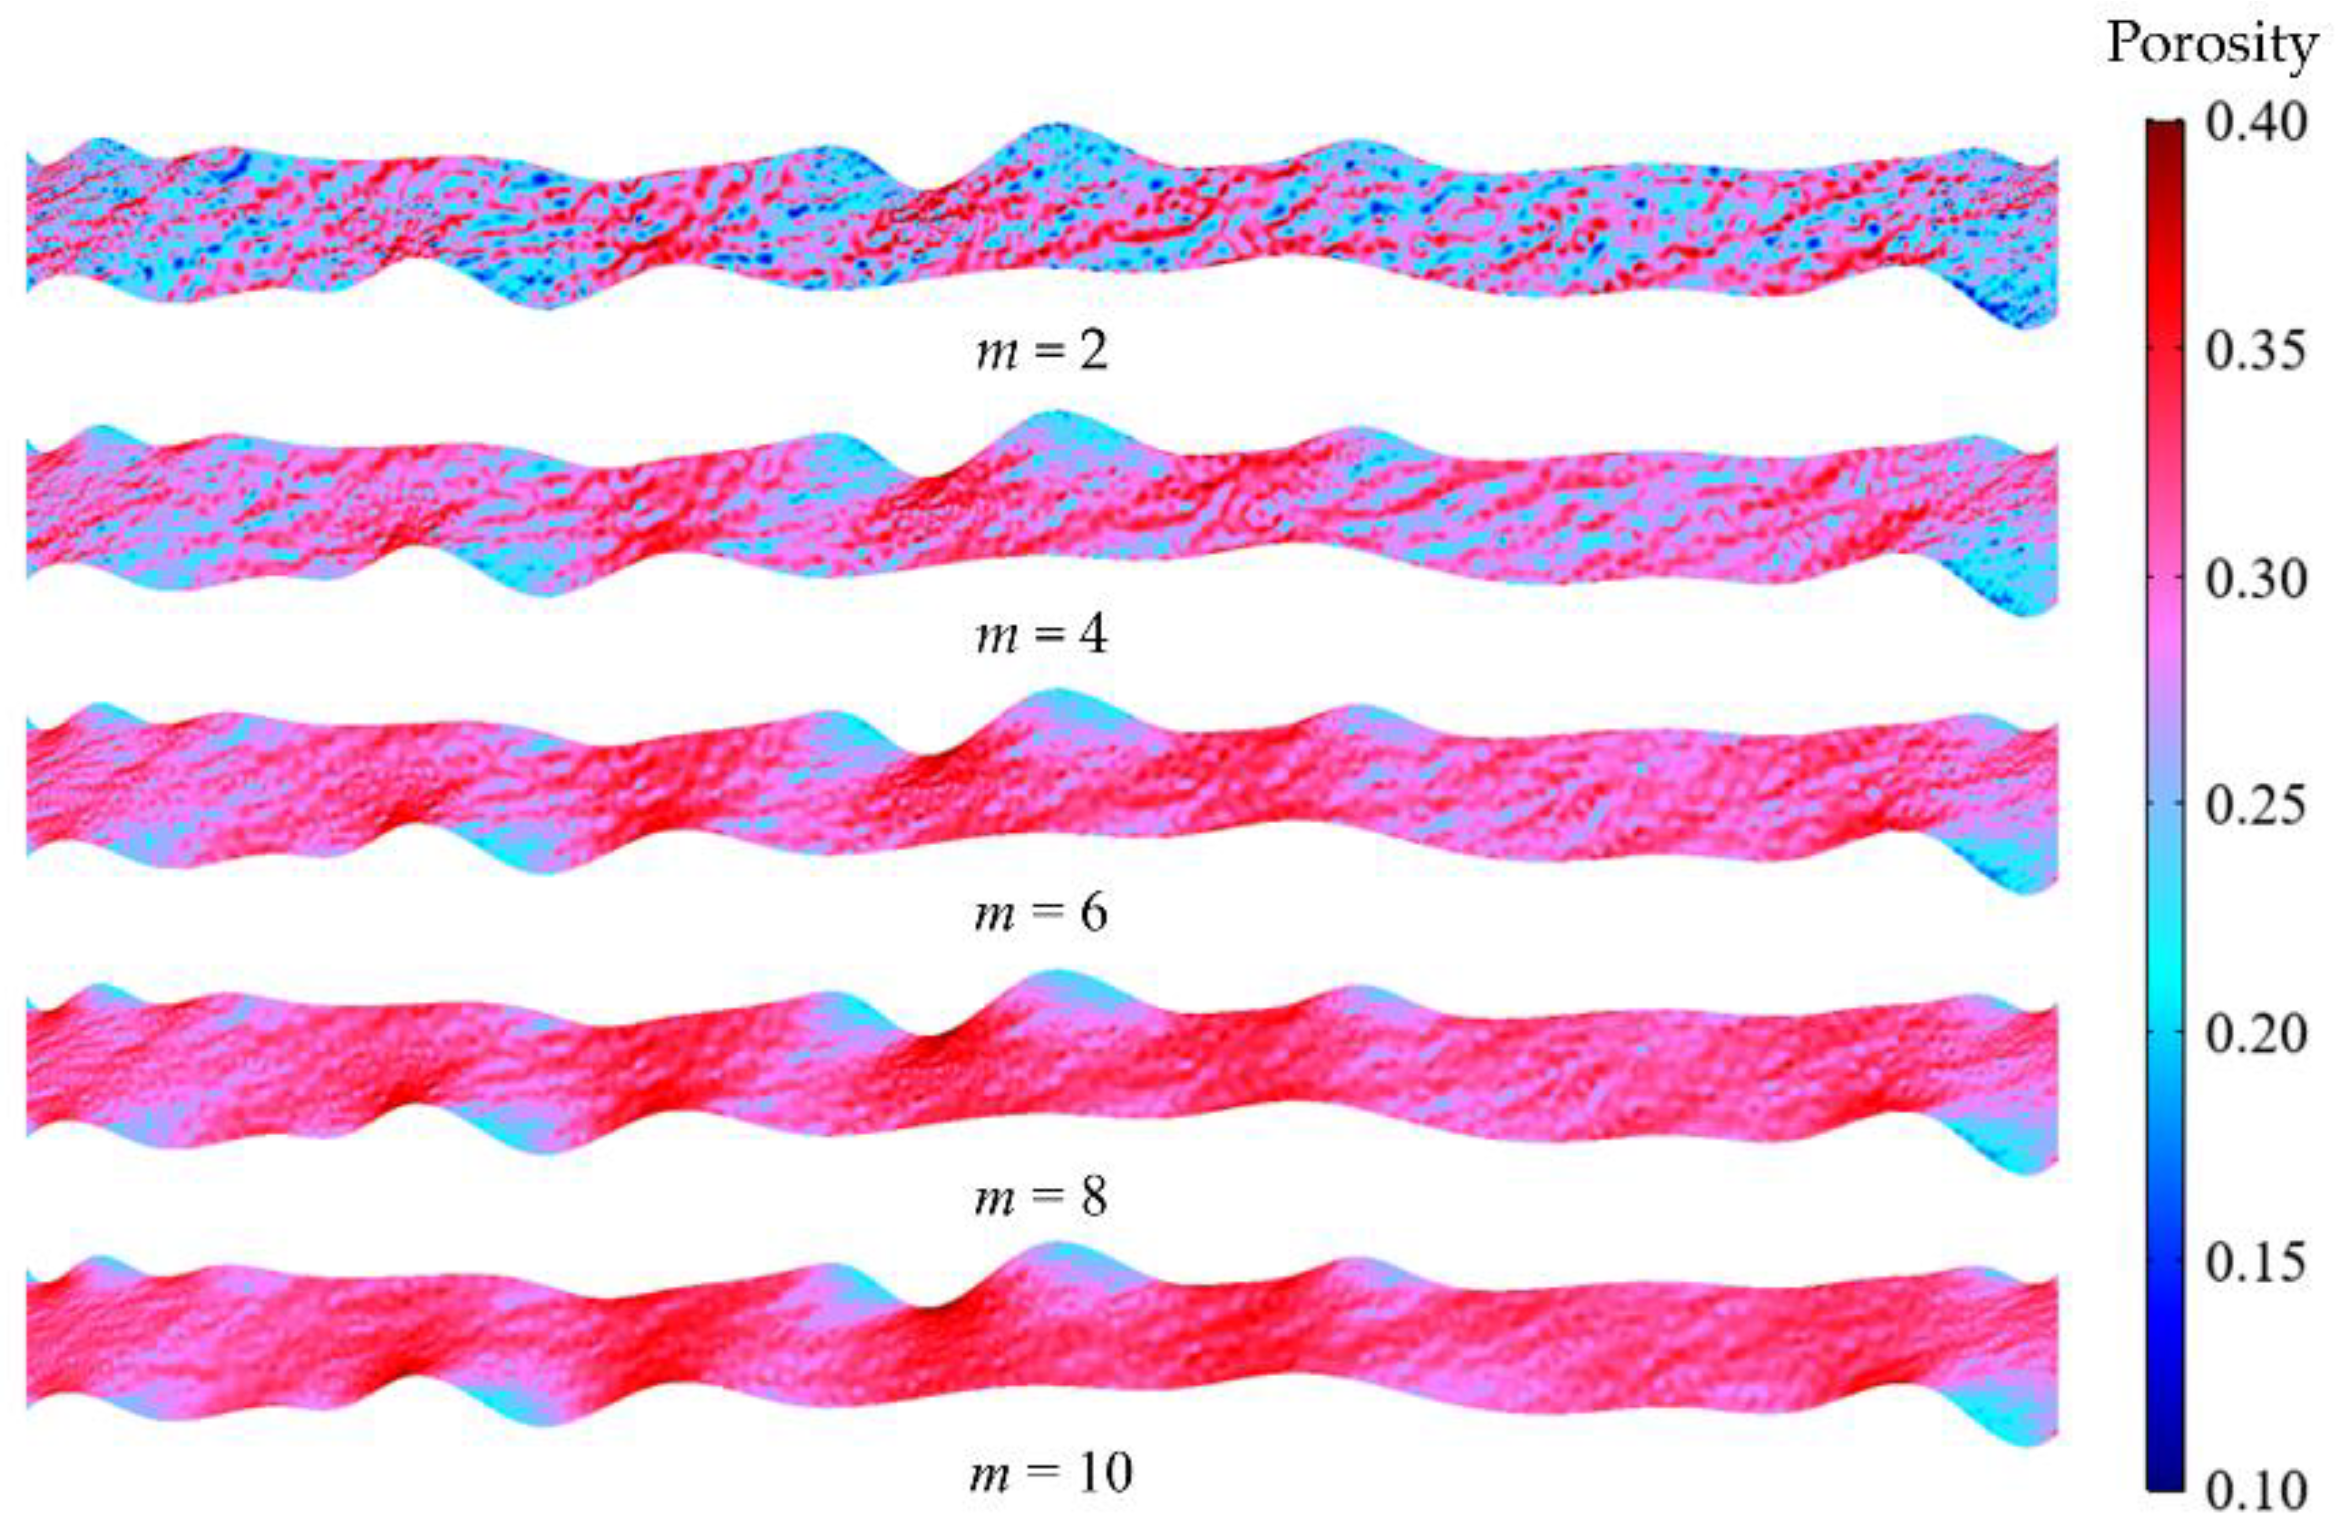
5.2. The Effect of Homogeneity Coefficient

In this section, we fix the value of JRC as 12. The initial porosity statistics of Weibull distribution with different homogeneity coefficients are shown in Figure 17. It can be seen from the figure that as the homogeneity coefficient m increased, the initial porosity of the filling medium was mainly concentrated within a small range, which indicated that the initial porosity of infilling was relatively uniform. However, when the homogeneity coefficient m decreased, the initial porosity distribution range became wider, indicating that the non-uniformity of the initial porosity of the filling was increased. Therefore, the larger the homogeneity coefficient m, the more uniform the initial porosity distribution of the filling medium.
The flow rate curves for initial porosity with different homogeneity coefficients are shown in Figure 18. It can be seen that the flow rate for different homogeneity coefficients of initial porosity still showed a non-linear increase, while the difference in fracture flow caused by different homogeneity of the initial porosity was mainly concentrated in the rapidly varying phase. In the rapidly varying phase, as m increased, the flow rate increased.
Figure 19 shows the porosity distribution at 20 s for different homogeneity coefficients. When m = 2, the porosity distribution was the most chaotic compared with the others, but with the increase of m, there were fewer and fewer low-porosity areas in the fractures, and the porosity distribution became more and more uniform. This finding shows that the increase of homogeneity can accelerate the expansion of pores, and thus the flow rate changes more quickly. Water flowed easily through existing pores in filling medium. However, due to the non-uniform distribution of porosity, pores were not easily interconnected with each other, which hindered the formation of seepage channels. For homogeneous filling medium, because flow rate was mainly controlled by pressure gradients, eroded pores were interconnected with each other, and the flow rate increased rapidly.
However, the seepage erosion model is still a challenge in numerical simulations due to its complexity. Yao et al. [28] predicted erosion-induced water inrush of karst collapse pillars using inverse velocity theory, and their flow evolution results were consistent with ours. Instead, our paper focuses more on the microscopic changes in the development of pore connectivity under the seepage erosion effect, and also considers the influence of fracture aperture on the seepage field. Nevertheless, the numerical model in this paper still has its limitations due to complex factors in the actual situation that were not considered.

6. Conclusions

The aim of this research was to investigate the evolution of flow in filled fractures under seepage-induced erosion. Considering coupled effect of the seepage velocity, hydraulic erosion, and permeability of the filling medium, we established a numerical model. On the basis of this model, we verified a comparison between its numerical simulation and experimental results. In addition, the effect of JRC and filling homogeneity on seepage evolution were discussed. The main conclusions are as follows:
With the action of seepage erosion, the evolution of fracture seepage characteristics experienced a non-linear process, which can be divided into three phases. In the initial phase, the flow mainly comprised low-velocity pore flow, and the seepage characteristics evolved slowly. The fluid passed easily through areas of larger porosity, resulting in a larger local seepage velocity and erosion. Then, these large pores interconnected with each other preferentially to form micro-channels, which led to the variation of seepage velocity. The increase of seepage velocity in turn promoted the coupled seepage erosion effect, forming a phase of seepage characteristics rapidly varying. With continuous seepage erosion, the pores continued to expand and run through the entire fractures, with stable seepage channels formed. At this time, most of the filling medium in the seepage field was eroded, and the seepage characteristics were in stable phase.
The JRC and homogeneity coefficient of filling exerted varying degrees of influence on seepage characteristics. Increased JRC hindered increases in flow rate and particle loss. The increased homogeneity of infilling intensified the evolution of seepage characteristics, while uniformly distributed pores were more likely to be interconnected. Therefore, the flow rate increased more rapidly.
The model can be used to calculate the seepage process in filled fractures and provide a reference for engineering geology and prevention of water inrush. However, it must be noted that there are many factors that affect the seepage in the filled fracture, such as the quality of the filling particles and the stress on the fractured rock mass. As such, the applicability of the model still requires further improvement.

Author Contributions

Conceptualization, J.S.; methodology, J.S. and Q.Z.; validation, X.W. (Xintao Wu) and Y.L.; investigation, X.W. (Xunan Wu); data curation, Z.W.; writing—original draft preparation, J.S.; writing—review and editing, J.S.; supervision, Q.Z. All authors have read and agreed to the published version of the manuscript.

Funding

This research was funded by the National Natural Science Foundation of China (grant nos. 51774199 and 51974172).

Conflicts of Interest

The authors declare no conflict of interest.

References

  1. Wang, J.; Li, S.; Li, L.; Lin, P.; Xu, Z.; Gao, C. Attribute recognition model for risk assessment of water inrush. Bull. Eng. Geol. Environ. 2019, 78, 1057–1071. [Google Scholar] [CrossRef]
  2. Li, G.Y.; Zhou, W.F. Impact of karst water on coal mining in North China. Environ. Geol. 2006, 49, 449–457. [Google Scholar] [CrossRef]
  3. Ma, D.; Cai, X.; Li, Q.; Duan, H. In-Situ and Numerical Investigation of Groundwater Inrush Hazard from Grouted Karst Collapse Pillar in Longwall Mining. Water 2018, 10, 1187. [Google Scholar] [CrossRef] [Green Version]
  4. Ma, D.; Duan, H.; Liu, J.; Li, X.; Zhou, Z. The role of gangue on the mitigation of mining-induced hazards and environmental pollution: An experimental investigation. Sci. Total Environ. 2019, 664, 436–448. [Google Scholar] [CrossRef] [PubMed]
  5. Li, S.; Gao, C.; Zhou, Z.; Li, L.; Wang, M.; Yuan, Y.; Wang, J. Analysis on the Precursor Information of Water Inrush in Karst Tunnels: A True Triaxial Model Test Study. Rock Mech. Rock Eng. 2019, 52, 373–384. [Google Scholar] [CrossRef]
  6. Bai, H.B.; Ma, D.; Chen, Z.Q. Mechanical behavior of groundwater seepage in karst collapse pillars. Eng. Geol. 2013, 164, 101–106. [Google Scholar] [CrossRef]
  7. Ma, D.; Duan, H.; Li, X.; Li, Z.; Zhou, Z.; Li, T. Effects of seepage-induced erosion on nonlinear hydraulic properties of broken red sandstones. Tunn. Undergr. Sp. Tech. 2019, 91, 102993. [Google Scholar] [CrossRef]
  8. Li, W.P.; Liu, Q.M.; Sun, R.H. Theoretical and experiment study on Vadose conversion of water inrush later occurred from structure broken zone. Coal Sci. Technol. 2011, 39, 10–13. [Google Scholar]
  9. Li, L.P.; Liu, S.; Li, S.C.; Shi, S.S.; Chen, D.Y.; Zhou, Y.; Lin, P.; Wang, J.H.; Liu, C. Development of testing system for coupled seepage and triaxial stress measurements and its application to permeability characteristic test on filling medium. Rock Soil Mech. 2017, 38, 3053–3061. [Google Scholar]
  10. Yang, B.; Xu, Z.H.; Yang, T.H.; Yang, X.; Shi, W.H. Experimental study of non-linear water flow through unconsolidated porous media under condition of high hydraulic gradient. Rock Soil Mech. 2018, 39, 109–116. [Google Scholar]
  11. Louis, C. Rock Hydraulics in Rock Mechanics, 1st ed.; Springer: Vienna, Austria, 1972; pp. 299–387. [Google Scholar]
  12. Singhal, B.B.S.; Gupta, R.P. Applied Hydrogeology of Fractured Rocks, 2nd ed.; Springer: Dordrecht, The Netherlands, 2010; pp. 139–154. [Google Scholar]
  13. Zimmerman, R.W.; Bodvarsson, G.S. Hydraulic conductivity of rock fractures. Transp. Porous Media 1996, 23, 1–30. [Google Scholar] [CrossRef] [Green Version]
  14. Chen, Y.; Lian, H.; Liang, W.; Yang, J.; Nguyen, V.P.; Bordas, S.P.A. The influence of fracture geometry variation on non-Darcy flow in fractures under confining stresses. Int. J. Rock Mech. Min. 2019, 113, 59–71. [Google Scholar] [CrossRef]
  15. Xiong, F.; Jiang, Q.; Xu, C.; Zhang, X.; Zhang, Q. Influences of connectivity and conductivity on nonlinear flow behaviours through three-dimension discrete fracture networks. Comput. Geotech. 2019, 107, 128–141. [Google Scholar] [CrossRef]
  16. Liu, R.; Li, B.; Jiang, Y. Critical hydraulic gradient for nonlinear flow through rock fracture networks: The roles of aperture, surface roughness, and number of intersections. Adv. Water Resour. 2016, 88, 53–65. [Google Scholar] [CrossRef]
  17. Li, X.; Jiang, Z.; Min, C. Quantitative Study of the Geometrical and Hydraulic Characteristics of a Single Rock Fracture. Energies 2019, 12, 2796. [Google Scholar] [CrossRef] [Green Version]
  18. Nandlal, K.; Weijermars, R. Impact on Drained Rock Volume (DRV) of Storativity and Enhanced Permeability in Naturally Fractured Reservoirs: Upscaled Field Case from Hydraulic Fracturing Test Site (HFTS), Wolfcamp Formation, Midland Basin, West Texas. Energies 2019, 12, 3852. [Google Scholar] [CrossRef] [Green Version]
  19. Shan, P.F.; Lai, X.P. Numerical Simulation of the Fluid–Solid Coupling Process During the Failure of a Fractured Coal–Rock Mass Based on the Regional Geostress. Transp. Porous Media 2018, 124, 1061–1079. [Google Scholar] [CrossRef]
  20. Zhang, Q. Hydromechanical modeling of solid deformation and fluid flow in the transversely isotropic fissured rocks. Comput. Geotech. 2020, 128, 103812. [Google Scholar] [CrossRef]
  21. Zhao, J.; Yin, L.; Guo, W. Stress–Seepage Coupling of Cataclastic Rock Masses Based on Digital Image Technologies. Rock Mech. Rock Eng. 2018, 51, 2355–2372. [Google Scholar] [CrossRef]
  22. Liu, J.; Song, Y.; Skoczylas, F.; Liu, J. Gas migration through water-saturated bentonite-sand mixtures, COx argillite, and their interfaces. Can. Geotech. J. 2016, 53, 60–71. [Google Scholar] [CrossRef]
  23. Hou, X.; Shi, W.; Yang, T. A non-linear flow model for the flow behavior of water inrush induced by the karst collapse column. RSC Adv. 2018, 8, 1656–1665. [Google Scholar] [CrossRef] [Green Version]
  24. Xu, Z.H.; Gao, B.; Li, S.C.; Zhang, L.W.; Zhao, S.L.; Shi, X.S. A groundwater seal evaluation method based on water inflow for underground oil storage caverns. Tunn. Undergr. Sp. Tech. 2018, 82, 265–277. [Google Scholar] [CrossRef]
  25. Feng, M.; Wu, J.; Ma, D.; Ni, X.; Yu, B.; Chen, Z. Experimental investigation on the seepage property of saturated broken red sandstone of continuous gradation. Bull. Eng. Geol. Environ. 2018, 77, 1167–1178. [Google Scholar] [CrossRef]
  26. Huang, Z.; Li, X.; Li, S.; Zhao, K.; Zhang, R. Investigation of the hydraulic properties of deep fractured rocks around underground excavations using high-pressure injection tests. Eng. Geol. 2018, 245, 180–191. [Google Scholar] [CrossRef]
  27. Wang, L.; Kong, H. Variation Characteristics of Mass-Loss Rate in Dynamic Seepage System of the Broken Rocks. Geofluids 2018, 2018, 7137601. [Google Scholar] [CrossRef] [Green Version]
  28. Yao, B.; Chen, Z.; Wei, J.; Bai, T.; Liu, S. Predicting Erosion-Induced Water Inrush of Karst Collapse Pillars Using Inverse Velocity Theory. Geofluids 2018, 2018, 1–18. [Google Scholar] [CrossRef]
  29. Houben, G.J. Review: Hydraulics of water wells-flow laws and influence of geometry. Hydrogeol. J. 2015, 23, 1633–1657. [Google Scholar] [CrossRef]
  30. Vardoulakis, I.; Stavropoulou, M.; Papanastasiou, P. Hydro-mechanical aspects of the sand production problem. Transp. Porous Media 1996, 22, 225–244. [Google Scholar] [CrossRef]
  31. Papamichos, E.; Vardoulakis, I. Sand erosion with a porosity diffusion law. Comput. Geotech. 2005, 32, 47–58. [Google Scholar] [CrossRef]
  32. Zhang, Q.; Chen, Y.; Yang, Z.; Darve, E. Multi-Constitutive Neural Network for Large Deformation Poromechanics Problem. In Proceedings of the Machine Learning and the Physical Sciences Workshop, 34th Conference on Neural Information Processing Systems (NeurIPS), Vancouver, BC, Canada, 6–12 December 2020. [Google Scholar]
  33. Chapuis, R.P.; Aubertin, M. On the use of the Kozeny Carman equation to predict the hydraulic conductivity of soils. Can. Geotech. J. 2003, 40, 616–628. [Google Scholar] [CrossRef]
  34. Stigsson, M.; Ivars, D.M. A Novel Conceptual Approach to Objectively Determine JRC Using Fractal Dimension and Asperity Distribution of Mapped Fracture Traces. Rock Mech. Rock Eng. 2019, 52, 1041–1054. [Google Scholar] [CrossRef] [Green Version]
  35. Wang, C.S.; Wang, L.Q.; Ge, Y.F.; Liang, Y.; Sun, Z.H.; Dong, M.M.; Zhang, N. A nonlinear method for determining two-dimensional joint roughness coefficient based on statistical parameters. Rock Soil Mech. 2017, 38, 565–573. [Google Scholar]
  36. Li, R.; Xiao, W. Study on a new equation for calculating jrc based on fine digitization of standard profiles proposed by barton. Chin. J. Rock Mech. Eng. 2018, 37, 402–409. [Google Scholar]
  37. Yang, Z.Y.; Lo, S.C.; Di, C.C. Reassessing the joint roughness coefficient (JRC) estimation using Z 2. Rock Mech. Rock Eng. 2001, 34, 243–251. [Google Scholar] [CrossRef]
  38. Li, S.; Wang, J.; Li, L.; Shi, S.; Zhou, Z. The theoretical and numerical analysis of water inrush through filling structures. Math. Comput. Simulat. 2019, 162, 115–134. [Google Scholar] [CrossRef]
  39. Tang, C.A.; Tham, L.G.; Lee, P.K.K.; Yang, T.H.; Li, L.C. Coupled analysis of flow, stress and damage (FSD) in rock failure. Int. J. Rock Mech. Min. Sci. 2002, 39, 477–489. [Google Scholar] [CrossRef]
  40. Zhu, W.C.; Tang, C.A. Micromechanical model for simulating the fracture process of rock. Rock Mech. Rock Eng. 2004, 37, 25–56. [Google Scholar] [CrossRef]
  41. Shao, J.; Zhang, Q.; Sun, W.; Wang, Z.; Zhu, X. Numerical Simulation on Non-Darcy Flow in a Single Rock Fracture Domain Inverted by Digital Images. Geofluids 2020, 2020, 1–13. [Google Scholar] [CrossRef]
Figure 1. Water inrush in tunnel engineering.
Water 12 03188 g001
Figure 2. Water inrush in underground mining: (a) karst collapse pillar (KCP); (b) water inrush from roof.
Water 12 03188 g002
Figure 3. Pore channel with fluidized solid particles.
Water 12 03188 g003
Figure 4. Schematic diagram of the model: (a) geometry conditions; (b) boundary conditions.
Water 12 03188 g004
Figure 5. Initial porosity φ ¯ ( X ) obeying Weibull distribution.
Water 12 03188 g005
Figure 6. The nearly stable pore pressure distribution.
Water 12 03188 g006
Figure 7. The seepage velocity | q | contours at different times: (a) 20 s; (b) 40 s; (c) 60 s; (d) 80 s. Note that here we changed the range of color bar for better comparison.
Water 12 03188 g007
Figure 8. Flow rate curve.
Water 12 03188 g008
Figure 9. The seepage velocity | q | curves along the outlet boundary at different times.
Water 12 03188 g009
Figure 10. The porosity contours at different times: (a) 20 s; (b) 40 s; (c) 60 s; (d) 80 s.
Water 12 03188 g010
Figure 11. Average porosity curve and average permeability curve.
Water 12 03188 g011
Figure 12. Experiment of the model: (a) a rock-like sample with the fracture; (b) the filled fracture; (c) water injection process.
Water 12 03188 g012
Figure 13. Experiment results: (a) the initial sample; (b) the sample after the experiment.
Water 12 03188 g013
Figure 14. The flow rate curves of numerical simulation versus experiment.
Water 12 03188 g014
Figure 15. The flow rate per unit thickness curves for different joint roughness coefficients (JRCs).
Water 12 03188 g015
Figure 16. The seepage velocity | q | contours for different JRCs at 30 s.
Water 12 03188 g016
Figure 17. Initial porosity statistics with different homogeneity coefficients.
Water 12 03188 g017
Figure 18. The flow rate per unit thickness curves for different homogeneity coefficients.
Water 12 03188 g018
Figure 19. The porosity contours for different homogeneity coefficients at 20 s. Note that here we changed the range of color bar for better comparison.
Water 12 03188 g019
Table 1. Parameters for numerical simulation.
ρ f / ( kg / m 3 ) ρ s / ( kg / m 3 ) η / ( Pa · s ) k 0 / ( m 2 ) λ / ( m 1 ) m C ¯ φ 0
1000 2000 10 3 10 12 20 20.010.2
Table 2. List of simulation schemes.
ParametersValue
JRC48121620
Homogeneity coefficient m246810
Publisher’s Note: MDPI stays neutral with regard to jurisdictional claims in published maps and institutional affiliations.

