Article

Reducing the Carbon Footprint of the Water-Energy Binomial through Governance and ICT. A Case Study

by
Jesús Chazarra-Zapata
1,
Dolores Parras-Burgos
2,*,
Francisco-Javier Pérez-de-la-Cruz
3,
Antonio Ruíz-Canales
1 and
José Miguel Molina-Martínez
4
1
Engineering Department, Universidad Miguel Hernández de Elche, 03312 Orihuela, Spain
2
Structures, Construction and Graphical Expression Department, Universidad Politécnica de Cartagena, 30202 Cartagena, Spain
3
Mining and Civil Engineering Department, Universidad Politécnica de Cartagena, 30203 Cartagena, Spain
4
Agromotic Engineering and the Sea R+D+i Research Group, Universidad Politécnica de Cartagena, 30203 Cartagena, Spain
*
Author to whom correspondence should be addressed.
Water 2020, 12(11), 3187; https://doi.org/10.3390/w12113187
Submission received: 10 September 2020 / Revised: 5 November 2020 / Accepted: 11 November 2020 / Published: 14 November 2020
(This article belongs to the Special Issue Water Economics and Water Distribution Management)

Abstract

:
This paper reveals reductions of up to 485 t CO2 eq (CO2 equivalent) of greenhouse gas (GHG) emissions of energy origin associated with the water-energy binomial which can be achieved after modernizing and automating a Water User Association (WUA) of over 1780 users with microplots in a total area of 775 ha in southeastern Spain. This case study aims to show how the latest advances in information and communication technologies (ICTs) for precision agriculture are being applied efficiently with the implementation of a Smart Agri system, capable of making improvements through the use of renewable energies (64.49% of the total CO2e- avoided), automation in irrigation water management, by applying adequate governance, use of ICTs (731,014 m3 per water footprint reduction with 20.41% of total CO2 eq of associated electrical origin), hydraulic improvements (283,995 m3 per water footprint reduction, 13.77% of the total CO2 eq of associated electrical origin) and reduction of evaporation in reservoirs (26,022 m3 of water by water footprint reduction with 1.33% of the total CO2 eq electrical origin avoided) that act as batteries to accumulate the daily solar energy and enable watering at night, when irrigation is most efficient. It is important to consider the valuable contribution of these artificial green lungs, not only in terms of food for the European Union, but also as a CO2 eq sink that supports the planet’s GHGs. As shown in this study, this is made possible by the joint governance led by the Water Users Association (WUA) and co-led by different management organizations with the support of ICT.

1. Introduction

The first reports of water governance in Murcia date back to the time of Alfonso X ‘El Sabio’, in the thirteenth century [1]. The rules for the use of water for agricultural use came from Muslim settlements. The Muslim people passed on the knowledge learned from the East [2], using the energy of the moving water to elevate it to lands above river level, adding value to the land dedicated to dry crops thanks to others with irrigation. In doing so, they understood the need to seek renewable energy sources. Farmers in the Region of Murcia (Spain), in the Segura basin, have maintained, improved and preserved the hydraulic facilities they inherited, while striving to produce the best fruits and vegetables in Europe.
The water and energy binomial applied to farms, using pressurized water systems, is a consequence of the water stress to which temperate areas of the Mediterranean area are subjected. The decrease in water availability, due to climate change, is forcing Murcian farmers to develop sustainable water energy systems to make their farms viable and reduce the water footprint by reducing their water consumption, taking advantage of the torrential rains captured by storm/environment tanks [3], using recovered water [4] and increasing the efficiency of its distribution systems. In addition, alternative energies are required to reduce emissions costs and production [5,6,7], together with the carbon footprint associated with the required energy consumption (based on real-time ICT governance and management [8,9,10]).
This study is based on the different energy audit systems used in Eastern Spain [11,12,13]. To this end, a scheme has been established that may be applicable to other water systems, which analyses the emissions generated, both avoidable and non-avoidable. Figure 1 shows a diagram that evaluates different actions based on their relevance and effectiveness. In a first phase, the total water unit system (irrigation system) should be examined and localized energy component consumption evaluated [14], considering both water reduction and carbon footprint. To achieve a global result, energy turnover has been studied in recent years along with water consumption by existing sectors. The diagram shows the role of water governance (Figure 1, purple zone), which is similar to a remote control management system. A maximum demand per hectare should be established because new crops should not be planted in certain sectors so as not to collapse the system. As for water problems (Figure 1, blue zone), this study examined how to sectorize the irrigator community by grouping sectors by similar manometric height levels, because excess pressure can cause leaks at irrigation points [15]. In addition, different scenarios are studied that are able to supply water according to demand by combining various sources (i.e., wells, transfers, regenerated water), without compromising viability. It is also necessary to locate any leakage to repair them or determine the abnormal operation of the hydraulic elements, complementing this with the use of regenerated water [16], just as astronauts do [17,18,19]. These processes are achieved through an energy balance where water intakes and CO2 eq emissions are well established. Once these steps are completed, it is necessary to study the parts of the system that consume energy (Figure 1, orange zone) and generate emissions [20]. The energy consumption needed to replace them with renewable energies should be analyzed [21] or reduce consumption by applying smart measures and systems. In addition, water losses due to evaporation should be examined because, in this case, the losses caused are significant and lead to energy waste and avoidable emissions. Additionally, this study sought to visualize the sequestration of CO2 eq by agricultural plantations (the artificial lungs of southern Europe), [22]. Several publications have been revised and used as a method of calculation, CO2 eq sequestration by green mass has been differentiated from cultivation and soil depending on crop type and area, as well as its emissions during breathing in the night phase and emissions produced by fertilization. With these values, a balance of the CO2 eq sequestered a WUA has been calculated.

2. Materials and Methods

This study analyzed the monthly consumption of all consumption points in the Water Users Association (WUA) over the last 10 years (about 216,360 records). This data was processed in Excel to determine energy turnover for the year 2016 (considered the baseline year). In addition, all inputs and water consumption during 2016 were collected to determine a real kWh value of the energy associated with each m3 of water consumed. With the kWh/m3 obtained annually, the CO2 eq t values associated with energy consumption were calculated, to determine the carbon footprint generated by an WUA (later with this kWh/m3 value, and after applying ICTs, governance measures and consumption reductions), it is possible to calculate how much energy is being wasted, also, avoided CO2 eq emissions are calculated. Subsequently, to show the benefits of crop management, a study was carried out on the evolution of crops over 10 years in the two municipal terms associated with this WUA, basing this work on the studies by CEDEX (Center for Studies and Experimentation and Public Works in Spain) on sequestered CO2 eq by these crops, according to their species, the sequestered CO2 eq was determined.
The applied methodology has been included in several publications. A general aspect about the evaluation of the nexus food, energy and water is cited by Sadegh et al. in 2020 [23]. This was located in USA. Another publication is about the determination of water footprint and primary demand for rice systems in China [24]. This paper includes the calculation of carbon footprint (CF), nitrogen footprint (NF), and primary energy demand (PED) of different rice production systems. Another case study was located in Spain [25]. The study was developing the reduction of water footprint and energy consumption (in the pumps that pressurize the grid, such as in the optimization of the proposed solution, by using batteries that communicate in low radiation of electric and magnetic alternating fields (LoRad), General Packet Radio Service (GPRS), or narrowband IoT (NB-IoT), or clean energy). The case study was about irrigation systems. Some aspects about energy balances and greenhouse gas emissions in agricultural zone in China [26] is cited in other paper. In this study, the objective was to evaluate the difference of crop and livestock products regarding energy balances, greenhouse gas (GHG) emissions, carbon economic efficiency and water use efficiency using a life cycle assessment (LCA) methodology on farms in three sub-oases within the Shihezi Oasis of China. Moreover, some authors of this article included an additional study about the reduction of carbon footprint in a water user’s association in Spain [27]. In this case, the use of photovoltaic generation for the contribution in the reduction of greenhouse gas (GHG) emissions is analyzed. Additionally, the water and energy footprint for this system is presented. These methodologies have been included in the present paper.

2.1. Field Data

The Water Users Association (WUA) of the area under study is located in the Region of Murcia (Spain). The irrigable area is 799.71 ha: SECTOR I “HUERTA ALTA” (373.58 ha) and SECTOR II “HUERTA BAJA” (426.03 ha). This WUA is a combination of different irrigation groups and associations with over 1400 farmers. This WUA is fortunate to be able to choose three sources of water from different sources (regenerated water from the wastewater treatment plant (WWTP) in the village of the case study, water from the Tajo–Segura Transfer (TST), and a well on the property). The associated costs are proportional to the energy needed to pump the water and transport it to the plots that require the water and to lift it to the height applicable to the crops. Water governance and planning plays a fundamental role in achieving long-term life cycle analysis (LCA) objectives (our case study LCA gate to gate). Actions in agriculture are not instantaneous; they require a medium term to be effective and achieve significant objectives. The use of energy is associated with a carbon footprint which must be reduced to achieve the sustainable development goals (SDGs) and reduce the impact on the environment. Furthermore, the water footprint is associated with water governance, either by reducing its losses by improving distribution pipelines, improving management through automated systems that identify leaks and ultimately optimizing irrigation systems.

2.1.1. Agroclimatic Characteristics

It is important to consider the key agroclimatic characteristics of this WUA in relation to our study: a characteristic warm or semi-warm Mediterranean subtropical climate, with high temperatures during the summer determined by its latitude, reaching values of 32–34 °C, scarce rainfall (200–300 mm per year), although intense in years of flooding (e.g., torrential rains may occur, surpassing 350 mm). For these reasons water supply capacity must be guaranteed during the driest months, in the years of most rainfall.

2.1.2. Available Resources and Water Demand

To determine the true needs of the WUA, the operating regimes of the different sources available were analyzed and a reference year was used, which was most suited to the average consumption over the last 10 years. These data (Figure 2) provided a snapshot of the needs per month. As these needs are seasonal (that is, supply varies with the months of the year, depending on the weather and the state of storage of the transferring Tagus basin), this requires the collaboration of the reservoirs that are in service and the different available resources. The annual amount of available water is 3,629,361 m3 which guarantees the survival of the crops. Using these values as a starting point, it is important to analyze and propose actions to compare and quantify the potential associated improvements. To do so, an initial scenario must be established, with specific data that can later be evaluated. This study considered 2016 as the baseline year.

2.2. Equivalent CO2 eq Flow to the Atmosphere

If the quantity of consumed kWh for irrigation water supply is analyzed, the total amount for 2016 was 2,032,471 kWh. To calculate the carbon footprint generated it is important to know the transformation rate of this value. The fork values of the studies investigated range from 0.0413 kgCO2eq/kWh in a study conducted in Brazil according to Cardozo et al. [28], up to 0.947 kgCO2eq/kWh recorded by China in the two studies investigated by Li Cheng et al. [29] and Wan et al. [30] reached a value of 0.780, 0.608 and 0.166 kgCO2eq/kWh in Iran [31,32] and in Spain [33], respectively.
The values used in this study were based on the annual transformation rates called “electric mix factor (kgCO2eq/kWh)”, determined by the National Commission on Markets and Competition (CNMC, www.gdo.cnmc.es). The last 5 years were considered in order to calculate the average value (Figure 3).
In the case of electrical energy, the rate of transformation varied between 0.041 and 0.947 kgCO2eq/kWh, due to the generation mix used in each study area. This has been a key factor in calculating GHG emissions from water management in irrigation, and consequently it is important to deepen this aspect, analyzing and considering variations in the rate of transformation of electricity, to more accurately calculate the generated GHG emissions.
In total, 74 gCO2eq/kWh was deducted from the cost of emissions involved in the generation and installation of photovoltaic plates according to data obtained from table 8 of study by Huld et al. [34] resulting in the 0.308 kgCO2eq/kWh of this study which fits with the values set out above (taking into account the relation: 1 kWh corresponds to 0.308 kg of CO2 eq) equaled a total amount of 626 t CO2 eq (Figure 4).

2.3. Adopted Measures for Reduction of the Carbon Footprint

After analyzing the system, framed decisions must be applied within the scope of water governance, in order to eliminate any limitations of the system and improve its exploitation by taking advantage of the available resources and considering weak points. These could refer to reservoirs where the exploitation does not contribute significantly to the system and leads to water loss via evaporation. To take advantage of the surface, photovoltaic plants (or other viable plants) could be introduced to generate clean energies.

2.3.1. Minimization of the Energy

The objectives of the European Climate Law proposal by the European Parliament endorsed the EU’s goal of achieving net greenhouse gas emissions by 2050 in its resolution of 14 March 2019 on climate change 4 [35,36]. It is necessary to act on the WUA’s energy consumption sources. After analyzing the relevant bills, the points of greatest consumption are the catchment pump systems, in this case there are three (Figure 5).
The first goal towards the reduction greenhouse gas emissions was to improve the efficiency of lifting the water. For this reason, a study of the operating status of the pumps was carried out, comparing this with the optimal requirements of the equipment for use in real conditions. This revealed that all pumps had to be replaced and frequency inverters were required (Table 1). The second goal was to replace the use of conventional energy with renewable energy. This enables the reduction of consumption, together with associated emissions.

2.3.2. Analysis of the Available Technologies

After a detailed analysis of the different technologies available, photovoltaic generation was identified as the optimal option. This was due to the maturity of the technology, the availability of areas, the elevated irradiation in the area and the close proximity between the zones of generation and consumption. Other considered and rejected options were:
  • Wind energy: after examination and according to the wind maps, the main conclusion was that insufficient available power. It would be necessary to complement the same with other alternative and safe energy sources, in order to avoid periods without energy supply.
  • Water energy: the irrigation network design takes advantage of the existent overpressures at several points of the system in order to generate electric energy. After a technical study, the incorporation of this technology was evaluated. The solution was the incorporation of two micro turbines linked to the existing pressure reduction valves. Moreover, the installed powers were 10 and 7.5 kW. This option was discarded because of the low power available. Additionally, the large distance between energy generation and the nearest consumption (nearly three kms distance to the filtering system) can generate major losses due to the energy used during transportation.

2.4. Solar Photovoltaic System

To calculate the energy generated in each of the photovoltaic systems, the Database of the Satellite Application Facility on Climate Monitoring (CM SAF), belonging to the European Organization for the Exploitation of Meteorological Satellites, was used, and as a calculation tool, the PVGIS was used (Photovoltaic Geographical Information System) [37,38] and PVWatts [39,40] provided solar radiation databases on the web for calculating photovoltaic potential in various countries. This software uses all the climatic values (irradiation, temperature, among others) and geographical values of the area. This enables the energy generated by each of the photovoltaic plants was obtained. To design the system, the separation between rows and modules and the optimal inclination of the panels as a function of latitude were considered.
The system is designed to use accumulation reservoirs to meet instantaneous demands, thus avoiding the use of batteries that must be renewed and ultimately generating a carbon footprint during production and subsequent disposal. Pumping will be fed from the photovoltaic field, programming the inverters according to the levels in the existing reservoirs and the required production level.
The photovoltaic plants were calculated using the PVGIS software from the CM SAF database, obtaining the daily and annual electricity production supplied by each of the calculated plants [27,41] (see Table 2). Optimization of solar panels was designed considering their position, inclination and orientation.
It is important to consider that the monthly operation periods of the pump must adapt to the monthly generation curve of a photovoltaic installation, redistributing the peak consumption in the consecutive months and taking advantage of the existence of reservoirs for regulation and the quota that functions as systems for the accumulation of potential energy, thus, the installation of batteries of capacitors is ignored, equaling a significant saving for increasing the efficiency of the solar installations (Figure 6).

2.5. Water Footprint

Once the actions of the electrical component of the system have been calculated, the value of the water footprint must be studied, by analyzing the balance sheets of the water purchased for irrigation and the real cost of the same for farmers (Figure 7). The difference equals the losses in the system and conforms the water footprint, divided as follows: (1) the losses due to evaporation during storage in the reservoirs and (2) the losses due to the state of the hydraulic network.

2.5.1. Direct Consumption Reduction by Governance

After evaluating these losses, several actions can be taken to reduce the water footprint. First, the system is analyzed, based on principles of efficient water governance (see blue area of the diagram, Figure 1). To this end, the farmers must be advised regarding the permissible crops, as well as the maximum endowments per plot, and the shifts established that are linked to the manometric heights of the plots in both sectors. To make this viable, it is necessary to use the ICTs that provide us information in real time such as enabling the possibility of changing the irrigation programs depending on the data provided by the meteorological stations (see article quote), or adjusting of water supplied to the plot, applying the data of the weighing lysimeter (see reference) (audio-slide can be added of the operation of the weighing lysimeter), and completing this with the information provided by the soil moisture sensors (see article quote) (Figure 8).
It is also possible to program the irrigation to stop if certain moisture values are delimited in the terrain. All these actions lead to a savings regarding the direct consumption of water (which, in our case, equaled approximately between five to 10% of the actual consumed water). This saving is quantified by not wasting water that does not benefit the crop. In turn, this leads to a loss of indirect energy associated with water, which requires energy from the system to extract, distribute, and use the water in a plot, albeit with the minimum pressure, in order for the localized irrigation systems to work (see article quote). Furthermore, it is important evaluate and quantify the effect on the carbon footprint. The efficiency in the application represents the water that is used by the crops, compared to that applied to the plot. This will depend on the irrigation system used and the losses caused by deep percolation, runoff and lack of uniformity. The evaluation was carried out for the whole community of irrigators, establishing the weighted average, based on the proportional distribution of the irrigation systems used by surface, and considering the following values (Table 3) (values obtained from the efficiencies in the irrigated areas considered in ORDER ARM/2656/2008, of 10th September, approving the hydrological planning instruction [42]).
The current network has a surface irrigation system with total coverage (blanket irrigation) from the endowments from ditches. This provides a value of efficiency in the application of 60% or, in some cases with drip irrigation on the surface and good management the efficiency is set at 90%. This means that the reduction by indirect consumption amounts to, at least 35% of the water actually consumed (1,020,848.10 m3).

2.5.2. Indirect Consumption Reduction (ICR)

The reduction of the water footprint by losses via direct consumption has been differentiated into two sections:
  • ICR by evaporation potential: losses due to evaporation on the surface of the ponds during storage (these represents the losses associated with the insulation received by the water sheet surfaces of the ponds and whose value has been estimated at 0.5 m3/m2) [43]. To estimate this, the initial losses must first be evaluated with the rafts that are available before applying the reductive actions. After applying these actions, the new exposed surfaces are calculated. The rafts and two others have been covered with a TPO polypropylene sheet reinforced with polyester mesh inside, which is estimated to be reduced by 95%. With the difference in volume of evaporated water WeBA = 53,514 m3 before and after the corrective actions WeAA = 27,492 m3, the water footprint that is generated has been quantified, obtaining a value of WeR = 26,022 m3 representing the volume of water annually saved by covering rafts and the reduction of surface exposed to insolation, by eliminating two of the rafts and transforming these into photovoltaic plants (Table 4).
  • ICR for water improvements: The new improvement introduced in the system as the doubling of the pipes enabled a more adequate exploitation and the distribution in open ducts has been eliminated in front of pressurized pipes while remote control systems with controlled solenoid valves have been installed. Solenoids and counters in the irrigation head enable a balance of water inlets and outlets which helps clarify which sectors and networks suffer from water loss and require repair. This type of improvement reduces the total volume of losses (Vls = 946,651.90 m3) by approximately 30%, which in turn reduces the water footprint for water improvements of the system (VlsR = 283,995.57 m3). Finally, the value of the reduction of the water footprint is based on the reduction by direct consumption (by governance and ICT) and indirect consumption (by evaporation and by hydraulic actions) (Figure 9), equaling a total amount of 731,014.41 m3, disaggregated according to the summary displayed in Table 5.

3. Results

3.1. Reduction of Carbon Footprint by Water Footprint

In this study, by using data from electricity bills, the total energy consumption by origin has been calculated. Thanks to this financial data, the total volume of water that has moved within the system has also been determined. This clarifies the carbon footprint that generates the water footprint required to obtain a kWh/m3 ratio (IE-W). This ratio will change annually and, if there is an adequate monitoring of the movements of the water when it is operating, the telecontrol scale can be determined with greater accuracy and value. In this study, it is used the average value of the three ratios according to origin and divided this by the total water purchased. The final value obtained was (IE-W) 0.62 kWh/m3 and, considering that the volume of water reduced by water footprint is 731,014.41 m3, a reduction of CO2 eq emissions is obtained (0.382 kgCO2eq/kWh), equivalent to 139 t CO2eq/y (Figure 10) (it should be noted that for our study, only emissions associated with energy consumption, water handling for irrigation, have been considered, it is actually superior because the reduction of water in the water footprint is associated with a lower consumption of fertilizers that would increase this value by about a third).

3.2. Sequestration of CO2 eq by Crops

Given that the purpose of a WUA is the production of food based on growing crops, determining the amount of CO2 eq sequestered by this community of farmers is sought. Consequently, this work is based on the study of the typology of the existing crops and irrigation varieties in the area, as well as their evolution over the last 10 years, both in the municipality of Pliego and in the municipality of Mula. See Annex 6 for the agronomic report of the project for the adaptation of Sector I “Huerta Alta” of the community of irrigators of Pliego (Murcia, Spain) [44].
This study shows the slight regression of irrigated land cultivated in the municipality of Pliego, as well as the low diversification of existing crops. Based on this data, the distribution of crop units by area differing from the plant, from the farmland has been estimated and the annual carbon values abducted in accordance with the study of Carvajal et al. [45] for the carbon accumulated in the plant have been applied. These values have discounted the CO2 eq generated during the existence of the plant, since half the day is spent purifying CO2 eq by day, transforming it into Carbon, emitting an approximate third of CO2 eq at night [46]. For the purposes of the farmland more than accumulated on the land (approx. 6% of the total abducted) taking as reference values the contents in the publication of Visconti et al. [47]. As displayed, the annual CO2 eq reduction for crops (Table 6) of a WUA is high, with 7007 t CO2 eq sequestrated from the atmosphere.

3.3. Total CO2 eq Balance of Our W-E SYSTEM in a WUA

The total balance of our water-energy system provides us with many benefits, as shown in Figure 11.
Note that there are savings in annual CO2 eq emissions after the implementation of these three photovoltaic installations, as follows:
  • 111.18 t CO2 eq for the TST pumping.
  • 167.31 t CO2 eq for pumping Well.
  • 33.46 t CO2 eq for pumping WWTP.
These three actions significantly improve the energy capacity of the Community of Irrigators and will they reduce annual maintenance costs once the break-even point has been reached for the installation, as well being totally unconnected with the Electric Fee factor. Furthermore, it is important to highlight the reduction of the water footprint (731,014.41 m3) that contributes to reducing CO2 eq emissions by 173 t per year. However, the key piece of agriculture in Murcia is the sink of CO2 eq that must be preserved by reducing, in this case, up to 7492.08 t CO2 eq per year which, in the authors’ opinion, is a magnificent contribution to the environment (Figure 12).

4. Discussion

After consulting the literature, the GHG indices and emissions during irrigation water management have been summarized, applicable to this case study, (Table 7) the values are in the range of 0.166 in Spain [33] with surface source water used in localized irrigation, at 0.341 kgCO2eq/kWh, in China [48] where the water used for winter wheat irrigation came from underground, passing through the sum of 0.062 kgCO2eq/kWh of electrical origin plus 0.732 kgCO2eq/L of fossil fuel consumption in Pakistan [49], also of underground origin. The starting data were annual consumption of 2,149,500 m3 and 2,032,471 kWh in 2016, resulting in an emission index of 0.361 kgCO2eq/kWh per m3, before carrying out the improvement actions described in this article. After the actions, there is a consumption of 1,012,811 kWh/y of photovoltaic renewable origin, a reduction due to an improvement in the performance of the pumping equipment equivalent to 1,019,660 kWh/y and a water consumption of 1,418,485 m3 per year after reducing more than 34% its water footprint. Given that the emissions are from renewable energy, it is possible to affirm that the emissions index by electrical origin associated with the water-energy binomial has been reduced to zero “0”.
Additionally, the carbon footprint sequestered thanks to the crops of this WUA (7000.7 t CO2eq/y) provides a value of 8.7 t C/ha per year against the threat of desertification and abandonment of farmland must be weighed. Due to the great contribution that this makes to mitigating climate change, Pinus pinaster forests are capable of sequestering 1.58 t C/ha, compared to Eucalyptus globulus forests, which are capable of sequestering up to 5.14 t C/ha [50], providing an idea of the great value of the vegetation cover provided by agriculture in the southeast of Spain.
Agriculture is the basis of our development, we cannot eat electronic chips or consume digital food. The evolution of the digital society and globalization are a reality that must be compensated in a manner that does not unbalance the ecosystems in which we operate. Developing countries should not lose control of the agricultural production that feeds their citizens. Thus, new technologies help us to control the quality of our food, how it is produced, where it is produced, when it is produced, who produces it and under what phytosanitary conditions. Most importantly, a footprint is produced in nature during the generation of these foods. Governance as a management tool is capable of articulating the reduction of GHG, starting from the allocation of certain water resources, to certain lands, and promoting the use of green energy during production. This article shows how farmers in eastern Spain, inspired by the astronauts living in space stations, are able to reuse reclaimed water from WWTPs, optimize and reduce energy consumption in their fields as much as possible, and take advantage of the energy resources generated. Nature provides resources (in this case solar energy), for improving their irrigation system and taking advantage of the advances in ICT to be able to maintain the artificial forests (fruit orchards) of the Mediterranean countries that serve as a lung to renew CO2 eq in southern Europe while acting as a barrier to the threat of desertification as a consequence of climate change. Currently, as the global COVID-19 pandemic has drastically restricted people’s mobility, the importance of having locally grown products has been highlighted, to avoid possible shortages affecting local markets.

5. Conclusions

Agriculture maintains the forests of fruit trees and vegetable plantations, allowing us to breathe cleaner air. It also avoids the abandonment of arable land and translates into a socio-economic redistribution that offers a niche market for women. This is thanks to the governance of the different administrations that must plan the availability of resources, the allocation of endowments for crops and the ICTs that optimize management and control of these resources. It should be noted that in semi-arid areas of the Mediterranean, fruit/agricultural plantations should be considered not only as the main means of production, but also as an ecological method of protection against climate change, concretely, against desertification.
In summary, and after appreciating the data presented in Section 4 discussion, this study seeks to collaborate in the fulfillment of the three objectives of European policy within the Climate and Energy Framework for 2030:
  • reduction of at least 40% of greenhouse gas emissions (relative to 1990 levels).
  • increase of at least 27% in the share of renewable energies.
  • improve energy efficiency by at least 27%.
It also contributes to the fulfillment of the following SDGs:
SDG 6 (sections 6.3 and 6a), the use of reclaimed water using alternative energies and ICTs is promoted, as well as actions to cover reservoirs that produce a better efficient use of the water resources of this WUA.
SDG 7 (sections 7.2 and 7.3), the increase in the proportion of renewable energy in our system is evidenced).
SDG 12 (sections 12.2 and 12.4), the set of actions described produces sustainable management and an improvement in the efficient use of natural resources, in our case water. All the actions described in this paper are aimed at reducing emissions to the atmosphere.
SDG 15 (section 15.3), the lands included in this study and during its preparation (last 4 years) have been affected, by periods of drought and floods, which, if it were not for the aid articulated by the European Union, would be led to abandonment and subsequent desertification.
Thus, primary production methods, such as agriculture, must be integrated into sustainable technological development, serving as an example of development to other semi-arid regions that need accessible solutions. The need to import energy from other countries must also be reduced and create new opportunities for sustainable growth through the use of renewable energies.

Author Contributions

Conceptualization, J.C.-Z. and F.-J.P.-d.-l.-C.; methodology, D.P.-B.; software, J.C.-Z.; validation, D.P.-B., A.R.-C. and J.M.M.-M.; formal analysis, J.C.-Z. and F.-J.P.-d.-l.-C.; investigation, J.C.-Z.; resources, J.C.-Z. and D.P.-B.; writing—original draft preparation, J.C.-Z.; writing—review and editing, D.P.-B., A.R.-C. and J.M.M.-M.; visualization, D.P.-B.; supervision, J.M.M.-M.; project administration, J.M.M.-M., A.R.-C.; funding acquisition, J.C.-Z. All authors have read and agreed to the published version of the manuscript.

Funding

We are also grateful to the ALICE Project “Accelerate lnnovation in Urban Wastewater management for Climate Change”- Proposal Number: 734560, financed by the European Commission, Grant by Horizon2020 under the specific Marie Sklodowska Curie Actions program -RISE-, and to the PG105592, AQUARES Project financed by the European Commission, under the European territorial cooperation program: Interreg Europe.

Acknowledgments

We extend our gratitude to the Region of Murcia, the participating Water User’s Association of Pliego, and especially to Miguel Angel del Amor Saavedra and Antonio Rabadán Mínguez.

Conflicts of Interest

The authors declare no conflict of interest.

References

  1. Murcia and Water: History of a Passion. Regional Assembly of Murcia (Spain) (In Spanish). Available online: https://www.asambleamurcia.es/divulgacion/murcia-y-el-agua-historia-de-una-pasion (accessed on 5 November 2020).
  2. Caro Baroja, J. The Villages of Spain; Ediciones Istmo: Madrid, Spain, 2003; Volume 3011. (In Spanish) [Google Scholar]
  3. Vera, J.F.; Olcina, J.; Hernández, M. Landscape, Territorial Culture and Experience of Geography. Book Tribute to Professor Alfredo Morales Gil; Publications of the University of Alicante: San Vicente del Raspeig, Alicante, Spain, 2016. [Google Scholar]
  4. Melgarejo, J.; López-Ortiz, M.I. Wastewater Treatment and Water Reuse in Spain. Water Landsc. 2016. (In Spanish) [Google Scholar] [CrossRef] [Green Version]
  5. Dingkuhn, M.; Luquet, D.; Fabre, D.; Muller, B.; Yin, X.; Paul, M.J. The case for improving crop carbon sink strength or plasticity for a CO2-rich future. Curr. Opin. Plant Biol. 2020. [Google Scholar] [CrossRef] [PubMed]
  6. Nowak, D.J.; Greenfield, E.J.; Hoehn, R.E.; Lapoint, E. Carbon storage and sequestration by trees in urban and community areas of the United States. Environ. Pollut. 2013, 178, 229–236. [Google Scholar] [CrossRef] [PubMed] [Green Version]
  7. Vanuytrecht, E.; Raes, D.; Willems, P. Considering sink strength to model crop production under elevated atmospheric CO2. Agric. For. Meteorol. 2011, 151, 1753–1762. [Google Scholar] [CrossRef]
  8. Daum, T. ICT Applications in Agriculture. In Reference Module in Food Science. Encyclopedia of Food Security and Sustainability; Elsevier: Amsterdam, The Netherlands, 2019; Volume 1, pp. 255–260. [Google Scholar]
  9. Ferrández-Villena, M.; Ruiz-Canales, A. Advances on ICTs for water management in agriculture. Agric. Water Manag. 2017, 183, 1–3. [Google Scholar] [CrossRef]
  10. Sahu, B.; Chatterjee, S.; Mukherjee, S.; Sharma, C. Tools of precision agriculture: A review. Int. J. Chem. Stud. 2019, 7, 2692–2696. [Google Scholar]
  11. Camacho, E.; Rodríguez, J.; Montesinos, P. Saving water and energy consumption in the modernisation of irrigation (In Spanish). In Effects of the Modernisation of Irrigation in Spain; Berbel, J., Gutiérrez-Martín, C., Eds.; Cajamar: Almería, Spain, 2017; pp. 221–249. [Google Scholar]
  12. Fernández-Pacheco, D.; Ferrández-Villena, M.; Molina-Martínez, J.; Ruiz-Canales, A. Performance indicators to assess the implementation of automation in water user associations: A case study in southeast Spain. Agric. Water Manag. 2015, 151, 87–92. [Google Scholar] [CrossRef]
  13. Melián-Navarro, A.; Molina-Martínez, J.; Rodríguez-Díaz, J.; Ruiz-Canales, A. Performance indicators to assess the implementation of automation in golf courses located in Southeast Spain. Agric. Water Manag. 2017, 183, 35–40. [Google Scholar] [CrossRef]
  14. Daccache, A.; Ciurana, J.; Diaz, J.R.; Knox, J.W. Water and energy footprint of irrigated agriculture in the Mediterranean region. Environ. Res. Lett. 2014, 9, 124014. [Google Scholar] [CrossRef]
  15. Jackson, T.M.; Khan, S.; Hafeez, M. A comparative analysis of water application and energy consumption at the irrigated field level. Agric. Water Manag. 2010, 97, 1477–1485. [Google Scholar] [CrossRef]
  16. Jiménez Beltrán, D. New Trends in Wastewater Treatment and Use. City and Territory Territorial Studies (CyTET) (In Spanish). 1981. Available online: https://recyt.fecyt.es/index.php/CyTET/article/view/81581 (accessed on 12 July 2020).
  17. Grigoriev, A.; Sinyak, Y.E.; Samsonov, N.; Bobe, L.; Protasov, N.; Andreychuk, P. Regeneration of water at space stations. Acta Astronaut. 2011, 68, 1567–1573. [Google Scholar] [CrossRef]
  18. Nicolau, E.; Fonseca, J.J.; Rodríguez-Martínez, J.A.; Richardson, T.-M.J.; Flynn, M.; Griebenow, K.; Cabrera, C.R. Evaluation of a urea bioelectrochemical system for wastewater treatment processes. ACS Sustain. Chem. Eng. 2014, 2, 749–754. [Google Scholar] [CrossRef]
  19. Pickett, M.T.; Roberson, L.B.; Calabria, J.L.; Bullard, T.J.; Turner, G.; Yeh, D.H. Regenerative water purification for space applications: Needs, challenges, and technologies towards ‘closing the loop’. Life Sci. Space Res. 2020, 24, 64–82. [Google Scholar] [CrossRef] [PubMed]
  20. Rothausen, S.G.; Conway, D. Greenhouse-gas emissions from energy use in the water sector. Nat. Clim. Chang. 2011, 1, 210–219. [Google Scholar] [CrossRef]
  21. Schilardi, C. Design of a aphotovoltaic solar pumping system for drip irrigation in vineyards (In Spanish). In Proceedings of the II Congreso de Agua, Ambiente y Energía, Montevideo, Argentina, 25–27 September 2019. [Google Scholar]
  22. Sandoval Estrada, M.; Stolpe Lau, N.; Zagal Venegas, E.; Mardones Flores, M.; Junod Montano, J. The Carbon Sequestration in Agriculture and its Importance in Global Warming. Theoria 2003, 12, 65–71. (In Spanish) [Google Scholar]
  23. Sadegh, M.; AghaKouchak, A.; Mallakpour, I.; Huning, L.S.; Mazdiyasni, O.; Niknejad, M.; Foufoula-Georgiou, E.; Moore, F.C.; Brouwer, J.; Farid, A. Data and analysis toolbox for modeling the nexus of food, energy, and water. Sustain. Cities Soc. 2020, 61, 102281. [Google Scholar] [CrossRef]
  24. Xu, Q.; Hu, K.; Yao, Z.; Zuo, Q. Evaluation of carbon, nitrogen footprint and primary energy demand under different rice production systems. Ecol. Indic. 2020, 117, 106634. [Google Scholar] [CrossRef]
  25. Chazarra-Zapata, J.; Parras-Burgos, D.; Arteaga, C.; Ruiz-Canales, A.; Molina-Martínez, J.M. Adaptation of a Traditional Irrigation System of Micro-Plots to Smart Agri Development: A Case Study in Murcia (Spain). Agronomy 2020, 10, 1365. [Google Scholar] [CrossRef]
  26. Yan, Z.; Hou, F.; Hou, F. Energy Balances and Greenhouse Gas Emissions of Agriculture in the Shihezi Oasis of China. Atmosphere 2020, 11, 781. [Google Scholar] [CrossRef]
  27. Chazarra-Zapata, J.; Molina-Martínez, J.M.; Cruz, F.-J.P.D.L.; Parras-Burgos, D.; Ruíz Canales, A. How to Reduce the Carbon Footprint of an Irrigation Community in the South-East of Spain by Use of Solar Energy. Energies 2020, 13, 2848. [Google Scholar] [CrossRef]
  28. Cardozo, N.P.; de Oliveira Bordonal, R.; La Scala, N., Jr. Greenhouse gas emission estimate in sugarcane irrigation in Brazil: Is it possible to reduce it, and still increase crop yield? J. Clean. Prod. 2016, 112, 3988–3997. [Google Scholar] [CrossRef] [Green Version]
  29. Cheng, L.; Yue, W.; QIU, G.-Y. Water and energy consumption by agriculture in the Minqin Oasis Region. J. Integr. Agric. 2013, 12, 1330–1340. [Google Scholar] [CrossRef]
  30. Wang, J.; Rothausen, S.G.; Conway, D.; Zhang, L.; Xiong, W.; Holman, I.P.; Li, Y.J.E.R.L. China’s water–energy nexus: Greenhouse-Gas emissions from groundwater use for agriculture. Environ. Res. Lett. 2012, 7, 14035. [Google Scholar] [CrossRef]
  31. Khoshnevisan, B.; Rafiee, S.; Omid, M.; Mousazadeh, H.; Rajaeifar, M.A. Application of artificial neural networks for prediction of output energy and GHG emissions in potato production in Iran. Agric. Syst. 2014, 123, 120–127. [Google Scholar] [CrossRef]
  32. Pishgar-Komleh, S.H.; Omid, M.; Heidari, M.D. On the study of energy use and GHG (greenhouse gas) emissions in greenhouse cucumber production in Yazd province. Energy 2013, 59, 63–71. [Google Scholar] [CrossRef]
  33. Carrillo Cobo, M.; Camacho Poyato, E.; Montesinos, P.; Rodríguez Díaz, J. New model for sustainable management of pressurized irrigation networks. Application to Bembézar MD irrigation district (Spain). Sci. Total Environ. 2014, 473, 1–8. [Google Scholar] [CrossRef]
  34. Nugent, D.; Sovacool, B.K. Assessing the lifecycle greenhouse gas emissions from solar PV and wind energy: A critical meta-survey. Energy Policy 2014, 65, 229–244. [Google Scholar] [CrossRef]
  35. European Commission. Regulation of the European Parliament and of the Council Establishing the Framework for Achieving Climate Neutrality and Amending Regulation (EU) 2018/1999 (European Climate Law). Available online: https://eur-lex.europa.eu/legal-content/EN/TXT/?uri=CELEX:52020PC0080 (accessed on 2 September 2020).
  36. Zhang, D.D.; Pei, Q.; Lee, H.F.; Jim, C.Y.; Li, G.; Zhang, M.; Li, J.; Wu, Z.; Wang, L.; Yue, R.P. Climate change fostered cultural dynamics of human resilience in Europe in the past 2500 years. Sci. Total Environ. 2020, 744, 140842. [Google Scholar] [CrossRef]
  37. Šúri, M.; Huld, T.A.; Dunlop, E.D.; Ossenbrink, H.A. Potential of solar electricity generation in the European Union member states and candidate countries. Sol. Energy 2007, 81, 1295–1305. [Google Scholar] [CrossRef]
  38. Rosas-Flores, J.A.; Zenón-Olvera, E.; Morillón Gálvez, D.M. Potential energy saving in urban and rural households of Mexico with solar photovoltaic systems using geographical information system. Renew. Sustain. Energy Rev. 2019, 116, 109412. [Google Scholar] [CrossRef]
  39. Huld, T.; Müller, R.; Gambardella, A. A new solar radiation database for estimating PV performance in Europe and Africa. Sol. Energy 2012, 86, 1803–1815. [Google Scholar] [CrossRef]
  40. Arab, A.H.; Taghezouit, B.; Abdeladim, K.; Semaoui, S.; Razagui, A.; Gherbi, A.; Boulahchiche, S.; Mahammed, I.H. Maximum power output performance modeling of solar photovoltaic modules. Energy Rep. 2020, 6, 680–686. [Google Scholar] [CrossRef]
  41. Psiloglou, B.; Kambezidis, H.; Kaskaoutis, D.; Karagiannis, D.; Polo, J. Comparison between MRM simulations, CAMS and PVGIS databases with measured solar radiation components at the Methoni station, Greece. Renew. Energy 2020, 146, 1372–1391. [Google Scholar] [CrossRef]
  42. Order ARM/2656/2008, of 10 September, Approving the Hydrological Planning Instruction (B.O.E. No. 229, of September 22, 2008) (In Spanish). Available online: https://www.boe.es/eli/es/o/2008/09/10/arm2656 (accessed on 2 September 2020).
  43. Molina-Martínez, J.M.; Martínez-Álvarez, V.; Baille, A.; González-Real, M.M. Estimation of evaporation in irrigation reservoirs using an energy balance model. Ing. Agua 2006, 13, 219–230. (In Spanish) [Google Scholar] [CrossRef]
  44. Del Rio, M.S.; del Amor Saavedra, M.Á. Adaptation Project of Sector I “Huerta Alta” of the Pliego Irrigation Community T.M. of Pliego (Murcia). Annex No. 6 Agronomic Report (In Spanish); Government of the Region of Murcia: Murcia, Spain, 2017.
  45. Carvajal, M.; Mota, C.; Alcaraz-López, C.; Iglesias, M.; Martínez-Ballesta, M. Research on CO2 Absorption by the Most Representative Crops; Department, V.N., Ed.; CEBAS-Consejo Superior de Investigaciones Científicas (CSIC): Murcia, Spain, 2014. (In Spanish) [Google Scholar]
  46. Zermeño-González, A.; Villatoro-Moteno, S.; Cortés-Bracho, J.J.; Cadena-Zapata, M.; Catalán-Valencia, E.A.; García-Delgado, M.Á.; Munguía-López, J.P. Estimation of the net CO2 exchange in a sugar cane crop during the staffing cycle. Agrociencia 2012, 46, 579–591. (In Spanish) [Google Scholar]
  47. Visconti, F.; De-Paz, J.M. Estimation of the potential CO2 sequestration and emission capacity of the agricultural soils of the Valencian Community. Ecosistemas 2017, 26, 91–100. [Google Scholar] [CrossRef] [Green Version]
  48. Wang, Z.-B.; Zhang, H.-L.; Lu, X.-H.; Wang, M.; Chu, Q.-Q.; Wen, X.-Y.; Chen, F. Lowering carbon footprint of winter wheat by improving management practices in North China Plain. J. Clean. Prod. 2016, 112, 149–157. [Google Scholar] [CrossRef]
  49. Qureshi, A.S. Reducing carbon emissions through improved irrigation management: A case study from Pakistan. Irrig. Drain. 2014, 63, 132–138. [Google Scholar] [CrossRef]
  50. Macías-Vázquez, F.; Rodríguez-Lado, L. First Approximation to the Calculation of Carbon Sinks in Forestry and Soil Systems in Galicia, According to the Kyoto Protocol; Publications Service of the University of Santiago de Compostela: Santiago de Compostela, Spain, 2003. [Google Scholar]
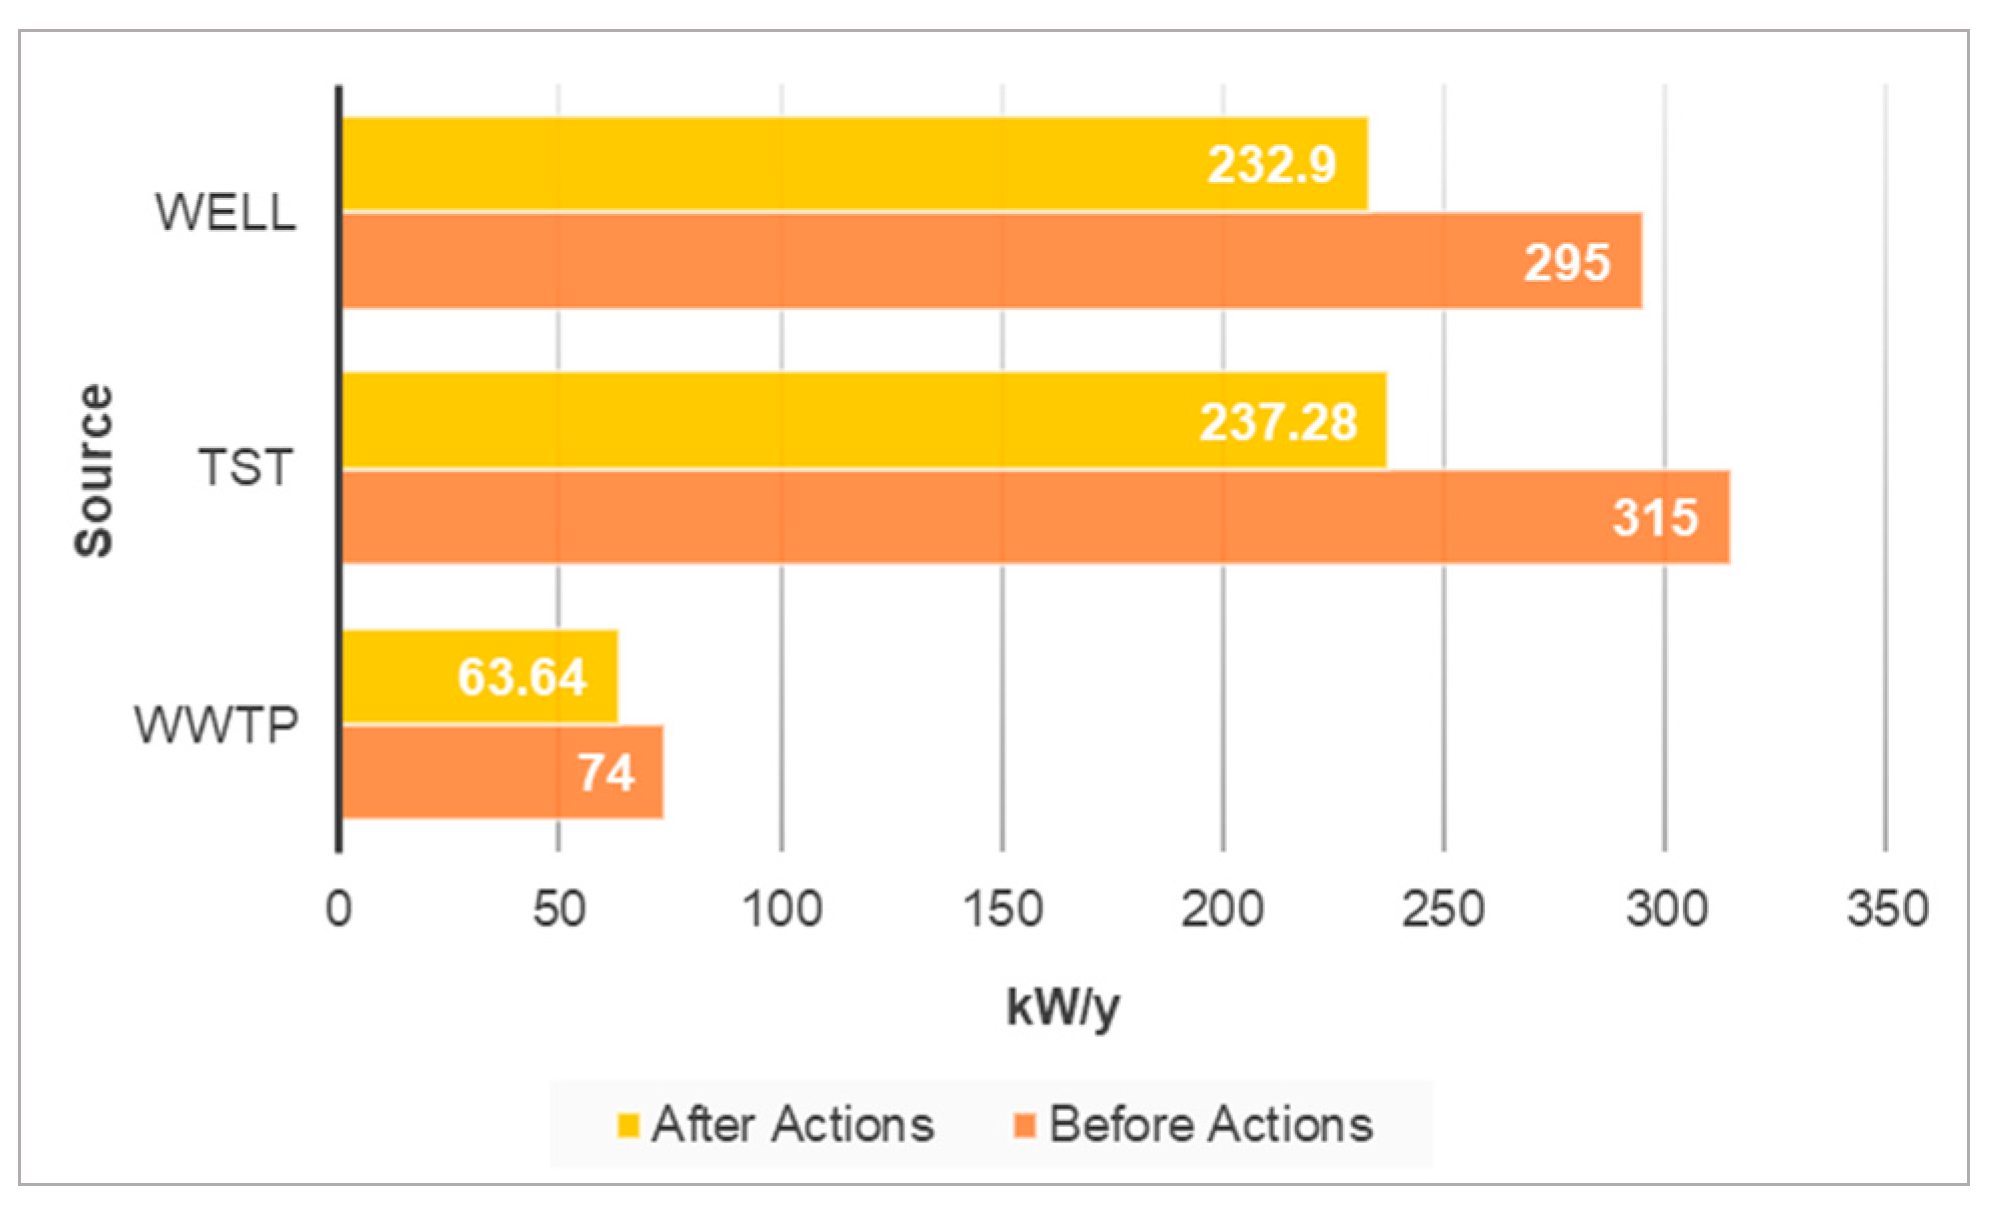
Figure 1. CO2 eq analysis production in a Water-Energy system. Source: Own elaboration.
Water 12 03187 g001
Figure 2. Monthly water purchased, according to the water supply source. Source: Own elaboration.
Water 12 03187 g002
Figure 3. Evolution of the transformation index for electric energy in Spain (kgCO2eq/kWh) 2015–2019. Source: Own elaboration, based in official CNMC data (Spain) (www.gdo.cnmc.es).
Water 12 03187 g003
Figure 4. % t CO2 eq flow rate to the atmosphere. 2016. Source: Own elaboration.
Water 12 03187 g004
Figure 5. Annual consumption by source (kW). Source: Own elaboration.
Water 12 03187 g005
Figure 6. Reservoirs and Solar installations. Source: Own.
Water 12 03187 g006
Figure 7. Balance water footprint before actions. Source: Own elaboration.
Water 12 03187 g007
Figure 8. (a) Capacitive soil sensor, (b) Weighing lysimeter, (c) Water quality analyzer, and (d) Agrometeorological station. Source: Own.
Water 12 03187 g008
Figure 9. Waterproof sheet in reservoir to reduce evaporation. Source: Own.
Water 12 03187 g009
Figure 10. CO2 eq reduction by water footprint after actions. Source: Own elaboration.
Water 12 03187 g010
Figure 11. Summary of the environmental effects generated in the WUA. Source: Own elaboration.
Water 12 03187 g011
Figure 12. Summary new future reduction t CO2eq/y after actions. Source: Own elaboration.
Water 12 03187 g012
Table 1. Pumping equipment power comparison. Source: Own elaboration.
Current PumpFuture Pump
Power (kW)Power (kW)
Well295232.9
TST315237.28
WWTP7463.64
Table 2. Summary of the calculation of the solar photovoltaic installations. Source: Own elaboration.
Photovoltaic InstallationProjected Power (kW)Annual Generated Energy (kWh)Units of 250 Wp, c/u
Pumping Well232.9543,2001400
Pumping TST237.3360,9711400
Pumping WWTP63.64108,640280,000
Table 3. Efficiency of water use according to the type of Irrigation System. Source: Ministry of the Environment, and Rural and Marine Affairs (Spain).
Type of Irrigation System Value% of Efficiency
Irrigation by surface with total coverage (blanket), with good management60
Irrigation by surface with partial coverage (by furrows), with good management60–90
Irrigation by sprinkling, with good management80
Irrigation by dripping on the surface, with good management90
Irrigation by underground drip, with good management95
Table 4. Summary of potential water evaporation. Source: Own elaboration.
By Evaporation Reduction
Surface (m2)Volume (m3)Manometric Eight (m.c.a.)Before Actions (WeBA)After Actions (WeAA)
Annual Evaporation m3
(0.5 m3/m2)
SourceAnnual Evaporation m3SourceActions
Raft 1 “Cota” San Quintin Well753445,0004403767Well75Well, TST, WWTP
Raft 2 Anguilas Cherro 1766724,0004153834Well, TST- Solar sector 1
Raft 3 Anguilas Cherro 2673126,4004103366Well, TST- Solar Well
Raft 4 Regulation Huerta Baja30,878237,67541115,439Well, TST309Well, TST, WWTP
Raft 5 Regulation Huerta Alta45,929317,380413.5522,965Well, TST22,965Well, TST, WWTP
Raft 6 La Esperanza576112,000424- - Eliminated
Raft 7 WWTP Pliego828539,4643724143WWTP4143Well, TST
Total Potential Water Evaporation53,51427,492
Table 5. Summary of water footprint reduction after actions. Source: Own elaboration.
Origin of the ConsumptionWater Footprint Reduction after Actions (m3)
Direct consumptionBy governance & ITC420,996.84
Indirect consumptionBy evaporation26,022.00
By hydraulic actions283,995.57
Total731,014.41 m3
Table 6. Summary of the footprint of CO2 eq sequestration by crops. Source: Based on [44,45,46,47].
CultivationSurface
(%)
Surface Area
(ha) [44]
Annual Estimate Sequestrated kgCO2eq/haAnnual Estimate of Emissions kgCO2eq/haCaptured tCO2eq/yEmission tCO2eq/ySequestrated
tCO2 eq
Plant [45]Field [47]Plant [46]Field [47]
Citric trees25199.90 1696
Lemon19151.9316,040590481252025278101717
Orange half session215.999869565296151516756111
Orange total session431.986220565186651521776141
Fruit trees71567.73- 4940
Apricot tree16127.94845082525357401187419768
Peach tree37295.8614,4638354339740452615033023
Almond tree18143.9311,356475340744517035541149
Vegetables431.98- 98
Lettuces and similar431.98422583012687351626498
Total100799.61 7007
Table 7. Review of published values for emissions per m3 of irrigation water.
AuthorsCountrySource Energy SupplyIrrigation TypeWater SourceGHG Emissions
[49]PakistánElectricity-Diesel Underground0.732 kgCO2eq/L
0.062 kgCO2eq/kWh
[33]SpainElectricityLocatedSurface0.166 kgCO2eq/kWh
[48]ChinaElectricity Underground0.341 kgCO2eq/kWh
Publisher’s Note: MDPI stays neutral with regard to jurisdictional claims in published maps and institutional affiliations.

