Abstract
Tile drainage waters carry considerable loads of phosphorus (P) from agricultural fields to rivers and streams in the Midwestern U.S. An innovative and economical approach to monitor dissolved reactive P (DRP) flux in tile waters is needed to understand the extent of P loss in field-scale. In this study, a passive sampling technique was developed using iron oxide-coated polyacrylic/polystyrene anion exchange resins (hybrid resins) a P sink. Laboratory batch adsorption isotherm and kinetic experiments indicated that the hybrid resins had high P adsorption capacity (7.69–19.84 mg/g) and high kinetic performance. The passive sampling method with field-calibrated hybrid polyacrylic resin and hybrid polystyrene resins (sampling rate: 0.1351 and 0.0763 L/h, respectively) predicted the average DRP concentrations of 0.006–0.020 mg/L, which did not differ significantly (p > 0.05) from the auto-sampling data. A rapid increase in DRP concentration during storm events and subsequent flooding events was also predicted well. In conclusion, a passive detection method using iron oxide coated hybrid resins can be recommended for monitoring seasonally fluctuating DRP flux in agricultural waters as long as the hybrid resins are well-calibrated under specific field conditions (e.g., flow rate and concentration range).
1. Introduction
Phosphorus (P) loss from agricultural fields has long been an environmental issue due to its negative impacts on aquatic ecosystems such as eutrophication and hypoxia [1,2]. Compared to nitrogen, little P is typically lost from fields from surface runoff [3]. However, larger amounts of P can be lost during major erosion events and through subsurface tile drains. In fact, recently dissolved reactive P (DRP) losses at high concentrations have been reported through tile drainage in the Lake Erie watersheds of northwestern Ohio [4]. Concentrations of DRP can range from <0.005 mg/L to many tenths of a mg L−1 in tile lines, and can be many mg L−1 in surface runoff [4]. These concentrations and loads of DRP are more than enough to lead to eutrophication in downstream water bodies. To better understand and control P loss from agricultural watersheds, extensive monitoring is required to identify the major pathways of P loss in each field. However, due to the high cost of flow monitoring equipment and intensive sample analysis, it is not feasible to comprehensively assess P loads in agricultural drainage ditches and tile lines throughout the Midwestern United States [5] because of the cost. Therefore, it is ideal to develop a quick, easy, and inexpensive technique that could be used to monitor the P concentrations in agricultural waters during critical wet seasons when a large quantity of P is discharged from agricultural fields.
Several methods have been suggested to monitor the concentration of contaminants and nutrients in waters. The most common one is grab sampling, which obtains time-discrete records of the concentration of target substances [5,6,7]. The precision and accuracy of grab sampling rely heavily on the sampling frequency, which is limited by manual labor especially for its application in long-term and large-scale monitoring [8,9]. The minimum detectable concentration is also limited by the volume of water sampled at each time. Another disadvantage is that the discrete (i.e., snapshot) measurement may miss specific discharge events that happen during extreme rainfall [10,11]. Paper-based devices for in-site determination have also been suggested and are convenient and cost-efficient, but the detection limit is relatively high and the accuracy is also affected by temporal variation of the contaminant concentrations [12,13]. Transport of DRP in agricultural drainage water has generally been reported to be at low concentration; however, concentration quickly increases with tile flow immediately following heavy precipitation events [6,14,15]. Thus, the above monitoring methods are not ideal for the evaluation of P loss from agricultural fields. Passive sampling techniques offer a promising alternative for this purpose
Passive sampling is based on the accumulation of target substances in adsorbents that are deployed on-site. A time-weighted average concentration can be calculated according to the amount of the target substances on adsorbents after a certain period of deployment, which can be several days to months [11]. As a time-integrated monitoring method, passive sampling is ideal for the detection of contaminants or nutrients that are in low concentration and with discrete discharge [9,10,11,16]. Use of passive samplers for the monitoring of aquatic contaminants started in the 1980s [10]. As of today, it has been extensively utilized for the detection of organic pollutants and metals using several commercially available samplers [17,18,19,20]. However, its application for the monitoring of nutrients in agricultural waters has not been extensively tested.
To design a successful passive sampler, choosing a proper adsorbent is one of the most important steps. The uptake of target compounds by the sorbent material should be kinetically fast and have a large sorption capacity, and it would be preferable if the sorption is compound-specific [9,10,11]. The material should also allow the free passage of pore water and enable the recovery of the sorbed substances [21]. For the monitoring of DRP in agricultural waters using the passive sampling method, iron (oxyhydr)oxide coated anion exchange resin is an ideal adsorbent [22,23,24] since iron (oxyhydr)oxides can selectively and rapidly adsorb phosphate via inner-sphere complexation [25,26,27]. The objective of this study was to evaluate the passive sampling method using hybrid anion exchange resin bags to monitor the DRP loss in agricultural tile drainage water. Specifically, this study was aimed to evaluate: (1) P adsorption capacity of hybrid anion exchange resins in laboratory experiments, (2) its performance as a P sink in passive detection technique in field experiments, and (3) the prediction of DRP in the passive detection technology.
2. Materials and Methods
2.1. Materials
Two kinds of hybrid resins were selected in this study. A commercially available product—FerrIX™A33E (Purolite, King of Prussia, PA, USA), which is an iron-loaded strong-base polystyrene-DVB hybrid resin, was chosen. Hereafter it is referred to as HR1. The second hybrid resin, designated HR2, was synthesized via coprecipitation of iron oxides with weak-base polyacrylic resin, IRA67 (DuPont company, Wilmington, DE, USA).
The preparation of HR2 was accomplished following two steps: (1) loading of ferric ions and (2) precipitation and transformation of iron (oxyhydr)oxide. Approximately 20 g of IRA67 resin and 250 mL of 1 M HNO3 were placed in a 500 mL polypropylene bottle. The mixture was shaken on an orbital shaker at 75 rpm for 1 h. After sedimentation for a few hours, the acidic solution was decanted, and the resin was rinsed with ultrapure water. The acid washed resins were then mixed with 100 mL of 0.5 M Fe(NO3)3 and the mixture was shaken on an orbital shaker at 75 rpm for 1 h. The mixture was titrated with 90 mL of 5 M NaOH, and its volume was adjusted to 500 mL. The bottles were shaken at 75 rpm for 3 h. Finally, the mixtures were placed in a convection oven at 70 °C for 60 h. After the incubation, the hybrid resin was rinsed twice with ultrapure water. To exchange the hydroxide ion on the hybrid resin surface, resins were treated with 250 mL of 0.5 M NaHCO3 for 2 h, and then shaken with 250 mL of 0.5 M NaCl for 2 h. After the final washing the resins with ultra-pure water, the hybrid resin was air-dried and stored for future use. This step helps to buffer the resin suspension at near neutral pH.
All reagents were prepared using ultrapure water (18.2 MΩ-cm), and ACS grade chemicals were used unless otherwise mentioned in text. All experiments were conducted at 21 ± 0.8 °C.
2.2. Characterization of the Hybrid Resins
The total Fe content and the mineralogical information of the iron loaded on hybrid resins were studied. The total iron content of the hybrid resins was determined after acid digestion. To dissolve iron in the hybrid resin, approximately 0.1 g of the hybrid resin was transferred into a 125 mL screw-capped polypropylene bottle that was filled with 100 mL of 5% hydroxylamine and 5 M HCl [28,29]. The mixture was shaken in ultrasonic bath (Bransoic, CPX2800) for 5 min and then shaken at an orbital shaker at 80 rpm for 48 h, and the following filtration through Whatman No.2 filter paper the total iron concentration in the filtrate was measured in triplicate by a spectrophotometric method using 1, 10-phenanthroline [30].
The mineralogy was assessed using Fe K-edge X-ray absorption spectroscopy (XAS) at ID12 at Advanced Photon Source, Argonne, IL, USA. A monochromator consisting of a double-crystal Si (220) was used. An incident beam of X-ray energy was calibrated using a Fe foil at the first inflection point (7112 eV) and detuned 50% at 7770 eV. The beam size used was 2 mm in width × 1 mm in height. The calibration energy was monitored using a Fe foil during the scan. The transmission measurements were performed in air at room temperature. Spectra were recorded with three regions: 10 eV steps from 6880 to 7090 eV with 1 s. dwell, 0.25 eV steps over the pre-edge from 7090 to 7140 eV with 1 s. dwell, and 0.25 eV steps from k of 1.62 to 14 Å−1 with 1 s. dwell. Three spectra were recorded. Acquiring multiple spectra across time allows us quantitative evaluation of reproducibility. Reference spectra of synthetic pure ferrihydrite, goethite, hematite, and lepidocrocite were also collected. These minerals were synthesized according to the methods described by Schwertmann and Cornell (Schwertmann and Cornell, 1991). Spectra were normalized with standard features of the ATHENA software package [31], and linear combination of XAS reference spectra fit analysis was conducted.
The total surface area of the hybrid resins was measured using the ethylene glycol monoethyl ether (EGME) method [32]. Approximately 0.5 g of oven-dried resins was placed in petri dishes and then in a vacuum desiccator with another petri dished filled with 10 mL EGME. The desiccator was connected to laboratory vacuum and evacuated for 10 min. The samples were then left in the desiccator overnight before re-weighing. The evacuation-stabilization-weighting cycle was repeated until the weights were constant.
2.3. Phosphorus Adsorption Isotherm in the Hybrid Resins
To characterize the maximum P adsorption capacity of the hybrid resins, P adsorption isotherm experiments were conducted. The results were used to design the field deployment experiments so that each resin bag does not exceed the maximum adsorption capacity of the resin.
A 100 mg/L phosphate stock solution was prepared in 10 mM NaCl, and then the stock solution was diluted to 3, 10, 20, 30, 40, and 50 mg/L for the isotherm experiment. Approximately 0.1 g of resin samples were added in a 50 mL Nalgene high speed centrifuge tube. A 30 mL phosphate solution was added and mixed with the resin on an end-over shaker at 30 rpm for 24 h. The experiments were conducted in duplicate. After 24 h, the suspensions were sampled and filtered through a 0.45 µm polyvinylidene difluoride (PVDF) filter. Aliquots were analyzed for phosphate concentration colorimetrically [33]. The solution pH was kept at 7.5 using 0.01–0.1 M HCl or NaOH.
Adsorption isotherm data were fitted to the Freundlich and Langmuir models.
For the Freundlich model
where q is the amount of phosphate adsorbed (mg P/g); C is the final equilibrium concentration of phosphate (mg P/L); Kf is a parameter related to the adsorption capacity; and n is a parameter related to the intensity of adsorption.
For the Langmuir model
where q is the amount of P adsorbed (mg P/g); C is the final equilibrium concentration of phosphate (mg P/L); Qm represents the maximum adsorption capacity (mg P/g); and Km is a parameter related to the bonding strength (L/mg).
2.4. Phopshate Adsorption Kinetics in Hybrid Resins
Phosphate adsorption kinetics were studied in the hybrid resins. 10 mg/L of a P stock solution was prepared in 0.01 M NaCl solution. The solution pH was adjusted to 7.5 using 0.01–0.1 M HNO3 or NaOH with buffering from the use of 10 mM 3-(N-morpholino) propanesulfonic acid (MOPS) organic buffer.
Approximately 0.1 g of the hybrid resins was added to 30 mL of phosphate solution in centrifuge tubes. It was mixed on an orbital shaker at 80 rpm. After different sampling periods (3 min, 10 min, 30 min, 1 h, 4 h, 8 h, 16 h, and 24 h), the supernatant was passed through a 0.45 µm PVDF filter. The phosphate concentrations in the samples were determined colorimetrically [33].
The data from kinetic experiments were fitted using a pseudo-first order model [34] and a pseudo-second order model [35].
For the pseudo-first order model
where is the amount of phosphate adsorbed per unit weight of adsorbent (mg P g−1) at time t (h), is the adsorption capacity of adsorbents (mg P/g) at equilibrium, (g/mg/h) is the first order rate constant, and the terms, and , were calculated by linear regression of vs. .
For the pseudo-second order model
where is the amount of phosphate adsorbed per unit weight of adsorbent (mg P/g) at time t (h), is the adsorption capacity of the adsorbents (mg P/g) at equilibrium, and (g/mg/h) is the second order rate constant. The terms, and , were calculated by linear regression of plotting vs. , where the slope and intercept correspond to and , respectively.
2.5. Field Deployment of Hybrid Resin Bags
To deploy the hybrid resins in tile drainage water, the flow-through bag method was used to enclose the resin beads [9]. To be specific, ~1 g of resin beads were enclosed in a polyester monofilament mesh bag (5 cm diameter × 5 cm height, 150 µm mesh size) (Universal Filters, Inc. Asbury Park, NJ, USA).
The study site is located in Douglas County in east-central Illinois (Figure 1) where a replicated tile drainage study based on timing of fertilizer N application was being conducted [36]. The field is under no-till and strip-till practices and has been used to grow corn and soybeans in simple rotation. To demonstrate there were no statistically significant responses resulting from the N treatment or crop phase on DRP concentration, DRP loads, or tile discharge, an analysis of variance was performed using linear mixed models with N treatment as the fixed effect and block as the random effect (data not shown). Tile lines #4, #7 and #46 were selected for monitoring P loss. The three tiles drain 1.95, 1.86 and 1.63 hectares, respectively. To facilitate the drainage of soils for crop growth, the construction of drainage ditches and tile pipes started from 1878 [37]. The sites received diammonium phosphate (18-46-0) at the rate of 22.4 g/m2 every other year following soybean until 2016; however, no P fertilizer was applied from 2017 through 2020. Anhydrous ammonia was applied to corn at the rate of 20.2 g/m2 in spring 2020.
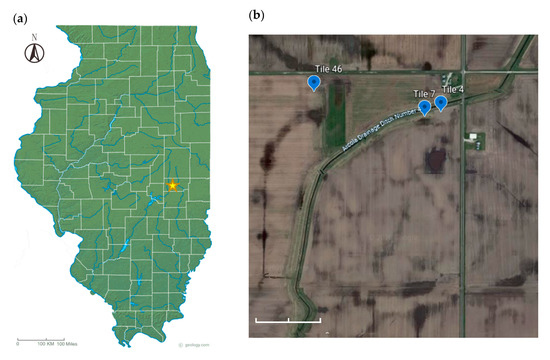
Figure 1.
(a) Location of the study site in Douglas county, Illinois. Cited from https://geology.com/topographic-physical-map/illinois.shtml. (b) A satellite image of the DRP monitoring site (39°43′27.5″ N 88°13′56.8″ W) obtained from Google Earth.
From 12 March to 23 April in 2020, mesh bags with FerrIX™A33E (HR1) and Hybrid IRA67(HR2) were deployed in duplicate for each tile line. The resin mesh bags were retrieved and replaced with new ones every 3 to 4 days. The collected hybrid resins were gently rinsed in ultrapure water and oven-dried at 40 °C.
2.6. Monitoring Flow Rate, Temperature, and DRP Concentration of Tile Water
Each tile was fitted with an inline water level control structure containing a stoplog with a 45° V-notch weir (Agri Drain Corporation., Adair, IA, USA). Water depth and temperature were recorded every 15 min using a Water Level Datalogger Model 3001 (Solinst, Georgetown, ON, Canada). Flow rates were determined using a discharge equation for inline water level control structures described by Chun and Cooke [38]. Approximately 50 mm of rain on 19–20 April caused flooding in the receiving agricultural ditch which submerged all tiles and elevated water height by more than 1 m in each water level control structure. To be conservative, flow rate was adjusted to 0 L/s immediately following water heights that generate the maximum tile flow for each tile (approximately 2.5 L/s). When the water level in each water control structures began to decline, flow was assumed to resume until the height returned to the maximum discharge rate.
Water samples from the three tiles were collected every 3 to 5 days using ISCO 3700 automatic water samplers (Teledyne, Lincoln, NE, USA). Samples were passed through a 0.45 µm PVDF filters, and the filtrates were analyzed for DRP using a colorimetric method [33].
2.7. Recovery of Passive-Sampled P from Tile Drainage Water and Its Evaluation
Adsorbed P from recovered hybrid resins was extracted in a 0.5 M NaOH and 0.5 M Na2SO4 solution. Recovered resins were briefly rinsed in ultrapure water to remove entrained tile water, and air-dried for 2 days. Approximately 0.5 g dry hybrid resins were added into 20 mL of the extractant. The tubes were shaken on an end-over shaker at 30 rpm for 16 h. This extraciton procedure was tested and found to provide ~100% P recovery from the hybrid resins. Aliquots were passed through 0.45 µm PVDF filters and the P concentration in the filtrate was colorimetrically determined [33]. The concentration of P retained in each mesh bag was converted to the time-weighted average concentration of P at the sampling site according to the field calibration coefficient described below.
To evaluate the passive detection method, the average DRP concentration calculated from the passive-sampled P in the hybrid resins was compared with the DRP concentrations of water samples from the Agridrain system.
2.8. Calibration of the Passive Sampling Device
To estimate the DRP concentration in tile water from the extracted P values in the field-deployed hybrid resins, the amount of P adsorbed should be linearly correlated with the amount of P exposed to the hybrid resins, which is determined by the P concentration in water and the adsorption period. Calibration experiments were conducted to verify this linear relationship and to obtain the conversion coefficient (i.e., sampling rate) of the passive sampling device (i.e., mesh bags with hybrid resins).
In the laboratory, a flow-through device was used to simulate the adsorption of DRP by hybrid resins in tile water [39]. A 2 mg/L P stock solution was prepared in 0.01 M NaCl. Approximately 2.0 g of resins were put into the reaction chamber of the calibration apparatus. A peristaltic pump was used to pump the phosphate solution flowing through the reaction chamber at 9 mL/min. After a different running time (1, 2, 4, 6, and 8 h), the resins were transferred to a 50 mL centrifugation tube for P recovery. A 20 mL extraction solution (0.5 M NaOH and 0.5 M Na2SO4) was added to the tube and shaken at an end-over shaker at 30 rpm for 16 h. The suspension was then passed through a 0.45 µm PVDF filter, and P concentration in the samples was determined colorimetrically [33]. Since the P concentration exposed to the hybrid resins were constant at 2 mg/L, the amount of P adsorbed should be linearly related to the adsorption time; and the sampling rate was calculated accordingly.
Because the peristaltic pump used could not provide a flow rate higher than 9 mL/min, the extrapolation of DRP concentration using the sampling rate obtained from the laboratory calibration experiment may be affected by the actual flow rates in tiles which can be greater than 9 mL/min. Therefore, another calibration experiment was conducted based on the field condition. To be specific, a sampling period with a stable flow rate at several liters/min and DRP concentrations of ~0.001–0.01 mg/L as determined from the monitoring data of the Agridrain auto-sampling system. The DRP concentrations of the three tiles water during the period were assumed to be constant at the auto-monitored values. Since the sampling time was the same for the three tile lines, the amount of P adsorbed should be linearly related to their DRP concentrations. The sampling rate was calculated accordingly and applied in the extrapolation of DRP concentration to other sampling periods.
2.9. Stability of the Iron Coating of Hybrid Resins
To verify that the field-deployed hybrid resins would not release iron into the drainage water, the stability of Fe coatings of the hybrid resin was tested. A mesh bag containing ~1 g of the hybrid resin was added into triplicate 125-mL polypropylene bottles containing 100 mL of 10 mM NaCl solution at pH 7. This experiment was done in triplicate. The bottles were shaken on an orbital shaker at 80 rpm. After 7 days, the hybrid resins were removed from the mesh bag and were air-dried. Approximately 0.1 g of the hybrid resin was placed in a clean polypropylene bottle to react with 100 mL of extractant solution containing 5% hydroxylamine and 5 M HCl [28,29]. The bottle was placed in an ultrasonic bath (Bransoic, CPX2800) for 5 min and then shaken on an orbital shaker at 80 rpm for 48 h. The mixture was filtered with Whatman No. 2 filter papers to screen the pure resin beads, and the total Fe concentration in the filtrate was measured using the spectrophotometric method using 1, 10-phenanthroline (Sigma-Aldrich, St. Louis, MO, USA) [30]. The total Fe concentration in these hybrid resins was compared with that of the material before the desorption experiments.
2.10. Statistical Analysis
2.10.1. Calculation of the Sampling Rate
In the calibration experiment, the amount of P accumulated in the hybrid resin per unit time should be linearly correlated with the P concentration in the solution:
where is the amount of P adsorbed during the time () in the phosphate solution with constant concentration (). Since the three parameters were either set constant or could be measured in the calibration experiment, the coefficient of the hybrid resins was obtained as the slope by plotting [16,40].
2.10.2. Average DRP Concentration in Monitored Tile Drainage Water
The average concentrations of DRP in monitored tile drainage water were obtained from the field deployment experiments and the record from the autosamplers. From the field deployment of hybrid resin, the average concentration could be estimated using the equation
where is the amount of P adsorbed during the deployment time () and is the sampling rate from the calibration experiment.
Based on the DRP concentration of each sampling period, the time-weighted and flow-weighted average concentrations of DRP were calculated respectively [5] as:
where is from the time-weighted average concentrations of DRP; is the DRP concentration and is the duration of sampling period. is the flow-weighted average concentration of DRP; is the daily discharge at the day and is the total discharge.
2.10.3. The Load of Phosphorus Loss in Tile Lines
The load of P loss from a tile line in a certain time was estimated using the equation:
where is the load of P loss; n is the number of the sampling period; and and are the DRP concentration and the water flow volume of each deployment period for sampling time, t [6].
The Student’s t-test analysis was conducted using IBM SPSS statistics for Windows, v.26 (IBM Corp., Armonk, NY, USA). The significance level was set at 0.05.
3. Results and Discussion
3.1. Material Characterization
The physicochemical properties of the hybrid resins are summarized in Table 1. HR1 is an iron oxide coated strong-base polystyrene-DVB resin with total iron content of ~196 mg/g. HR2 is an iron oxide coated weak-base polyacrylic resin with total iron content of ~13.4 mg/g. The two hybrid resins have similar mean particle size, but total surface area of HR1 (~810 m2/g) was much lower than that of HR2 (~3515 m2/g). The LC fitting of XAS spectra analysis showed that mineralogy in the two hybrid resins was predominantly goethite (Figure 2). In the stability test of the iron oxide coating of the hybrid resins, total iron content was not significantly affected by shaking in a 10 mM NaCl solution for 7 days, suggesting that the goethite coating on the resin surface is stable during deployment (Table 1).

Table 1.
Physical and chemical properties of hybrid anion exchange resins used in this study.
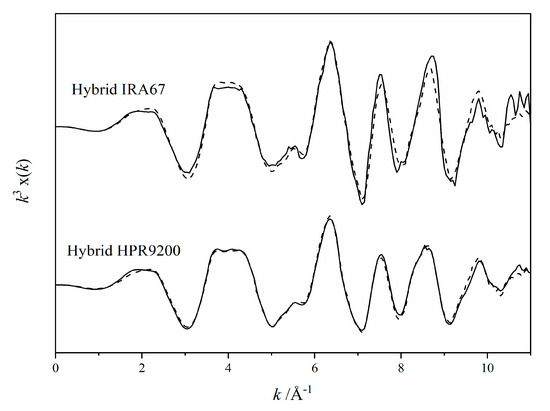
Figure 2.
Results of linear combination fitting of X-ray absorption spectroscopy (XAS) spectra of reference compounds on the spectra of hybrid HPR9200 (HR1) and hybrid IRA67 (HR2). Black solid line and dashed line represent the normalized k3 weighted XAS spectra and fit, respectively. HR1 is 100% goethite (R-factor: 0.01) and HR2 is 82 ± 4% goethite and 18 ± 2% hematite (R-factor: 0.06).
Iron oxide coated resins have been widely studied for the removal of anionic pollutants from wastewaters [41,42,43]. The iron (oxyhydr)oxides in these hybrid resins were amorphous and nano-sized, which make them highly reactive [44,45,46,47]. Goethite is a crystalline iron (oxyhydr)oxide and more stable than amorphous phases, which is important for the purpose of passive detection. The P adsorption capacity of goethite is less than that of amorphous iron hydroxides [48,49], but it is acceptable as long as it does not exceed the maximum P adsorption capacity during the resin bag deployment periods. To evaluate P adsorption capacity of the hybrid resins, batch isotherm experiments were conducted.
3.2. Batch P Adsorption in the Hybrid Resins
3.2.1. Phosphate Adsorption Isotherm in the Hybrid Resins
The P adsorption isotherms for the hybrid resins are shown in Figure 3a. The HR2 adsorbed more phosphate than HR1 at each initial P concentration. The isotherm curves were fitted well (R2 > 0.98) to both the Freundlich (Figure 3b) and the Langmuir (Figure 3c) models. The P adsorption capacity of HR1 calculated from the Langmuir model was 7.69 mg/g, while that of HR2 was 19.84 mg/g for HR2 (Table 2).
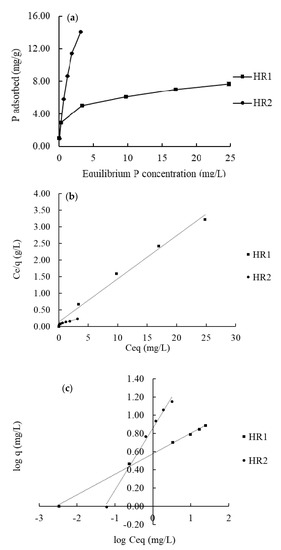
Figure 3.
(a) Phosphate adsorption isotherm at pH 7.5 in FerrIX™A33E (HR1), and Hybrid IRA67 (HR2). (b,c) Show the linear fitting of the isotherm data in Langmuir model and Freundlich model, respectively.
Table 2.
Parameters of isotherm models in phosphate adsorption by hybrid resins. Qm and Km represent the maximum adsorption (mg/g) and a parameter related to the bonding strength (L/mg) in the Langmuir model, respectively. Kf and n are a parameter related to the adsorption capacity and a parameter related to the intensity of adsorption in the Freundlich model, respectively.
The higher P adsorption capacity of HR2 could be due to the functional group property of the polyacrylic resin matrix. Since acrylic ester groups are polar and hydrophilic, polyacrylic resins are more reactive to water-soluble compounds like phosphate than polystyrene-DVB resins [50,51,52]. The higher total surface area of HR2 (Table 1) also indicates that it has more reactive sites for phosphate.
3.2.2. Phosphate Adsorption Kinetics in the Hybrid Resins
To further understand P adsorption in the hybrid resins, P adsorption kinetic experiments were conducted. The P adsorption process was found to be biphasic (Figure 4a) which suggested that the P adsorption in the hybrid resins was very quick and not limited by diffusion processes. Similar results were reported by several researchers. Ding et al. [53] conducted P adsorption experiments with an iron oxide-coated polyacrylic resin. They reported a sharp increase of P adsorption in the first 10 min and then slightly increased after 30 min, which was similar to the kinetic data in this study.
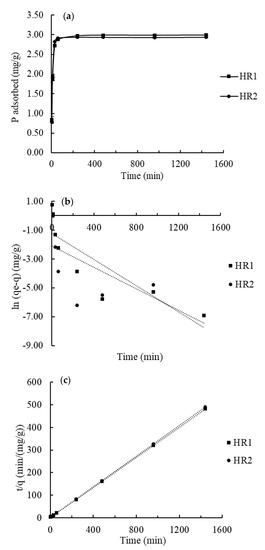
Figure 4.
(a) Phosphate adsorption kinetics in the hybrid resins. (b,c) Show the linear fitting in the Pseudo-first-order model and the Pseudo-second-order model, respectively.
To compare the adsorption kinetics in two hybrid resins, the data were fitted with the pseudo-first-order model [34] and the pseudo-second-order model [35] (Figure 4b,c). The parameters of these kinetic models in linear fitting plots (Figure 4b,c) are summarized in Table 3. The pseudo-first-order model is the most widely used rate equation for the sorption of a solute from a liquid solution [54]. The model describes non-reversible sorption processes governed by the first-order rate equation while the pseudo-second-order model describes sorption processes governed by the second-order rate equation. The pseudo-first-order model did not fit well to describe the adsorption process (R2 = 0.726 for HR1 and R2 = 0.487 for HR2) (Table 3). However, the pseudo-second-order model described the kinetic data well (R2 > 0.999 for both two hybrid resins). The second-order rate constant of the P adsorption in HR1 was 0.080 g/(mg min), which was slightly lower than that of HR2. In addition, the initial sorption rate, [55] was calculated for both hybrid resins. The of P adsorption in HR1 was also lower than that of HR2. Sendrowski and Boyer [22] also reported a rapid initial P adsorption and the best fitting of the pseudo-second-order kinetic model in the study of phosphate removal from urine using a hybrid anion exchange resin.
Table 3.
Parameters of kinetic equations to model the P adsorption kinetic data in hybrid resins. is the adsorption capacity of adsorbents (mg/g) at equilibrium. (g/mg/hr) is the first order rate constant. (g/mg/hr) is the second order rate constant.
Overall, hybrid anion exchange resin is highly reactive for dissolved P. This property makes them ideal adsorbents for the passive detection method.
3.3. Field Test of Passive Sampling of P in Tile Drainage Water Using Hybrid Resins
3.3.1. Recovery of Passive-Sampled P in the Hybrid Resins
Two different hybrid resins in mesh bags were deployed in three tile lines from 12 March to 22 April 2020. The bags were sample every 3–4 days. A total of 144 hybrid resin samples were collected. The adsorbed P in these hybrid resins were extracted and the results are shown in Figure 5.
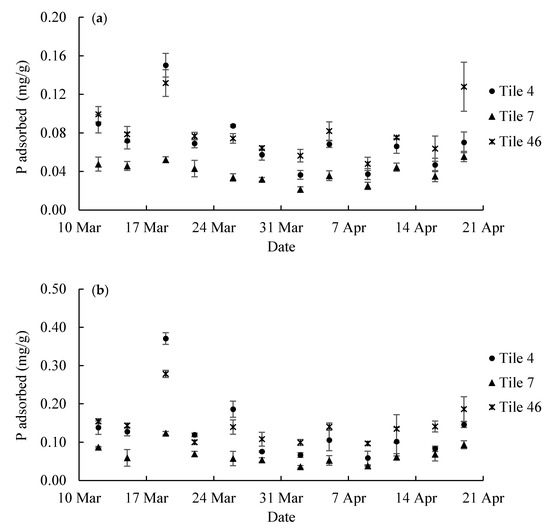
Figure 5.
Phosphate adsorption in the hybrid resin (a) HR1 and (b) HR2 from the three tile lines in each sampling period in 2020.
Comparing TP recovered in the hybrid resins from the three tiles, the recovery of P was lowest in Tile 7. Statistical analysis showed that hybrid resins collected from both Tiles 4 and 46 had a significantly higher TP content than that of Tile 7 (Table 4, p < 0.05). However, the amount of P adsorbed from Tiles 4 and 46 did not significantly differ (p = 0.073 for HR1 and p = 0.356 for HR2).
Table 4.
Results of paired t-test for comparing the P content (mg/kg) in the hybrid resins deployed in three tile lines. The data are shown in Figure 5.
Comparing Figure 5a,b, the recovery of TP in HR1 and HR2 is similar although the amount of extracted P fluctuated among different sampling periods. Total P in HR1 and HR2 remained at ~0.04–0.08 mg/g and 0.05–0.15 mg/g, respectively (Figure 5a,b). The highest peaks (i.e., ~0.16 mg/g for HR1 and ~0.37 mg/g for HR2) are observed on 19 March. The highest recovery of TP in both resins coincides with a storm event (Figure 6a) that occurred on 19 March with rainfall depth equal to 33.3 mm. A relatively small peak was identified on 26 March that also coincides with a rainfall event (Figure 6a). The gradual rising trend in the last few sampling periods was also observed in both resins (Figure 5). However, HR1 recovered less P than HR2 for each tile during the same sampling period (p < 0.05) (Table 5). A greater TP in the HR2 is explained by the results in the P isotherm and kinetic experiments. The relatively higher sorption rate of HR2 led to more phosphate adsorbed than HR1. It is important to note that the amount of P adsorbed by these hybrid resins was far below the maximum adsorption capacities (i.e., 7.69 mg/g for HR1 and 19.84 mg/g for HR2), suggesting that the hybrid resins are suited for the resin bag based passive detection method of P in tile water.
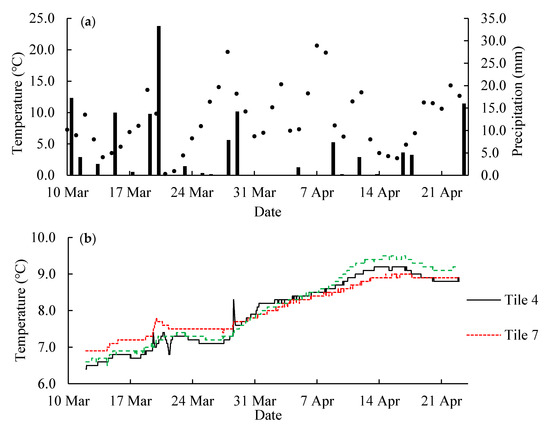
Figure 6.
Weather conditions in Spring 2020 at the study site in East-Central Illinois, USA. (a) Daily air temperature shown in dots and daily precipitation shown in columns; (b) tile water temperature.
Table 5.
Results of paired t-test for comparing the DRP concentrations obtained by the hybrid resin-sampling method and the auto-sampling method. The passive-sampling data were calculated based on the laboratory calibration data. DPR concentrations of each auto-sampled tile water were compared with the calculated DPR concentration in corresponding passive-sampling periods. The data are shown in Figure 9.
3.3.2. Calibration of the Hybrid Resin Passive Sampler
To calculate the DRP concentration in tile water from the amount of P extracted from the field-deployed hybrid resins, a functional relationship must be evaluated between the amount of P adsorbed in a certain time and the average P concentration in water. A linear relationship would be ideal for this application. The results of the laboratory calibration experiment are shown in Figure 7a,b. The P content in the resins proportionally increased with increasing time. The amount of P adsorbed by the hybrid resins was linearly correlated to the amount of P exposed (R2 > 0.99 for both hybrid resins) (Figure 7a,b). The calculated sampling rate (RL) was 0.1992 and 0.0156 L/h for HR1 and HR2, respectively. It should be noted that HR2 adsorbed less P than HR1 under the same conditions in the laboratory calibration experiment, which was different from the result of extracted P from field-deployed resin samples. However, the less adsorbed P is possibly due to the repulsion of hydroxyl ions in HR2. During the iron oxide coating of HR2, high concentrations of NaOH were used to precipitate ferric ions and exchanged into the anion exchange resin. Although the resin was washed with a NaHCO3 solution, residual hydroxyl ions could still have remained and imposed negatively influences on the adsorption of phosphate ions. However, in the field application, hydroxyl ions on the resin surface were continually to be washed in flowing tile water during the 3–4 days of deployment, and its influence on P adsorption is less significant. Therefore, the P adsorption of HR2 was less affected in the field-deployed samples. Another factor that could influence the P adsorption is the flow rates. The flow rate of the laboratory calibration experiment is much lower than the actual flow rate in tiles as mentioned in the method section. Therefore, a field calibration is necessary to obtain a more reliable sampling rate for the calculation of average DRP concentration.
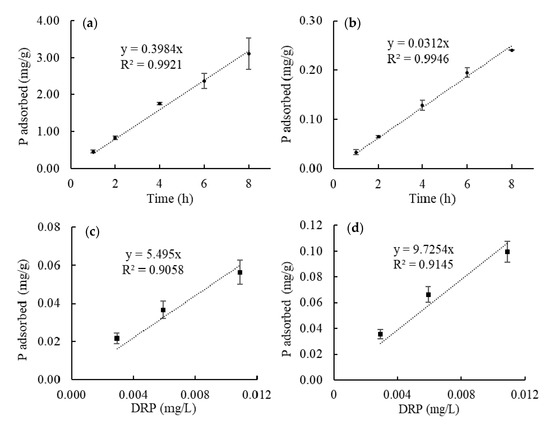
Figure 7.
Laboratory calibration experiments using (a) HR1 and (b) HR2. The dashed lines show the linear fitting of the amount of P adsorbed with different adsorption time. Laboratory sampling rate, RL, for HR1 and HR2 is calculated to be 0.1992 and 0.0156 L/h, accordingly. (c,d) Shows the result of field calibration experiments using HR1 and HR2, respectively. The dashed lines show the linear fitting of the amount of P adsorbed with the DRP concentration of the tile water. Field sampling rate, RF, for HR1 and HR2, is 0.0763 and 0.1351 L/h, respectively.
The sampling period from 2 April to 5 was selected for the calibration because the concentration of DRP and tile water temperature were relatively stable during the period (see Figure 6 and Figure 8). There was no precipitation during this period and the water flow rate was stable at ~0.1 L/s. Based on the data from the Agridrain auto-sampling system, the DRP concentration of tile #4, #7 and #46 were considered to be constant at 0.0059, 0.0029 and 0.0109 mg/L, respectively. During the three days, HR1 adsorbed P at 0.0050, 0.0027, 0.0065 mg/g in the three tiles. The three pairs of DRP concentration and P content in HR1 was plotted in Figure 7c and the linearly fitted (R2 = 0.9058). The field sampling rate (RF) of HR1 was 0.0763 L/h. Similarly, the DPR concentration and the P content in HR2 were linearly correlated (R2 = 0.9145) (Figure 7d) and the RF of HR2 was 0.1351 L/h.
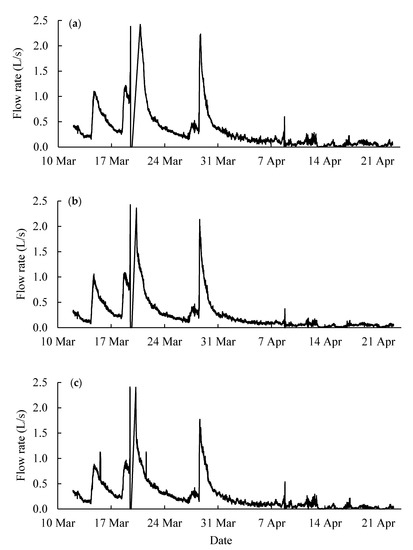
Figure 8.
Water flow rate in (a) tile line #4, (b) tile line #7 and (c) tile line #46 recorded by the Agridrain system in 2020. Please note that the flows between 19–20 March exceeded 2.47 L/s, which is the detection limit of the Agridrain structure.
3.3.3. Estimation of DRP Concentration of Tile Water Using Hybrid Resin Sampler
According to the result of calibration experiments and water flow rate in each tile line (Figure 8), the passive-sampled P in the hybrid resins was converted into the average concentration of DRP in tile water using on the laboratory sampling rate and the field sampling rate. The flow rate showed that there were several storm events (flow rate > 0.5 L/s) during the study period (Figure 8). The line segments in Figure 9 showed the average DRP concentration calculated from RL in each sampling period. The DPR concentrations from HR1-sampling, HR2-sampling and auto-sampling were compared, and the statistical analysis was conducted using paired Student’s t-test (Table 5). For all three tile lines, the DRP concentrations of auto-sampled tile water were significantly different from the DRP concentration calculated from the hybrid resin-sampling based on the laboratory calibration data (p < 0.05). The results from HR1-sampling and HR2-sampling were also significantly different (p < 0.05). It suggests that the sampling rate from the laboratory calibration was not effective.
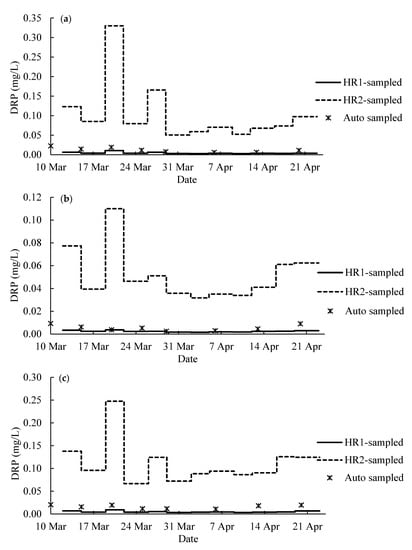
Figure 9.
Phosphate concentration of tile water from (a) tile #4, (b) tile #7 and (c) tile #46. The line segments represent the average DRP concentration in each sampling period in 2020 calculated based on the lab sampling rates, RL. The scattered dots show the DRP concentration of tile water weekly sampled by the Agridrain system.
In contrast, the DRP concentrations calculated from RF generally fall in the same range as the auto-sampling DRP data (Figure 10). Statistical analysis showed no significant difference between the result of auto-sampling and passive-sampling, or between the passive sampling based on the field calibration data (p > 0.05) (Table 6). Similar trends of DRP data are shown in the data from the three sampling methods (i.e., hybrid resins and auto-sampler) (Figure 10). For example, a peak was observed on 19 March in Figure 10 and 10c except for the auto-sampled data of Tile 7. It corresponds to a heavy precipitation and a subsequent flood event (Figure 6 and Figure 8). The calculated DRP from hybrid resin-sampling were not always similar to the values from the auto-sampling. However, the auto-sampling data from the Agridrain system was single-point. It should be noted that the DRP data from the auto-sampler are discrete and may not capture quick changes in concentration due to increased flow. DPR concentrations in drainage waters could change even by an order of magnitude within a day [6,14,15]. It is possible that the calculated DRP from hybrid resin-passive sampling might reflect the actual DRP values since the hybrid resins during the passive sampling were continuously exposed to DRP in tile waters. In addition, a larger response of DRP increase during the flooding event on 19 March was shown by the data from hybrid resin-sampling, especially HR2, than by the data from auto-sampling. This overestimation is attributed to the following two reasons. First, this might be influenced by the entry of particulate P during the storm event. During the storm event, a substantial quantity of particulate P including colloidal P is released in tile water (Y. Arai, personal communication, 15 June 2020). It could also be affected by stagnant (non-flowing tile water) during peak flooding (L. Gentry. Personal communication, 25 June 2020).
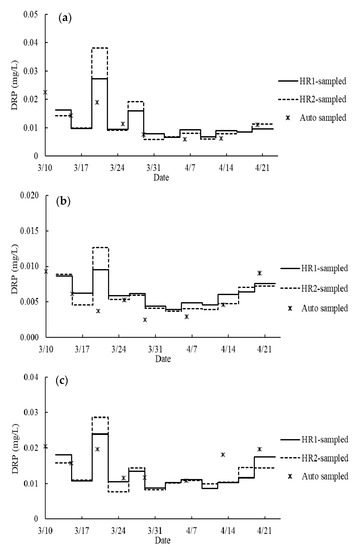
Figure 10.
Phosphate concentration of tile water from (a) tile #4, (b) tile #7 and (c) tile #46. The line segments represent the average DRP concentration in each sampling period in 2020 calculated based on the field sampling rates, RF. The scattered dots show the DRP concentration of tile water weekly sampled by the Agridrain system.
Table 6.
Results of paired t-test for comparing the DRP concentrations obtained by the hybrid resin-sampling method and the auto-sampling method. The passive-sampling data was calculated based on the field calibration data. DPR concentrations of each auto-sampled tile water were compared with the calculated DPR concentration in corresponding passive-sampling periods. The data are shown in Figure 10.
Although PP was not observed in the recovered resins, the possibility cannot be excluded that colloidal P adhesion occurred on the hybrid resins, which could lead to the overestimated values during the storm events. Second, the high volume of water during the storm event could have a dilution effect on total P discharge, which may explain lower DRP values of auto-sampling DRP data to the flooding event than the hybrid resin-sampling data.
Throughout the entire monitoring period, the fluctuations of DRP concentrations of tile water were mainly influenced by precipitation events. Air temperature fluctuated but the water temperature was relatively stable (Figure 6). The average DRP concentration of the entire monitoring period was calculated from the DRP data with RF, and weighted averaged in two ways: time-weighted and flow-weighted (Table 7). Because of the positive relationship between the flow rate and DRP concentration, all the flow-weighted average DRP concentrations were significantly higher than their corresponding time-weighted average DRP concentrations (p < 0.05). Among the three tile lines, the highest flow-weighted average DRP concentration was 0.0198 ± 0.0003 mg/L from the flow-weighted HR2-sampling data of Tile 4, and the average DRP concentration of Tile 46 (0.0166 ± 0.0003 mg/L) was significantly higher than that of Tile 7 (0.0078 ± 0.0003 mg/L) (p < 0.05). These DRP concentrations are consistent with these reported for agricultural drainage water in the Midwestern U.S. and are all lower than the critical eutrophication inducible level (0.02~0.03 mg/L) [14,56,57].
Table 7.
Average DRP concentrations in tile water throughout the six-week monitoring period. The DRP concentrations were calculated from the field-calibrated passive sampling method, and averaged with the time and flow volume of each sampling period, respectively. Standard deviations are shown in parentheses.
3.3.4. Evaluation of P Loads in Tile Drainage Water
Based on the DRP concentrations that were calculated with RF and volumes of water flow, TP load in each sampling period was calculated (Table 8). Different P loads were observed from three tile lines (p < 0.05). According to the HR1-sampling data, tile 4, tile 7, and tile 46 released P at the rate of 0.53 ± 0.01, 0.18 ± 0.00, and 0.39 ± 0.01 g/day, respectively. Since tile 4, tile 7, and tile 46 cover 1.95, 1.86 and 1.63 hectares of drainage area, respectively, they discharged 0.27 ± 0.01, 0.10 ± 0.00 and 0.24 ± 0.01 g of P per hectare per day, respectively. The data from HR2-sampling were slightly higher. They were 0.33 ± 0.00, 0.11 ± 0.01 and 0.25 ± 0.01 g/ha/d from tile 4, tile 7 and tile 46, respectively. In addition, the P discharge during the flooding event (19–21 March) released 44.8–64.8% of TP load in the three tiles during the six-week monitoring period. It showed the importance of high flow events on the loss of P from agricultural drainages, which is in accordance with previous studies [4,58,59,60].
Table 8.
Load of P (unit: g/period) discharged through each tile line in each sampling period calculated from flow volumes and DRP concentrations based on HR1- and HR2-sampling. The period refers to 3–4 days of deployment period of the resin bags. Standard deviations are shown in parentheses.
4. Conclusions and Future Implications
This study showed that a passive detection technique using hybrid resin bags is a promising technique to monitor DRP in tile drainage water. The iron oxide coated-polyacrylic resin and -polystyrene resin were excellent adsorbents for P with the maximum P adsorption capacity of 7.69 and 19.84 mg/g, respectively. The P adsorption kinetic experiments showed that P adsorption in the hybrid polyacrylic and polystyrene resin was rapid with the second-order rate constant of 0.080 and 0.108 g/(mg min), respectively.
The field test of hybrid resin-samplers showed that the hybrid polyacrylic resin adsorbed more P than the hybrid polystyrene resin. The average DRP concentrations estimated from the passive sampling were 0.006–0.020 mg/L, which corresponded to loads of P loss at 0.10–0.33 g/ha/day. The passive samplings with the hybrid polyacrylic resin and the hybrid polystyrene resin predicted DRP concentrations of tile waters that have no significant difference (Paired Student’s t-test, p > 0.05) with the auto-sampling data. High DRP concentrations and high flow rates were both observed during precipitation and subsequent flooding events. While both laboratory and in-field calibration experiments showed a linear correlation with the amount of P adsorbed in the hybrid resins (i.e., P concentration in water × adsorption time), sampling rate (Rf) calculated from the in-field calibration was necessary to improve the prediction of DRP concentrations in tile water.
Overall, iron oxide coated hybrid resins in the passive sampling method are proven to be suitable, reactive adsorbents to measure DRP in tile drainage waters. The passive detection technique for monitoring DRP flux in relatively high P concentrations and/or for longer sampling periods is theoretically possible but needs field verification. It should be further studied whether the predicted DRP in the passive sampling was affected by particulate P, since a considerable amount of particulate P in tiles is released during storm events [61,62,63]. The development of more reactive hybrid resin that can be adapted to a wide range of temperature and flow rate is needed to expand the use of passive detection technique to different water bodies like rivers. The selection of mesh bags that are not greatly impacted by biofouling should be tested if the technique is adapted for a long-term deployment. Nevertheless, the passive detection method using iron oxide coated hybrid resins is recommended as an easy and economical tool to monitor seasonally fluctuating DRP flux in tile drainage waters as long as the hybrid resins are well-calibrated for specific field conditions (e.g., flow rate and concentration range). The technique might be of interest to a large-scale monitoring project to understand and manage P loss and other dissolved contaminants, which have strong attraction to iron oxides, in watersheds and or a river basin.
Author Contributions
Conceptualization, Y.A.; methodology, Y.A. and Z.L.; validation, Z.L., Y.L.; formal analysis, Z.L., Y.L.; investigation, Z.L. and C.M.; resources, Y.A., M.L.C., L.G.; data curation, Z.L.; writing—original draft preparation, Z.L. and Y.A.; writing—review and editing, Z.L. and Y.A.; visualization, Z.L.; supervision, Y.A.; project administration, Y.A.; funding acquisition, Y.A., L.G. All authors have read and agreed to the published version of the manuscript.
Funding
This research was funded by the United States Department of Agriculture (# 2016-67019-25268), Illinois Nutrient Research and Education Council (#2016-4-360347-203), and China Scholarships Council (# 201706300011) for supporting this project financially.
Acknowledgments
Use of the Advanced Photon Source was supported by the U. S. Department of Energy, Office of Science, Office of Basic Energy Sciences, under Contract No. DE-AC02-06CH11357.
Conflicts of Interest
The authors declare no conflict of interest.
References
- Sharpley, A.N.; Chapra, S.C.; Wedepohl, R.; Sims, J.T.; Daniel, T.C.; Reddy, K.R. Managing agricultural phosphorus for protection of surface waters: Issues and options. J. Environ. Qual. 1994, 23, 437–451. [Google Scholar] [CrossRef]
- Carpenter, S.R.; Caraco, N.F.; Correll, D.L.; Howarth, W.R.; Sharpley, A.N.; Smith, V.H. Nonpoint pollution of surface waters with phosphorus and nitrogen. Ecol. Appl. 1998, 8, 559–568. [Google Scholar] [CrossRef]
- Gentry, L.E.; David, M.B.; Royer, T.V.; Mitchell, C.A.; Starks, K.M. Phosphorus transport pathways to streams in tile-drained agricultural watersheds. J. Environ. Qual. 2007, 36, 408–415. [Google Scholar] [CrossRef] [PubMed]
- King, K.; Williams, M.; Fausey, N. Contributions of systematic tile drainage to watershed-scale phosphorus transport. J. Environ. Qual. 2015, 44, 486–494. [Google Scholar] [CrossRef] [PubMed]
- Rozemeijer, J.; van der Velde, Y.; de Jonge, H.; van Geer, F.; Broers, H.P.; Bierkens, M. Application and evaluation of a new passive sampler for measuring average solute concentrations in a catchment scale water quality monitoring study. Environ. Sci. Technol. 2010, 44, 1353–1359. [Google Scholar] [CrossRef] [PubMed]
- Müller, B.; Stöckli, A.; Stierli, R.; Butscher, E.; Gächter, R. A low cost method to estimate dissolved reactive phosphorus loads of rivers and streams. J. Environ. Monit. 2007, 9, 82–86. [Google Scholar] [CrossRef] [PubMed]
- Worsfold, P.; McKelvie, I.; Monbet, P. Determination of phosphorus in natural waters: A historical review. Anal. Chim. Acta 2016, 918, 8–20. [Google Scholar] [CrossRef] [PubMed]
- O’Brien, D.S.; Chiswell, B.; Mueller, J.F. A novel method for the in situ calibration of flow effects on a phosphate passive sampler. J. Environ. Monit. 2009, 11, 212–219. [Google Scholar]
- Edenborn, H.M.; Howard, B.H.; Sams, J.I.; Vesper, D.J.; Edenborn, S.L. Passive detection of Pb in water using rock phosphate agarose beads. J. Hazard. Mater. 2017, 336, 240–248. [Google Scholar] [CrossRef]
- Vrana, B.; Allan, I.J.; Greenwood, R.; Mills, G.A.; Dominiak, E.; Svensson, K.; Knutsson, J.; Morrison, G. Passive sampling techniques for monitoring pollutants in water. TrAC Trends Anal. Chem. 2005, 24, 845–868. [Google Scholar] [CrossRef]
- Ahrens, L.; Daneshvar, A.; Lau, A.E.; Kreuger, J. Characterization of five passive sampling devices for monitoring of pesticides in water. J. Chromatogr. A 2015, 1405, 1–11. [Google Scholar] [CrossRef] [PubMed]
- Almeida, M.I.G.S.; Jayawardane, B.M.; Kolev, S.D.; McKelvie, I.D. Developments of microfluidic paper-based analytical devices (μPADs) for water analysis: A review. Talanta 2018, 177, 176–190. [Google Scholar] [CrossRef] [PubMed]
- Jayawardane, B.M.; McKelvie, I.D.; Kolev, S.D. A paper-based device for measurement of reactive phosphate in water. Talanta 2012, 100, 454–460. [Google Scholar] [CrossRef] [PubMed]
- King, K.W.; Williams, M.R.; Macrae, M.L.; Fausey, N.R.; Frankenberger, J.; Smith, D.R.; Kleinman, P.J.A.; Brown, L.C.; Fausey, N.R.; Brown, L.C.; et al. Phosphorus transport in agricultural subsurface drainage: A review. J. Environ. Qual. 2015, 44, 467–485. [Google Scholar] [CrossRef] [PubMed]
- Smith, D.R.; King, K.W.; Johnson, L.; Francesconi, W.; Richards, P.; Baker, D.; Sharpley, A.N. Surface runoff and tile drainage transport of phosphorus in the midwestern United States. J. Environ. Qual. 2015, 44, 495. [Google Scholar] [CrossRef]
- Roll, I.B.; Halden, R.U. Critical review of factors governing data quality of integrative samplers employed in environmental water monitoring. Water Res. 2016, 94, 200–207. [Google Scholar] [CrossRef]
- Schäfer, R.B.; Paschke, A.; Vrana, B.; Mueller, R.; Liess, M. Performance of the Chemcatcher® passive sampler when used to monitor 10 polar and semi-polar pesticides in 16 Central European streams, and comparison with two other sampling methods. Water Res. 2008, 42, 2707–2717. [Google Scholar] [CrossRef]
- Gunold, R.; Schäfer, R.B.; Paschke, A.; Schüürmann, G.; Liess, M. Calibration of the Chemcatcher® passive sampler for monitoring selected polar and semi-polar pesticides in surface water. Environ. Pollut. 2008, 155, 52–60. [Google Scholar] [CrossRef]
- Kingston, J.K.; Greenwood, R.; Mills, G.A.; Morrison, G.M.; Persson, L.B. Development of a novel passive sampling system for the time-averaged measurement of a range of organic pollutants in aquatic environments. J. Environ. Monit. 2000, 2, 487–495. [Google Scholar] [CrossRef]
- Gong, X.; Li, K.; Wu, C.; Wang, L.; Sun, H. Passive sampling for monitoring polar organic pollutants in water by three typical samplers. Trends Environ. Anal. Chem. 2018, 17, 23–33. [Google Scholar] [CrossRef]
- De Jonge, H.; Rothenberg, G. New device and method for flux-proportional sampling of mobile solutes in soil and groundwater. Environ. Sci. Technol. 2005, 39, 274–282. [Google Scholar] [CrossRef] [PubMed]
- Sendrowski, A.; Boyer, T.H. Phosphate removal from urine using hybrid anion exchange resin. Desalination 2013, 322, 104–112. [Google Scholar] [CrossRef]
- Sengupta, S.; Pandit, A. Selective removal of phosphorus from wastewater combined with its recovery as a solid-phase fertilizer. Water Res. 2011, 45, 3318–3330. [Google Scholar] [CrossRef] [PubMed]
- O’Neal, J.A.; Boyer, T.H. Phosphate recovery using hybrid anion exchange: Applications to source-separated urine and combined wastewater streams. Water Res. 2013, 47, 5003–5017. [Google Scholar] [CrossRef]
- Chitrakar, R.; Tezuka, S.; Sonoda, A.; Sakane, K.; Ooi, K.; Hirotsu, T. Phosphate adsorption on synthetic goethite and akaganeite. J. Colloid Interface Sci. 2006, 298, 602–608. [Google Scholar] [CrossRef]
- Funes, A.; Martínez, F.J.; Álvarez-Manzaneda, I.; Conde-Porcuna, J.M.; de Vicente, J.; Guerrero, F.; de Vicente, I. Determining major factors controlling phosphorus removal by promising adsorbents used for lake restoration: A linear mixed model approach. Water Res. 2018, 141, 377–386. [Google Scholar] [CrossRef]
- Luengo, C.; Brigante, M.; Antelo, J.; Avena, M. Kinetics of phosphate adsorption on goethite: Comparing batch adsorption and ATR-IR measurements. J. Colloid Interface Sci. 2006, 300, 511–518. [Google Scholar] [CrossRef]
- Upping, E.; Thompson, D.W.; Ohnstad, M.; Hetherington, N.B. Effects of ph on the release of metals from naturally-occurring oxides of mn and fe. Environ. Technol. Lett. 1986, 7, 109–114. [Google Scholar]
- Sager, M. Chemical speciation and environmental mobility of heavy metals in sediments and soils. Tech. Instrum. Anal. Chem. 1992, 12, 133–175. [Google Scholar]
- Tamura, H.; Goto, K.; Yotsuyanagi, T.; Nagayama, M. Spectrophotometric determination of iron(II) with 1,10-phenanthroline in the presence of large amounts of iron(III). Talanta 1974, 21, 314–318. [Google Scholar] [CrossRef]
- Ravel, B.; Newville, M. ATHENA, ARTEMIS, HEPHAESTUS: Data analysis for X-ray absorption spectroscopy using IFEFFIT. J. Synchrotron Radiat. 2005, 12, 537–541. [Google Scholar] [CrossRef] [PubMed]
- Klute, A.; Carter, D.L.; Mortland, M.M.; Kemper, W.D. Specific Surface. In Methods of Soil Analysis: Part 1 Physical and Mineralogical Methods; Klute, A., Ed.; American Society of Agronomy, Inc.: Madison, WI, USA, 1986; pp. 413–423. [Google Scholar]
- He, Z.; Baligar, V.; Ritchey, K.; Martens, D. Determination of soluble phosphorus in the presence of organic ligands or fluoride. Soil Sci. Soc. Am. J. 1998, 62, 1538–1541. [Google Scholar] [CrossRef]
- Ho, Y.S.; McKay, G. The sorption of lead(II) ions on peat. Water Res. 1999, 33, 578–584. [Google Scholar] [CrossRef]
- Ho, Y.S.; McKay, G. The kinetics of sorption of divalent metal ions onto sphagnum moss peat. Water Res. 2000, 34, 735–742. [Google Scholar] [CrossRef]
- Xu, S.; Gentry, L.; Chen, K.; Arai, Y. Intensive agricultural management induced subsurface accumulation of labile phosphorus in tile line dominated Midwestern agricultural soils. Soil Sci. Soc. Am. J. 2020, in press. [Google Scholar] [CrossRef]
- USDA Soil Survey. Soil Survey of Douglas County, Illinois. Natural Accessibility Conservation Service. 2006. Available online: https://www.blogs.nrcs.usda.gov/Internet/FSE_MANUSCRIPTS/illinois/IL041/0/Douglas_IL.pdf (accessed on 10 January 2020).
- Chun, J.A.; Cooke, R.A. Calibrating agridrain water level control structures using generalized weir and orifice equations. Appl. Eng. Agric. 2008, 24, 595–602. [Google Scholar] [CrossRef]
- Penn, C.; Bowen, J. Characterization of PSMs. In Design and Construction of Phosphorus Removal Structures for Improving Water Quality, 1st ed.; Springer: Berlin/Heidelberg, Germany, 2017; p. 105. [Google Scholar]
- Knutsson, J.; Rauch, S.; Morrison, G.M. Performance of a passive sampler for the determination of time averaged concentrations of nitrate and phosphate in water. Environ. Sci. Process. Impacts 2013, 15, 955–962. [Google Scholar] [CrossRef][Green Version]
- Takeshita, R.; Yoshida, I.; Ueno, K. Adsorption behaviour of phosphate ion on the iron (III) compleks of a chelating resin. Bull. Chem. Soc. Jpn. 1979, 52, 2577–2580. [Google Scholar] [CrossRef]
- Acelas, N.Y.; Martin, B.D.; López, D.; Jefferson, B. Selective removal of phosphate from wastewater using hydrated metal oxides dispersed within anionic exchange media. Chemosphere 2015, 119, 1353–1360. [Google Scholar] [CrossRef]
- Sarkar, S.; Chatterjee, P.K.; Cumbal, L.H.; SenGupta, A.K. Hybrid ion exchanger supported nanocomposites: Sorption and sensing for environmental applications. Chem. Eng. J. 2011, 166, 923–931. [Google Scholar] [CrossRef]
- Pan, B.; Wu, J.; Pan, B.; Lv, L.; Zhang, W.; Xiao, L.; Wang, X.; Tao, X.; Zheng, S. Development of polymer-based nanosized hydrated ferric oxides (HFOs) for enhanced phosphate removal from waste effluents. Water Res. 2009, 43, 4421–4429. [Google Scholar] [CrossRef] [PubMed]
- Ren, J.; Li, N.; Zhao, L. Adsorptive removal of Cr (VI) from water by anion exchanger based nanosized ferric oxyhydroxide hybrid adsorbent. Chem. Biochem. Eng. Q 2012, 26, 111–118. [Google Scholar]
- Sengupta, A.K.; Cumbal, L.H. Hybrid Anion Exchanger for Selective Removal of Contaminating Ligands from Fluids and Method of Manufacture Thereof. U.S. Patent 7,291,578, 6 November 2007. Available online: https://patentimages.storage.googleapis.com/13/34/25/1a107991a4843f/US7291578B2.pdf (accessed on 10 January 2020).
- You, X.; Guaya, D.; Farran, A.; Valderrama, C.; Cortina, J.L. Phosphate removal from aqueous solution using a hybrid impregnated polymeric sorbent containing hydrated ferric oxide (HFO). J. Chem. Technol. Biotechnol. 2016, 91, 693–704. [Google Scholar] [CrossRef]
- Parfitt, R.L. Phosphate reactions with natural allophane, ferrihydrite and goethite. J. Soil Sci. 1989, 40, 359–369. [Google Scholar] [CrossRef]
- Parfitt, R.L.; Atkinson, R.J.; Smart, R.S.C. The mechanism of phosphate fixation by iron oxides1. Soil Sci. Soc. Am. J. 1975, 39, 837–841. [Google Scholar] [CrossRef]
- Pan, B.; Pan, B.; Zhang, W.; Lv, L.; Zhang, Q.; Zheng, S. Development of polymeric and polymer-based hybrid adsorbents for pollutants removal from waters. Chem. Eng. J. 2009, 151, 19–29. [Google Scholar] [CrossRef]
- Zagorodni, A.A. Ion Exchange Materials: Properties and Applications, 1st ed.; Elsevier: Amsterdam, The Netherlands, 2006; p. 26. [Google Scholar]
- Boari, G.; Liberti, L.; Passino, R. Selective renovation of eutrophic wastes phosphate removal. Water Res. 1976, 10, 421–428. [Google Scholar] [CrossRef]
- Ding, L.; Wu, C.; Deng, H.; Zhang, X. Adsorptive characteristics of perchlorate from aqueous solutions by MIEX resin. J. Colloid Interface Sci. 2012, 376, 224–232. [Google Scholar] [CrossRef]
- Ho, Y.S.; Ng, J.C.Y.; McKay, G. Kinetics of pollutant sorption by biosorbents: Review. Sep. Purif. Methods 2000, 29, 189–232. [Google Scholar] [CrossRef]
- Lalley, J.; Han, C.; Li, X.; Dionysiou, D.D.; Nadagouda, M.N. Phosphate adsorption using modified iron oxide-based sorbents in lake water: Kinetics, equilibrium, and column tests. Chem. Eng. J. 2016, 284, 1386–1396. [Google Scholar] [CrossRef]
- Xue, Y.; David, M.B.; Gentry, L.E.; Kovacic, D.A. Kinetics and modeling of dissolved phosphorus export from a tile- drained agricultural watershed. J. Environ. Qual. 1998, 27, 917–922. [Google Scholar] [CrossRef]
- Baker, L.; Campbell, K.L.; Johnson, H.P.; Hanway, J. Nitrate, phosphorus, and sulfate in subsurface drainage wate. J. Environ. Qual. 1975, 4, 406–412. [Google Scholar] [CrossRef]
- Algoazany, A.S.; Kalita, P.K.; Czapar, G.F.; Mitchell, J.K. Phosphorus transport through subsurface drainage and surface runoff from a flat watershed in east central Illinois, USA. J. Environ. Qual. 2007, 36, 681–693. [Google Scholar] [CrossRef] [PubMed]
- Smil, V. Phosphorus in the environment: Natural flows and human interferences. Annu. Rev. Energy Environ. 2000, 25, 53–88. [Google Scholar] [CrossRef]
- Heathwaite, A.L.; Dils, R.M. Characterising phosphorus loss in surface and subsurface hydrological pathways. Sci. Total Environ. 2000, 251–252, 523–538. [Google Scholar] [CrossRef]
- Kleinman, P.J.A.; Smith, D.R.; Bolster, C.H.; Easton, Z.M. Phosphorus fate, management, and modeling in artificially drained systems. J. Environ. Qual. 2015, 44, 460–466. [Google Scholar] [CrossRef]
- Vaithiyanathan, P.; Correll, D.L. The Rhode River watershed: Phosphorus distribution and export in forest and agricultural soils. J. Environ. Qual. 1992, 21, 280–288. [Google Scholar] [CrossRef]
- Saadat, S.; Bowling, L.; Frankenberger, J.; Kladivko, E. Nitrate and phosphorus transport through subsurface drains under free and controlled drainage. Water Res. 2018, 142, 196–207. [Google Scholar] [CrossRef]
© 2020 by the authors. Licensee MDPI, Basel, Switzerland. This article is an open access article distributed under the terms and conditions of the Creative Commons Attribution (CC BY) license (http://creativecommons.org/licenses/by/4.0/).