Water and Climate Change, Two Key Objectives in the Agenda 2030: Assessment of Climate Literacy Levels and Social Representations in Academics from Three Climate Contexts


Abstract
1. Introduction
2. Water Crisis, CC and Objectives of Research
2.1. Water Crisis and CC
- (1)
- First, we talk about scarcity and insecurity, as water availability per person worldwide has fallen by 55% since 1960, and demand is expected to grow by 50% by 2030 [8]. Considering the above population increase (9.7 million in 2050), it is estimated that, of these, 3900 million will live in river basins extremely affected by water stress, which means that the forecast for 2050 is that water demand will increase by 400% for industry and 130% for domestic use [9]. Human insecurity linked to water is exacerbated by drought, affecting more people than any other type of natural disaster. One example is the 411 million people affected by natural disasters in 2016, 94% of whom were caused by drought, with direct consequences for agriculture. There are also areas on the planet where water stress is greater due to the increase in the economy and population, which requires more land for food production and, therefore, greater difficulties in managing water resources properly and sustainably, which will be even more difficult due to the CC (temperature increases that will lead to greater evaporation of water). If in addition to this transboundary conflicts are added by the management of the water of a river by different countries with different interests, the problem is aggravated even more, making the availability of water less due to pollution, construction of dams, population demand, etc., which makes it very necessary to propose models of future socioeconomic scenarios to adapt sustainably to the increase in water demand and ensure food security which is intimately related to water and climate [10,11].
- (2)
- Water-related disasters account for 70% of all deaths related to extreme weather events [12]. It is estimated that by 2050 between 150 and 200 million people may have to leave their areas of residence due to phenomena such as desertification, the increase in extreme weather events—floods have been the most frequent global natural disaster in the last two decades [13] or rising sea levels [14]. In addition, the population living on land prone to flooding, the consequences of climate change, deforestation, loss of wetlands and rising sea levels are expected to increase this year, increasing the number of people vulnerable to flood disasters by 2 billion [15].
- (3)
- A third context in the water crisis is sanitation and its relationship to health. Although improvements in supply have been increasing, 663 million people did not have access to improved drinking water sources in 2015 [16]. Even so, these sources are not always safe: according to WHO, some 45 million people in Bangladesh drink water with arsenic concentrations higher than those permitted by WHO. On the other hand, when it comes to women and girls, sanitation services are even more important because they are intimately related to their health, which is put at risk when they are absent or unsafe. In addition, in the case of children, diarrhoeal diseases caused by poor sanitation cause one in nine deaths, with diarrhoea being the third leading cause of death in children under five worldwide despites being an easily preventable infection. In a 2015 survey of low- and middle-income countries, 38 per cent of health facilities did not have access to a source of safe drinking water, 35% had neither soap nor water, and 19% had no improved sanitation, exacerbating the problem [9].
- (4)
- Another determinant of the water crisis is the current pace of development, as not enough is being invested in water supply, sanitation and hygiene: in order to achieve the water-related Sustainable Development Goals (SDG), three times more capital would be needed than the current investment [17]. The rampant increase in meat consumption is causing the consumption of water for livestock to soar: while to produce 1 kg of rice requires 3500 litres of water, to produce 1 kg of meat requires 15,000 litres, adding that methane emissions from livestock wastewater could increase by 50% and nitrous oxide emissions by 25% between 1990 and 2020 [18]. Overall, the food industry in both low- and high-income countries contributes 54% and 40%, respectively, to the discharge of organic pollutants into water [19]. On the other hand, other types of human activities also degrade water resources; without going any further, two million tons of human waste are emptied into watercourses every day [20] and an estimated 15–18 million m3 of freshwater resources are polluted by fossil fuels [21].
- (5)
- Ecosystem degradation is another expression of the global water crisis. The 12.6 million global deaths attributed to the environment in 2012 [22] are clear evidence that environmental degradation is intimately linked to health. By 2050, the number of eutrophicated lakes is expected to increase by 20%, which means that by the same date one third of the world’s population will face risks from excess nitrogen and phosphorus in water associated with this phenomenon [23]. On the other hand, since 1900, 64% of the world’s wetlands have disappeared [24] and it is estimated that in the period 1970–2010 populations of freshwater species declined by about 76% [25]. In addition, one third of the world’s amphibians are at risk of extinction, as are 50% of native freshwater fish species [26].
- (6)
- Another very important example of ecosystem degradation is the alteration of peatlands. Although they cover only 3% of the Earth’s surface, if they remain humid they can store approximately twice as much carbon as all the world’s forests combined. The loss of 15% of these ecosystems would cause a contribution equal to 5% of anthropogenic CO2 emissions worldwide [27]. In the Nordic and Baltic states, 45% of peatlands have been drained, which is currently emitting approximately 80 megatons of CO2 per year, accounting for 25% of these countries’ total CO2 emissions.
- (7)
- Among the most degraded ecosystems are rivers and oceans. Due to the enormous amount of plastics, among other waste, that we dispose of in them. According to a report by the European Environment Agency, it is estimated that each year 10 million tonnes of waste are dumped into the sea, plastics being the most common type of waste because of the exponential increase in the production of these materials since 1950, going from 1.5 million tonnes per year to 280 million tonnes today. Of the 10 million tons of garbage that end up in the oceans, 8 million tons are plastics; a quarter of this amount comes from only ten rivers in the world and eight of those rivers are in Asia. The researchers, through a model that included data from studies on 57 rivers in different parts of the world, found that they pour between half a million and 2.75 million tons of plastic into the sea each year and the ten that transport 93% of these plastics are the rivers Yangtsé, Amarillo, Hai, de las Perlas, Amur, Mekong, Indo and Ganges in Asia, and the Niger and Nile rivers in Africa. The Yangtze River alone discharges up to 1.5 million tons of plastic waste annually into the Yellow Sea [28].
- (8)
- In addition to providing a high value ecosystem service, water is an indispensable element for the life of all living organisms on the planet and is also a vector for climate and weather regulation. The flow of clean, uncontaminated water ensures the sustainability of ecosystems and increases the likelihood of people’s health. This resource is not unlimited as one would expect from the perception that one often has of its cycle. That is why knowing the perception of water in all its spheres (health, hygiene, development, climate regulation, etc.) becomes especially important to act in a more incisive way through education and awareness, both in children and adults.
- (9)
- Coastal flood hazard modelling scenarios from sea-level rise by 2050 estimate that about 300 million people live in flood-prone coastal areas. The highest risk areas of the Iberian Peninsula are located in Doñana, Delta del Ebro, Manga del Mar Menor and coastal municipalities of Huelva and Cadiz [29].
2.2. Objectives of Research
- O#1: To assess the degree of climate literacy around the relationship between water and climate change (extreme weather events, rising sea levels, desertification, etc.) in university students from three different climatological and cultural contexts of the Iberian Peninsula.
- O#2: To assess whether the climate literacy of these students corresponds to pro-environmental attitudes and the information they claim to have on different aspects of the CC and its relationship with water.
- O#3: To compare the results in the three contexts analysed in order to determine which factor (territory, climate or common culture) influences the social representation of university students around the relationship between water and the CC.
3. Background
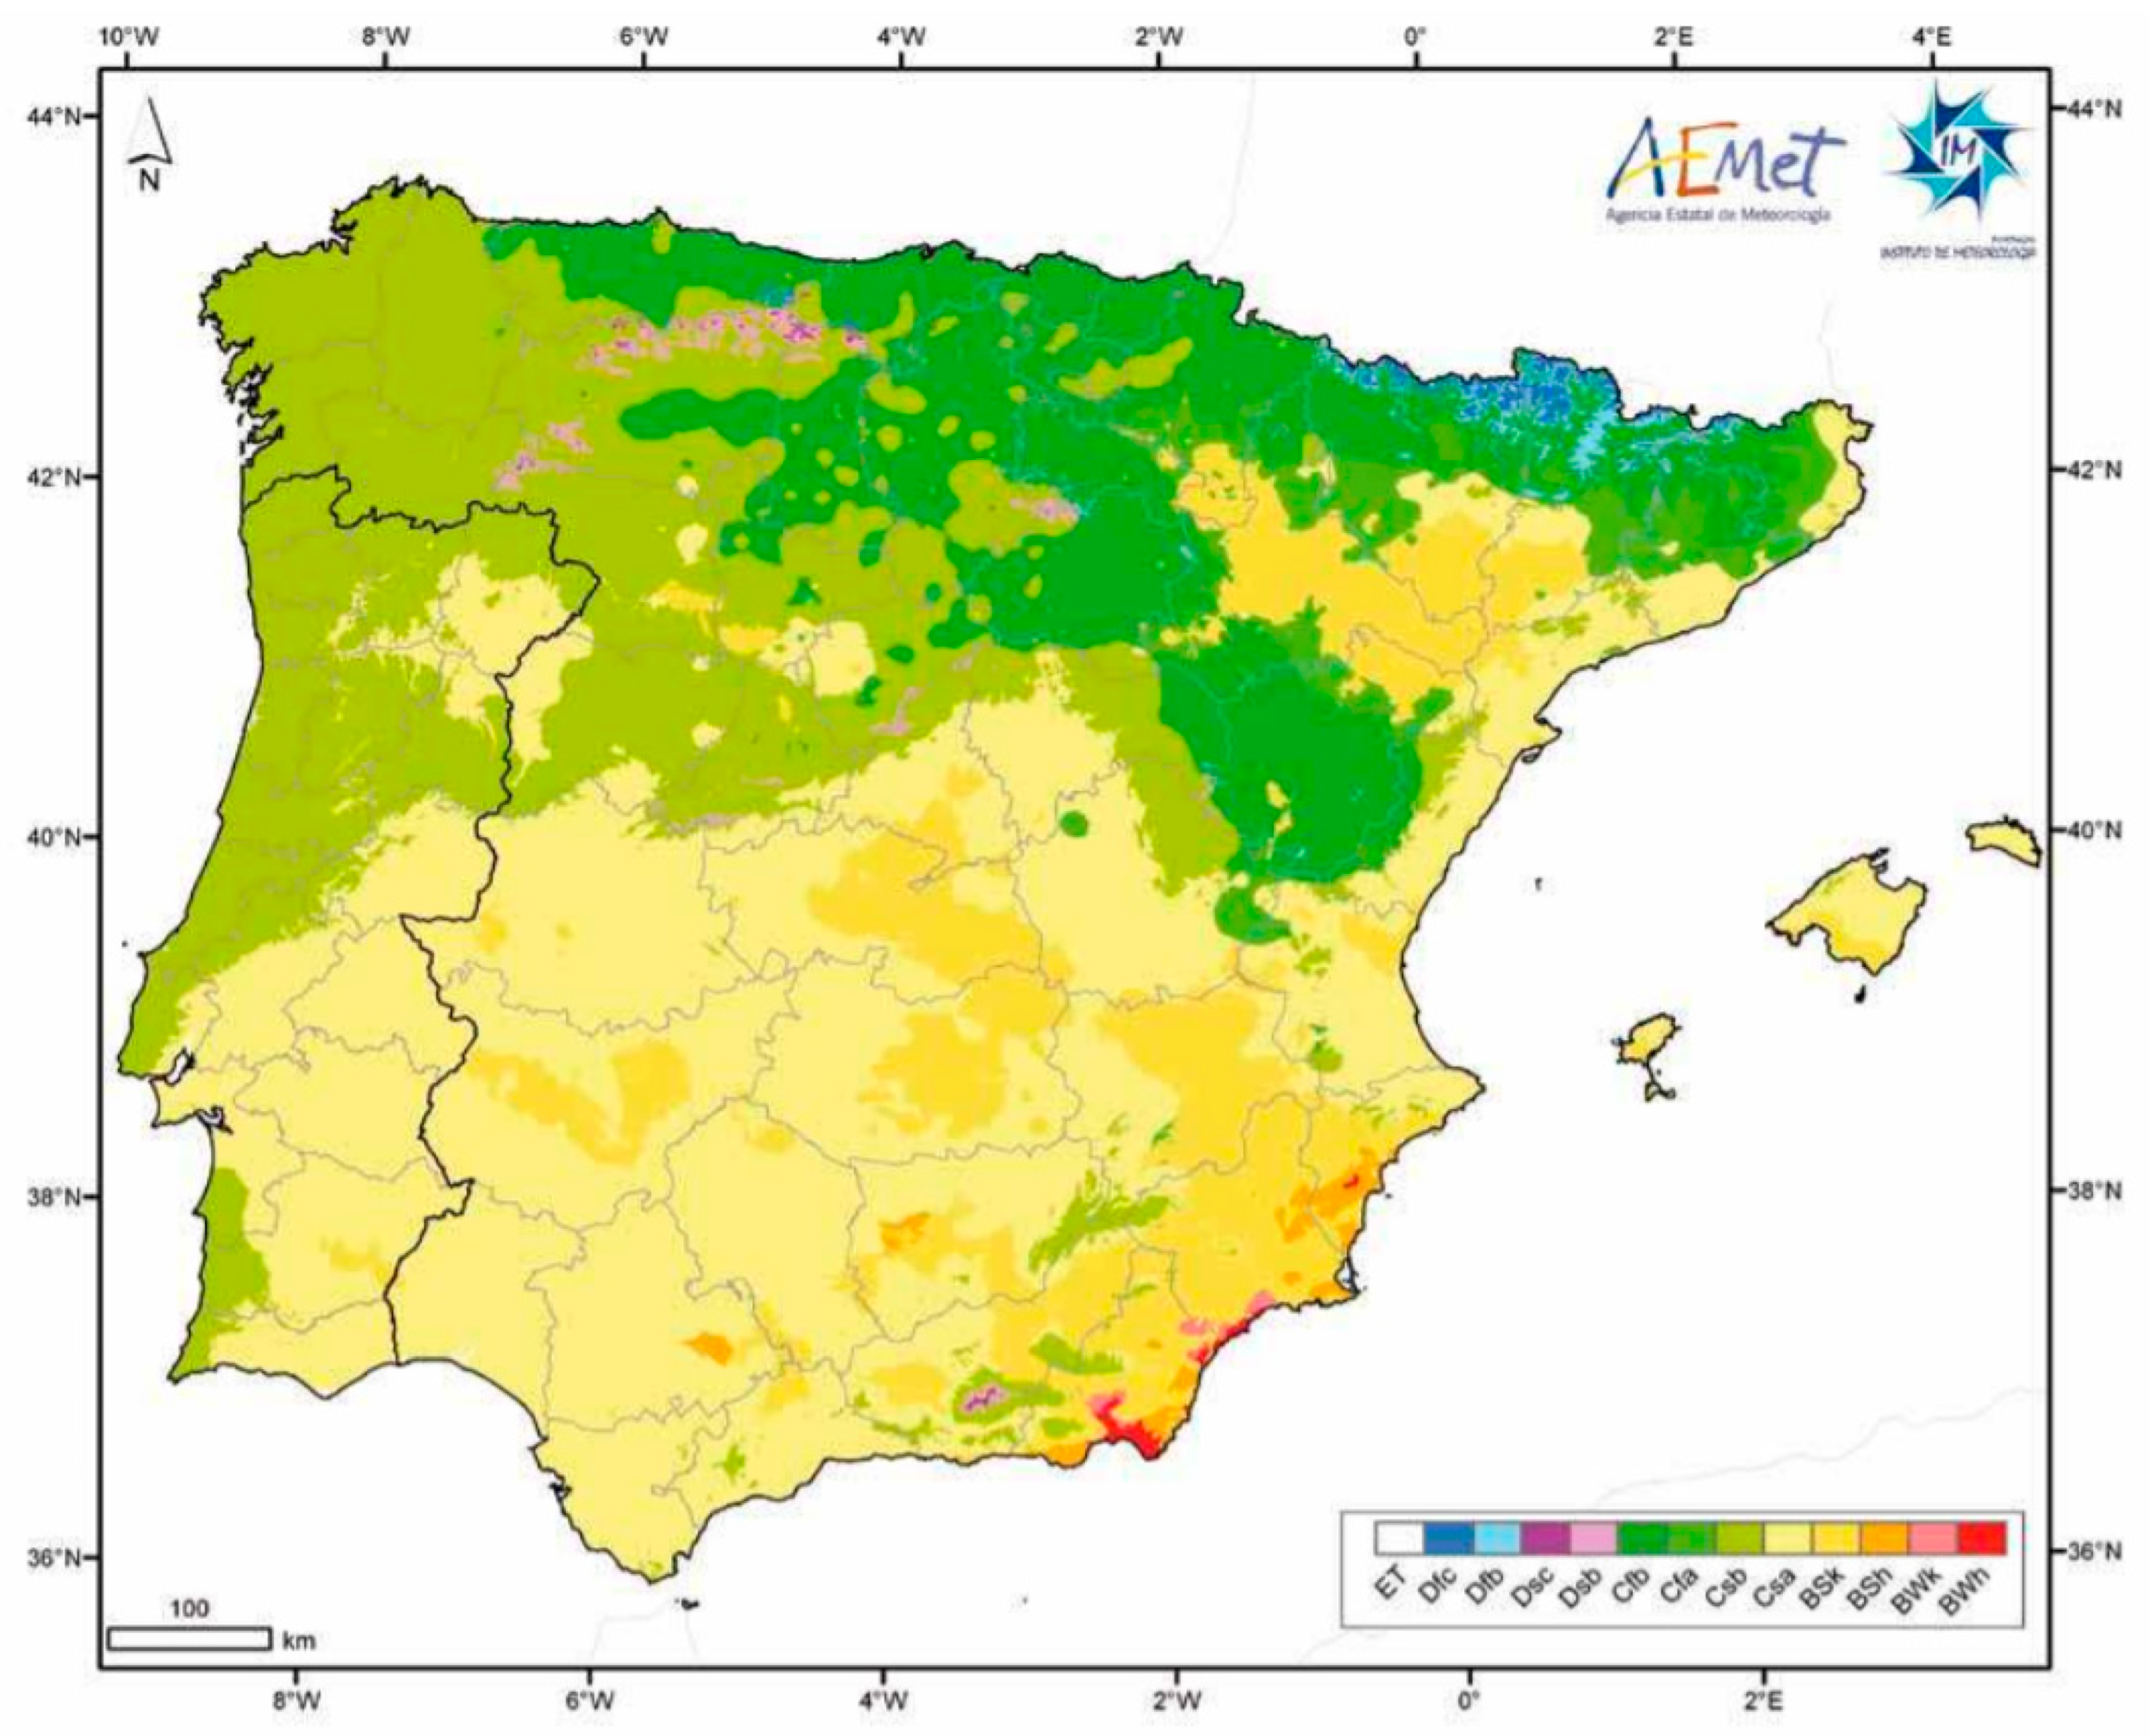
3.1. Territorial Contextualisation of the Study
3.2. Social Representations, Climate Literacy and Water
3.3. Water, CC and Sustainable Development Goals in Agenda 2030
4. Hypotheses
- H#1. The denial of the CC is significantly associated with a representation that belittles the consequences of global warming and other extreme phenomena.
- H#2. Territorial contexts with high average rainfall levels and low average annual temperatures tend to minimize the social representation of water risks associated with the CC; on the other hand, territorial contexts with low average rainfall levels and high average annual temperatures will tend to maximize the social representation of water effects and risks associated with the CC.
- H#3. The social representation on water and its relationship with the CC around its causes, consequences and solutions is created due to a significant relationship with the socio-cultural context.
5. Materials and Methods
5.1. Sample
5.2. Instrument
5.3. Instrument Quality Criteria and Data Analysis
6. Results
6.1. Degree of General Information on CC and Water
6.2. Degree of Information on the Causes of CC and Its Relationship with Water
6.3. Degree of Information about Solutions to Fight Against CC and Their Relationship with Water
6.4. Degree of Information on the Consequences of the CC and Its Relationship with Water
6.5. Assessment of the Degree of Information Received about CC in Your Degree
6.6. Assessment of the Degree of Pro-Environmental Attitude
6.7. Participation in CC-Related Activities
7. Discussion
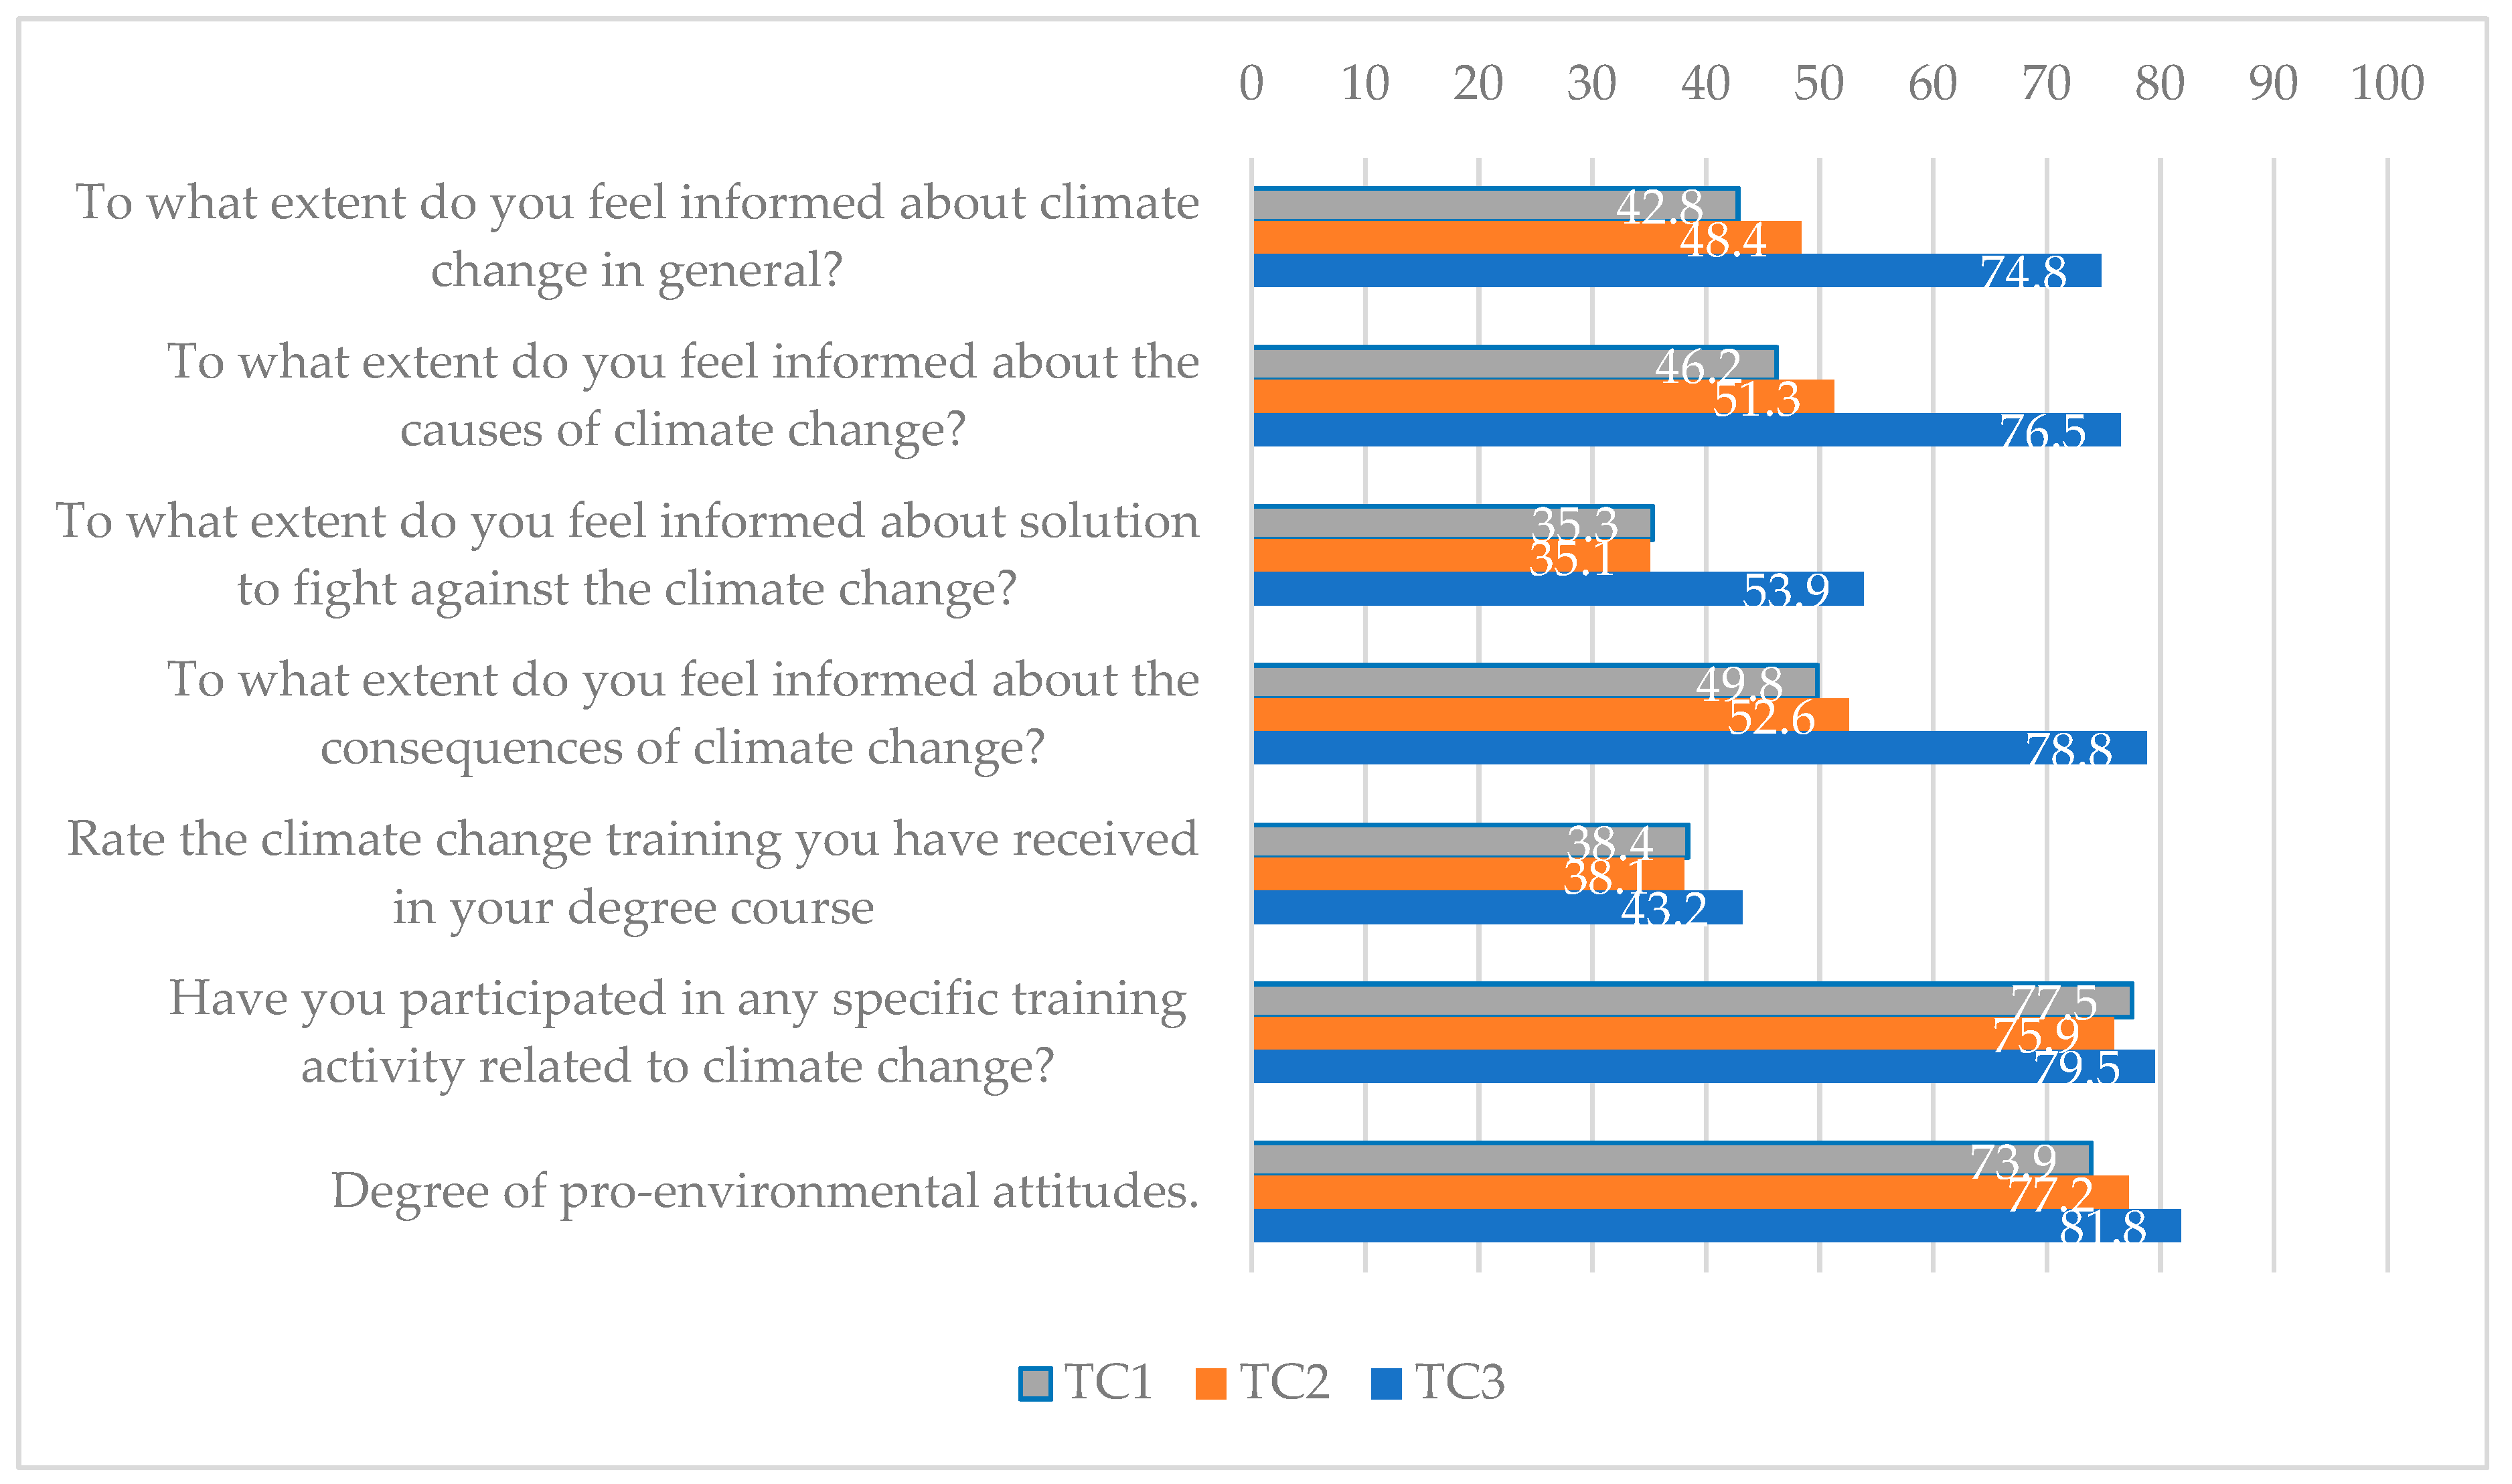
- TC#3 has greater self-perception of its level of information, followed by Territorial TC#2 and TC#1 in the following variables:
- V#1: To what extent do you feel informed about climate change in general?
- V#2: To what extent do you feel informed about the causes of climate change?
- V#4: To what extent do you feel informed about the consequences of climate change?
- TC#3 has greater self-perception of its level of information than TC#1 and TC#2 and, which are equal in this self-perception, in the following variables:
- V#3: To what extent do you feel informed about measures to combat climate change?
- V#5: Rate the training received on climate change
- V#6: Assess your degree of pro-environmental attitude
- The student samples from the three territorial contexts considered equal their percentages in the following variable:
- V#7: Have you participated in any specific training activity related to climate change?
8. Conclusions
Author Contributions
Funding
Conflicts of Interest
References
- Resolution A/RES/64/292. United Nations General Assembly, July 2010. Available online: https://www.un.org/waterforlifedecade/human_right_to_water.shtml (accessed on 25 September 2019).
- USMP. Available online: https://www.usmp.edu.pe/publicaciones/boletin/fia/info86/articulos/importanciaAgua.html (accessed on 5 September 2019).
- Guppy, L.; Anderson, K.; Mehta, P.; Nagabhatla, N. Global Water Crisis: The Facts; UNU-INWEH: Hamilton, ON, Canada, 2017; p. 5. [Google Scholar]
- Meira-Cartea, P.A.; González-Gaudiano, E.; Gutiérrez-Pérez, J. Climate Crisis and the Demand for More Empiric Research in Social Sciences: Emerging Topics and Challenges in Environmental Psychology/Crisis Climática y Demanda de Más Investigación Empírica En Ciencias Sociales: Tópicos Emergentes y Retos En Psicología Ambiental. Psyecology 2018, 9, 259–271. [Google Scholar] [CrossRef]
- Victor, D. Embed the Social Sciences in Climate Policy—David Victor. Nature 2015, 520, 7–9. [Google Scholar] [CrossRef] [PubMed]
- Intergovernmental Panel on Climate Change. Foreword, Preface, Dedication and in Memoriam. In Climate Change 2014: Mitigation of Climate Change; Cambridge University Press: Cambridge, UK, 2014; p. 189. [Google Scholar] [CrossRef]
- Cook, J.; Oreskes, N.; Doran, P.T.; Anderegg, W.R.L.; Verheggen, B.; Maibach, E.W.; Carlton, J.S.; Lewandowsky, S.; Skuce, A.G.; Green, S.A.; et al. Consensus on Consensus: A Synthesis of Consensus Estimates on Human-Caused Global Warming. Environ. Res. Lett. 2016, 11. [Google Scholar] [CrossRef]
- WWAP (World Water Assessment Programme). The United Nations World Water Development Report 4: Managing Water under Uncertainty and Risk; UNESCO: Paris, France, 2012. [Google Scholar]
- OECD. Environmental Outlook to 2050: The Consequences of Inaction; OECD: Paris, France, 2012; Available online: http://www.oecd.org/env/indicators-modelling-outlooks/oecd-environmental-outlook-1999155x.htm (accessed on 5 September 2019).
- Zou, S.; Jilili, A.; Duan, W.; Maeyer, P.D.; de Voorde, T.V. Human and Natural Impacts on the Water Resources in the Syr Darya River Basin, Central Asia. Sustainability 2019, 11, 3084. [Google Scholar] [CrossRef]
- Duan, W.; Chen, Y.; Zou, S.; Nover, D. Managing the Water-Climate- Food Nexus for Sustainable Development in Turkmenistan. J. Clean. Prod. 2019, 220, 212–224. [Google Scholar] [CrossRef]
- United Nations. Sustainable Development Goals. In Goal 6: Ensure Access to Water and Sanitation for All, Facts and Figures; United Nations: New York, NY, USA, 2016; Available online: http://www.un.org/sustainabledevelopment/water-and-sanitation/ (accessed on 5 September 2019).
- CRED (Centre for Research on the Epidemiology of Disasters). Disaster Data: A Balanced Perspective; CRED Crunch Issue 32; CRED: Brussels, Belgium, 2013; Available online: http://www.cedat.be/publications (accessed on 5 September 2019).
- Scheffran, J.; Brzoska, M.; Brauch, H.G.; Link, P.M.; Schilling, J. Climate Change, Human Security and Violent Conflict; Springer: Berlin/Heidelberg, Germany; New York, NY, USA, 2012; Available online: http://www.sciencedirect.com/science/article/pii/S096262980700039X (accessed on 5 September 2019).
- ScienceDaily. Available online: https://www.sciencedaily.com/releases/2004/06/040614081820.htm (accessed on 5 September 2019).
- Guha-Sapir, D.; Hoyois, P.; Below, R. Annual Disaster Statistical Review 2013: The Numbers and Trends. Centre for Research on the Epidemiology of Disasters (CRED); Institute of Health and Society (IRSS), Université Catholique de Louvain: Brussels, Belgium, 2014; Available online: www.cred.be/sites/default/files/ADSR_2013.pdf (accessed on 5 September 2019).
- Hutton, G.; Varughese, M. The Costs of Meeting the 2030 Sustainable Development Goals and Targets on Drinking Water, Sanitation, and Hygiene; World Bank, Water and Sanitation Program: Washington, DC, USA, 2016; Available online: https://openknowledge.worldbank.org/handle/10986/23681 (accessed on 5 September 2019).
- United Nations Environment Programme (UNEP). Towards a Green Economy: Pathways to Sustainable Development and Poverty Eradication; UNEP Press: Nairobi, Kenya, 2011; Available online: https://sustainabledevelopment.un.org/index.php?page=view&type=400&nr=126&menu=35 (accessed on 5 September 2019).
- United Nations Environment Programme (UNEP). Global Environment Outlook 4: Environment for Development; UNEP: Athens, Greece, 2007; Available online: http://www.unep.org/geo/geo/assessments/global-assessments/global-environment-outlook-4 (accessed on 5 September 2019).
- World Water Assessment Programme (WWAP). The United Nations World Water Development Report 2017: Wastewater the Untapped Resource; United Nations Educational, Scientific and Cultural Organization (UNESCO): Paris, France, 2017; Available online: http://unesdoc.unesco.org/ images/0024/002471/247153e.pdf (accessed on 5 September 2019).
- World Water Assessment Programme (WWAP). The United Nations World Water Development Report World Water Development Report: Water and Energy; United Nations Educational, Scientific and Cultural Organization (UNESCO): Paris, France, 2017; Available online: http://www.unesco.org/new/en/natural-sciences/environment/water/wwap/wwdr/2014-water-and-energy/ (accessed on 5 September 2019).
- Prüss-Üstün, A.; Neira, M. Preventing Disease through Healthy Environments: A Global Assessment of the Burden of Disease from Environmental Risks; World Health Organization: Geneva, Switzerland, 2016; Available online: http://www.who.int/quantifying_ehimpacts/publications/preventing-disease/en/ (accessed on 5 September 2019).
- Veolia and IFPRI (International Food Policy Research Institute). The Murky Future of Global Water Quality. In A White Paper; International Food Policy Research Institute: Washington, DC, USA, 2015; Available online: http://www.ifpri.org/publication/murky-future-global-water-quality-new-global-study-projects-rapid-deterioration-water (accessed on 5 September 2019).
- Ramsar Wetland Convention. Wetlands: A Global Disappearing Act. Fact Sheet 3. 2016. Available online: http://www.ramsar.org/sites/default/files/documents/library/factsheet3_global_disappearing_act_0.pdf (accessed on 5 September 2019).
- McRae, L.; Freeman, R.; Marconi, V. The Living Planet Index. In Living Planet Report 2016: Risk and Resilience in a New Era; Oerlemans, N., Ed.; WWF International: Gland, Switzerland; Available online: http://www.livingplanetindex.org/publications (accessed on 5 September 2019).
- Vié, J.; Hilton-Taylor, C.; Stuart, S.N. Wildlife in a Changing World—An Analysis of the 2008 IUCN Red List of Threatened Species; IUCN: Gland, Switzerland, 2009; Available online: https://www.iucn.org/content/wildlife-changing-world-analysis-2008-iucn-red-list-threatenedspecies%E2%84%A2 (accessed on 5 September 2019).
- Ramsar Wetland Convention. Keep Peatlands Wet for a Better Future. Fact Sheet 8. 2016. Available online: http://www.ramsar.org/sites/default/files/documents/library/fs_8_peatlands_en_v5.pdf (accessed on 5 September 2019).
- Schmidt, C.; Krauth, T.; Wagner, S. Export of Plastic Debris by Rivers into the Sea. Environ. Sci. Technol. 2017, 51, 12246–12253. [Google Scholar] [CrossRef]
- Kulp, S.A.; Strauss, B.H. New Elevation Data Triple Estimates of Global Vulnerability to Sea-Level Rise and Coastal Flooding. Nat. Commun. 2019, 10, 4844. [Google Scholar] [CrossRef]
- Water Sacarcity and Droughts in the Iberian Peninsula. Available online: https://www.wwf.es/informate/biblioteca_wwf/?52020/La-sequia-y-escasez-de-agua-amenazan-a-Espana-y-Portugal (accessed on 14 December 2019).
- Geografía Física De La Península Ibérica. Tema 1: Presentación de la Península Ibérica: Configuración y Situación. Available online: http://titulaciongeografia-sevilla.es/contenidos/profesores/materiales/archivos/2013-02-17Tema1_2013.pdf (accessed on 19 October 2019).
- Ferreras Chasco, C.; Arozena, M.E. Los Bosques. Guía Física de España; Alianza: Madrid, Spain, 1987. [Google Scholar]
- Dantin, J.; Revenga, A. Las Líneas y las Zonas Isóxeras de España según los Índices Termopluviométricos. Avance al Estudio de la Aridez en España. Estudios Geográficos 1941, 2, 35–91. [Google Scholar]
- AEMET. Available online: http://meteo.navarra.es/definiciones/koppen.cfm/ (accessed on 30 September 2019).
- AEMET. Available online: https://www.aemet.es/documentos/es/conocermas/publicaciones/Atlas-climatologico/Atlas.pdf (accessed on 19 October 2019).
- Climas de la Península Ibérica—Enciclopedia Medioambiental. Available online: https://www.ambientum.com/enciclopedia_medioambiental/atmosfera/climas-de-la-peninsula-iberica.asp (accessed on 19 October 2019).
- World Meteorological Organization. Available online: http://worldweather.wmo.int/en/city.html?cityId=1769 (accessed on 14 December 2019).
- World Meteorological Organization. Available online: http://worldweather.wmo.int/en/city.html?cityId=2196/ (accessed on 14 December 2019).
- World Meteorological Organization. Available online: http://worldweather.wmo.int/en/city.html?cityId=2221 (accessed on 14 December 2019).
- OCDE (2015). Pisa 2015. Resultados clave. Available online: http://www.oecd.org/pisa/pisa-2015-results-in-focus-ESP.pdf (accessed on 19 October 2019).
- AAAS—Project 2061—Atlas of Science Literacy. Available online: http://www.project2061.org/publications/atlas/ (accessed on 26 October 2019).
- Program, U.S.G.C.R. Climate Literacy: The Essential Principles of Climate Science. Science 2009, 17, 4. [Google Scholar]
- Moscovici, S. El Psicoanálisis, Su Imagen y Su Público; Huemul: Buenos Aires, Argentina, 1979; pp. 17–18. [Google Scholar]
- Farr, R.M. Escuelas Europeas De Psicología Social: La Investigación De Representaciones Sociales En Francia. Revista Mexicana Sociología 1983, 45, 655. [Google Scholar] [CrossRef]
- Ekins, P. Economic Growth and Environmental Sustainability: The Prospects for Green Growth; Routledge: London, UK; New York, NY, USA, 2000; p. 51. [Google Scholar]
- Bates, B.C.; Kundzewicz, Z.; Wu, S. Climate Change and Water. In Technical Paper of the Intergovernmental Panel on Climate Change; IPCC Secretariat: Geneva, Switzerland, 2008; p. 210. [Google Scholar]
- Fernández Ferrer, G.; González García, F.; Molina González, J.L. Climate Change and Water: What University Students Think. Ensen. Cienc. 2011, 29, 427–438. [Google Scholar]
- García, C. Estructura de la percepción de riesgo en torno a la escasez y el desabasto de agua global y local. Xihmai 2013, 15, 95–118. [Google Scholar]
- Gaudiano, E.; Gonzalez, A. Universitarios sobre el Cambio Climático. Un estudio de representaciones sociales: ¿Que pensam, izem e fazem os estudantes universitários sobre a mudança climática? Educar Revista 2014, 3, 35–55. [Google Scholar] [CrossRef]
- Pavez Soto, I.; León Valdebenito, C.; Triadú Figueras, V. Jóvenes universitarios y medio ambiente en Chile: Percepciones y comportamientos. Revista Latinoamericana Ciencias Sociales Niñez Juventud 2016, 14, 1435–1449. [Google Scholar] [CrossRef]
- Jaén García, M.; Palop Navarro, E. ¿Qué piensan y cómo dicen que actúan los alumnos y profesores de un centro de educación secundaria sobre la gestión del agua, la energía y los residuos? Enseñanza Ciencias 2011, 29, 61–74. [Google Scholar]
- CIIFEN—Efecto Invernadero. Available online: http://www.ciifen.org/index.php?option=com_content&view=category&layout=blog&id=99&Itemid=342&lang=es (accessed on 19 October 2019).
- Veliz, N. El Cambio Climático y su incidencia en enfermedades tropicales. Dominio Ciencias 2019, 5, 459–487. [Google Scholar] [CrossRef]
- Semenza, J.C.; Menne, B. Climate Change and infectious diseases in Europe. Lancet Infect. Dis. 2009, 365–375. [Google Scholar] [CrossRef]
- Herring, S.C.; Christidis, N.; Hoell, A.; Kossin, J.P.; Schreck, C.J.; Stott, P.A. Explaining extreme events of 2016 from a climate perspective. Bull. Am. Meteorol. Soc. 2018, 99, 1–5. [Google Scholar] [CrossRef]
- Knutson, T.R.; Kam, J.; Zeng, F.; Wittenberg, A.T. CMIP5 Model-based assessment of anthropogenic influence on record global warmth during 2016. Bull. Am. Meteorol. Soc. 2018, 99, S11–S15. [Google Scholar] [CrossRef]
- Sippel, S.; El-Madany, T.S.; Migliavacca, M.; Mahecha, M.D.; Carrara, A.; Flach, M.; Kaminski, T.; Otto, F.E.L.; Thonicke, K.; Vossbeck, M.; et al. Warm winter, wet spring, and an extreme response in ecosystem functioning on the Iberian Peninsula. Bull. Am. Meteorol. Soc. 2018, 99, S80–S85. [Google Scholar] [CrossRef]
- Thompson, D.W.J.; Solomon, S.; Kushner, P.J.; England, M.H.; Grise, K.M.; Karoly, D.J. Signatures of the Antarctic ozone hole in Southern Hemisphere surface Climate Change. Nat. Geosci. 2011, 4, 741–749. [Google Scholar] [CrossRef]
- Lluvia ácida|National Geographic. Available online: https://www.nationalgeographic.es/medio-ambiente/lluvia-acida (accessed on 23 October 2019).
- Willett, W.; Rockström, J.; Loken, B.; Springmann, M.; Lang, T.; Vermeulen, S.; Garnett, T.; Tilman, D.; DeClerck, F.; Wood, A.; et al. Food in the Anthropocene: The EAT–Lancet Commission on Healthy Diets from Sustainable Food Systems. Lancet 2019, 447–492. [Google Scholar] [CrossRef]
- Intergovernmental Panel on Climate Change. Agriculture, Forestry and Other Land Use (AFOLU). In Climate Change 2014: Mitigation of Climate Change; Cambridge University Press: Cambridge, UK, 2015; pp. 811–922. [Google Scholar] [CrossRef]
- Nerem, R.S.; Beckley, B.D.; Fasullo, J.T.; Hamlington, B.D.; Masters, D.; Mitchum, G.T. Climate-Change driven accelerated sea level rise detected in the altimeter era. Proc. Natl. Acad. Sci. USA 2018, 115, 2022–2025. [Google Scholar] [CrossRef] [PubMed]
- Wu, S.; Bates, B.; Australia, C.; Kundzewicz, Z.W.; Palutikof, J. Grupo Intergubernamental de Expertos sobre el Cambio Climático. Cambio Climático. 2008. Available online: https://www.ipcc.ch/site/assets/uploads/2018/03/climate-change-water-sp.pdf?fbclid=IwAR3tsD2xvAVC4ovPp0Is34Chx60EoT8aE0A7nrXniJE9bkH8a6kzkSbxgXk (accessed on 5 September 2019).
- Spinoni, J.; Barbosa, P.; Dosio, A.; McCormick, N.; Vogt, J. Is Europe at risk of desertification due to Climate Change? In Proceedings of the 20th EGU General Assembly EGU2018, Vienna, Austria, 4–13 April 2018; Volume 20, p. 9557. [Google Scholar]
- Le Maitre, D.C.; Versfeld, D.B. Forest evaporation models: Relationships between stand growth and evaporation. J. Hydrol. 1997, 193, 240–257. [Google Scholar] [CrossRef]
- Lázaro, L.; González, C.; Escribano, G. Los españoles ante el Cambio Climático 2019. Real Instituto Elcano. Available online: http://www.realinstitutoelcano.org/wps/portal/rielcano_es/contenido?WCM_GLOBAL_CONTEXT=/elcano/elcano_es/zonas_es/encuesta-espanoles-ante-cambio-climatico-sep-2019 (accessed on 5 September 2019).
- Comisión Europea. Eurobarómetro Especial 313. In Actitudes de los europeos hacia el Cambio Climático; European Comission: Brussels, Belgium, 2009. [Google Scholar]
- Eurobarómetro 2019. Available online: https://ec.europa.eu/spain/sites/spain/files/st90_-_report_repes_-_vf110219_limpia_.pdf (accessed on 24 October 2019).
- Bostrom, A.; Granger Morgan, M.; Fischhoff, B.; Read, D. What Do People Know About Global Climate Change? 1. Mental Models. Risk Anal. 1994, 14, 959–970. [Google Scholar] [CrossRef]
- Ungar, S. Knowledge, Ignorance and the Popular culture: Climate Change versus the ozone hole. Public Underst. Sci. 2000, 9, 297–312. [Google Scholar] [CrossRef]
- Edgar, G.G.; Meira Cartea, P. Educación, comunicación y Cambio Climático. Resistencias para la acción social responsable: Education, communication and Climate Change. Trayectorias 2009, 11, 6–38. [Google Scholar]
- Correa, M. Cambio climático y representaciones sociales entre estudiantes de educación superior. In En Ortiz y Velasco (Coords.), La percepción social del Cambio Climático; Ibero Puebla/Semarnat: México City, Mexico, 2012; pp. 108–122. [Google Scholar]
- Escoz-Roldán, A.; Arto-Blanco, M.; Meira-Cartea, P.Á.; Gutiérrez-Pérez, J. Social representations of Climate Change among Spanish university students of the Social Sciences and Humanities. Int. J. Interdiscip. Environ. Stud. 2019, 13, 1–14. [Google Scholar] [CrossRef]
- Padilla, R. Social Representations of Climate Change among students from Helsinki region universities. Ph.D. Thesis, Helsinki University, Helsinki, Finland, 2010. [Google Scholar]
- Kindelan, C. Percepción, información y comunicación del Cambio Climático: Conocimiento en estudiantes universitarios. Ph.D. Thesis, Universidad de Las Palmas de Gran Canaria, Gran Canaria, Spain, 2013. [Google Scholar]
- Siegner, A.; Stapert, N. Climate Change education in the Humanities classroom: A case study of the lowell school curriculum pilot. Environ. Educ. Res. 2019. [Google Scholar] [CrossRef]


| Territorial Context 1 (TC#1): Granada. Andalucía. Southern Spain: Warm and Temperate Climate |
|---|
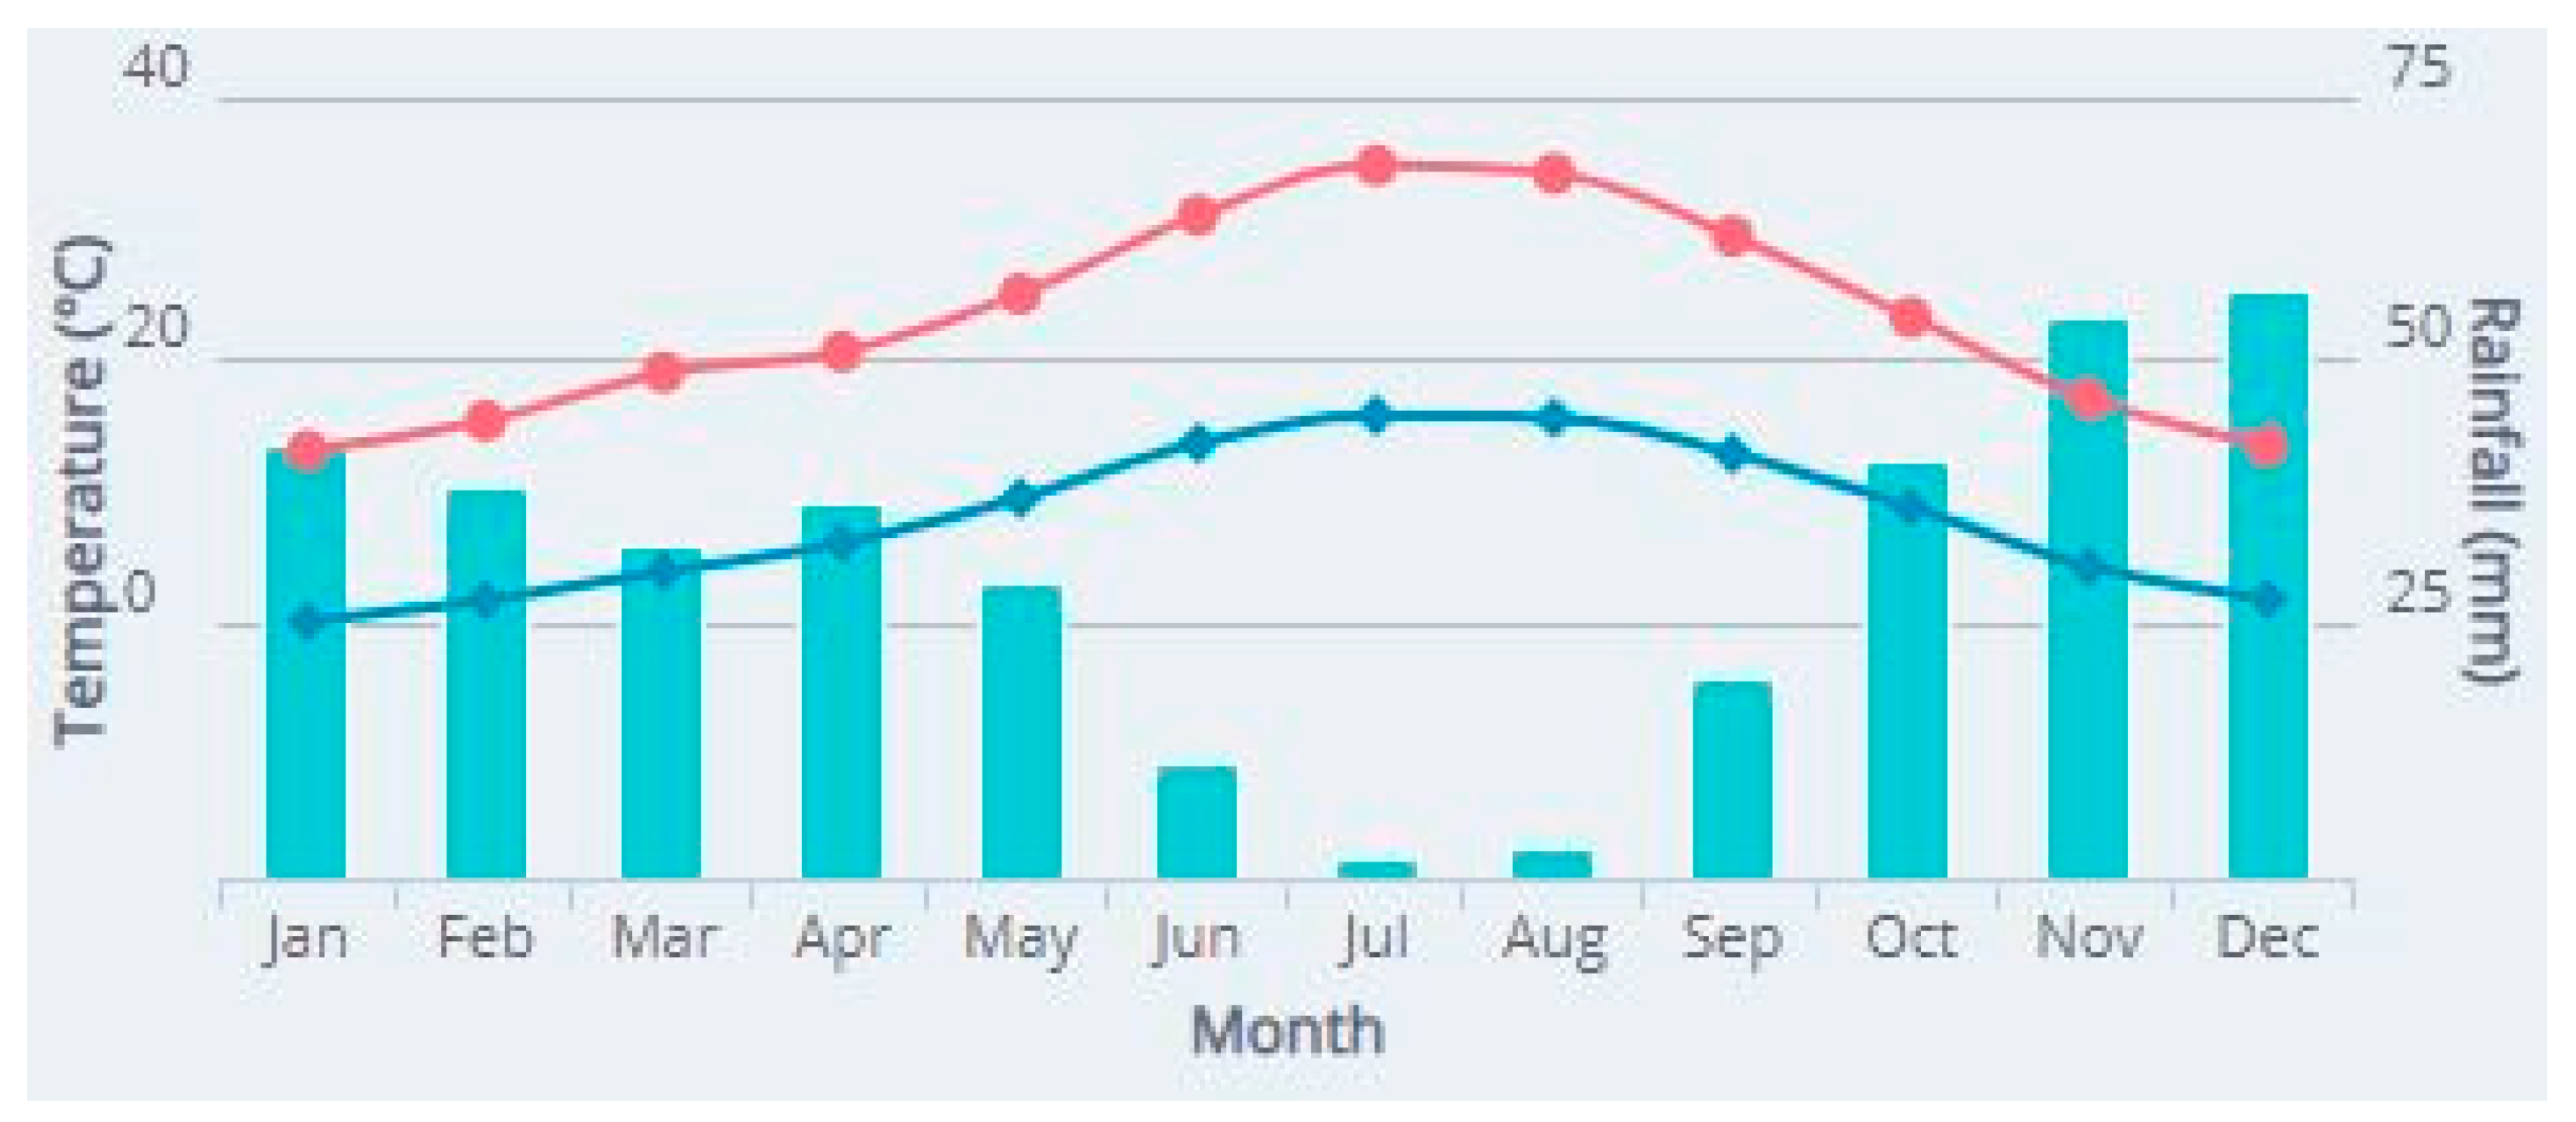
| The winter months are much rainier than the summer months. According to the Köppen classification the climate of this territory is classified as Mediterranean typical of warm summer (Csa). The average annual temperature is 15.5 °C, with average annual rainfall of 450 mm. The driest month is July, with 5 mm. Most of the precipitation in this territory falls in December, approximately 63 mm. The hottest month of the year is July with an average of 25.5 °C and January is the coldest month with average temperatures of 7.0 °C. The difference in precipitation between the driest month and the rainiest month is 58 mm. Throughout the year, temperatures vary around 18.5 °C. Average environmental humidity level. |
| Territorial Context 2 (TC#2): Santiago de Compostela. Galicia. Northern Spain: Warm and Temperate Climate |
|---|
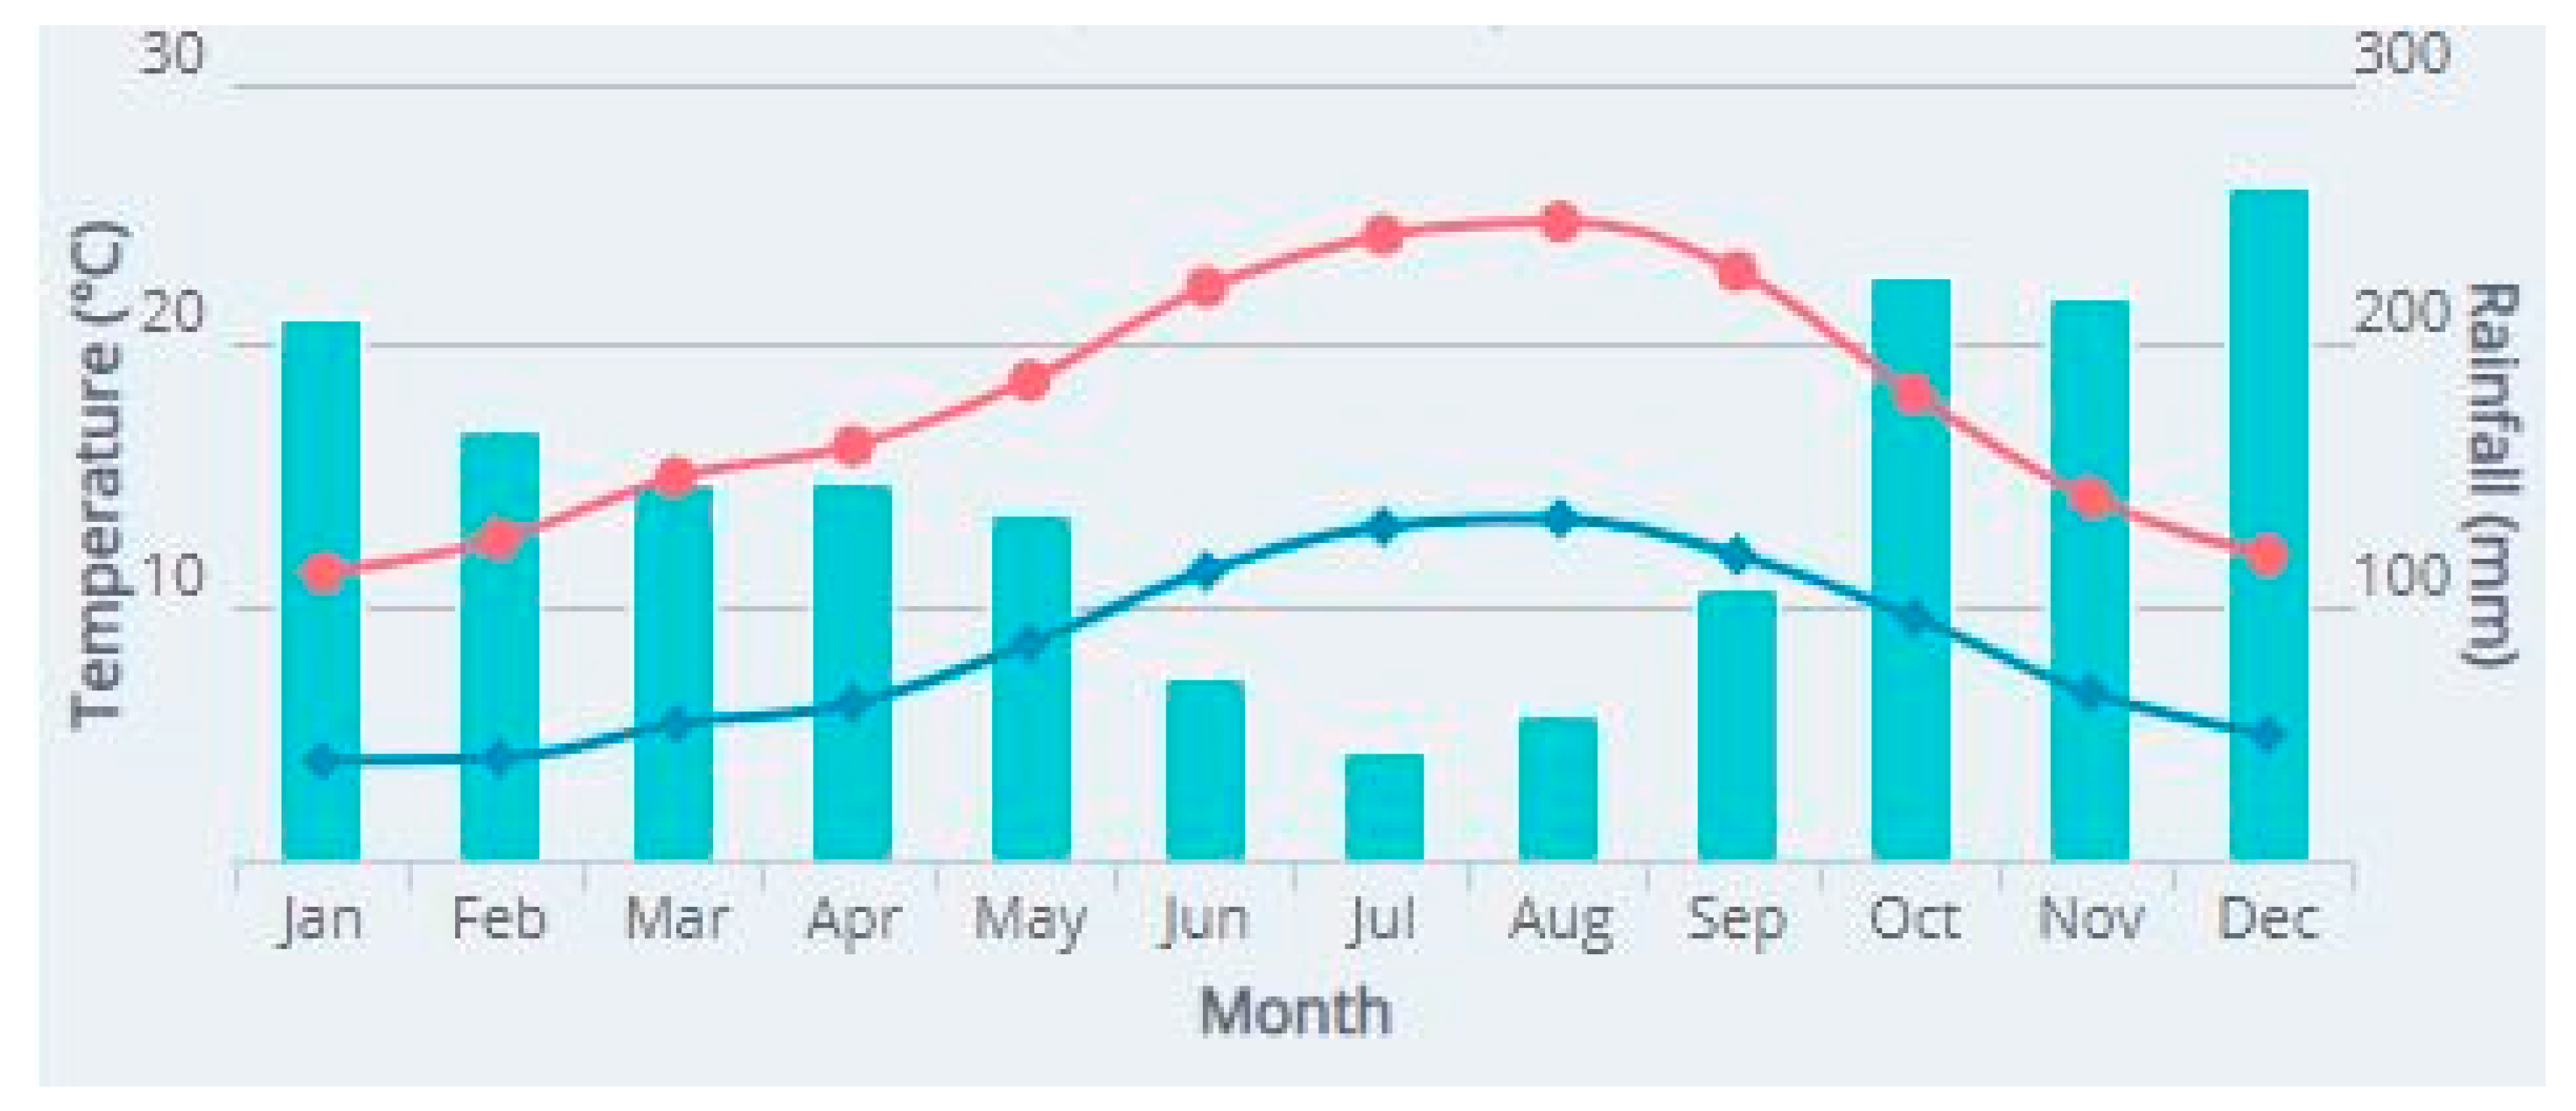
| The vast majority of rain in this city falls in winter and is relatively scarce in summer. The climate classification of Köppen for this place is Mediterranean oceanic mild summer (Csb). The average temperature is 13.6 °C, the average annual rainfall is 1325 mm and the driest month is July, with 36 mm. In December, precipitation peaks, with an average of 191 mm/m3. The hottest month of the year is August with an average temperature of 20.3 °C. January is the coldest month of the year with an average temperature of 8.7 °C. The difference in precipitation between the driest month and the rainiest month is 155 mm and the variation in annual temperature is around 11.6 °C. The difference in precipitation between the driest month and the rainiest month is 155 mm and the variation in annual temperature is around 11.6 °C. Average environmental humidity level. |
| Territorial Context 3 (TC#3): Braga. North Portugal: Warm and temperate climate. |
|---|
| There is more rainfall in winter than in summer and this location is included in the category of Mediterranean oceanic mild summer climate (Csb) in the Köppen classification. The average annual temperature is 14.2 °C and the average annual rainfall is approximately 1252 mm. The driest month is July, with 16 mm of rain. With an average of 170 mm, the rainiest month is December and July is considered the warmest month of the year with an average temperature of 20.3 °C. The rainiest month is December and July is considered the warmest month of the year with an average temperature of 20.3 °C. January has the lowest average temperature of the year, with 8.4 °C, and an estimated difference of 154 mm of precipitation between the driest and wettest months. During the year, average temperatures vary by 11.9 °C. The level of environmental humidity is average. |
| Territorial Context | Sample | % |
|---|---|---|
| TC#1 | 505 | 29.5% |
| TC#2 | 644 | 37.7% |
| TC#3 | 560 | 32.8% |
| TOTAL | 1709 | 100% |
| Dimensions | Item Nº |
|---|---|
| Biophysical processes related to CC | 1, 4, 6, 8, 15 |
| Consequences of CC | 2, 3, 9, 10, 12, 14 |
| Causes of CC | 7 |
| Solutions to fight against the CC | 5, 11, 13, |
| Independent Variables |
|---|
|
| Dependent Variables |
|---|
| V#1. The greenhouse effect is a natural phenomenon. V#2. A warmer planet will expand the area of incidence of tropical diseases. V#3. The increase in temperatures will contribute to the occurrence of extreme atmospheric phenomena (cyclones, hurricanes, floods, etc.). V#4. The polar hole of the ozone causes the melting of the poles. V#5. If we stop emitting greenhouse gases, we will not be affected by climate change. V#6. Acid rain is one of the causes of climate change. V#7. Increased meat consumption contributes to climate change. V#8. The greenhouse effect puts life on Earth at risk. V#9. The sea level is rising due to the expansion of water due to the rise in temperature. V#10. Climate change will decrease rainfall in my country. V#11. If we stop emitting greenhouse gases, we will be less vulnerable to climate change. V#12. Climate change will exacerbate desertification problems in the Iberian Peninsula. V#13. Climate change would be reduced if we planted more trees. V#14. Many islands and coastal areas will be submerged by climate change. V#15. The greenhouse effect is caused by human activity. |
| Dimension | Sig. between TC | ||||
|---|---|---|---|---|---|
| F | Sig. | TC#1-TC#2 | TC#1-TC#3 | TC#2-TC#3 | |
| Biophysical processes related to CC | 8.572 | 0.000 ** | 0.838 | 0.008 ** | 0.000 ** |
| Consequences of CC | 14.750 | 0.000 ** | 0.000 ** | 0.651 | 0.000 ** |
| Causes of CC | 3.916 | 0.020 * | 0.990 | 0.053 | 0.053 |
| Solutions to fight against CC | 1.673 | 0.188 | 0.194 | 0.738 | 0.584 |
| Dimension | Sig. between TC | Correct Response % | ||||||
|---|---|---|---|---|---|---|---|---|
| F | Sig | TC#1-TC#2 | TC#1-TC#3 | TC#2-TC#3 | TC#1 | TC#2 | TC#3 | |
| Biophysical processes related to CC | ||||||||
| 1. The greenhouse effect is a natural phenomenon | 20.028 | 0.000 ** | 0.991 | 0.000 ** | 0.000 ** | 42.2 | 45.3 | 29.1 |
| 4. The polar hole of the ozone causes the melting of the poles | 1.363 | 0.256 | 0.852 | 0.274 | 0.530 | 13.5 | 11.4 | 9.5 |
| 6. Acid rain is one of the causes of climate change | 0.794 | 0.452 | 0.989 | 0.527 | 0.577 | 33.1 | 33.7 | 32.5 |
| 8. The greenhouse effect puts life on Earth at risk | 8.652 | 0.000 ** | 0.987 | 0.004 ** | 0.001 ** | 24.9 | 26.1 | 34.1 |
| 15. The greenhouse effect is caused by human activity | 8.652 | 0.000 ** | 0.446 | 0.031 * | 0.000 ** | 28.1 | 26.7 | 35.2 |
| Consequences of CC | ||||||||
| 2. A warmer planet will expand the area of incidence of tropical diseases | 13.151 | 0.000 ** | 0.434 | 0.000 ** | 0.001 ** | 85.3 | 86.3 | 93.5 |
| 3. The increase in temperatures will contribute to the occurrence of extreme atmospheric phenomena (cyclones, hurricanes, floods, etc.) | 5.429 | 0.004 ** | 0.007 ** | 0.039 * | 0.873 | 89.9 | 95.8 | 93.4 |
| 9. The sea level is rising due to the expansion of water due to the rise in temperature | 6.462 | 0.002 ** | 0.020 * | 0.003 ** | 0.751 | 63.2 | 96.5 | 72.3 |
| 10. Climate change will decrease rainfall in my country | 75.847 | 0.000 ** | 0.332 | 0.000 ** | 0.000 ** | 57.4 | 52.8 | 25.9 |
| 12. Climate change will exacerbate desertification problems in the Iberian Peninsula | 47.564 | 0.000 ** | 0.006 ** | 0.000 ** | 0.000 ** | 86.9 | 93.5 | 75.8 |
| 14. Many islands and coastal areas will be submerged by climate change | 12.769 | 0.000 ** | 0.000 ** | 0.000 ** | 0.977 | 92.7 | 95.8 | 98.3 |
| Causes of CC | ||||||||
| 7. Increased meat consumption contributes to climate change | 3.916 | 0.020 ** | 0.990 | 0.053 | 0.053 | 35.7 | 35.6 | 28.7 |
| Solutions to fight against CC | ||||||||
| 5. If we stop emitting greenhouse gases we will not be affected by climate change. | 2.720 | 0.066 | 0.446 | 0.031 | 0.000 ** | 68.3 | 74.6 | 68.1 |
| 11. If we stop emitting greenhouse gases we will be less vulnerable to climate change. | 4.934 | 0.007 ** | 0.119 | 0.685 | 0.010 ** | 22.6 | 19.4 | 23.2 |
| 13. Climate change would be reduced if we planted more trees. | 6.268 | 0.002 ** | 0.843 | 0.033 ** | 0.003 ** | 70.1 | 66.8 | 77.1 |
| ITEMS | TC#1 | TC#2 | TC#3 |
|---|---|---|---|
| Sig./F | Sig./F | Sig./F | |
| 1. The greenhouse effect is a natural phenomenon. | 0.022 */3.251 | 0.061/2.264 | 0.000 **/6.388 |
| 2. A warmer planet will expand the area of incidence of tropical diseases. | 0.033 */3.746 | 0.000 **/5.660 | 0.006 **/4.153 |
| 3. The increase in temperatures will contribute to the occurrence of extreme atmospheric phenomena (cyclones, hurricanes, floods, etc.). | 0.596/0.630 | 0.019 */2.984 | 0.004 **/4.470 |
| 4. The polar hole of the ozone causes the melting of the poles. | 0.761/0.389 | 0.347/1.117 | 0.168/1.688 |
| 5. If we stop emitting greenhouse gases we will not be affected by climate change. | 0.059/2.503 | 0.000 **/5.892 | 0.130/1.892 |
| 6. Acid rain is one of the causes of climate change. | 0.373/1.042 | 0.170/1.608 | 0.634/0.571 |
| 7. Increased meat consumption contributes to climate change. | 0.007 **/4.085 | 0.000 **/5.482 | 0.003 **/4.650 |
| 8. The greenhouse effect puts life on Earth at risk. | 0.150/1.780 | 0.227/1.415 | 0.739/0.420 |
| 9. The sea level is rising due to the expansion of water due to the rise in temperature. | 0.198/1.562 | 0.993/0.064 | 0.888/0.212 |
| 10. Climate change will decrease rainfall in my country. | 0.096/2.129 | 0.803/0.408 | 0.654/0.541 |
| 11. If we stop emitting greenhouse gases we will be less vulnerable to climate change. | 0.028 */3.061 | 0.176/1.586 | 0.023 */3.206 |
| 12. Climate change will exacerbate desertification problems in the Iberian Peninsula. | 0.000 **/6.696 | 0.001 **/4.908 | 0.000 **/7.712 |
| 13. Climate change would be reduced if we planted more trees. | 0.010 **/3.793 | 0.001 **/4.701 | 0.184/1.619 |
| 14. Many islands and coastal areas will be submerged by climate change. | 0.011 */4.628 | 0.025 */2.797 | 0.034 */2.913 |
| 15. The greenhouse effect is caused by human activity. | 0.022 */3.255 | 0.054/2.341 | 0.084/2.225 |
| ÍTEMS | TC#1 | TC#2 | CT#3 |
|---|---|---|---|
| Sig./F | Sig./F | Sig./F | |
| 1. The greenhouse effect is a natural phenomenon. | 0.003 **/4.770 | 0.460/906 | 0.002 **/4.211 |
| 2. A warmer planet will expand the area of incidence of tropical diseases. | 0.001 **/5.483 | 0.111/1.885 | 0.239/1.381 |
| 3. The increase in temperatures will contribute to the occurrence of extreme atmospheric phenomena (cyclones, hurricanes, floods, etc.). | 0.201/1.548 | 0.003 **/3.982 | 0.001 **/1.388 |
| 4. The polar hole of the ozone causes the melting of the poles. | 0.830/0.294 | 0.009 **/3.394 | 0.237/1.688 |
| 5. If we stop emitting greenhouse gases we will not be affected by climate change. | 0.582/0.651 | 0.049 */2.400 | 0.062/2.252 |
| 6. Acid rain is one of the causes of climate change. | 0.781/0.361 | 0.970/0.133 | 0.850/0.341 |
| 7. Increased meat consumption contributes to climate change. | 0.027 */3.082 | 0.004 **/3.938 | 0.056/2.318 |
| 8. The greenhouse effect puts life on Earth at risk. | 0.120/1.955 | 0.092/2.009 | 0.191/0.1535 |
| 9. The sea level is rising due to the expansion of water due to the rise in temperature. | 0.198/1.562 | 0.196/1.516 | 0.525/0.801 |
| 10. Climate change will decrease rainfall in my country. | 0.413/0.956 | 0.661/0.602 | 0.909/0.251 |
| 11. If we stop emitting greenhouse gases we will be less vulnerable to climate change. | 0.025 */3.147 | 0.301/1.220 | 0.932/0.212 |
| 12. Climate change will exacerbate desertification problems in the Iberian Peninsula. | 0.001 **/5.975 | 0.001 **/4.741 | 0.000 **/7.360 |
| 13. Climate change would be reduced if we planted more trees. | 0.094/2.141 | 0.000/6.355 | 0.018 **/3.004 |
| 14. Many islands and coastal areas will be submerged by climate change. | 0.002 **/50174 | 0.025 */2.797 | 0.026 **/2.792 |
| 15. The greenhouse effect is caused by human activity. | 0.009 **/3.910 | 0.611/0.672 | 0.180/1.573 |
| ÍTEMS | TC#1 | TC#2 | TC#3 |
|---|---|---|---|
| Sig./F | Sig./F | Sig./F | |
| 1. The greenhouse effect is a natural phenomenon. | 0.026 */3.115 | 0.081/2.089 | 0.182/1.567 |
| 2. A warmer planet will expand the area of incidence of tropical diseases. | 0.033 **/3.746 | 0.241/1.375 | 0.071/2.167 |
| 3. The increase in temperatures will contribute to the occurrence of extreme atmospheric phenomena (cyclones, hurricanes, floods, etc.). | 0.681/0.502 | 0.280/1.271 | 0.001 */4.761 |
| 4. The polar hole of the ozone causes the melting of the poles. | 0.443/0.896 | 0.394/1.025 | 0.233/1.399 |
| 5. If we stop emitting greenhouse gases we will not be affected by climate change. | 0.891/0.208 | 0.073/2.149 | 0.817/0.388 |
| 6. Acid rain is one of the causes of climate change. | 0.798/0.337 | 0.259/1.327 | 0.046 **/2.445 |
| 7. Increased meat consumption contributes to climate change. | 0.368/1.056 | 0.218/1.443 | 0.046 **/2.446 |
| 8. The greenhouse effect puts life on Earth at risk. | 0.063/1.955 | 0.208/1.474 | 0.429/0.960 |
| 9. The sea level is rising due to the expansion of water due to the rise in temperature. | 0.843/276 | 0.379/1.053 | 0.670/0.590 |
| 10. Climate change will decrease rainfall in my country. | 0.197/1.564 | 0.028 **/2.730 | 0.473/0.884 |
| 11. If we stop emitting greenhouse gases we will be less vulnerable to climate change. | 0.486/0.815 | 0.875/0.305 | 0.130/1.789 |
| 12. Climate change will exacerbate desertification problems in the Iberian Peninsula. | 0.383/1.020 | 0.256/1.335 | 0.003 **/4.104 |
| 13. Climate change would be reduced if we planted more trees. | 0.328/1.152 | 0.116/1.858 | 0.002 **/4.420 |
| 14. Many islands and coastal areas will be submerged by climate change. | 0.358/4.628 | 0.502/0.836 | 0.144/1.719 |
| 15. The greenhouse effect is caused by human activity. | 0.105/1.079 | 0.004 **/3.841 | 0.276/1.283 |
| ÍTEMS | TC#1 | TC#2 | TC#3 |
|---|---|---|---|
| Sig./F | Sig./F | Sig./F | |
| 1. The greenhouse effect is a natural phenomenon. | 0.057/2.525 | 0.002 **/4.292 | 0.002 **/4.414 |
| 2. A warmer planet will expand the area of incidence of tropical diseases. | 0.033 */3.746 | 0.057/2.307 | 0.018 */3.000 |
| 3. The increase in temperatures will contribute to the occurrence of extreme atmospheric phenomena (cyclones, hurricanes, floods, etc.). | 0.005/4.363 | 0.200/1.501 | 0.000 **/6.743 |
| 4. The polar hole of the ozone causes the melting of the poles. | 0.635/0.570 | 0.118/1.846 | 0.014 */3.156 |
| 5. If we stop emitting greenhouse gases we will not be affected by climate change. | 0.506/0.780 | 0.020 **/2.954 | 0.117/1.855 |
| 6. Acid rain is one of the causes of climate change. | 0.469/0.847 | 0.065/2.223 | 0.762/0.464 |
| 7. Increased meat consumption contributes to climate change. | 0.030 **/3.002 | 0.007 */3.545 | 0.296/1.231 |
| 8. The greenhouse effect puts life on Earth at risk. | 0.44/0.893 | 0.115/1.864 | 0.190/1.538 |
| 9. The sea level is rising due to the expansion of water due to the rise in temperature. | 0.528/0.742 | 0.623/0.656 | 0.790/0.425 |
| 10. Climate change will decrease rainfall in my country. | 0.200/1.552 | 0.356/1.098 | 0.677/0.580 |
| 11. If we stop emitting greenhouse gases we will be less vulnerable to climate change. | 0.473/0.838 | 0.661/0.602 | 0.397/1.019 |
| 12. Climate change will exacerbate desertification problems in the Iberian Peninsula. | 0.002 **/4.987 | 0.000 **/5.570 | 0.000 **/6.179 |
| 13. Climate change would be reduced if we planted more trees. | 0.010 **/3.793 | 0.001 **/4.563 | 0.072/2.161 |
| 14. Many islands and coastal areas will be submerged by climate change. | 0.084/2.227 | 0.034 */2.623 | 0.025 */2.820 |
| 15. The greenhouse effect is caused by human activity. | 0.137/1.854 | 0.029 */2.707 | 0.031 */2.683 |
| ÍTEMS | TC#1 | TC#2 | TC#3 |
|---|---|---|---|
| Sig./F | Sig./F | Sig./F | |
| 1. The greenhouse effect is a natural phenomenon. | 0.000 **/10.259 | 0.001 **/4.111 | 0.021 */2.675 |
| 2. A warmer planet will expand the area of incidence of tropical diseases. | 0.033 */3.746 | 0.218/1.411 | 0.861/0.383 |
| 3. The increase in temperatures will contribute to the occurrence of extreme atmospheric phenomena (cyclones, hurricanes, floods, etc.). | 0.737/0.498 | 0.162/1.585 | 0.286/1.246 |
| 4. The polar hole of the ozone causes the melting of the poles. | 0.753/0.477 | 0.034 */2.422 | 0.676/0.632 |
| 5. If we stop emitting greenhouse gases we will not be affected by climate change. | 0.036 */2.598 | 0.004 **/3.503 | 0.682/0.682 |
| 6. Acid rain is one of the causes of climate change. | 0.006 **/3.625 | 0.172/1.552 | 0.444/0.957 |
| 7. Increased meat consumption contributes to climate change. | 0.067/2.211 | 0.00 */8.308 | 0.496/0.877 |
| 8. The greenhouse effect puts life on Earth at risk. | 0.012*/3.237 | 0.969/0.182 | 0.016 */2.809 |
| 9. The sea level is rising due to the expansion of water due to the rise in temperature. | 0.030 */2.709 | 0.428/0.982 | 0.433/0.973 |
| 10. Climate change will decrease rainfall in my country. | 0.582/0.715 | 0.008 */3.147 | 0.182/1.520 |
| 11. If we stop emitting greenhouse gases we will be less vulnerable to climate change. | 0.596/0.694 | 0.549/0.801 | 0.413/1.006 |
| 12. Climate change will exacerbate desertification problems in the Iberian Peninsula. | 0.041 */2.506 | 0.161/1.588 | 0.219/1.411 |
| 13. Climate change would be reduced if we planted more trees. | 0.690/0.562 | 0.000 */6.075 | 0.353/1.111 |
| 14. Many islands and coastal areas will be submerged by climate change. | 0.153/1.679 | 0.025 */2.797 | 0.526/0.834 |
| 15. The greenhouse effect is caused by human activity. | 0.002 **/4.281 | 0.038/2.370 | 0.010 **/3.030 |
| ÍTEMS | TC#1 | TC#2 | TC#3 |
|---|---|---|---|
| Sig./F | Sig./F | Sig./F | |
| 1. The greenhouse effect is a natural phenomenon. | 0.085/2.056 | 0.444/0.957 | 0.029 */2.729 |
| 2. A warmer planet will expand the area of incidence of tropical diseases. | 0.033/3.746 | 0.017 */2.768 | 0.006/3.607 |
| 3. The increase in temperatures will contribute to the occurrence of extreme atmospheric phenomena (cyclones, hurricanes, floods, etc.). | 0.553/0.759 | 0.000 **/5.369 | 0.020 */2.948 |
| 4. The polar hole of the ozone causes the melting of the poles. | 0.120/1.838 | 0.109/1.810 | 0.646/0.624 |
| 5. If we stop emitting greenhouse gases we will not be affected by climate change. | 0.367/1.077 | 0.312/1.192 | 0.742/0.491 |
| 6. Acid rain is one of the causes of climate change. | 0.251/1.349 | 0.720/0.573 | 0.237/1.387 |
| 7. Increased meat consumption contributes to climate change. | 0.001 **/4.819 | 0.11 */3.019 | 0.081/2.090 |
| 8. The greenhouse effect puts life on Earth at risk. | 0.862/0.324 | 0.796/0.474 | 0.094/1.991 |
| 9. The sea level is rising due to the expansion of water due to the rise in temperature. | 0.715/0.528 | 0.235/1.365 | 0.087/2.042 |
| 10. Climate change will decrease rainfall in my country. | 0.006 **/3.704 | 0.116/1.774 | 0.769/0.454 |
| 11. If we stop emitting greenhouse gases we will be less vulnerable to climate change. | 0.017 */3.050 | 0.090/1.911 | 0.736/0.500 |
| 12. Climate change will exacerbate desertification problems in the Iberian Peninsula. | 0.002 **/4.182 | 0.000 **/6.098 | 0.000 **/7.638 |
| 13. Climate change would be reduced if we planted more trees. | 0.041 */2.510 | 0.000 **/4.493 | 0.008 **/3.506 |
| 14. Many islands and coastal areas will be submerged by climate change. | 0.002/4.329 | 0.000/4.989 | 0.023/2.857 |
| 15. The greenhouse effect is caused by human activity. | 0.231/1.406 | 0.075/2.014 | 0.006/3.615 |
| ÍTEMS | TC#1 | TC#2 | TC#3 |
|---|---|---|---|
| Sig./F | Sig./F | Sig./F | |
| 1. The greenhouse effect is a natural phenomenon. | 0.222/1.497 | 0.199/1.617 | 0.041 */3.224 |
| 2. A warmer planet will expand the area of incidence of tropical diseases. | 0.033 */3.746 | 0.569/0.564 | 0.001 **/7.332 |
| 3. The increase in temperatures will contribute to the occurrence of extreme atmospheric phenomena (cyclones, hurricanes, floods, etc.). | 0.142/2.160 | 0.021 */3.888 | 0.027 */3.635 |
| 4. The polar hole of the ozone causes the melting of the poles. | 0.451/0.568 | 0.771/0.261 | 0.841/0.174 |
| 5. If we stop emitting greenhouse gases we will not be affected by climate change. | 0.585/0.298 | 0.536/0.625 | 0.254/1.375 |
| 6. Acid rain is one of the causes of climate change. | 0.239/1.390 | 0.128/2.064 | 0.572/0.560 |
| 7. Increased meat consumption contributes to climate change. | 0.000 **/13.977 | 0.04 **/5.621 | 0.015 */4.207 |
| 8. The greenhouse effect puts life on Earth at risk. | 0.419/0.654 | 0.476/0.744 | 0.957/0.044 |
| 9. The sea level is rising due to the expansion of water due to the rise in temperature. | 0.135/2.244 | 0.296/1.220 | 0.001 **/6.879 |
| 10. Climate change will decrease rainfall in my country. | 0.052/3.808 | 0.411/0.891 | 0.461/0.775 |
| 11. If we stop emitting greenhouse gases we will be less vulnerable to climate change. | 0.688/0.161 | 0.434/0.837 | 0.158/1.851 |
| 12. Climate change will exacerbate desertification problems in the Iberian Peninsula. | 0.094/2.822 | 0.033 */3.426 | 0.014 */4.311 |
| 12. Climate change will exacerbate desertification problems in the Iberian Peninsula. | 0.095/2.804 | 0.123/2.102 | 0.221/1.512 |
| 14. Many islands and coastal areas will be submerged by climate change. | 0.141/2.172 | 0.196/1.635 | 0.331/1.109 |
| 15. The greenhouse effect is caused by human activity. | 0.334/0.936 | 0.138/1.984 | 0.030 */3.531 |
© 2019 by the authors. Licensee MDPI, Basel, Switzerland. This article is an open access article distributed under the terms and conditions of the Creative Commons Attribution (CC BY) license (http://creativecommons.org/licenses/by/4.0/).
Share and Cite
Escoz-Roldán, A.; Gutiérrez-Pérez, J.; Meira-Cartea, P.Á. Water and Climate Change, Two Key Objectives in the Agenda 2030: Assessment of Climate Literacy Levels and Social Representations in Academics from Three Climate Contexts. Water 2020, 12, 92. https://doi.org/10.3390/w12010092
Escoz-Roldán A, Gutiérrez-Pérez J, Meira-Cartea PÁ. Water and Climate Change, Two Key Objectives in the Agenda 2030: Assessment of Climate Literacy Levels and Social Representations in Academics from Three Climate Contexts. Water. 2020; 12(1):92. https://doi.org/10.3390/w12010092
Chicago/Turabian StyleEscoz-Roldán, Amor, José Gutiérrez-Pérez, and Pablo Ángel Meira-Cartea. 2020. "Water and Climate Change, Two Key Objectives in the Agenda 2030: Assessment of Climate Literacy Levels and Social Representations in Academics from Three Climate Contexts" Water 12, no. 1: 92. https://doi.org/10.3390/w12010092
APA StyleEscoz-Roldán, A., Gutiérrez-Pérez, J., & Meira-Cartea, P. Á. (2020). Water and Climate Change, Two Key Objectives in the Agenda 2030: Assessment of Climate Literacy Levels and Social Representations in Academics from Three Climate Contexts. Water, 12(1), 92. https://doi.org/10.3390/w12010092