Article

Water-Scarcity Footprint Associated with Crop Expansion in Northeast China: A Case Study Based on AquaCrop Modeling

1
College of Agronomy and Biotechnology, China Agricultural University, Beijing 100193, China
2
Beijing Research Center for Information Technology in Agriculture, Beijing 100097, China
3
College of Life Science and Engineering, Southwest University of Science and Technology, Mianyang 621010, China
*
Authors to whom correspondence should be addressed.
Water 2020, 12(1), 125; https://doi.org/10.3390/w12010125
Submission received: 21 November 2019 / Revised: 16 December 2019 / Accepted: 27 December 2019 / Published: 30 December 2019
(This article belongs to the Section Water Use and Scarcity)

Abstract

:
In recent decades, China’s crop production experienced a spatial shift, and this shift may significantly influence the national water resources due to the geographical mismatch between water resources and cropland. By applying the widely applied AquaCrop model, this study quantified the impact of grain crop (rice and maize) expansion in northeastern China on the country’s water resources. We found that the production of rice and maize increased by 60% and 43%, respectively, in the northeast, whereas the water scarcity-footprint (WSF) increased by 200% and 125%. Using sensitivity analysis, we found that the increase in the WSF was mainly caused by the increase in regional water scarcity, as reflected by a water scarcity index, and by the increase in production. To alleviate regional water scarcity, crop expansion into regions that experience high water stress should be constrained. A detailed reassessment of this situation is urgently needed.

1. Introduction

China is facing the dual challenge of satisfying a growing food demand while reducing its impact on the environment [1,2]. In recent decades, China has remarkably increased its agricultural production, which created the so-called “Miracle in China”: using 7% of the world’s arable land to feed 22% of the world’s population. In addition, China’s food production is undergoing a dramatic spatial shift along with its social and economic change [2,3,4]. Both the increase and shift of agricultural production incurred substantial environmental costs [2,5], especially for water consumption [6,7,8], due to the geographical mismatch between water availability and cropland.
The Northeast China Plain is one of China’s important breadbaskets. In recent decades, the production of maize and rice increased significantly in the area [9]. Previous studies focused on the impact factors from this land use change and the related change in agricultural productivity [10,11,12]. Few studies investigated environmental sustainability and have even produced contradictory results. For example, one previous study reported that the land use change contributed a very small proportion to the increase in water consumption in terms of the national average irrigation water intensity (irrigation water consumption per kcal). This kind of research has the potential to mislead policy decisions, such as giving priorities to reduce the irrigation water intensity in regions with high irrigation water intensity. Our previous studies demonstrated that such volumetric-based indicators (e.g., irrigation water intensity and irrigation water productivity), when used without considering the regional water scarcity, potentially conflict with the goal of water stress mitigation [13,14,15]. Strategies regarding sustainable water use and food security should include the environmental relevance of water consumption.
This study aims to explore detailed information on the spatiotemporal distribution and change of rice and maize production in northeastern China and quantify the environmental impact of crop expansion on local water resources. Applying the data with a spatial resolution of five arc-minutes from the Spatial Production Allocation Model (SPAM; https://www.mapspam.info/data/), we quantified the change of rice and maize production in the region from 2000 to 2010 (2010 being the most recent year for which the SPAM data were available). We modeled the crop yield and irrigation water consumption and calculated the water-scarcity footprints of the two crops at five arc-minute spatial resolution by applying the water-driven AquaCrop model [16,17]. A sensitivity analysis was performed to analyze the factors that had an impact on the change in the WSFs. Our study aims to provide scientific evidence that will inform policies on regional water and land use management by considering the environmental implications.

2. Materials and Methods

2.1. The Change in Crop Production

We consider two main staple grain crops (rice and maize), which are the major expanding crops in Northeast China [9] (the studied area is presented in Figure 1). We obtained the production data for rice and maize from the years 2000 and 2010 with a spatial resolution of five arc-minutes from the Spatial Production Allocation Model (SPAM; https://www.mapspam.info/data/). The development of the SPAM data was based on several spatially explicit input data, such as crop production statistics, cropland data and biophysical crop “suitability” assessments. The data for 2000 and 2010 were based on the average data between 1999–2001 and 2009–2011, respectively [18,19]. To quantify the expansion of the rice and maize production, the difference of the crop production in 2010 and 2000 were calculated.

2.2. Crop Yield and Irrigation Water Consumption Modeling

Crop yield and irrigation water consumption were modeled with a five arc-minute resolution using the widely applied FAO AquaCrop model (http://www.fao.org/aquacrop). The model applicability was widely tested around the world and calibrated and validated for various cropping systems in China [13]. To facilitate the use of AquaCrop for a large spatial scale, we applied a geospatial tool named GeoSim to manage AquaCrop inputs and outputs [20]. To ensure the time consistency of the modeling work and the SPAM data, we conducted the modeling for the time series of 1999–2001 and 2009–2011. Raster datasets (5 arc-minute) for the distribution of rice and maize in 2000 and 2010 were obtained from SPAM and were applied when modeling the years 1999–2001 and 2009–2011, respectively. The daily climate data from meteorological stations in Northeast China during the periods 1999–2001 and 2009–2011 came from the National Meteorological Information Centre (NMIC, http://data.cma.cn). The preparation of the crop parameters (e.g., sowing dates, sowing density and harvest dates) and soil data (e.g., soil texture, soil hydraulic parameters and the initial soil water contents) was conducted according to our previous studies [13,20]. The crop yield and water consumption under irrigation conditions were modeled by applying the option of “Determination of Net Irrigation Requirement” in AquaCrop. The default rain-fed condition in AquaCrop was applied to simulate the maize yield under rain-fed conditions. As almost all the rice cultivation in China is irrigated [21], we did not conduct rain-fed AquaCrop modeling for rice. Due to the lack of detailed national datasets, the modeling did not consider the factors that may cause yield loss, such as nutrient deficiencies and soil salinization. Thus, the crop yield modeled under the irrigated condition could be regarded as the potential yield.
The implementation of AquaCrop by GeoSim and the postprocessing were conducted as described in our previous studies [13,20]. Finally, the crop yields and irrigation water requirements under the irrigated conditions and the crop yields under the rain-fed conditions, with a resolution of five arc-minutes, were obtained for the years 1999–2001 and 2009–2011. These data were averaged, representing the crop yield and irrigation water requirements in the years 2000 and 2010.

2.3. Water-Scarcity Footprint Calculation

The water-scarcity footprint is an indicator which assesses the potential environmental impacts related to water use [22]. It focuses on the water consumption contributing to water scarcity (e.g., the consumption of surface and groundwater). In this study, we only considered the irrigation water consumption. Apart from irrigation, crops may also consume soil moisture (so-called green water), but it does not contribute to water scarcity, as we cannot extract it and use it for any other purpose. The water-scarcity footprint per kilogram grain (WSFg) in each grid cell g was expressed in water equivalents (m3 H2Oe kg−1) and calculated using the water scarcity index (WSI) to express the environmental relevance of the water use [23]:
W S F g = ( I g / P g ) × W S I g
where Ig (m3) and Pg (kg) are the irrigation water consumption and production for the crop. Ig and Pg were calculated as follows:
I g = I g , r e q u × A g × F g , i r r i  
  P g = Y g , i r r i × A g × F g , i r r i + Y g , r a i n × A g × 1 F g , i r r i  
where Ig,requ (m3 ha−1) is the crop irrigation water requirement in the grid cell g obtained by AquaCrop; Yg,irri (kg ha−1) and Yg,rain (kg ha−1) are the crop yield under irrigated and rain-fed conditions (the latter not for rice) obtained by AquaCrop; Ag (ha) is the cropping area, which also came from SPAM; and Fg,irri is the fraction of irrigated cropland in each grid cell, which was calculated as the ratio of the irrigated area to the total cropland area by applying the county-level statistics from the National Bureau of Statistics of China (NBSC; Supplementary Materials, SM; Figure S1). As almost all the rice cultivation in China is irrigated [21], the Fg,irri of rice in each grid cell was assumed to be 100%.
The WSIg relates to the ratio of water consumption to water availability [23], which was calculated according to previous studies [24,25]. We recalculated the WSIs for the years of 1999–2001 and 2009–2011 with a resolution of five arc-minutes to match our studied temporal-spatial resolution.
The total WSFg,tota (m3 H2Oe) for a crop in each grid cell was calculated based on the actual production as follows:
W S F t o t a = W S F g × P g , a c t u
where the Pg,actu (kg) was the actual crop production at the grid cell level and was obtained from SPAM. The total WSF of each crop is determined by the WSF per kilogram grain and the production. Thus, except for the determinants of WSF per kilogram grain, the production is also an important factor contributing to the total WSF.

2.4. Sensitivity Analysis

To assess the impact of each factor on the increase in the WSF, we conducted a sensitivity analysis by changing one factor at a time (OFAT) [26]. The OFAT method was adjusted to perturb each parameter (i.e. driver of the WSF) one at a time to the value observed in 2010 while the other parameters were held fixed at their value in 2000. The parameter perturbations for the sensitivity analysis were conducted as follows.
P1: We changed the total production of each crop from 2000 to 2010, while keeping the WSI, the irrigation intensity, and the irrigated fraction in each grid cell at their 2000 values (the irrigated fraction for rice is always 100%). To conduct such a parameter perturbation, the ratio (R) of the production of the crop in 2010 (Ptota,2015, kg) to that in 2000 (Ptota,2000, kg) was calculated first as follows:
R = P t o t a , 2010 / P t o t a , 2000
where R was applied to obtain the assumed crop production in grid cell g (Pg,assu, kg) by multiplying R by the actual crop production in the grid cell as the value in 2000 (P2000, kg):
P g , a s s u = P g , 2000 × R
P2: We changed the WSI in each grid cell from that in 2000 to that observed in 2010, while keeping the same production, crop irrigation intensity, and irrigated fraction from 2000, at the grid cell level.
P3: We changed crop irrigation intensity (the irrigation amount per kilogram grain) under irrigated conditions from that in 2000 to that in 2010 in each grid cell, while keeping the production, the WSI, and the irrigated fraction at the 2000 value, at the grid cell level.
P4: We changed the irrigated fraction of maize from that from 2000 to 2010, while keeping the production, the WSI and the crop irrigation intensity from 2000, at the grid cell level.
The national WSFs under each parameter perturbation were calculated following the methods presented under the section of “Water-scarcity footprint calculation”.

3. Results

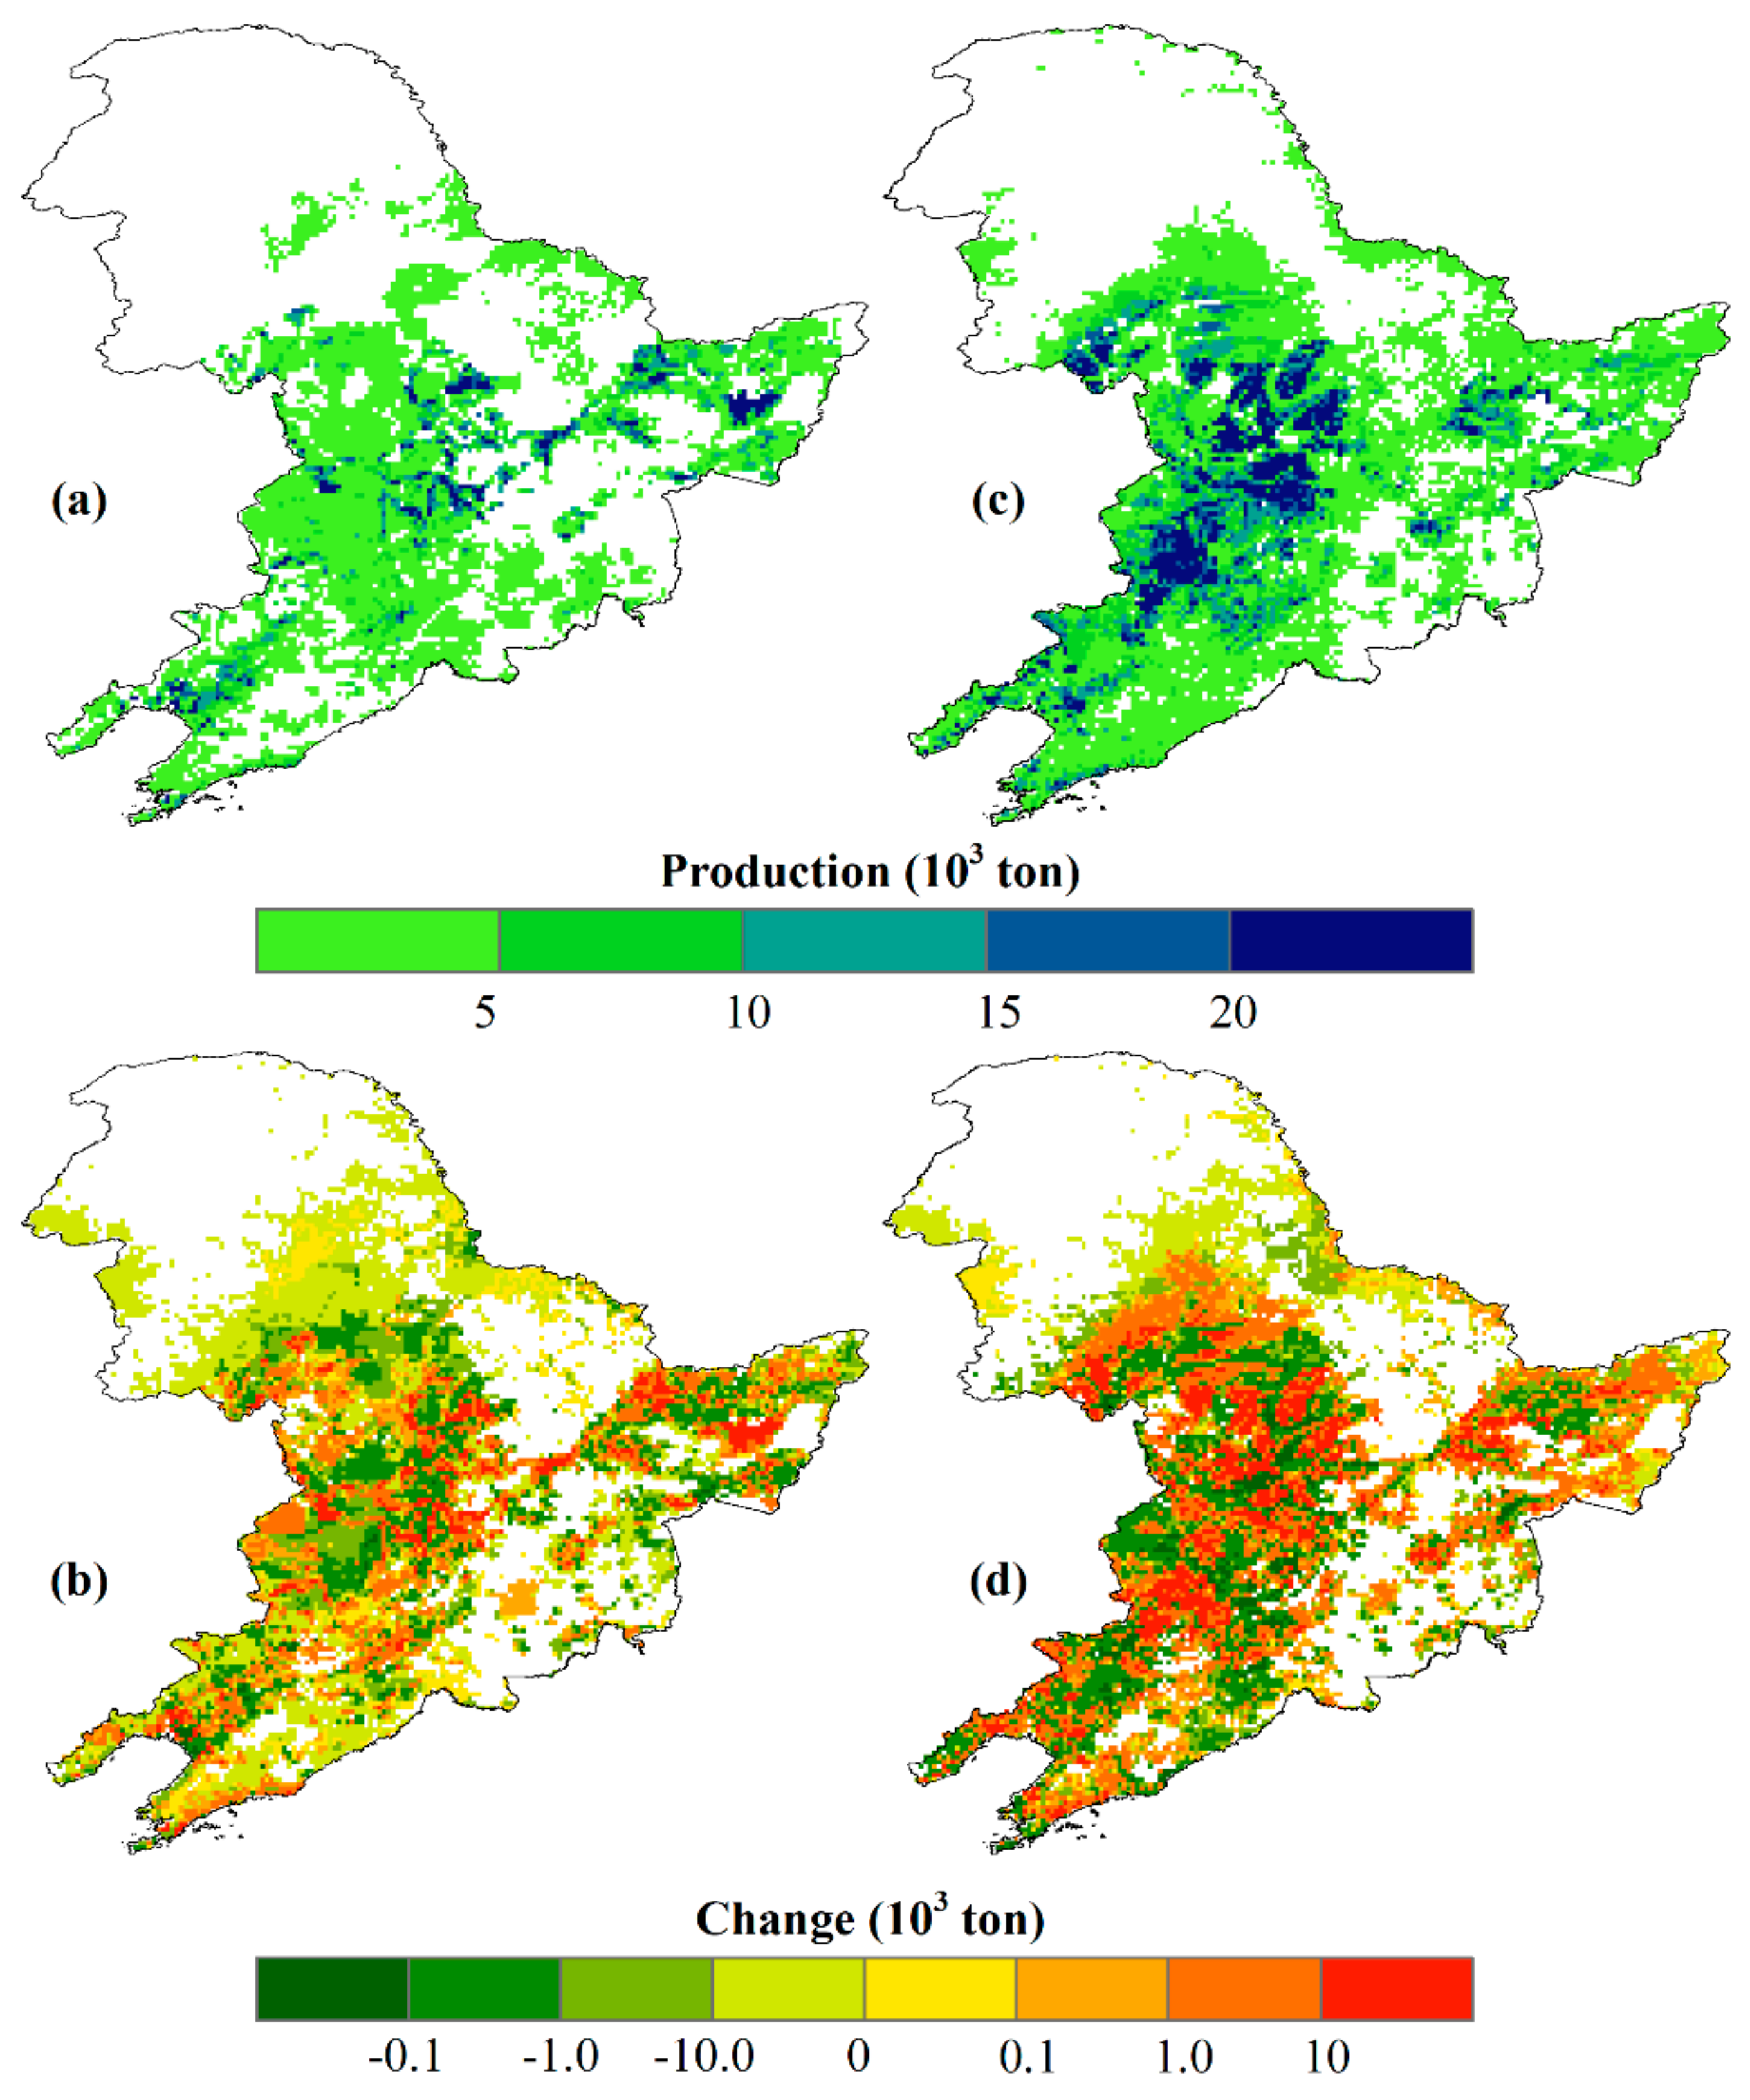
3.1. The Change in Crop Production

The production of both rice and maize in Northeast China increased substantially from 2000 to 2010 (Figure 2). The total production of rice increased from 1.4 × 10⁷ ton in 2000 to 2.2 × 10⁷ ton in 2010, which shows an increase of 60% (Figure 2a,b). While rice production slightly decreased in some northern regions of Northeast China, the main increase happened in the middle-lower western and eastern regions (Figure 2b). The total production of maize increased from 4.1 × 10⁷ ton in 2000 to 5.8 × 10⁷ ton in 2010, which shows an increase of 43% (Figure 2c,d). Similar to the spatial change observed in rice production, the main increase in the maize was also found in the middle-lower western and eastern regions (Figure 2d).

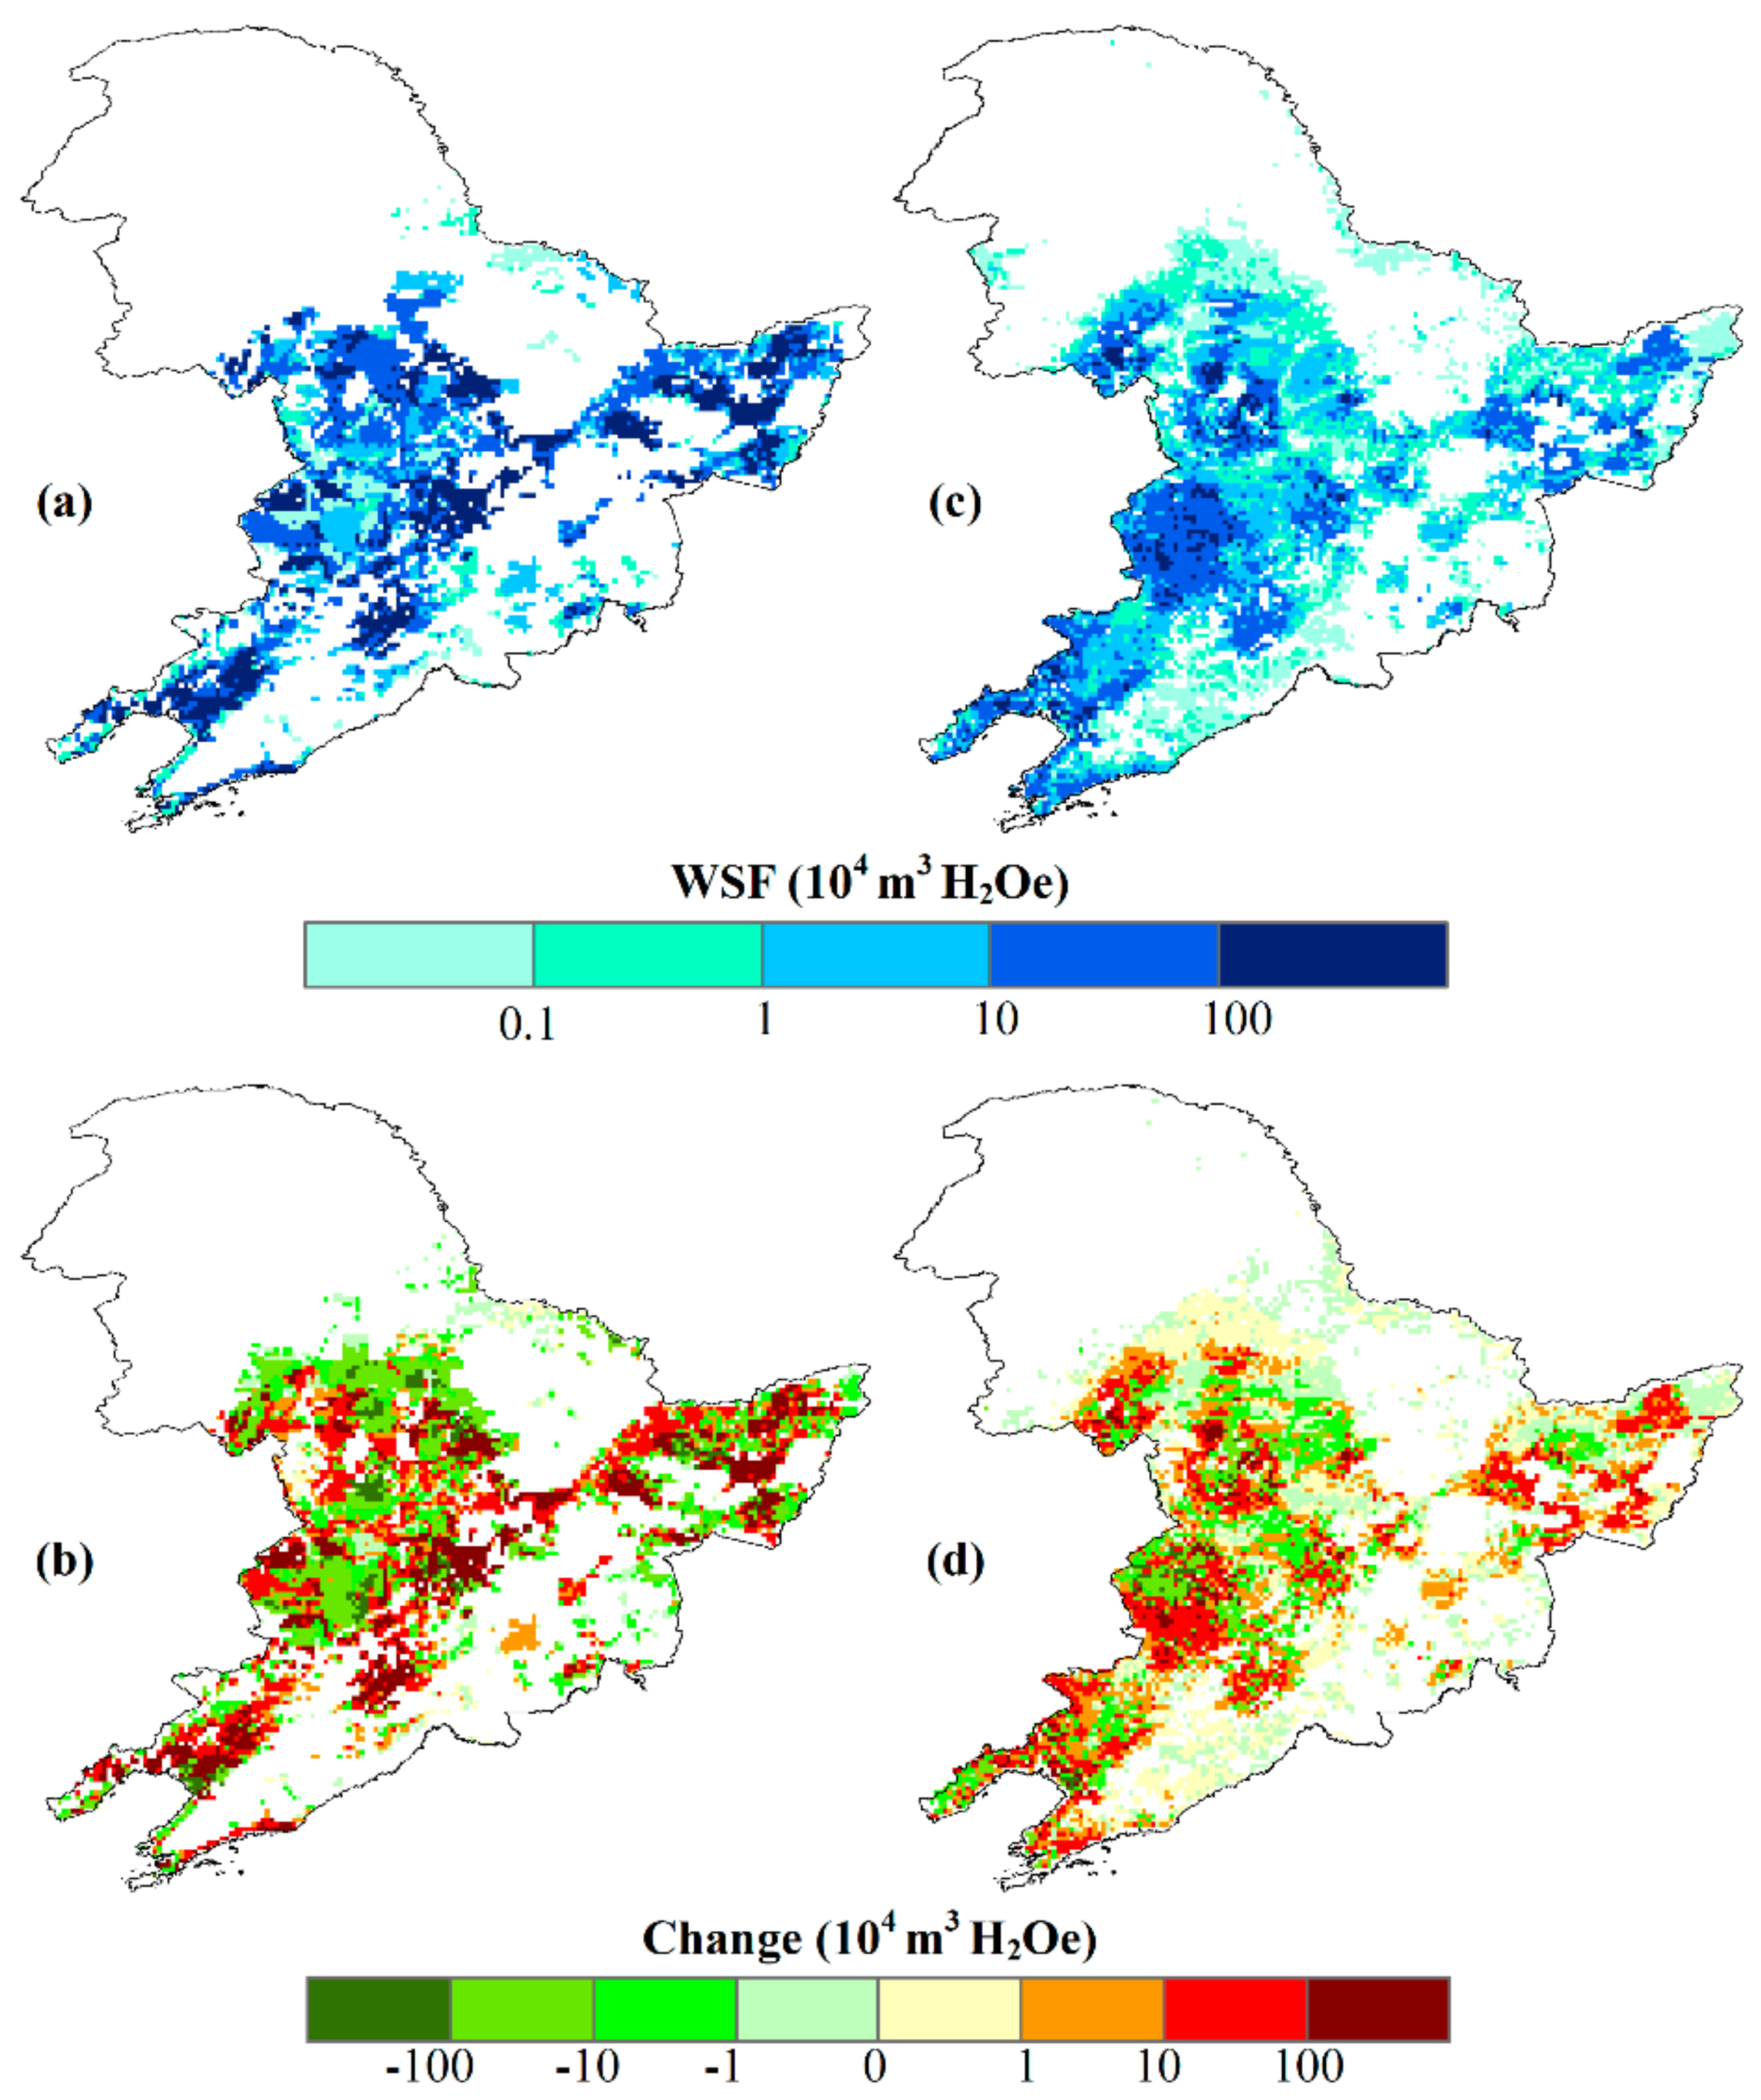
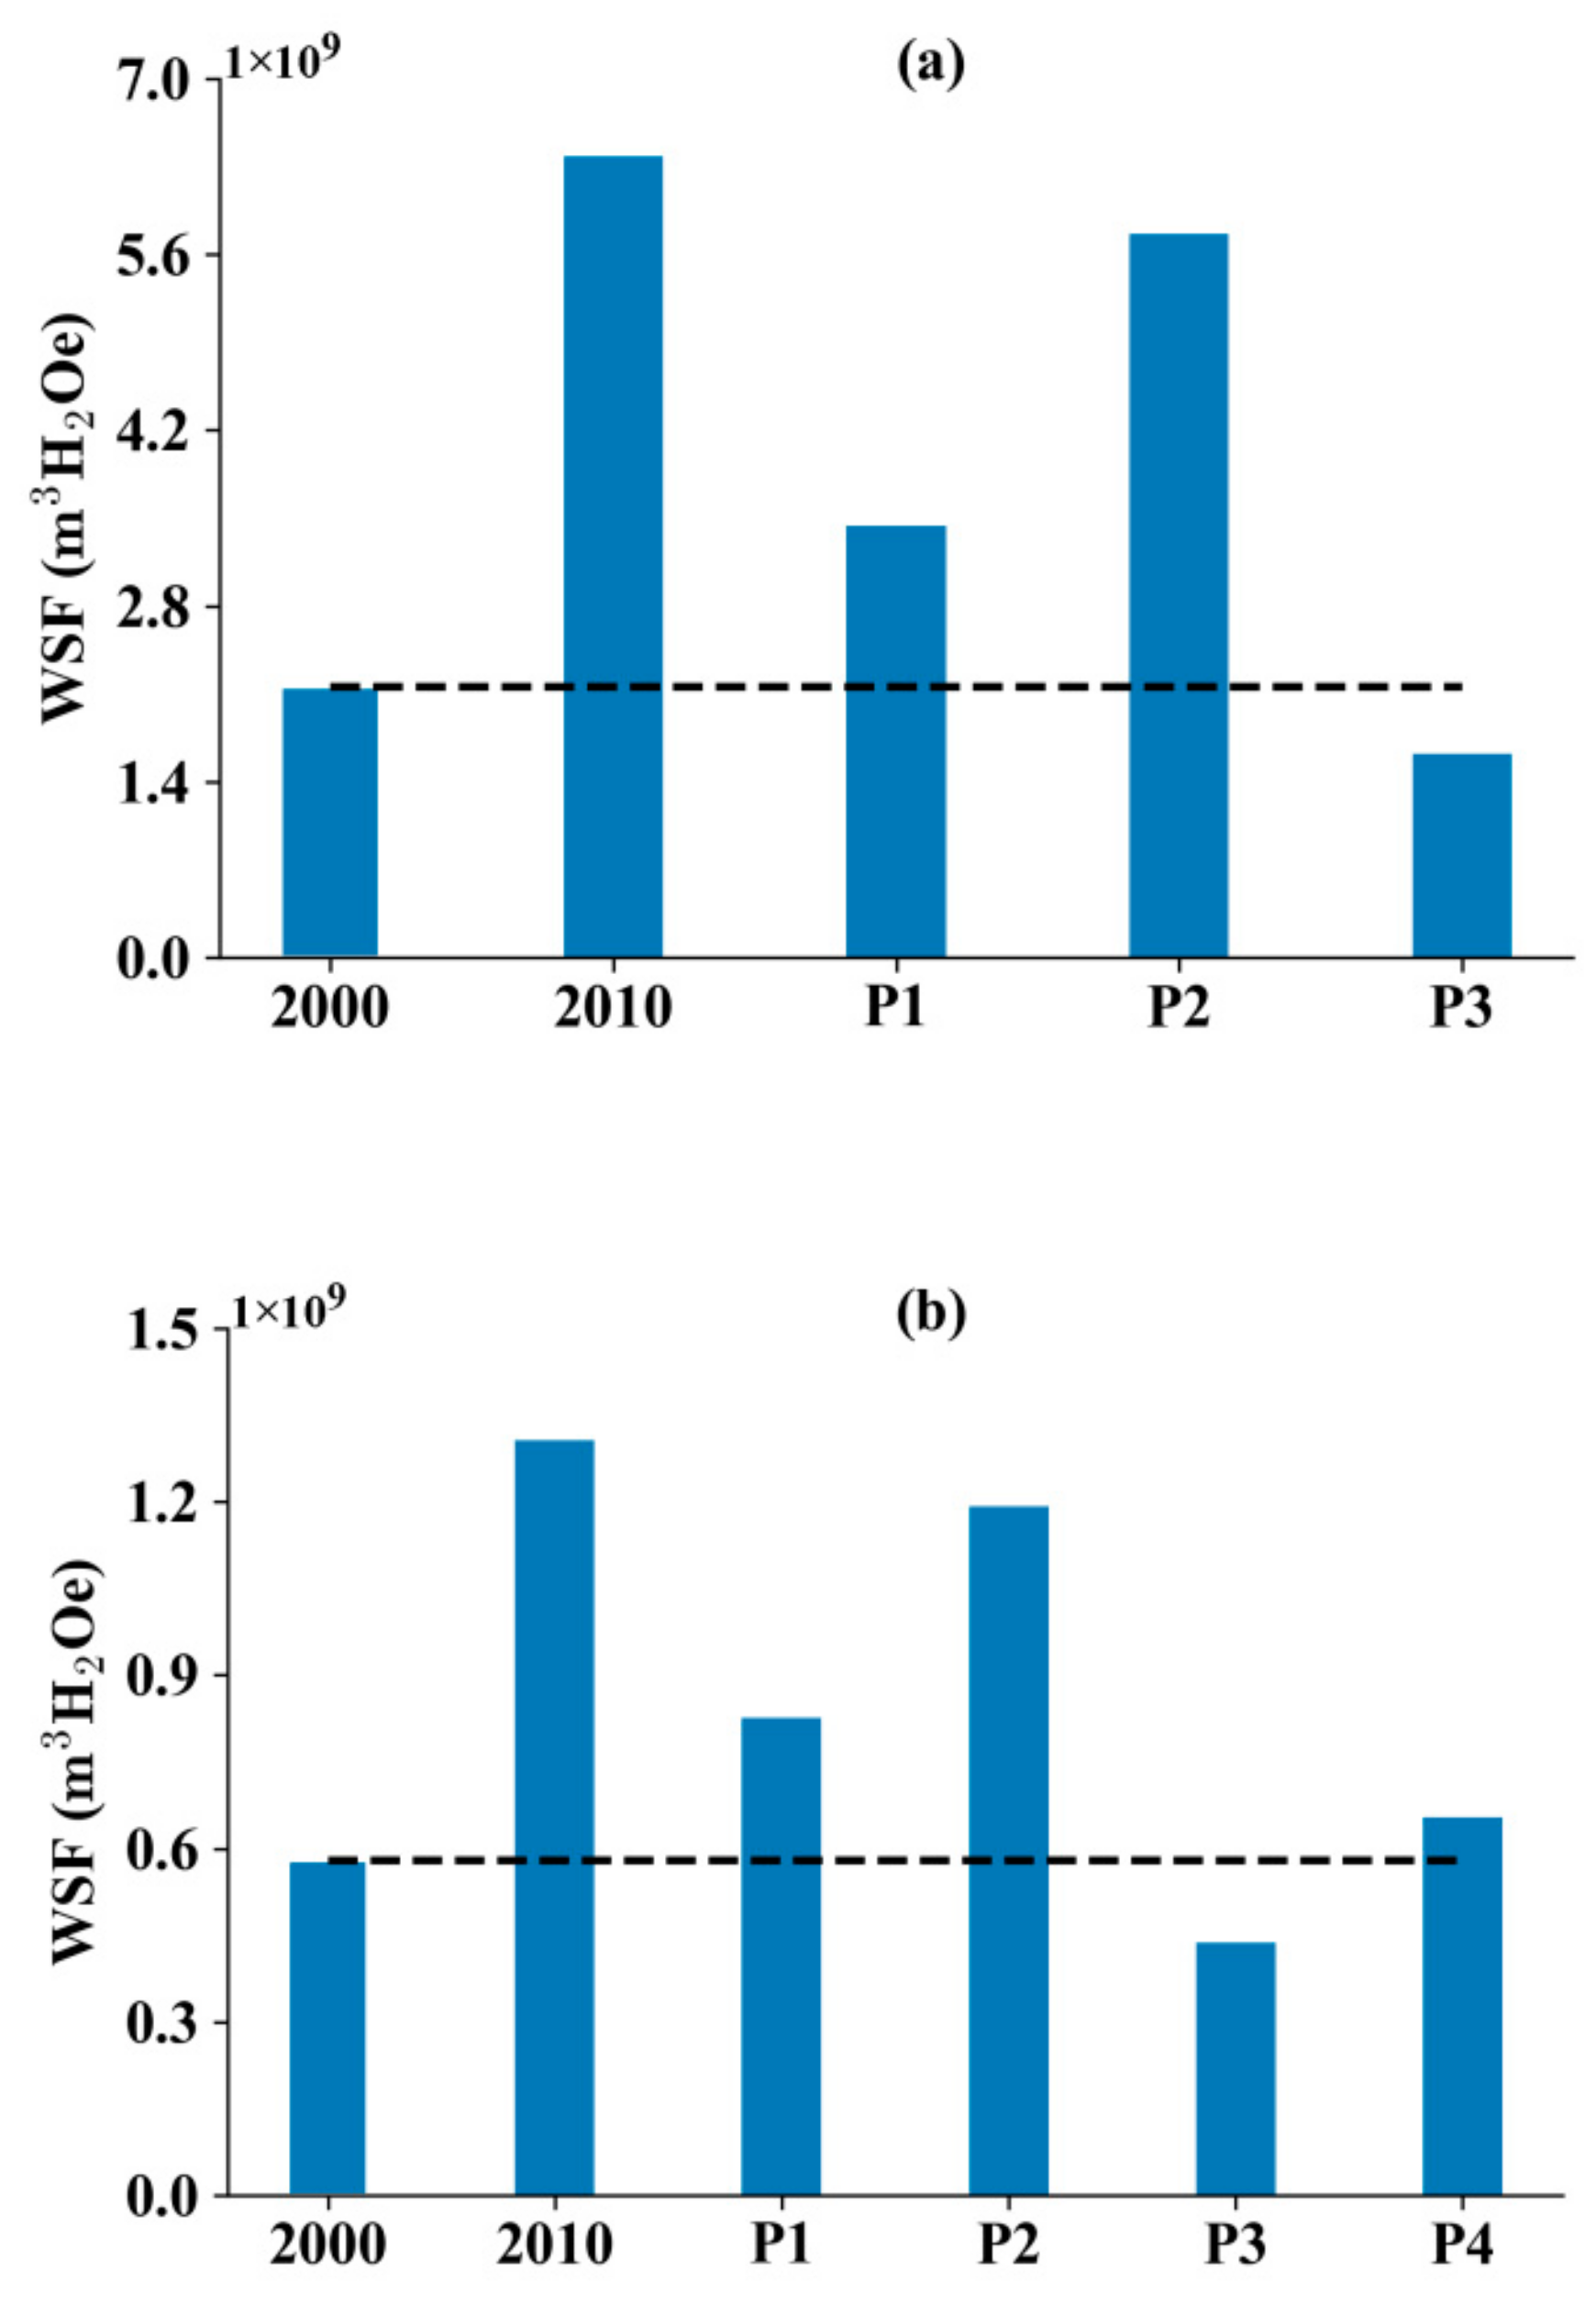
3.2. The Change in the Water-Scarcity Footprint

The total WSF of both rice and maize in Northeast China increased substantially from 2000 to 2010 (Figure 3). The total WSF of rice was 6.4 × 10⁹ m3 H2Oe in 2010, which was almost triple as high as the WSF in 2000 (Figure 3a,b). The total WSF of maize increased from 5.8 × 10⁸ m3 H2Oe in 2000 to 1.3 × 10⁹ m3 H2Oe in 2010, which showed an increase of 125% (Figure 3c,d). Similar to the spatial change in crop production, the main increase in the WSF for rice and maize happened in the regions where the production increased (Figure 2b,d; Figure 3b,d).

3.3. Sensitivity Analysis

Based on the one-at-a-time sensitivity analysis, we found that the change in production (P1) and WSI (P2) substantially increased the total WSF of the rice, whereas the change in the irrigation intensity decreased the total WSF of the rice (Figure 4a). As the production in 2010 was 1.6 times that in 2000, the increase in the total WSF (increased by 60%) under P1 kept pace with the increase in the production. The total WSF under P2, which had increased by 168%, was the highest among all the parameter perturbations. That result occurred because the WSIs of most regions in 2010 were higher than those in 2000 (SM; Figure S2). The rice production-weighted average WSI in the northeast was 0.50 in 2010, whereas it was 0.19 in 2000. The total WSF under P3 was 25% lower than that in 2000, which was caused by lower irrigation intensity (SM; Figure S3). For example, the average irrigation intensity in 2010 was 0.53 m3 kg-1, whereas that in 2000 was 0.71 m3 kg−1.
Similar to rice, the change in production (P1) and WSI (P2) also increased the total WSF of maize, whereas the change in the irrigation intensity decreased the total WSF of maize (Figure 4b). In addition, the change in the irrigated fraction was also a factor that increased the total WSF of the maize. The production in 2010 was 1.4 times the production in 2000; therefore, the increase in the total WSF (which had increased by 43%) under P1 kept pace with the increase in production. Similar to rice, the total WSF under P2 for maize, which increased by 106%, was the highest among all the parameter perturbations. Again, that result occurred because the WSI of most regions in 2010 was higher than 2000 (SM; Figure S2). The maize production-weighted average WSI in the northeast was 0.57 in 2010, whereas it was 0.25 in 2000. The total WSF under the P3 was 25% lower than that in 2000, which was caused by the lower irrigation water intensity (SM; Figure S4). The average irrigation intensity in 2010 was 0.07 m3 kg−1, whereas that in 2000 was 0.14 m3 kg−1. The irrigated fraction slightly increased the total WSF of the maize because of the slightly higher irrigated fraction in 2010 (SM; Figure S1). The production-weighted irrigated fraction in 2010 was 28%, whereas that in 2000 was 24%.

4. Discussion

Based on several models and data sources, the results of this study were subject to a range of uncertainties. First, due to the lack of a national dataset on detailed irrigation practices matching our studied temporal and spatial resolution, we modeled maize yield and irrigation consumption under irrigated condition and maize yield under rain-fed condition, separately. Then the irrigated fraction, which refers to the ratio of the irrigated area to the total cropland area within a grid cell, was applied to estimate the average irrigation water consumption considering both irrigated and rain-fed conditions in each grid cell. This may overestimate or underestimate the results because the exact spatial information on cropping condition is not clear. Second, although the sensitivity analysis was conducted to separate the impact of different factors on the total WSF, the relative impact expressed by percentage rather than the absolute value is therefore more meaningful. Third, constrained by the SPAM data, we only compared the WSFs in 2000 and 2010 (2010 being the most recent year for which the SPAM data were available). However, according to the latest Chinese statistics (https://www.stats.gov.cn/tjsj/ndsj), the production of rice and maize in the northeastern provinces (i.e. Liaoning, Jilin, and Heilongjiang) continued to increase. The total production of rice and maize in 2018 was 46% higher than that in 2010. Thus, the historical examination in this study can inform today’s policymaking, as the crop production in the northeast is still expanding. Fourth, due to the lack of consistent datasets, we applied Chinese datasets to simulate crop water consumption and yield, whereas several global datasets were used to estimate the WSIs. Future work should investigate local irrigation water management and other farm practices and apply more consistent data sources to provide more reliable evidence for decision-making.
Many previous studies on China’s land use change focused on its drivers. Both China’s rice and maize production were reported to shift northeastward, and the major driving forces are socio-economic factors (e.g., urbanization, irrigation investment and land use policy) and climate change [27,28,29]. Few studies analyzed the environmental sustainability associated with the expansion of rice and maize in the region. This study demonstrated that crop expansion can cause a substantial impact on regional water resources. By applying the WSF indicator to reflect the environmental relevance, we found that the expansion of rice and maize in northeastern China substantially increased the total WSF. Sensitivity analysis found that the increase in the WSF was mainly caused by the increase in production and the regional water scarcity (reflected by WSI). Thus, policymaking regarding water and land use should give priorities to these two hotspot factors.
On the one hand, limiting the rice and maize production in the northeast is possible because most provinces in the northeast have surplus maize and rice production, and these provinces are usually virtual water exporting areas [8]. However, our previous study illustrated that local policymaking regarding agricultural land and water use must consider the wider food production context because the change in local food production would break the national balance between food production and consumption [30]. Local food production should avoid an increase in the national water stress problem. On a national scale, China’s grain production is expected to continue to increase over the long term to satisfy the growing demand [31]. National water scarcity is unlikely to be resolved by constraining production. However, the national crop distribution could be adjusted to avoid increasing grain production in regions that experience high water scarcity. A redistribution of the crops is needed to meet sustainable water use limits while ensuring food security. Some global studies already demonstrated this possibility [25,32]. Further assessments of the Chinese situation are urgently needed. On the other hand, consistent with our previous studies [13,30], efforts to reduce the WSF caused by crop production should be guided by the WSI (or WSF per kilogram grain). The higher the WSI (or WSF per kilogram grain) is, the more urgent the need to act is. By conducting the assessment with a high spatial resolution (5 arc-minutes), this study provides detailed spatial information on WSI and WSF, which are useful for decision-making. The focus on WSI or WSF, does not conflict with existing locally available technologies and knowledge. However, priorities regarding technological improvements, such as the application of highly efficient irrigation systems and drought-tolerant crop varieties, and policy implementation should also be guided by the WSI (or WSF per kilogram grain) to satisfy the more urgent needs and obtain a higher positive impact.

5. Conclusions

In the face of growing water scarcity and increasing food demand, where and how China’s food production occurs has emerged as an important concern. This study mapped the change in rice and maize production in China’s northeastern region and quantified the impact of the change on regional water scarcity. We demonstrated that the expansion of grain production in the northeast exacerbated the regional water scarcity. The results obtained in this study led to strategic implications for both crop redistribution and WSI-guided priority. Although a spatial change in crop production is usually ignored in water-scarcity assessments and water resource management, we identify this change as a key factor that must be considered. This spatial change highlights the urgency for regional optimization of the current crop production pattern while placing it within the national background.

Supplementary Materials

The following are available online at https://www.mdpi.com/2073-4441/12/1/125/s1, Figure S1: Fraction of the irrigated area in 2000 (a) and 2010 (b), Figure S2: Water scarcity index (WSI) for 2000 (a) and 2010 (b), Figure S3: The irrigation intensity of rice, Figure S4: The irrigation intensity of maize.

Author Contributions

Conceptualization, J.H.; methodology, H.H. and X.C.; software, H.H. and X.C.; formal analysis, H.H. and X.C.; data curation, H.H. and X.C.; writing—original draft preparation, H.H., and X.C.; writing—review and editing, J.H., and F.C.; visualization, H.H. and X.C.; supervision, F.C.; project administration, F.C.; funding acquisition, F.C., H.H. and X.C. contributed equally to this work. All authors have read and agreed to the published version of the manuscript.

Funding

This research was funded by China’s National Key Research and Development Program, grant number 2016YFD0300210; and the National Natural Science Foundation of China, grant number 31601269.

Conflicts of Interest

The authors declare no conflict of interest. The funders had no role in the design of the study; in the collection, analyses, or interpretation of data; in the writing of the manuscript; or in the decision to publish the results.

References

  1. Chen, X.; Cui, Z.; Fan, M.; Vitousek, P.; Zhao, M.; Ma, W.; Wang, Z.; Zhang, W.; Yan, X.; Yang, J.; et al. Producing more grain with lower environmental costs. Nature 2014, 514, 486. [Google Scholar] [CrossRef] [PubMed]
  2. Zuo, L.; Zhang, Z.; Carlson, K.M.; MacDonald, G.K.; Brauman, K.A.; Liu, Y.; Zhang, W.; Zhang, H.; Wu, W.; Zhao, X.; et al. Progress towards sustainable intensification in China challenged by land-use change. Nat. Sustain. 2018, 1, 304–313. [Google Scholar] [CrossRef]
  3. Wang, J.; Zhang, Z. Spatial shifts in grain production increases in China and implications for food security. Land Use Policy 2018, 74, 204–213. [Google Scholar] [CrossRef]
  4. Liu, Z.; Yang, P.; Wu, W.; You, L. Spatiotemporal changes of cropping structure in China during 1980–2011. J. Geogr. Sci. 2018, 28, 1659–1671. [Google Scholar] [CrossRef] [Green Version]
  5. Liu, X.; Zhang, F. Nitrogen fertilizer induced greenhouse gas emissions in China. Curr. Opin. Environ. Sustain. 2011, 3, 407–413. [Google Scholar]
  6. Piao, S.; Ciais, P.; Huang, Y.; Shen, Z.; Peng, S.; Li, J.; Zhou, L.; Liu, H.; Ma, Y.; Ding, Y.; et al. The impacts of climate change on water resources and agriculture in China. Nature 2010, 467, 43–51. [Google Scholar] [CrossRef]
  7. Kang, S.; Hao, X.; Du, T.; Tong, L.; Su, X.; Lu, H.; Li, X.; Huo, Z.; Li, S.; Ding, R. Improving agricultural water productivity to ensure food security in China under changing environment: From research to practice. Agric. Water Manag. 2017, 179, 5–17. [Google Scholar] [CrossRef]
  8. Dalin, C.; Hanasaki, N.; Qiu, H.; Mauzerall, D.L.; Rodriguez-Iturbe, I. Water resources transfers through Chinese interprovincial and foreign food trade. Proc. Natl. Acad. Sci. USA 2014, 111, 9774–9779. [Google Scholar] [CrossRef] [Green Version]
  9. National Bureau of Statistics of China (NBSC). China Statistical Yearbook. 2016. Available online: http://www.stats.gov.cn/tjsj/ndsj/ (accessed on 20 May 2018).
  10. Yang, H.; Li, X. Cultivated land and food supply in China. Land Use Policy 2000, 17, 73–88. [Google Scholar] [CrossRef]
  11. Jin, G.; Li, Z.; Wang, Z.; Chu, X.; Li, Z. Impact of land-use induced changes on agricultural productivity in the Huang-Huai-Hai River Basin. Phys. Chem. Earth Parts A B C 2015, 79, 86–92. [Google Scholar] [CrossRef]
  12. Yan, H.; Liu, J.; Huang, H.; Tao, B.; Cao, M. Assessing the consequence of land use change on agricultural productivity in China. Glob. Planet. Chang. 2009, 67, 13–19. [Google Scholar] [CrossRef]
  13. Huang, J.; Ridoutt, B.G.; Thorp, K.R.; Wang, X.; Lan, K.; Liao, J.; Tao, X.; Wu, C.; Huang, J.; Chen, F.; et al. Water-scarcity footprints and water productivities indicate unsustainable wheat production in China. Agric. Water Manag. 2019, 224, 105744. [Google Scholar] [CrossRef]
  14. Huang, J.; Xu, C.; Ridoutt, B.G.; Chen, F. Reducing agricultural water footprints at the farm scale: A case study in the Beijing region. Water 2015, 7, 7066–7077. [Google Scholar] [CrossRef] [Green Version]
  15. Ridoutt, B.G.; Huang, J. Environmental relevance—The key to understanding water footprints. Proc. Natl. Acad. Sci. USA 2012, 109, E1424. [Google Scholar] [CrossRef] [PubMed] [Green Version]
  16. Steduto, P.; Hsiao, T.C.; Raes, D.; Fereres, E. AquaCrop—The FAO crop model to simulate yield response to water: I. concepts and underlying principles. Agron. J. 2009, 101, 426–437. [Google Scholar] [CrossRef] [Green Version]
  17. Raes, D.; Steduto, P.; Hsiao, T.C.; Fereres, E. Aquacrop—The FAO crop model to simulate yield response to water: II. main algorithms and software description. Agron. J. 2009, 101, 438–447. [Google Scholar] [CrossRef] [Green Version]
  18. International Food Policy Research Institute. Global Spatially-Disaggregated Crop Production Statistics Data for 2010 version 1.1; International Food Policy Research Institute: Washington, DC, USA, 2019. [Google Scholar]
  19. International Food Policy Research Institute. Global Spatially-Disaggregated Crop Production Statistics Data for 2000 version 3.0.7; International Food Policy Research Institute: Washington, DC, USA, 2019. [Google Scholar]
  20. Huang, J.; Scherer, L.; Lan, K.; Chen, F.; Thorp, K.R. Advancing the application of a model-independent open-source geospatial tool for national-scale spatiotemporal simulations. Environ. Model. Softw. 2019, 119, 374–378. [Google Scholar] [CrossRef]
  21. You, L. A tale of two countries: Spatial and temporal patterns of rice productivity in China and Brazil. China Econ. Rev. 2012, 23, 690–703. [Google Scholar] [CrossRef] [Green Version]
  22. Ridoutt, B.G.; Pfister, S. A revised approach to water footprinting to make transparent the impacts of consumption and production on global freshwater scarcity. Glob. Environ. Chang. 2010, 20, 113–120. [Google Scholar] [CrossRef]
  23. Pfister, S.; Koehler, A.; Hellweg, S. Assessing the environental impact of freshwater consumption in life cycle assessment. Environ. Sci. Technol. 2009, 43, 4098–4104. [Google Scholar] [CrossRef] [Green Version]
  24. Pfister, S.; Bayer, P. Monthly water stress: Spatially and temporally explicit consumptive water footprint of global crop production. J. Clean. Prod. 2014, 73, 52–62. [Google Scholar] [CrossRef]
  25. Scherer, L.; Pfister, S. Dealing with uncertainty in water scarcity footprints. Environ. Res. Lett. 2016, 11, 054008. [Google Scholar] [CrossRef] [Green Version]
  26. Thornton, K.W. OFAT. In Concise Encyclopedia of Environmental Systems; Young, P.C., Ed.; Pergamon Press: Oxford, UK, 1993. [Google Scholar]
  27. Li, Z.; Liu, Z.; Anderson, W.; Yang, P.; Wu, W.; Tang, H.; You, L. Chinese rice production area adaptations to climate changes, 1949–2010. Environ. Sci. Technol. 2015, 49, 2032–2037. [Google Scholar] [CrossRef] [PubMed]
  28. Li, Z.; Tan, J.; Tang, P.; Chen, H.; Zhang, L.; Liu, H.; Wu, W.; Tang, H.; Yang, P.; Liu, Z. Spatial distribution of maize in response to climate change in northeast China during 1980–2010. J. Geogr. Sci. 2016, 26, 3–14. [Google Scholar] [CrossRef] [Green Version]
  29. Xia, T.; Wu, W.; Zhou, Q.; Yu, Q.; Verburg, P.H.; Yang, P.; Lu, Z.; Tang, H. Spatio-temporal changes in the rice planting area and their relationship to climate change in Northeast China: A model-based analysis. J. Integr. Agric. 2014, 13, 1575–1585. [Google Scholar] [CrossRef]
  30. Huang, J.; Ridoutt, B.G.; Zhang, H.; Xu, C.; Chen, F. Water footprint of cereals and vegetables for the Beijing market: Comparison between local and imported supplies. J. Ind. Ecol. 2014, 18, 40–48. [Google Scholar] [CrossRef]
  31. Lv, X. Review of mid-and long-term predictions of China’s grain security. China Agric. Econ. Rev. 2013, 5, 567–582. [Google Scholar] [CrossRef]
  32. Davis, K.F.; Rulli, M.C.; Seveso, A.; D’Odorico, P. Increased food production and reduced water use through optimized crop distribution. Nat. Geosci. 2017, 10, 919–924. [Google Scholar] [CrossRef]
Figure 1. The studied area. The studied area is Northeast China, as shown in green.
Water 12 00125 g001
Figure 2. The change in rice and maize production in Northeast China. (a) is rice production in 2010, and (b) is the change of rice production between 2010 and 2000. (c) is the maize production in 2010, and (d) is the change of maize production between 2010 and 2000.
Water 12 00125 g002
Figure 3. The change in the water-scarcity footprint (WSF) of rice and maize in Northeast China. (a) is the WSF of rice in 2010, and (b) is the change of rice WSF between 2010 and 2000. (c) is the WSF of maize in 2010, and (d) is the change of maize WSF between 2010 and 2000.
Water 12 00125 g003
Figure 4. Sensitivity analysis of the water-scarcity footprint (WSF). (a) is for maize, and (b) is for rice. P1: change in the total production; P2: change in the WSI from; P3: change in the irrigation intensity (the average irrigation amount per kilogram grain) under irrigated conditions; and P4: change in the irrigated fraction (the ratio of irrigated area to the total arable land) from 2000 to 2010. Note: P4 was not performed for rice, because the irrigated fractions of rice were always 100%.
Water 12 00125 g004

