Abstract
River health is one of the important issues today because of various threats by multiple anthropogenic stressors that have long-term impacts on the physical habitats, biodiversity, ecological functions, and their services. The main objectives of this study is to diagnose the chemical and biological river health in the watershed of Geum River with regard to the chemical regimes (N, P) and fish community using multi-metric chemical pollution index (CPI), and the index of biotic integrity model (IBI), respectively. The empirical models of sestonic chlorophyll, nutrients (N, P), and nutrient ratios of N:P indicated that the watershed, including all sampling sites, was a phosphorus-limited system. Analysis of fish trophic and tolerance guilds showed that the omnivore fish species and tolerant fish species were dominant in the watershed, while the sensitive fish species decreased downstream because of nutrient enrichments (such as TN, TP) and organic matter pollutions (such as BOD, COD). The chemical model of CPI showed that 11 sampling sites were in the fair—good condition, and 8 sites were in poor—very poor condition. Species composition analysis indicated that Zacco platypus was most widely distributed in the watersheds and dominated the fish community. The biological health of the watershed, based on the multimetric IBI model, was in poor condition and was getting worse downstream. The degradation of the river health was matched with the chemical health and showed a decreased abundance of insectivores and sensitive fish species. The outcomes of the river health were supported by principal component analysis (PCA) and cluster analysis (CA) of fish model metrics and the physicochemical parameters. Overall, our study suggests that river health was directly influenced by the chemical pollutions of nutrients and organic matter inputs.
1. Introduction
River and streams provide multiple eco-services including clean water in sufficient quantity and quality for agricultural, industrial, and residential uses, act as a hotspot of aquatic, riparian, and migratory biota, and support fisheries and recreation for a human beings in a sustainable manner [1,2]. With the rapid urbanization, industrialization, and intensive agricultural farming the structure and function of the river and stream ecosystem are severely affected, which lead to the significant degradation of water quality and ecosystem integrity [3]. As a result, the river and streams ecosystem health assessment is getting more attention from scholars globally and has become a fundamental and increasingly important environmental management issue worldwide, especially in Australia [4], USA [5], Europe [6], Korea [7], and China [8].
The assessment of ecological health in river and streams cannot be diagnosed directly because it is affected by their surrounding environments such as hydrology, water quality, physical form, riparian zone, and biological communities [9]. Earlier studies on the diagnosis of stream and river health assessment have focused on the water quality factors [10]. However, recent research pointed out that this method is not sufficient to determine the ecological health of the freshwater ecosystem [11].
To address this problem, two important approaches have been used to evaluate the ecological health of the river and streams. One is chemical pollution index (CPI) based on water quality factors and another is an index of biotic integrity (IBI) based on fish assemblages. The CPI model was primarily suggested by Beach (1980) and after that, it was developed by many researchers in different regions of the world to evaluate the chemical health status of the ecosystem [12,13,14,15,16].
A variety of biological indicators and methods are being used to evaluate the ecological health of river ecosystems around the world. The US Environmental Protection Agency (EPA) used the Rapid Bio-assessment Protocols (RBP) to diagnose the health of the aquatic ecosystem [5]. In 1981, the index of biotic integrity based on fish assemblages was proposed by Karr to evaluate the biological health status of the freshwater system [17], since then, this index has been adopted throughout the world for assessing the effects of natural and human disturbance on the freshwater system [18,19,20]. The previous research indicated that fish assemblages respond significantly and predictably to almost all kinds of anthropogenic disturbances, including eutrophication, acidification, chemical pollution, flow regulation, physical habitat alteration and fragmentation, human exploitation, and introduced species [21,22,23,24]. That is why fish has been regarded as the best indicator to evaluate the ecological health of the system.
In Korea, a model for health assessment of stream ecosystem using the fish community was developed by An et al. in 2006 [25]. It is used for the health assessment of the aquatic ecosystem of the four major rivers. Korea established the biological water quality assessment guidelines in 2006 [26]. Since 2007, it has been surveyed and evaluated including the representative points of the nationwide watershed and the water quality measuring network [27]. Some previous research had been done to evaluate the ecological health of the Geum River mainstream using integrative approaches including water quality factors and biological communities [16,28]. The purpose of this study is (a) to diagnose the chemical health of Geum River using CPI multi-metric model; (b) to analyze the species composition, trophic and tolerance guilds and determine how are they correlated with water quality factors; (c) to evaluate the biological health using index of biotic integrity model based on fish community; (d) to predict the ecological health (chemical and biological) using artificial neural network model (ANN) along with estimating the validity of ANN; (e) to determine the most important water quality factors affecting the river health by principal component analysis (PCA).
2. Materials and Methods
2.1. Study Period and Sampling Sites
Geum River watershed is composed of urban, mountain, and agricultural land-use pattern. The water quality parameters and fish composition are closely related to the land-use pattern. This study was conducted using 19 sampling sites in the mainstream of the Geum-River watershed (Figure 1). Geum River originates from Jangsu-eup, North Jeolla Province. It lies between the coordinates of latitude 35°34′47″–37°03′03″ and longitude 126°40′25″–128°03′53″ and the watershed area is 17,537 km2 (Atique et al., 2019). The total reach length is 414 km and the average elevation is 85.31 m. Fish composition and water quality parameters were investigated from May 2010 to June 2010 (The original dataset can be shared upon written request but is subject to approval from the funding agency).
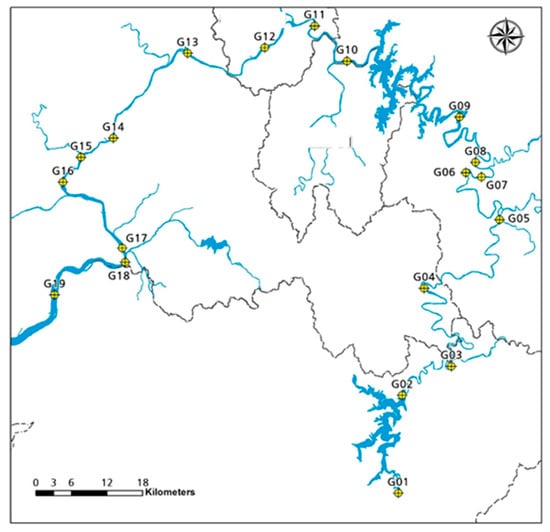
Figure 1.
Sampling sites for Geum River watershed.
2.2. Water Quality Parameters
During our study period, we measured eight parameters namely, total nitrogen (TN), total phosphorus (TP), and chlorophyll-a (CHL-a), electrical conductivity (EC), total suspended solids (TSS), biological oxygen demand (BOD), chemical oxygen demand (COD), and dissolved oxygen (DO). A portable multi-parameter analyzer (YSI Sonde Model 6600) was used to measure the electrical conductivity and dissolved oxygen. The chemical testing standard method was used to measure the TN, BOD, and COD which was adopted by the Ministry of the Environment, Korea (MOE, 2006). The ascorbic acid method was used to analyze the total phosphorus (TP) which was also standardized by the Ministry of the Environment, Korea (MOE, 2006). Total suspended solids (TSS) were determined by pre-weighted Whatman GF/C filters method. Chlorophyll-a (CHL-a) concentration was measured by using a spectrophotometer (Bechman Model DU-65) after extraction in hot ethanol [29]. Nutrient analyses were performed thrice to ensure validity and CHL-a was measured twice.
2.3. Fish Sampling Methods
Fish sampling was performed based on the Ohio EPA (1989) method [30], which was modified by An et al. 2001 for the regional purpose [31]. Fish assemblages were sampled overnight from the Geum River using sets of fyke nets (FN; 20 m long and 2.4 m high, mesh size: 5 × 5 mm), gill nets (GN; 50 m long and 2 m high, mesh size 45 × 45 mm), trammel nets (TN; 50 m long and 1.0 m high, mesh size 12 × 12 mm). The cast net (mesh size: 7 × 7 mm) and kick net (mesh size: 4 × 4 mm) were used to catch the fish in run, riffle, and pool. The fyke net, gill net, and trammel net were installed along the shoreline using a small boat while the cast net and kick net were used in nearshore waters of the Geum River. The sampling distance was 200 m and the time was 60 min. After collecting the samples, the fish was identified and any abnormalities in those fish were also noted. Analysis of trophic and tolerance guilds was done by previous regional studies [32].
2.4. Chemical Pollution Index (CPI) Model
To diagnose the chemical health of the stream, the modified CPI model was performed [15]. The CPI composed of eight metrics such as M1—total nitrogen (TN, mgL−1), M2—total phosphorus (TP, μgL−1), M3—TN:TP ratio, M4—biological oxygen demand (BOD, mgL−1), M5—total suspended solids (TSS, mgL−1), M6—electrical conductivity (μScm−1), M7—chlorophyll (CHL, μgL−1), and M8—dissolved oxygen (DO, mgL-1). The CPI was calculated using the following formula: CPI = 1/8 (CTN/CTN0 + CTP/CTP0 + CTN:TP/CTN:TP0 + CBOD/CBOD0 + CTSS/CTSS0 + CEC/CEC0 + CCHL/CCHL0 − CDO/CDO0). Where, CTN,TP,TN:TP,BOD,TSS,EC,CHL,DO is the measured value and CTN0,TP0,TN:TP0,BOD0,TSS0,EC0,CHL0,DO0 is the critical or standard value which was defined by the Korean Ministry of Environment. It is widely accepted that TP, TN, and TN:TP ratio are the indicators of nutrient pollution in the river system whereas BOD, TSS, and EC are the pointers of organic pollution, non-algal turbidity, and ionic pollution, respectively [7,8]. Trophic status of the waterbody can be determined by the concentration of CHL-a. DO can influence the organism’s life within the waterbody and it is an important indicator of pollution and eutrophication in rivers [8]. The chemical health has been categorized as excellent (<0), good (0.0–1.0), fair (1.1–2.0), poor (2.1–3.0), and very poor (>3.1).
2.5. Index of Biotic Integrity (IBI) Model
The biological health assessment of the Geum River was diagnosed by the multi-metric IBI model based on fish communities [32]. In the IBI model, we used eight metrics which were modified by An et al. (2006), such as, M1—total number of native fish species, M2—number of riffle benthic species, M3—number of sensitive species, M4—proportion of individuals as tolerant species, M5—proportion of individuals as omnivore species, M6—proportion of individuals as native insectivore species, M7—total number of native individuals, and M8—percent of individuals with anomalies [25]. Each metric had been assigned as scored 5, 3, and 1. The Geum River health condition was evaluated based on the obtained scores and the categories are excellent (36–40), good (28–34), fair (20–26), poor (14–18), and very poor (8–13).
2.6. Artificial Neural Network, Principal Component Analysis, and Cluster Analysis
The nonlinear nature of water quality and fish data makes it difficult to interpret the spatio-temporal variations and ecological health of the river. For this reason, statistical learning approaches (ANN) and multivariate statistical approaches (PCA and CA) are used for providing the representative and reliable analysis and drawing out meaningful conclusions. An artificial neural network is a good tool for the simplification of complex non-linear physical, chemical, and biological data. This statistical tool has been regarded as one of the most effective tools for the prediction of ecological dynamics and variations [33]. We used various chemical and biological variables as the input layer to predict the ecological health of the Geum River watershed and to estimate the validity of ANN for forecasting of river health. To determine the accuracy of ANN, we used some accuracy metrics such as mean absolute error (MAE), root mean square error (RMSE), and coefficient of determination (R2). The lower MAE and RMSE values indicate a better model, while the higher R2 value indicates a better model.
The principal component analysis (PCA) was used to determine the most important water quality factors affecting the ecological health of the Geum River watershed. The cluster analysis (CA) was carried out to make a strong spatial association based on water quality parameters and fish composition.
2.7. Statistical Analysis
Log-transformed regression analysis of water quality parameters was performed in Sigma Plot version 10 [34]. Principal component and cluster analysis were done using PAST software [35]. The artificial neural network analysis was performed by R 3.5.2 version.
3. Results and Discussion
3.1. Dynamics of Water Quality Parameters
The physicochemical parameters of the Geum River watershed varied from upstream to downstream region and showed a distinct heterogeneity feature (Figure 2). The concentration of TP and TN was lower in G01–G10 sites, while it was higher in G11–G19 sites. In site G10, the TN:TP ratio was higher compared to the other sites, suggesting that the site is highly P-limited. The value of BOD increased from site G01 to G18. The other parameters (COD, TSS, EC, CHL) also followed the same pattern. Results of the present study revealed that the nutrient (TN, TP, TN:TP ratios) regime, organic content (BOD, COD), suspended solids (TSS), ionic contents (EC), and primary productivity (CHL) was highly affected by the land-use pattern of the Geum River watershed. As a result, the upstream of Geum River watershed was minimally influenced by the water quality factors in comparison to the downstream region, which is in line with the findings of Atique and An (2018) in the Korean watersheds [16]. Kim et al. (2010) suggested that because of the higher flushing rate from the upstream to downstream, the concentrations of physicochemical parameters were higher downstream [36].
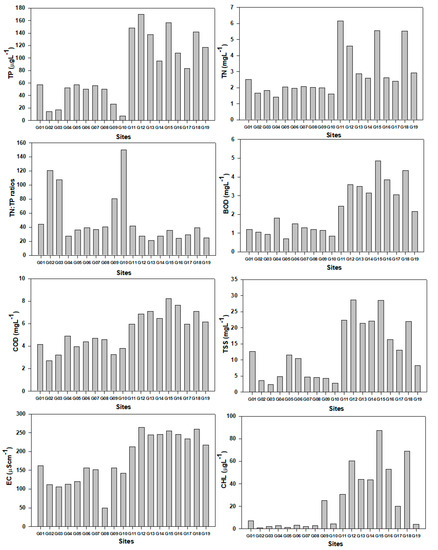
Figure 2.
Variation of water quality parameters on the basis of sites in the Geum River watershed.
3.2. Spatial Distribution of Fish Assemblages
The distribution of fish assemblages highly fluctuated from upstream to the downstream of the Geum River watershed and did not show a distinctive pattern (Figure 3). The highest number (18) of native fish species was found in G12 site whereas it was lower (3) in sites G16–G18. It was a remarkable finding that the total number of native individuals were much lower in the downstream site G19. The relative abundance of tolerant species fluctuated from site G01 to G19. Another significant finding was that no sensitive species were found in sites G09 and G10, especially in the downstream region. It means that the downstream region is highly polluted by natural and anthropogenic activities, making it an unsuitable habitat for the sensitive species. Our results concurred with some previous findings [16,37]. The omnivore fish species was higher in site G17 and lower in G13. Insectivores were not observed in sites G16 and G17 during the study period.
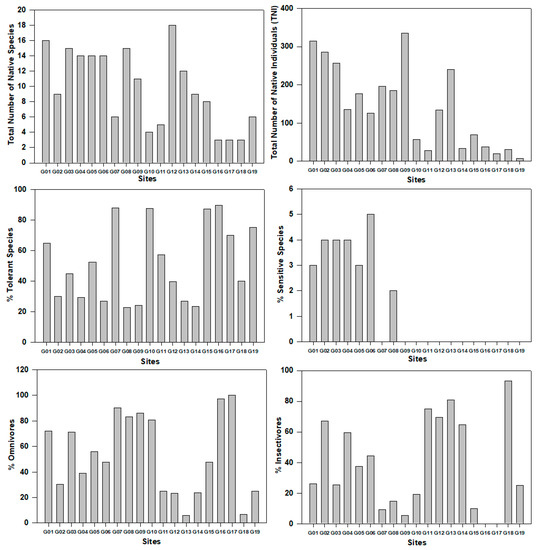
Figure 3.
Variation of fish abundance and assemblages according to the sites in the Geum River watershed.
3.3. Empirical Model of Chlorophyll and Nutrients
An empirical model was used to define whether the aquatic ecosystem was phosphorus limited, nitrogen-limited, or phosphorus–nitrogen co-limited. The empirical model analysis among log-transformed CHL-TP, CHL-TN, and CHL-EC showed a strong positive linear relationship in the watershed (Figure 4). In CHL-TP (R2 = 0.45, p < 0.01, n = 19) model, the variation of CHL was explained 45% for the concentration of TP wherein CHL-TN (R2 = 0.56, p < 0.01, n = 19) model, it was 56 percent for TN. The change of CHL concentration in the watershed accounted for 18% with TN:TP (R2 = 0.18, p < 0.01, n = 19) and 59% with EC (R2 = 0.59, p < 0.01, n = 19). The TN:TP ratio was more than 20, means that the mainstream of Geum River watershed was P-limited which is similar with some previous studies in the Korean watershed [16,37]. The present study indicates that the electrical conductivity was highly altered in the watershed, which means that degradation of water quality happens because of urban and agricultural run-off [16].
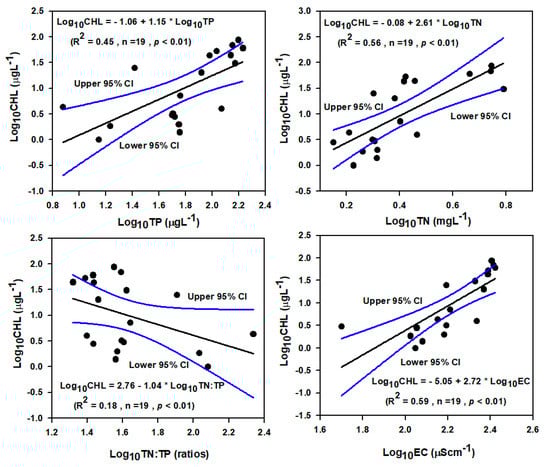
Figure 4.
Empirical Relationship among TP, TN, TN:TP, and CHL. (TN—total nitrogen, TP—total phosphorus, CHL—chlorophyll).
3.4. Fish Trophic and Tolerance Guilds in Relation to Water Quality Parameters
The abundance of trophic guild is closely related to water quality factors in the watershed (Figure 5). The highest abundance of omnivores was found in the concentration between 20 to 80 µgL−1 of TP; on the other hand, the lowest abundance of omnivores was observed in 140 µgL−1 of TP. The abundance of insectivores with TP did not display any specific functional relationship. It is notable that the carnivores showed a positive functional relationship with TP, suggesting carnivore richness increased with the concentration of TP; hence carnivores were abundant in the watershed. A similar pattern was observed for carnivores in relation to TN, BOD, COD, and CHL. The omnivores suggested a negative functional relationship with the concentration of TN, BOD, COD, and CHL. The abundance of insectivores points out a positive linear relationship with nutrients (TP, TN), organic matters (BOD and COD), and primary productivity (CHL).
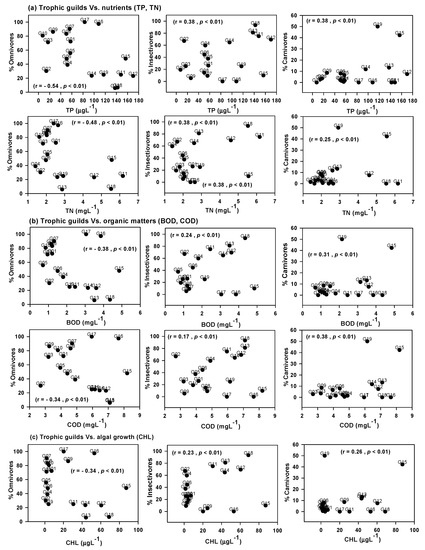
Figure 5.
Trophic guild analysis with water quality factors (TN—total nitrogen, TP—total phosphorus, N:P ratios, BOD—biological oxygen demand, COD—chemical oxygen demand, CHL—chlorophyll).
Tolerance guilds of the watershed are highly influenced by the nutrients (TN and TP), organic contents (BOD and COD), and chlorophyll (Figure 6). The relative abundance of tolerant and intermediate species presented a matchless relationship with the concentration of TP. The abundance of sensitive species was lower in the Geum River watershed and they can live with a minimum concentration of TP, TN, BOD, COD, and CHL. The sensitive species showed quick response to increasing levels of nutrients, organic matters, and eutrophication in the watershed. The abundance of tolerant and intermediate species disclosed a positive linear functional relationship with TP, TN, COD, BOD, and chlorophyll. In contrast, sensitive species exhibited a negative functional relationship with TP, TN, COD, and chlorophyll.
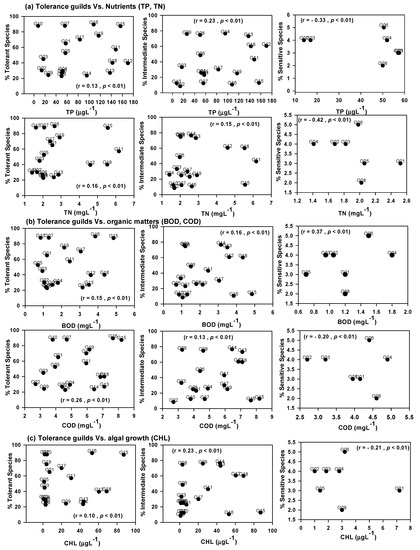
Figure 6.
Tolerance guild analysis with water quality factors (TN—total nitrogen, TP—total phosphorus, N:P ratios, BOD—biological oxygen demand, COD—chemical oxygen demand, CHL—chlorophyll).
It is widely accepted that nutrients, organic matters, and chlorophyll can alter the trophic and tolerance guilds in the watershed. Earlier research on trophic and tolerance guilds revealed that the tolerant species had a positive linear relationship and sensitive species had a negative functional relationship with water quality parameters, which supports our present research [16,30]. The higher abundance of omnivores and carnivores indicates that the watershed is polluted because of excessive nutrient and organic matter loadings from upstream to downstream [37].
3.5. Chemical Health Assessment Using Chemical Pollution Index (CPI) Model
The chemical health assessment of the watershed was carried out by a modified chemical pollution index. In the CPI model, we used eight water quality factors (Table 1). The concentration of TN and TP exceeded the standard value according to the Ministry of Environment of Korea. The value of TN:TP ratio indicates that the Geum River watershed is a P-limited system and trophic status is mesotrophic to oligotrophic. The BOD concentration was >1 mgL−1 in all sites except site G03 and G10, suggesting that the watershed has been degraded. Suspended solids and ionic contents were higher in the downstream region because of high flushing rate, agricultural and urban run-off. The CHL values from the sites G09 to G18 were higher, suggesting that these sites are in eutrophic condition and are highly deteriorated. The CPI model suggested that the upstream of the watershed was in good–fair condition whereas it was in a poor–very poor condition in the downstream region except for G19. Some previous studies advocated that TP, TN, and TN:TP are the key regulating factors for the algal growth in the waterbody [16,38]. The present research signposts that watershed health is in an anomalous state because of excessive nutrient and organic matter and ionic content enrichment. Organic pollution, non-algal turbidity, and ionic pollution can be determined by the concentration of BOD, TSS, and EC, correspondingly, in the watershed. Our results harmonized with some aforementioned findings that downstream is largely affected by water pollutants [16,39].

Table 1.
Chemical health assessment using the chemical pollution index (CPI) model.
3.6. Fish Community Analysis
Analysis of species composition in the watershed based on relative abundance (RA), the total number of individuals (TNI), and the total number of species (TNS) along with tolerance, trophic, and habitat guilds showed a substantial disproportion (Table 2). A total of 44 species were observed in the mainstream of the Geum River watershed. The dominated species in the watershed were Zacco platypus (32.99%), Zacco koreanus (12.43%), and Squalidus chankaensis tsuchigae (11.19%), etc., which was similar with some previous studies on watershed [28]. One endangered species (Pseudopungtungia nigra) was found in the upstream of the watershed. Three exotic fish (Micropterus salmoides, Lepomis macrochirus, and Cyprinus carpio) were observed in the watershed.
Table 2.
Species composition analysis (To—tolerance guild, Tr—trophic guilds, Ha—habitat guilds, TS—tolerant species, SS—sensitive species, IS—intermediate species, O—omnivores, I—insectivores, C—carnivores, RB—riffle benthic, TNI—total number of individuals, TNS—total number of species, RA—relative abundance, ¥—exotic fish).
Analysis of tolerance guilds showed that 6 sensitive species, 25 intermediate species, and 13 tolerant species were detected in the watershed. Sensitive species with relatively high abundance was Zacco koreanus (12.43%), while tolerant species was Zacco platypus (32.99%), and intermediate species was Squalidus chankaensis tsuchigae (11.19%). In the Geum River watershed, the abundance of tolerant species was higher. According to the spatial tolerance guild, tolerant species accounted for 71.4% of the total species in G19 of downstream. The ratio of tolerant species increased as it moved from upstream to downstream. According to the category of trophic guilds, insectivore was 19 species, carnivore was 7 species, and the omnivore was 18 species. It has been reported that an increase in the inflow of organic and toxic substances decreases the relative abundance of sensitive species while increases the abundance of insectivore species [17].
3.7. Biological Health Assessment Using the Index of Biotic Integrity (IBI) Model
The index of biotic integrity (IBI) model based on fish assemblages had been used to assess the ecological health of the mainstream in Geum River watershed (Table 3). The average IBI value in the mainstream of the watershed was 17.68, which indicates that the watershed is in poor condition. Among the 19 sites, 8 sites were in fair condition, 6 sites were in poor condition, and 5 sites were in very poor condition. The upstream of the watershed was in fair condition but degraded from upstream to downstream because of the higher abundance of tolerant and omnivore fish species as well as a lower amount of sensitive species and insectivores. In addition, anomalies were collected at G09. The water quality of Lake Daecheong deteriorated because of the inflow of nutrients from tributaries and dominant tolerant species.
Table 3.
Biological health assessment using index of biotic integrity model (TNS: total number of native species, RBS: total number of riffle benthic species, SS: total number of sensitive species, % TS: % individuals as tolerant species, % OS: % individual as omnivores, % IS: % individuals as native insectivores, TNI: total number of individual, % AI: % individuals with anomalies.
Sites G11, G12, and G13 are downstream of Lake Daecheong and categorized to be in fair and poor state. Sites G15, G16, and G17, down of Baekje Bridge and Baekma River Bridge, revealed that the ecological health was in very poor condition. The abundance of native, riffle benthic, and sensitive fish species declined with an increase in the excessive nutrients and organic matter content and non-algal turbidity, which strongly supports our present study [16]. In 1999 and 2000, the USEPA put forward that the higher abundance of omnivores, tolerant, carnivores was found in the degraded system [5,40].
3.8. Ecological Health in Relation to Chemical Parameters and Fish Model Metrics
The ecological health of the watershed is closely related to water quality parameters (Figure 7). The ecological health of the watershed showed a linearly decreasing trend with increasing the concentration of TP, TN, BOD, COD, TSS, and CHL. The ecological health are related with TP (r = −0.37, p < 0.01), CHL (r = −0.37, p < 0.01), BOD (r = −0.42, p < 0.01), and COD (r = −0.47, p < 0.01) in the watershed. It indicates that water quality parameters affect the ecological health of rivers. The ecological health declined with the increased relative abundance of omnivores (R2 = 0.31, r = −0.55, n = 19, p < 0.01), and tolerant species ((R2 = 0.25, r = −0.50, n = 19, p < 0.01), Figure 8). In the IBI model, regression analysis of IBI-omnivores and IBI-tolerant species was explained as 31% and 25%, respectively. The ecological health of the watershed showed an upward trend with the increasing richness of insectivores, sensitive species, native fish and individuals. The empirical relationship between IBI-insectivores (R2 = 0.45, r = 0.67, n =19, p < 0.01) and IBI-total number of native fish species (R2 = 0.30, r = 0.55, n = 19, p < 0.01) showed a strong positive relationship in comparison to IBI-sensitive species (R2 = 0.19, r = 0.44, n = 19, p < 0.01) and IBI-total number of native individuals (R2 = 0.15, r = 0.39, n = 19, p < 0.01). The present result concurred with the previous finding of Lee et al. (2018) and USEPA (1999 and 2000) [5,28,40].
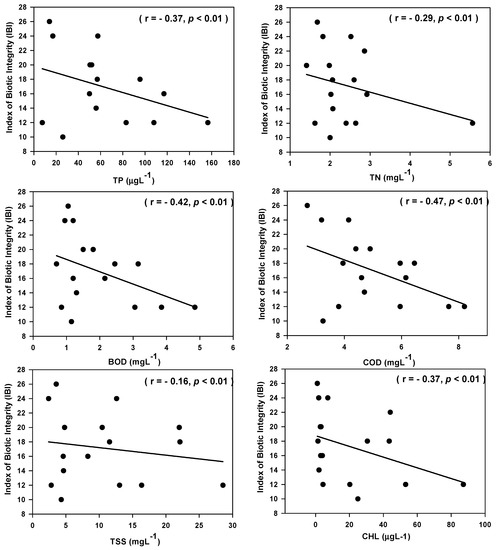
Figure 7.
Index of biotic integrity (IBI) in relation to water quality parameters in the Geum River watershed (TN—total nitrogen, TP—total phosphorus, BOD—biological oxygen demand, COD—chemical oxygen demand, TSS—total suspended solids, CHL—chlorophyll).
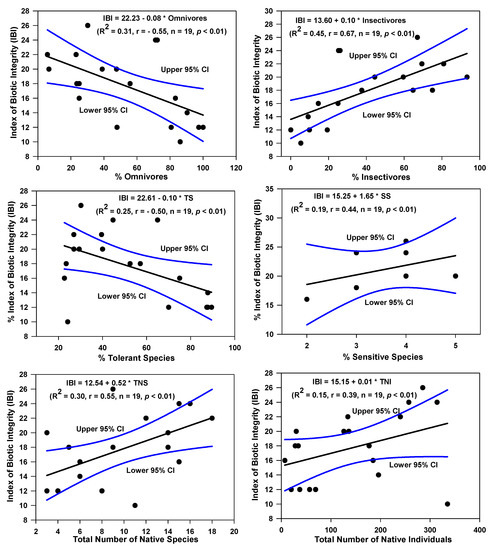
Figure 8.
IBI with trophic and tolerance guilds and TNS and TNI in the watershed.
3.9. Prediction of Chemical Pollution Index and Index of Biotic Integrity Using Artificial Neural Network (ANN) Model
The performance and validity of ANN is shown in Figure 9, Figure 10 and Figure 11. The chemical pollution index (CPI) model was predicted by using the ANN model using nine water quality factors (Figure 9). The observed CPI are highly correlated with predicted CPI (R2 = 0.99, RMSE = 0.08, MAE = 0.06, p < 0.01). In CPI prediction model, the CHL was the most important variable. We used a different biological and chemical variable to predict the IBI value in the watershed (Figure 10 and Figure 11). To see the performance of the ANN model, we used a different input variable. The 17 inputs ANN (R2 = 0.98, RMSE = 0.64, MAE = 0.47, p < 0.01) and 8 inputs ANN (R2 = 0.97, RMSE = 0.68, MAE = 0.49, p < 0.01) model showed greater predictability performance in comparison to 9 (R2 = 0.73, RMSE = 2.39, MAE = 1.71, p < 0.01) and 5 (R2 = 0.91, RMSE = 1.37, MAE = 1.10, p < 0.01) inputs ANN model. CHL, TSS, TNI, AI, N:P were the most important factors for the prediction of IBI value in the watershed. Our present study suggested that the statistical learning approach ANN is one of the good tools to predict the ecological health of the river system, which is concurred with the previous studies of Lee et al. 2018 [28].
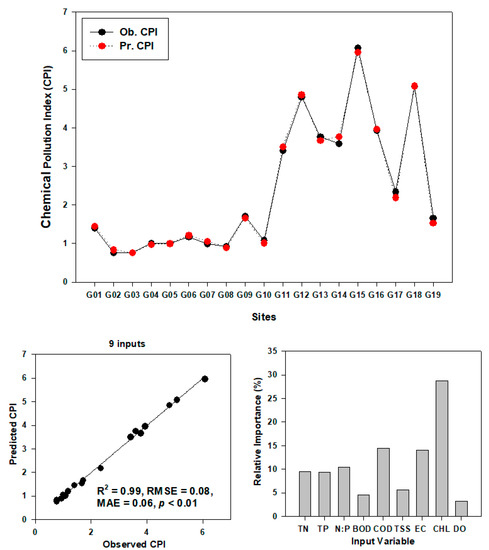
Figure 9.
Prediction of the CPI model by artificial neural network model (TN—total nitrogen, TP—total phosphorus, N:P ratios, BOD—biological oxygen demand, COD—chemical oxygen demand, TSS—total suspended solids, EC—electrical conductivity, CHL—chlorophyll, and DO—dissolved oxygen).

Figure 10.
Prediction of IBI using artificial neural network tool in the Geum River watershed.
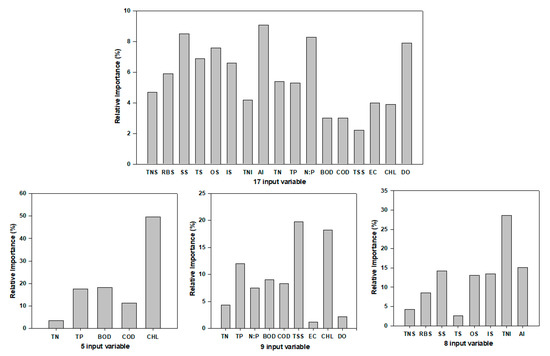
Figure 11.
Variable importance in ANN to predict IBI model (TN—total nitrogen, TP—total phosphorus, N:P ratios, BOD—biological oxygen demand, COD—chemical oxygen demand, TSS—total suspended solids, EC—electrical conductivity, CHL—chlorophyll, DO—dissolved oxygen, TNS—total native fish species, RBS—riffle benthic species, SS—sensitive species, TS—tolerant species, IS—intermediate species, TNI—total number of individuals, AI—anomalies).
3.10. Principal Component Analysis (PCA) in Relation to Chemicals and Fish Metrics
The principal component analysis was carried out to extract the most important factors and physicochemical parameters affecting the ecological health of the watershed (Figure 12). Because of the complex relationships among water quality factors, trophic and tolerance guilds, it was difficult to draw clear conclusions. However, not only can principal component analysis extract the information to some extent and explain the structure of the data in detail on spatial characteristics by clustering the water quality parameters and fish guilds, but it can also describe their different characteristics and help to elucidate the relationship between water quality parameters and fish guilds [41]. The first and second axis of PCA accounts for approximately 60.97% and 15.77% of the total variance, respectively. The abundance of tolerant species, carnivores, omnivores were dominant in downstream, indicating that the downstream health condition was deteriorated because of organic and nutrient pollutants and excessive chlorophyll growth. The present results are similar to that of Atique and An (2018) and Lee et al. (2018) [16,28].
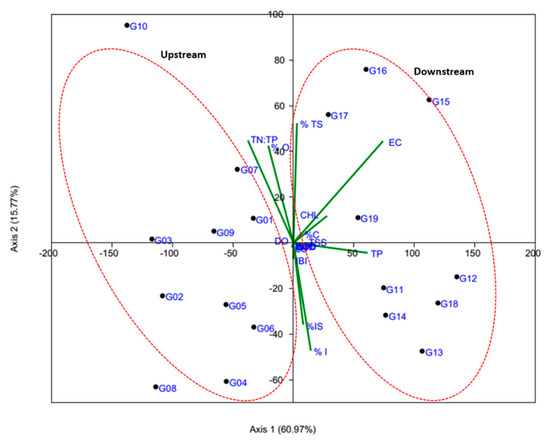
Figure 12.
Principal component analysis based on water quality factors and fish guilds. TN—total nitrogen, TP—total phosphorus, N:P ratios, BOD—biological oxygen demand, COD—chemical oxygen demand, TSS—total suspended solids, EC—electrical conductivity, CHL—chlorophyll, SS—sensitive species, TS—tolerant species, IS—intermediate species, % O—omnivores, % C—carnivores, % I—insectivores).
3.11. Site Grouping by Cluster Analysis (CA)
The cluster analysis (CA) is a strong tool for solving classification problems (Figure 13). The objective of CA is to place factors or variables into groups such that the degree of association is strong between members of the same cluster and weak between members of different clusters [41,42]. In this study, CA showed a strong spatial association on the basis of variations of water quality factors and fish assemblages. The dendrogram indicates pollution status as well as the effect of anthropogenic activities at the sampling sites. It provides a visual summary of the clustering processes, presenting a picture of the groups and their proximity. Cluster analysis (CA) was used to detect similarity among 19 sampling sites. The Bay–Curtis similarity analysis confirmed that there is a similarity of 87% among sites G11, G12, G18, G13, and G14. The generated dendrogram grouped into three clusters based on 70% of their similarity of physicochemical parameters and fish trophic and tolerance guilds. Using the Bay–Curtis analysis (up to 65% similarity) we categorized the watershed into two regions including upstream (G01, G02, G03, G04, G05, G06, G07, G08, G09, G10) and downstream (G11, G12, G13, G14, G15, G16, G17, G18, and G19).
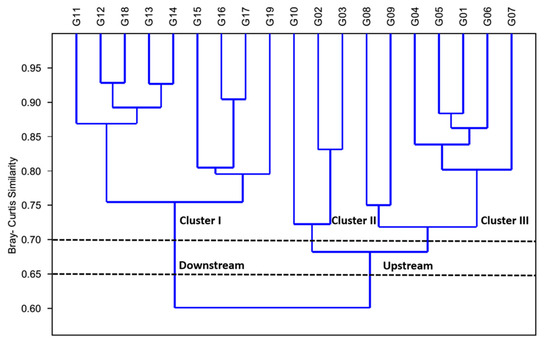
Figure 13.
Cluster analysis of the Geum River watershed based on water quality factors and fish guilds.
4. Conclusions
In the present study, the chemical parameter model of CPI and the biological model of the index of biotic integrity (IBI) were used to assess the river health in the watershed. Generally, the chemical health of the upstream was in good-fair condition because of fewer human disturbances, while it was poor to very poor condition in the downstream region because of nutrient, organic, and ionic enrichments. The biological health based on IBI model also suggested that the watershed health was in fair to very poor condition. The ANN model also indicated that the chemical and biological health of the Geum River was in fair to very poor condition. The PCA and cluster analysis revealed that the abundance of tolerant and omnivore species was dominant because of excessive nutrients and organic matter in the watershed. The overall ecological health of the Geum River was in an abnormal condition and needs immediate actions for proper management.
Author Contributions
J.H. and M.M. conceived the idea, designed the experiments, analyzed the data, and wrote the manuscript under the supervision of K.-G.A.
Funding
This work was conducted by Korea Environment Industry & Technology Institute (KEITI) through “Exotic Invasive Fish Species Management Project”, funded by Korea Ministry of Environment (MOE) (Grant No.: 2018-1467-02) and Daejeon Green Environment Center under the Research Development Program (2016).
Acknowledgments
The authors are highly acknowledged to the Korea Ministry of Environment and Daejeon Green Environment Center for their assistance.
Conflicts of Interest
The Authors have no conflict of interest.
References
- Costanza, R.; Alperovitz, G.; Daly, H.E.; Farley, J.; Franco, C.; Jackson, T.; Kubiszewski, J.; Schor, J.; Victor, P. Building a Sustainable and Desirable Economy-in-Society-in-Nature; United Nations Division for Sustainable Development: New York, NY, USA, 2012. [Google Scholar]
- Limburg, K.E. Aquatic Ecosystem Services. In Encyclopedia of Inland Waters; Likens, G.E., Ed.; Academic Press: Oxford, UK, 2009; pp. 25–30. [Google Scholar]
- Dudgeon, D.; Arthington, A.H.; Gessner, M.O.; Kawabata, Z.; Knowler, D.J.; Leveque, C.; Naiman, R.J.; Prieur Richard, A.H.; Soto, D.; Stiassny, M.L. Freshwater biodiversity: Importance, threats, status and conservation challenges. Biol. Rev. 2005, 81, 163–182. [Google Scholar] [CrossRef] [PubMed]
- Davies, P.; Harris, J.; Hillman, T.J.; Walker, K.F. The sustainable rivers audit: Assessing river ecosystem health in the Murray–darling basin, Australia. Mar. Freshw. Res. 2010, 61, 764–777. [Google Scholar] [CrossRef]
- Barbour, M.T.; Gerritsen, J.; Snyder, B.; Stribling, J. Rapid Bioassessment Protocols for Use in Streams and Wadeable Rivers: Periphyton, Benthic Macroinvertebrates, and Fish, 2th ed.; USEPA: Washington, DC, USA, 1999.
- Hering, D.; Borja, A.; Carstensen, J.; Carvalho, L.; Elliott, M.; Feld, C.K. The European water framework directive at the age of 10: A critical review of the achievements with recommendations for the future. Sci. Total Environ. 2010, 408, 4007–4019. [Google Scholar] [CrossRef] [PubMed]
- Atique, U.; Lim, B.; Yoon, J.; An, K.G. Biological Health Assessments of Lotic Waters by Biotic Integrity Indices and their Relations to Water Chemistry. Water 2019, 11, 436. [Google Scholar] [CrossRef]
- Yu, X.; He, D.; Phousavanh, P. Balancing River Health and Hydropower Requirements in the Lancang River Basin; Springer: Singapore, 2019; ISBN 978-981-13-1564-0. Available online: https://www.springer.com/gp/book/9789811315640 (accessed on 20 August 2019).
- Wu, W.; Xu, Z.; Zhan, C.; Yin, X.; Yu, S. A new framework to evaluate ecosystem health: A case study in the Wei River basin, China. Environ. Monit. Assess. 2015, 187, 460. [Google Scholar] [CrossRef]
- Yoder, C.O. The Integrated Biosurvey as a Tool for 852 Evaluation of Aquatic Life Use Attainment and Impairment 853 in Ohio Surface Waters; EPA 440-5-91-005; USEPA: Washington, DC, USA, 1991; pp. 110–122.
- Heatherly, T., II; Whiles, M.R.; Royer, T.V.; David, M.B. Relationships between water quality, habitat quality, and macroinvertebrate assemblages in Illinois streams. J. Environ. Qual. 2007, 36, 1653–1660. [Google Scholar] [CrossRef]
- Bach, E. A chemical index for surveillance of river water quality. Dtsch. Gewasserkd. Mitt. 1980, 24, 102–106. [Google Scholar]
- Trivedi, R.C.; De-Kruijf, H.A.M.; de-Zwart, D. The development and application of a yardstick for water quality evaluation. Sci. Total Environ. 1993, 134, 1191–1202. [Google Scholar] [CrossRef]
- Dodds, W.K.; Jones, J.R.; Welch, E.B. Suggested classification of stream trophic state: Distributions of temperate stream types by chlorophyll, total nitrogen and phosphorus. Water Res. 1998, 32, 1455–1462. [Google Scholar] [CrossRef]
- Yu, X.; Xia, J.; Yang, J.; Ma, W. Preliminary study on the index system and assessment method of green hydropower. J. Hydroelectr. Eng. 2011, 30, 71–77. (In Chinese) [Google Scholar]
- Atique, U.; An, K.G. Stream Health Evaluation Using a Combined Approach of Multi-Metric Chemical Pollution and Biological Integrity Models. Water 2018, 10, 661. [Google Scholar] [CrossRef]
- Karr, J.R. Assessment of biotic integrity using fish communities. Fisheries 1981, 6, 21–27. [Google Scholar] [CrossRef]
- Simon, T.P.; Morris, C.C. Relationships among varying sampling distance and the IBI in warmwater, headwater streams of the Eastern Corn Belt Plain. J. Monit. Assess. 2014, 186, 6537–6551. [Google Scholar] [CrossRef] [PubMed]
- Hallett, C.S.; Valesini, F.J.; Clarke, K.R.; Hesp, S.A.; Hoeksema, S.D. Development and validation of fish-based, multimetric indices for assessing the ecological health of Western Australian estuaries. Estuar. Coast. Shelf Sci. 2012, 104–105, 102–113. [Google Scholar] [CrossRef]
- Republic of South Africa Department of Water and Sanitation (RSADWA). River Eco-Status Monitoring Programme; RSADWA: Pretoria, South Africa, 2016. [Google Scholar]
- Hughes, R.M. Use of watershed characteristics to select control streams for estimating effects of metal mining wastes on extensively disturbed streams. Environ. Manag. 1985, 9, 253–262. [Google Scholar] [CrossRef]
- Leonard, P.M.; Orth, D.J. Application and testing of an index ofbiotic integrity in small, coolwater streams. Trans. Am. Fish. Soc. 1986, 115, 401–414. [Google Scholar] [CrossRef]
- Berkman, H.E.; Rabeni, C.F. Effect of siltation on fish communities. Environ. Biol. Fishes 1987, 18, 285–294. [Google Scholar] [CrossRef]
- Ormerod, S.J. Current issues with fish and fisheries: Editor’s overview and introduction. J. Appl. Ecol. 2003, 40, 204–213. [Google Scholar] [CrossRef]
- An, K.G.; Lee, J.Y.; Bae, D.Y.; Kim, J.H.; Hwang, S.J.; Won, D.H. Ecological assessments of aquatic environments using a multi-metric model in major nationwide stream watersheds. J. Korean Water Qual. 2006, 22, 796–804. [Google Scholar]
- MOE/NIER. Study on Development of Methods for Synthetic Assessment of Water Environment 2006; The Ministry of Environment/National Institute of Environmental Research: Sejong, Korea, 2006.
- MOE/NIER. Survey and Evaluation of Aquatic Ecosystem Health in Korea 2013; The Ministry of Environment/National Institute of Environmental Research: Sejong, Korea, 2013.
- Lee, S.J.; Lee, E.H.; An, K.G. Lotic Ecosystem Health Assessments Using an Integrated Analytical Approach of Physical Habitat, Chemical Water Quality, and Fish Multi-Metric Health Metrics. Pol. J. Environ. Stud. 2018, 27, 2113–2131. [Google Scholar] [CrossRef]
- Marker, A.F.H.; Crowther, C.A.; Gunn, R.J.M. Methanol and acetone as solvents for estimating chlorophyll a and phaeopigments by spectrophotometry. Arch. Hydrobiol. Beih. Ergeb. Limnol. 1980, 14, 52–59. [Google Scholar]
- Ohio Environmental Protection Agency. Biological Criteria for the Protection of Aquatic Life: Volume III. Standardized Biological Field Sampling and Laboratory Method for Assessing Fish and Macroinvertebrate Communities; Division of Surface Water, Ecological Assessment Section: Columbus, OH, USA, 1989; p. 66.
- An, K.G.; Jung, S.J.; Choi, S.S. An Evaluation on Health Conditions of Pyong-Chang River using the Index of Biological Integrity (IBI) and Qualitative Habitat Evaluation Index (QHEI). Korean J. Limnol. 2001, 34, 153–165. [Google Scholar]
- An, K.G.; Kim, D.S.; Kong, D.S.; Kim, S.D. Integrative assessments of a temperate stream based on a multimetric determination of biological integrity, physical habitat evaluations, and toxicity tests. Bull. Environ. Contam. Toxicol. 2004, 73, 471–478. [Google Scholar] [CrossRef] [PubMed]
- Huang, J.; Gao, J. An ensemble simulation approach for artificial neural network: An example from chlorophyll a simulation in Lake Poyang, China. Ecol. Inform. 2017, 37, 52–58. [Google Scholar] [CrossRef]
- Sigma Plot, Version 10; Systat Software, Inc.: San Jose, CA, USA, 2018; Available online: www.systatsoftware.com (accessed on 22 October 2018).
- Hammer, Ø. The Past of the Future; PAST, Version 3.18 (Software); Natural History Museum, University of Oslo: Oslo, Norway, 2017. [Google Scholar]
- Kim, J.H.; Yeom, D.H.; An, K.G. Diagnosis of Sapgyo stream watershed using the approach of integrative star-plot area. Korean J. Ecol. Environ. 2010, 43, 356–368. [Google Scholar]
- Mamun, M.; An, K.G. Ecological Health Assessments of 72 Streams and Rivers in Relation to Water Chemistry and Land-Use Patterns in South Korea. Turk. J. Fish. Aquat. Sci. 2018, 18, 871–880. [Google Scholar] [CrossRef]
- Xiaomei, S.; Alan, D.S.; Oudsema, M.; Hassett, M.; Xi, L. The influence of nutrients limitation on phytoplankton growth and microcystins production in Spring Lake, USA. Chemosphere 2019, 234, 34–42. [Google Scholar]
- Choi, J.W.; Han, J.H.; Park, C.S.; Ko, D.G.; Kang, H.I.; Kim, J.Y.; Yun, Y.J.; Kwon, H.H.; An, K.G. Nutrients and sestonic chlorophyll dynamics in Asian lotic ecosystems and ecological stream health in relation to land-use patterns and water chemistry. Ecol. Eng. 2015, 79, 15–31. [Google Scholar] [CrossRef]
- U.S. Geological Survey. Biomonitoring of Environmental Status and Trends (Best) Program: Selected Methods for Monitoring Chemical Contaminants and Their Effects in Aquatic Ecosystems; UITR-2000–0005 Information and Technology Report; U.S. Geological Survey: Columbia, OR, USA, 2000; p. 81.
- Bhat, S.A.; Meraj, G.; Yaseen, S.; Pandit, A.K. Statistical Assessment of Water Quality Parameters for Pollution Source Identification in Sukhnag Stream: An Inflow Stream of Lake Wular (Ramsar Site), Kashmir Himalaya. J. Ecosyst. 2014, 2014, 898054. [Google Scholar] [CrossRef]
- Brogueira, M.J.; Cabec, A.G. Identification of similar environmental areas in Tagus estuary by using multivariate analysis. Ecol. Indic. 2006, 6, 508–515. [Google Scholar] [CrossRef]
© 2019 by the authors. Licensee MDPI, Basel, Switzerland. This article is an open access article distributed under the terms and conditions of the Creative Commons Attribution (CC BY) license (http://creativecommons.org/licenses/by/4.0/).