1. Introduction
The temperature of river water constitutes an important element of the hydrological regime, being subjected to daily, seasonal, annual, and multi-annual change [
1]. Seasonal changes are the consequence of the influence of climatic factors predominant in a given geographical zone, whereas multi-annual changes may additionally point to the impact of local factors, also anthropogenic [
2,
3,
4,
5].
The thermal characteristics of river waters are impacted first and foremost by air temperature, the variability of which points to a considerable dependence on macroscale types of atmospheric circulation [
6,
7,
8,
9,
10]. The exchange of thermal energy takes place primarily on the air–water level, and to a lesser extent on the riverbed–water level [
11]. Changes observed in water temperature are first and foremost the consequence of surface heat exchange with the atmosphere in processes of radiation, evaporation and convection, and also of the turbulent mixing of water of varying temperatures; this is impacted, among others, by the method and intensity of water-course supply connected with the seasonality of the hydrological cycle, and also by the inflow of wastes [
12]. Żelazny et al. [
13] have recognized the following as being the main factors controlling the variability of water temperature in mountain rivers (Tatry Mountains—Poland), which are characterized among others by a low degree of anthropogenic interference: height relations (48.5% of variability) and the thermal and hydrological regime of individual water-courses (22.5% of variability).
The existence of a relationship between fluctuations in air temperature and river water temperature has been confirmed under differing climatic conditions and at various levels of temporal resolution of measurement data [
4,
10,
11,
14,
15,
16]. The majority of studies result in high and statistically significant coefficients of correlation between variables and coefficients of determination (R
2 > 0.8), which means that more than 80% of river water temperature variability may be explained by the variability of air temperature [
2,
17,
18]. Research has shown that, in the case of rivers in the Northern Hemisphere, we may observe a seasonal distribution of water temperature, while exceptions to this rule may be the result of weather anomalies or of the impact of anthropogenic factors [
2,
4,
12,
19]. High correlations between annual and monthly air and river water temperature values have been demonstrated for various regions, among others in the United States and Canada [
16,
20,
21,
22,
23,
24], in Asia and Eurasia [
25,
26,
27,
28], and in Europe [
29,
30,
31,
32,
33,
34,
35,
36]. Studies concerning the thermal regime of Polish rivers have also confirmed the existence of significant relations and the impact of air temperature on the variability of river water temperature [
4,
5,
13,
37,
38,
39].
The increase in air temperature, a recently observed phenomenon which may unfavorably impact river water temperature, is given particular emphasis [
40,
41]. This tendency has been confirmed by research into changes in water temperature in European rivers, which has demonstrated that this parameter has increased by approximately 1–3 °C over the past century [
42]. An increase in river water temperature may lead to changes in the conditions of functioning of specific biotic communities, and this may fundamentally impact the ecological state of water-courses [
43]. Tendencies of climate change have found confirmation in the observed trend of rising air temperature, particularly in the winter seasons, which translates into an increase in river water temperature [
44]. A clear increase in the temperature of air and inland waters has been determined for the Polish Lowlands [
38], and this indicates that changes in climate influence water temperature in the area.
One of the aspects of research into the consequences of contemporary climate change and the variability of climate features in Europe concerns determining the importance of macroscale circulation types for shaping hydroclimatic conditions. The result of the influence of various circulation types is visible in, among others, changes in air temperature, precipitation, and plant formations, while close connections between these three elements are visible first and foremost on the regional scale [
7,
44]. Research into teleconnection patterns between circulation types and air temperature, and also river water temperature, has demonstrated the existence of mutual relations both in both positive and negative oscillation phases.
Circulation oscillations are long-term phenomena with a regional impact. However, the way in which they influence regional climate features is highly complicated, and they should therefore not be perceived as simple, linear dependences. Research carried out by Kenyon and Hegerl [
45] shows that temperature extremes are substantially affected by large-scale circulation patterns, and that they display distinct regional patterns of response to modes of climate variability. Modes of variability in large-scale atmospheric circulations are evident for the global effects of teleconnection, and they constitute an important factor of change in regional climatic extremes, particularly extremes of temperature. Acting in various ways, they impact, among others, the character of distribution of daily air temperature and its extremes, and sometimes also daily temperature (i.e., day and night). In the majority of regions around the world, contemporary warming is accompanied by an increase in the frequency and intensity of occurrence of heat waves and a decrease in the frequency and intensity of occurrence of cold waves [
41,
46,
47]. Similar trends are also being observed in Europe [
48,
49,
50,
51] and Poland [
52,
53,
54,
55], whereas the most intense warming is noted in winter and spring, while slight cooling may be observed in autumn. In the opinion of Kenyon and Hegerl [
45], all the main indices of atmospheric circulation are characterized by a considerable and universal impact on the probability of occurrence of temperature extremes in Europe. Research into the connections between seasonal temperature extremes in relation to macroscale circulation explains up to one-third (locally even one-half) of the variances of changes therein. However, it is not possible to fully foresee quantitative changes in atmospheric circulation, and this considerably impairs the ability to anticipate changes in extreme characteristics of temperature in the region. Individual macroscale circulations influence climatic conditions in Europe with varying intensity. Research has shown that interactions occur between macroscale atmospheric oscillations, and that these interactions tend to vary between seasons of the year and also during the positive and negative phases of these oscillations. The coincidence of certain of their common phases may cause extreme hydrological phenomena.
Studies conducted in Central Europe have confirmed the impact of various macroscopic types of atmospheric circulation, for example of the North Atlantic Oscillation (NAO), the Arctic Oscillation (AO), the East Atlantic (EA) pattern, the East Atlantic/Western Russia (EAWR) pattern, the Scandinavian (SCAND) pattern, and of the Atlantic Multidecadal Oscillation (AMO), on climate features and the hydrological regime of rivers and lakes. The impact of the North Atlantic Oscillation (NAO) on air temperature and atmospheric precipitation has been described in detail [
8,
28,
40,
56,
57,
58], as a macroscopic pattern of atmospheric circulation that determines climatic conditions [
59]. Regarding Poland, research into the NAO focuses on, for example, the occurrence of frosty days [
60], snow cover [
61,
62], seasonal river run-off [
63], and also water levels, thermal characteristics, and ice phenomena on lakes [
64,
65]. The influence of NAO variability on hydrological phenomena, including on the hydrological regime, changes in flow rate, and the thermal and ice regime of rivers and lakes, has been described, among others, by Yoo and D’Odorico [
29] and Klavins et al. [
33]. Relations between large scale oscillation patterns and river water temperature have been described, among others, by Webb and Nobilis [
2], whereas Hannah and Garner [
66] assessed the changes in water temperature which occurred in the United Kingdom in the 20th century, and also made predictions about changes therein for the 21st century. In the case of other circulation patterns, this approach continues to require more detailed research.
Positive NAO phases associated with an increased influx of warm and humid air over Europe, and in particular over the western part of the Continent, bring about warmer winters (which begin at a later date) and earlier springs [
6,
67]. A considerable increase in air temperature in the winter and spring seasons has been observed since the 1970s [
68]. Yoo and D’Odorico [
29] have demonstrated that the winter NAO index has a weak although important influence on the spring temperature regime in the Baltic region, and explain the most significant variables embedded in the cryophenological records. Uvo [
69] has conducted an analysis and regionalization of winter precipitation in Northern Europe using NAO relations as his basis. Przybylak et al. [
70] have determined the influence of the North Atlantic Oscillation and the Arctic Oscillation on thermal conditions in the cold season in Poland from the 16th to the 20th century.
In order to take into consideration the role of atmospheric circulation in shaping climate change, circulation indices presenting its most significant features in specific months, seasons, and years have been determined for Poland on a regional scale. These include the following indices: western circulation, southern circulation, and cyclonicity [
71]. Values of indices determined as averages for the whole country are very well correlated with indices for individual regions (the best correlation occurs for central Poland), and thus they may be used to assess the tendencies of climate circulatory features. Circulation indices on the regional scale excellently characterize the variability of weather conditions in Poland, which is caused by the differing forms of circulation. Currently, however, we possess insufficient information regarding how and which types of circulation—macroscale or regional—impact thermal conditions in Poland, thus shaping the features of the river thermal regime.
The objective of the paper consisted in determining the effect of teleconnection patterns on temporal and spatial changes in river water temperature in Poland. Research took into consideration the most important types of circulation which shape weather patterns in Central Europe with varying degrees of intensity. With regards to this part of Europe, the impact of certain teleconnections is only rarely discussed in topical literature. There are no studies for the territory of Poland that would concern relations between macroscale circulation types and river water temperature.
The analysis was based on the determination of the annual and seasonal activity and intensity of influence of macroscale types of atmospheric circulation on the development of water temperature in rivers functioning in the moderate climate zone, and on the identification of the month in which the effect of teleconnection patterns on changes in water temperature is greatest. Particular emphasis was placed on ascertaining the circulatory determinants of deviations of annual, seasonal, and monthly water temperature in various phases of the studied circulation types from average values for the years 1971–2015, and on establishing their statistical significance. Special attention was paid to anomalous situations when weather models in the researched part of Europe change, which may lead to the disruption of models of the river thermal regime.
Seasonal changes in the thermal characteristics of rivers impact the ecological state of waters and environmental conditions, whereas the significance of these changes depends on the susceptibility of individual features of the river system to the changing climate and the influence of local factors [
72,
73]. Information obtained in this regard may constitute the basis for determining thermal tolerance thresholds and performing assessments of the risk of exceeding values which condition the existence of water organisms—for example fresh-water fish—in river ecosystems. Among others, these data are useful for ascertaining the impact of changes in water temperature, conditioned by circulation, on the formation and disappearance of ice phenomena in the winter season, and, for the remaining seasons, on the course of biological and biogeochemical processes occurring in rivers. The results obtained may be used to supplement databases of river thermal regime features, which are indispensable for ensuring the rational management and protection of water ecosystems under changing climatic conditions.
2. Data and Research Methods
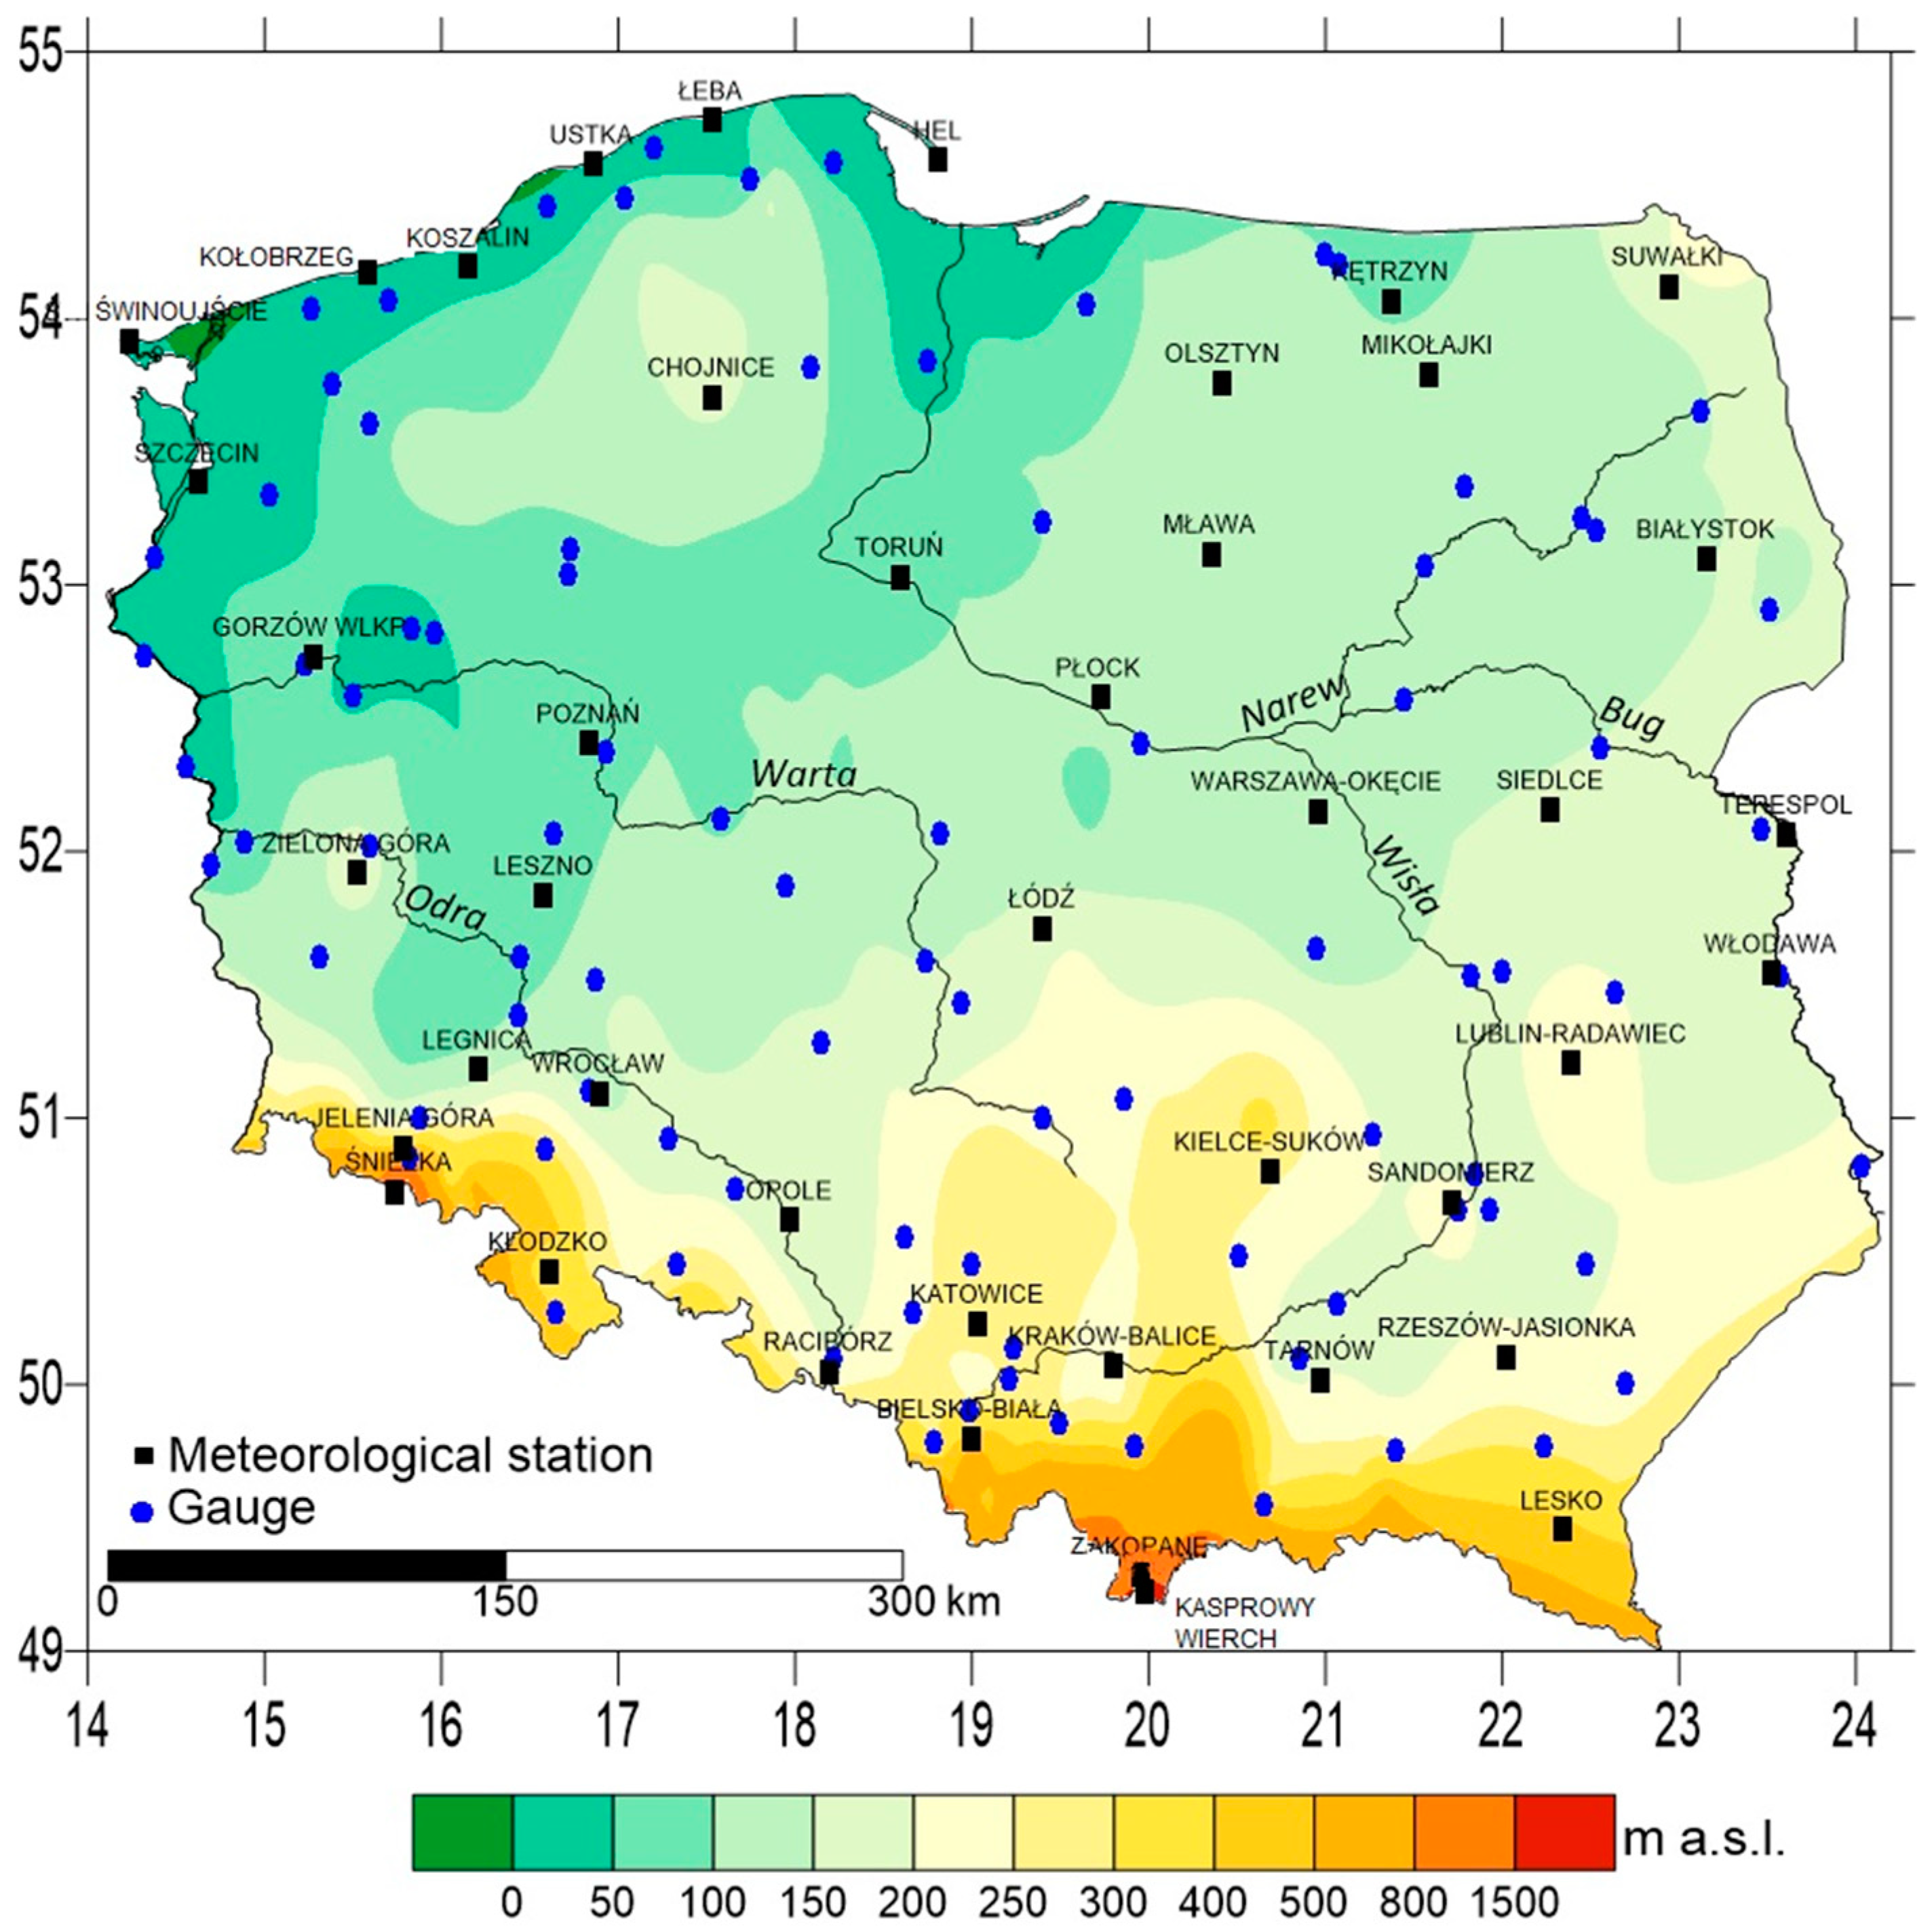
Research made use of daily water temperature values for 53 rivers in Poland gathered at 96 water gauge stations, and of air temperature values gathered at 43 meteorological stations (
Figure 1). The aforementioned data, which concerns the period 1971–2015, is held in its entirety at the Institute of Meteorology and Water Management—National Research Institute (IMGW-PIB) Warsaw, Poland.
Average monthly, seasonal, and annual water temperature and air temperature values were calculated on the basis of daily values thereof as the arithmetic mean. Data have been presented in relation to the hydrological year, which in Poland lasts from 1 November until 31 October.
In Poland, water temperature measurements are conducted using the standard measurement and observation network of the Institute of Meteorology and Water Management—National Research Institute (IMGW-PIB). Measurements are performed daily at 7:00 a.m. (GMT + 1) at water gauge stations located on the larger rivers using automatic station probes or, if these are unavailable, by means of mercury thermometers. Automatic measurements are taken simultaneously with water level measurements every 10 min with an accuracy of 0.1 °C (source IMGW-PIB). Manual measurements, on the other hand, are carried out immediately following observation of the water level using a hand-held thermometer at a depth of approximately 40 cm over a period of 5–10 min, with an accuracy of 0.1 °C. Measurements of air temperature (the ground layer) are taken at meteorological stations of the IMGW-PIB by means of electrical sensors or mercury thermometers. The mercury thermometers are placed in meteorological cages or radiation casings at a height of 2 m above ground level. Temperature measurement accuracy is 0.1 °C. The results of measurements are given with the appropriate time step or for precisely defined dates, depending on the specificity of individual parameters, i.e., daily extreme temperatures (minimal and maximum) are submitted every 12 h, while current air temperature measurements—every 10 min. Mean daily air temperature results from eight measurements and is calculated according to the method: (T00 + T03 + T06 + … + T21)/8. The hours are given in the UTC time. Water and air temperature measurement data are directly available on the
www.pogodynka.pl website and on the MONITOR IMGW-PIB platform as operational data.
The study utilized monthly indices of six macroscale types of atmospheric circulation: NAO, AO, EA, EAWR, SCAND, and AMO for the years 1971–2015. These data were obtained from the Climate Prediction Centre of NOAA (CPC NOAA) (
http://www.cpc.ncep.noaa.gov/data/teledoc/telecontents.shtml). The circulation types presented in the CPC database are determined through principal components analysis on the basis of monthly values of 500 hPa isobaric surface anomalies [
74]. The website also includes diagrams of individual teleconnections and loading patterns for selected months.
The North Atlantic Oscillation (NAO) is a bipolar type circulation with centers in the vicinity of Iceland and the Azores Islands. The positive NAO phase is associated with negative pressure anomalies in the area of the Icelandic Low and with positive anomalies in the area of the Azores High, which influences the formation of high-pressure gradients over the North Atlantic. Consequently, there occurs the advection of humid and warm air masses from the west and south-west over the area of Northern, Western, and Central Europe, which leads to the occurrence of mild winters. Whereas the negative NAO phase, which occurs under the opposite distribution of pressure anomalies, is characterized by the inflow of dry and cool air masses from the north-east which is accompanied by the slowing down of inflow from the western sector; this manifests itself in cold and snowy winters in central Europe [
7,
8,
75,
76].
The Arctic Oscillation (AO) is the dominant type of atmospheric circulation in the Northern Hemisphere, especially in the winter season. The positive AO phase is associated with lower than normal pressure in the Arctic region and higher than normal pressure in moderate geographical latitudes, which blocks the inflow of Arctic air masses to the lower geographical latitudes. In the negative AO phase, with higher than average pressure in the Arctic and lower pressure in the moderate geographical latitudes, air masses from the Arctic are directed southwards [
77,
78].
The Eastern Atlantic (EA) system is associated with two centers on the north–south line, while its southern sector is connected with the intertropical circulation (Barnston and Livezey 1987). In the positive EA phase, which is associated with a deep low-pressure system over the Atlantic, warm air masses are prevalent above Europe. Whereas in the negative EA phase there is a high-pressure system over the Atlantic, and this leads to the predominance of cool and dry air masses [
79,
80].
The Eastern European circulation type (EA/WR), which is characterized by two pressure centers situated latitudinally, has the least degree of impact on the climate and weather conditions of central Europe. In the positive phase, a low-pressure area is apparent over western Russia, and a high-pressure area above western Europe and the British Isles. In the positive phase, when a low-pressure area is located over western Russia and a high-pressure area above western Europe and the British Isles, the system brings about the inflow of air masses from the northern sector. Whereas in the negative phase, when the pressure areas are arranged reversely, air masses from the southern sector are predominant [
81,
82].
The Scandinavian circulation type (SCAND) concerns atmospheric circulation over northern Europe, and is associated with the region’s surrounding baric centers. In the positive phase, it is characterized by a strong rise in pressure throughout the Scandinavian Peninsula, with a center over Finland, while the low-pressure area stretches from Western Europe to Eastern Russia and Western Mongolia. Its negative phase is associated with lower than average pressure in Northern Europe [
83,
84].
The Atlantic Multidecadal Oscillation (AMO) is connected with the periodic and alternating occurrence of positive (warm phase) and negative (cool phase) temperature anomalies along the surface of the North Atlantic. The AMO type exerts a regional impact on the climate over the Atlantic and adjacent continents, and is associated with NAO [
85,
86].
An analysis of correlation between atmospheric circulation types and the temperature of river waters in Poland has been preceded by research into the homogeneity of water and air temperature measurement series. Specific meteorological stations and water gauge stations on rivers were selected following verification of the homogeneity of daily temperature series by means of an Alexandersson test (SNHT—Standard Normal Homogeneity Test) [
87,
88]. The Alexandersson test serves to detect the step change in mean value for a series of variables with a normal distribution, and further identifies the moment when the change occurred. However, the test may be also applied to log-normally distributed hydrological series, where normality is achieved by logarithmization. Sometimes, for example mean and maximum annual flows are subject to this distribution. The traditional test for equality of means is a competitor of the Alexandersson test, but it requires knowledge of the change point. The next stage of work consisted in the calculation of correlations between annual seasonal (winter—DJF; spring—MAM; summer—JJA; autumn—SON) and monthly indices of the analyzed types of atmospheric circulation and average annual and monthly air and river water temperature values. To this end, use was made of Spearman’s rank-order correlation test, which is a non-parametric test, while correlation is rank-based. The analysis makes it possible to correlate variables that have a non-normal distribution with each other at the order and quantitative level, and at the same time remains largely unsusceptible to outliers. Spearman’s rank-order correlation (utilized in the study) constitutes a measure of the monotonic statistical dependence, also non-linear, between random variables.
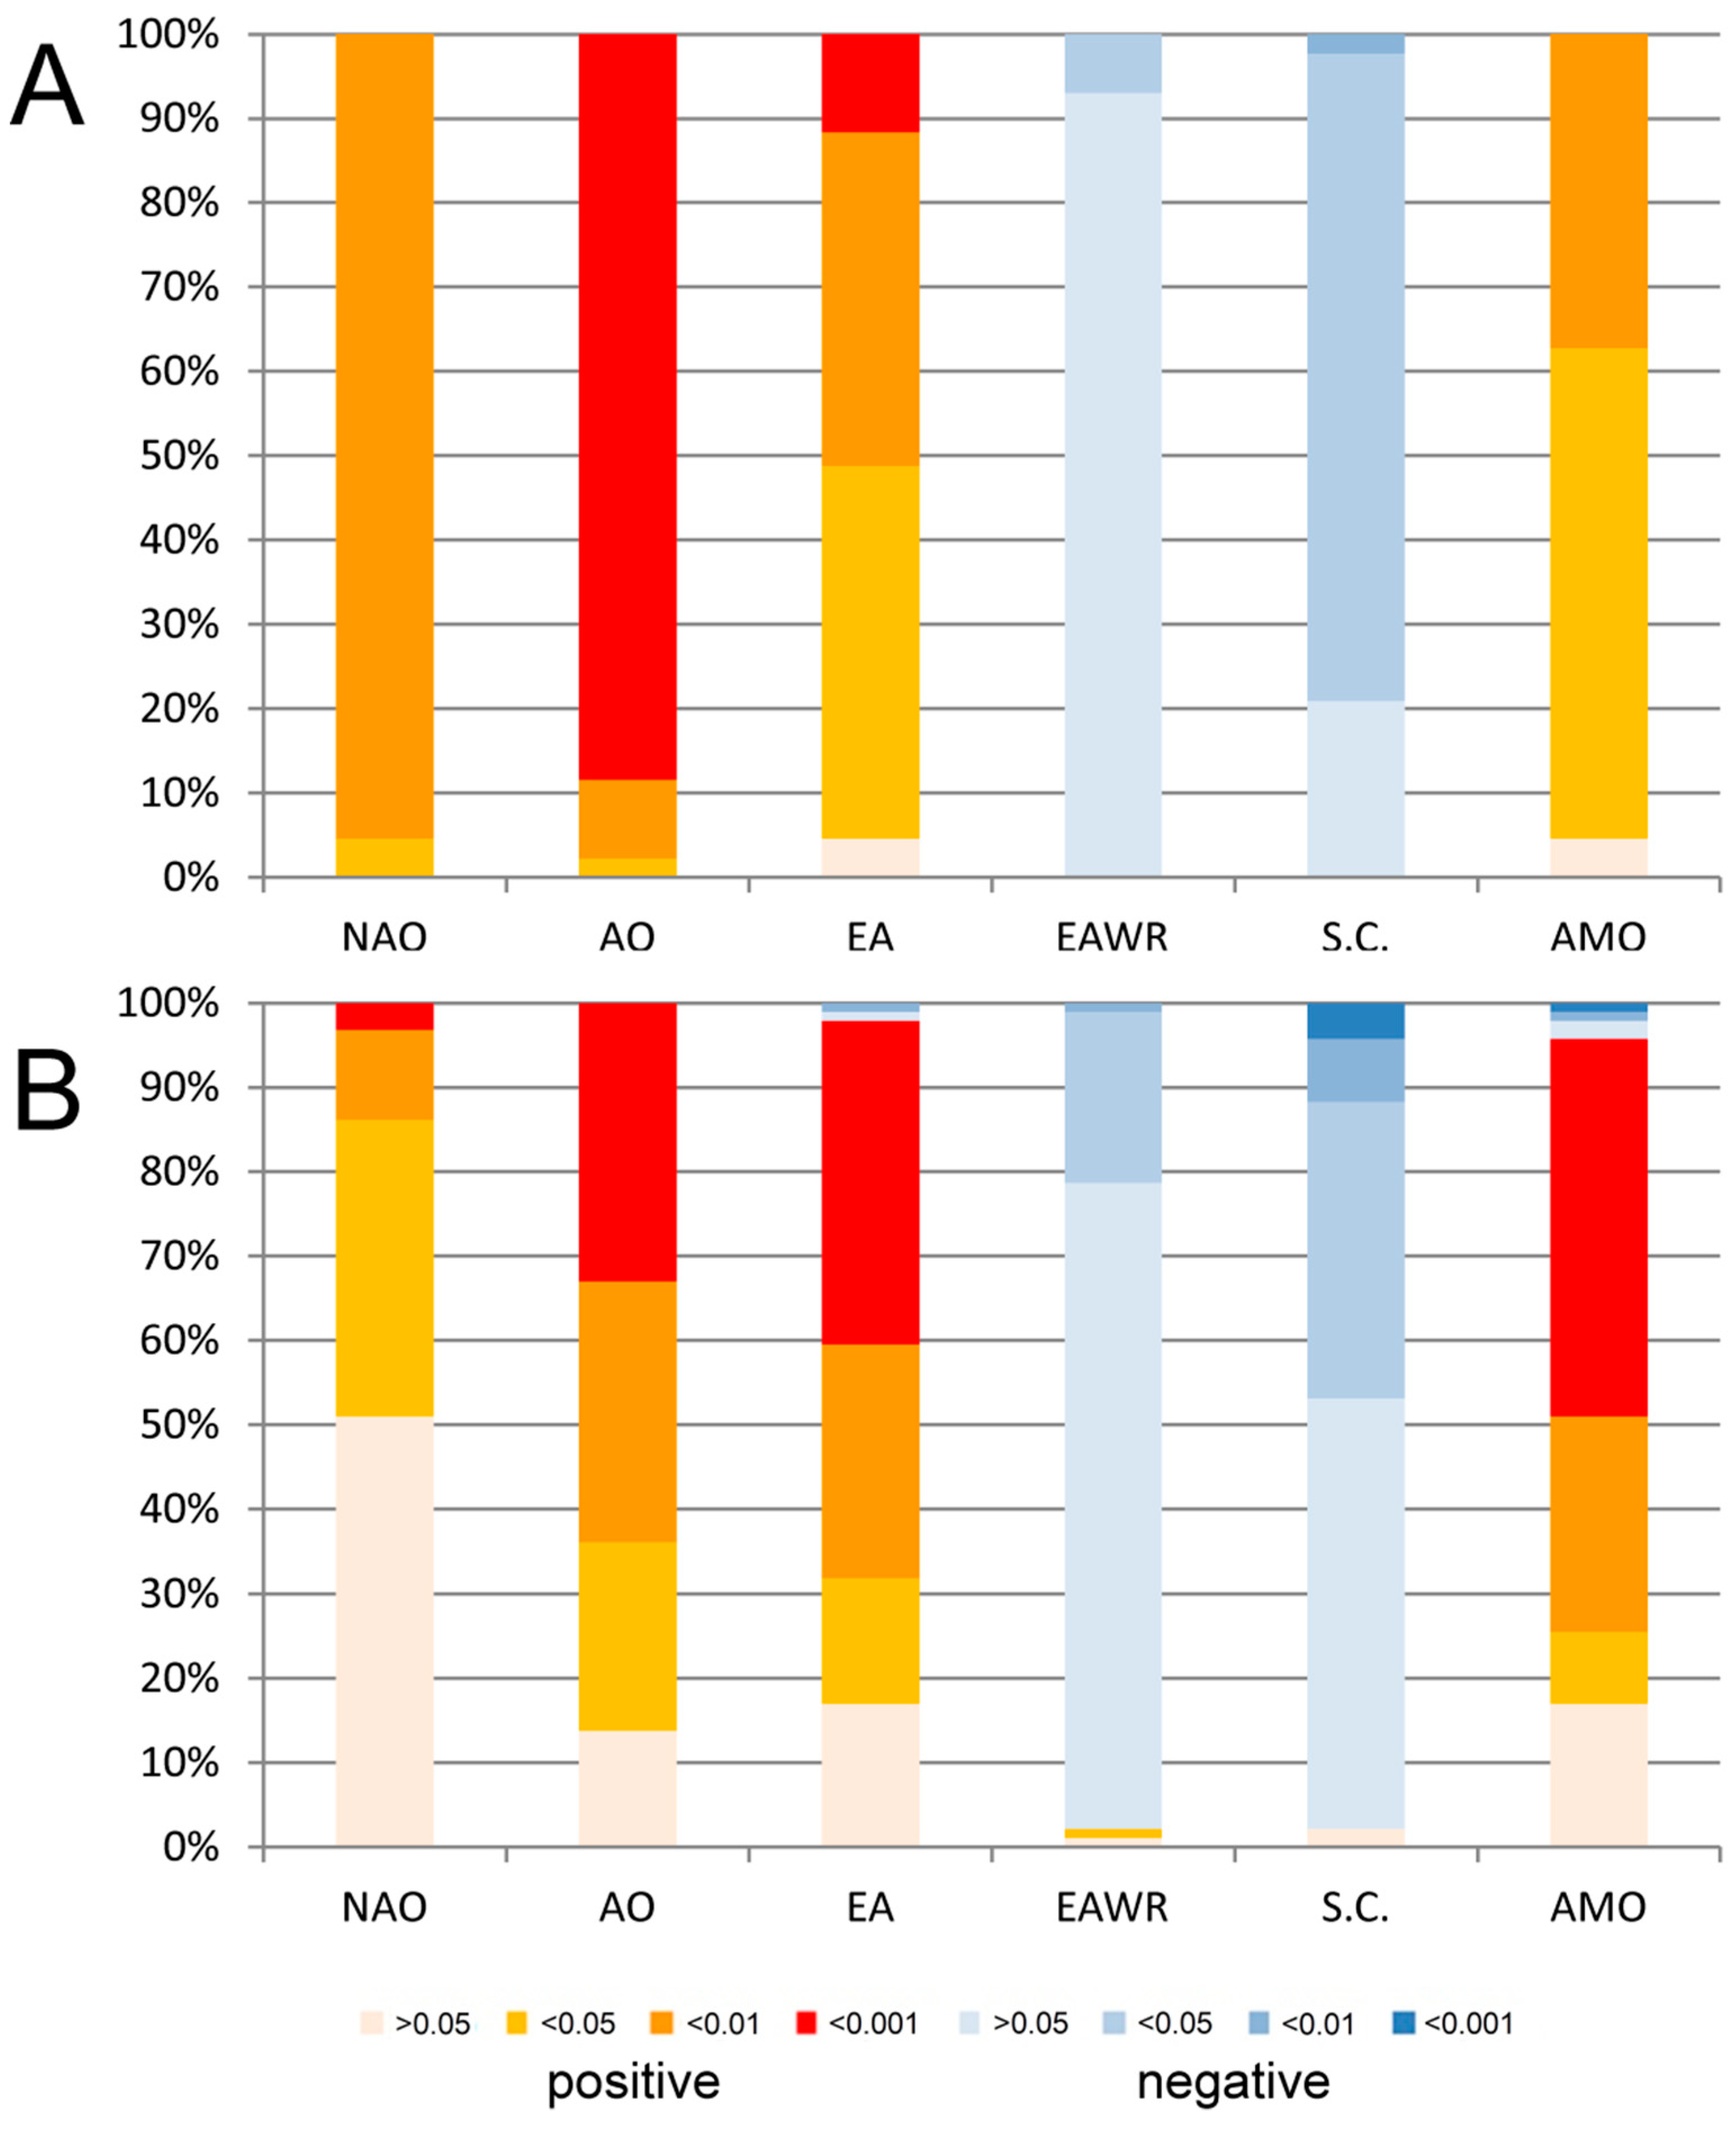
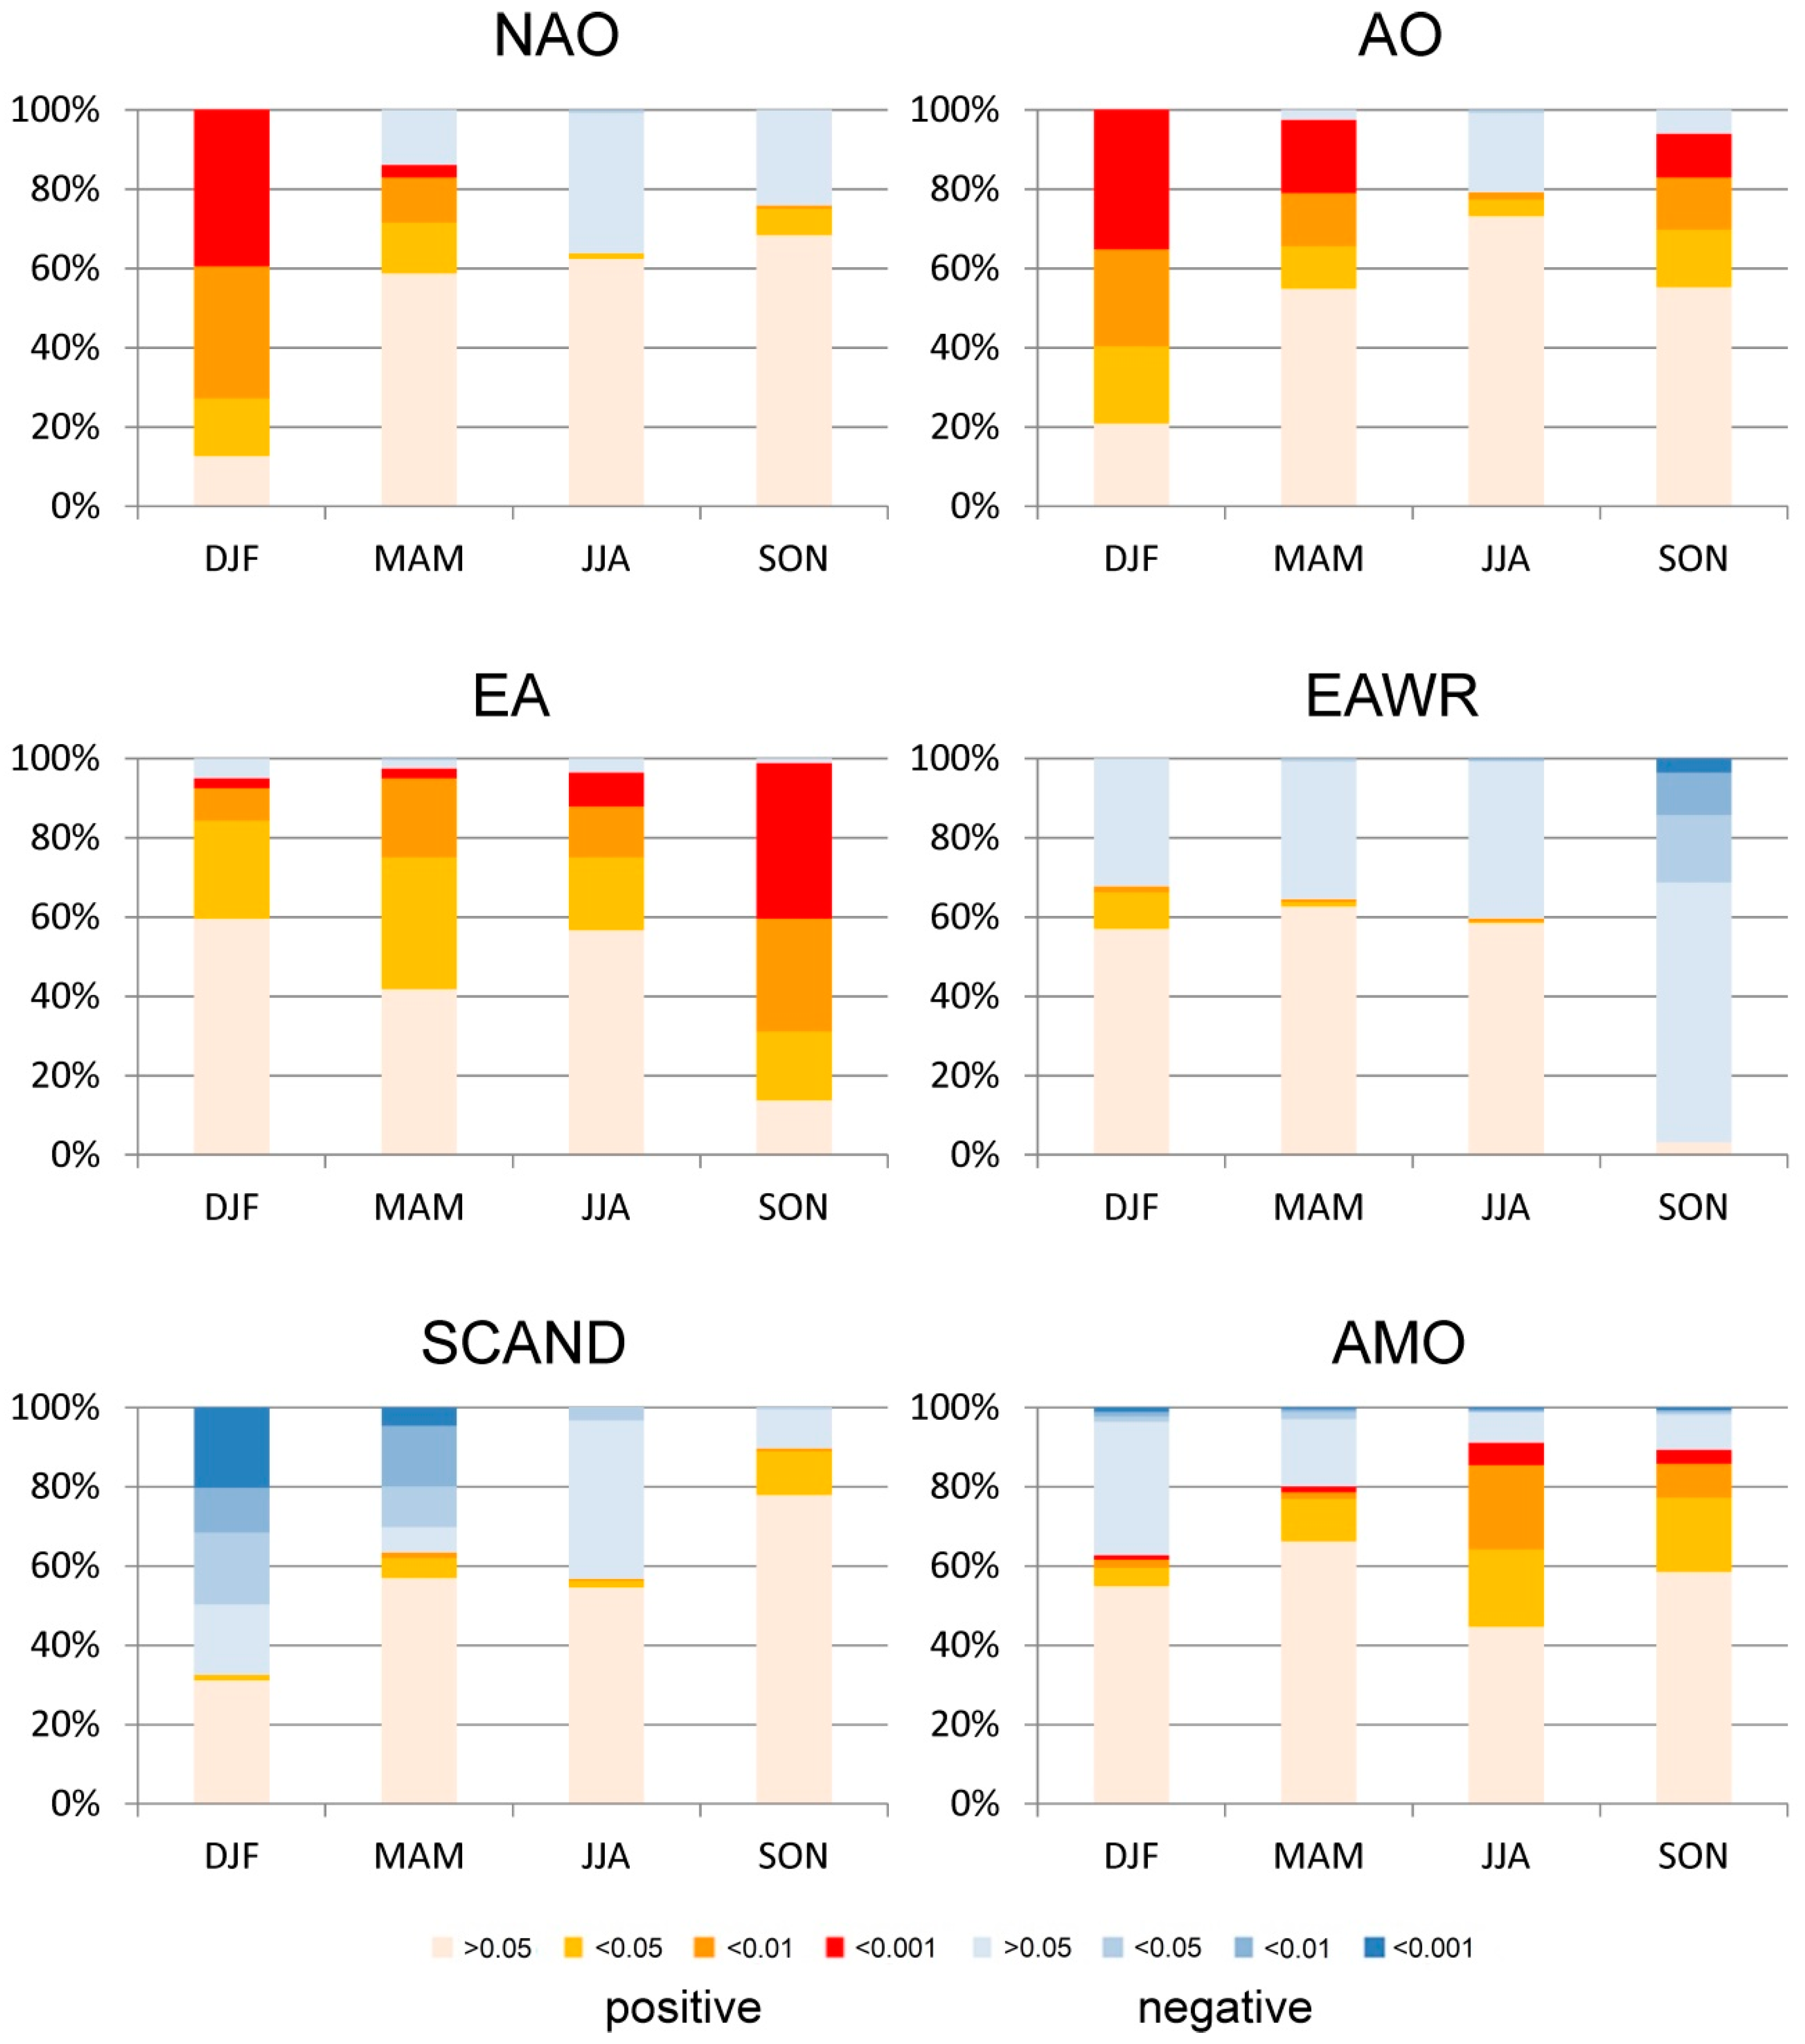
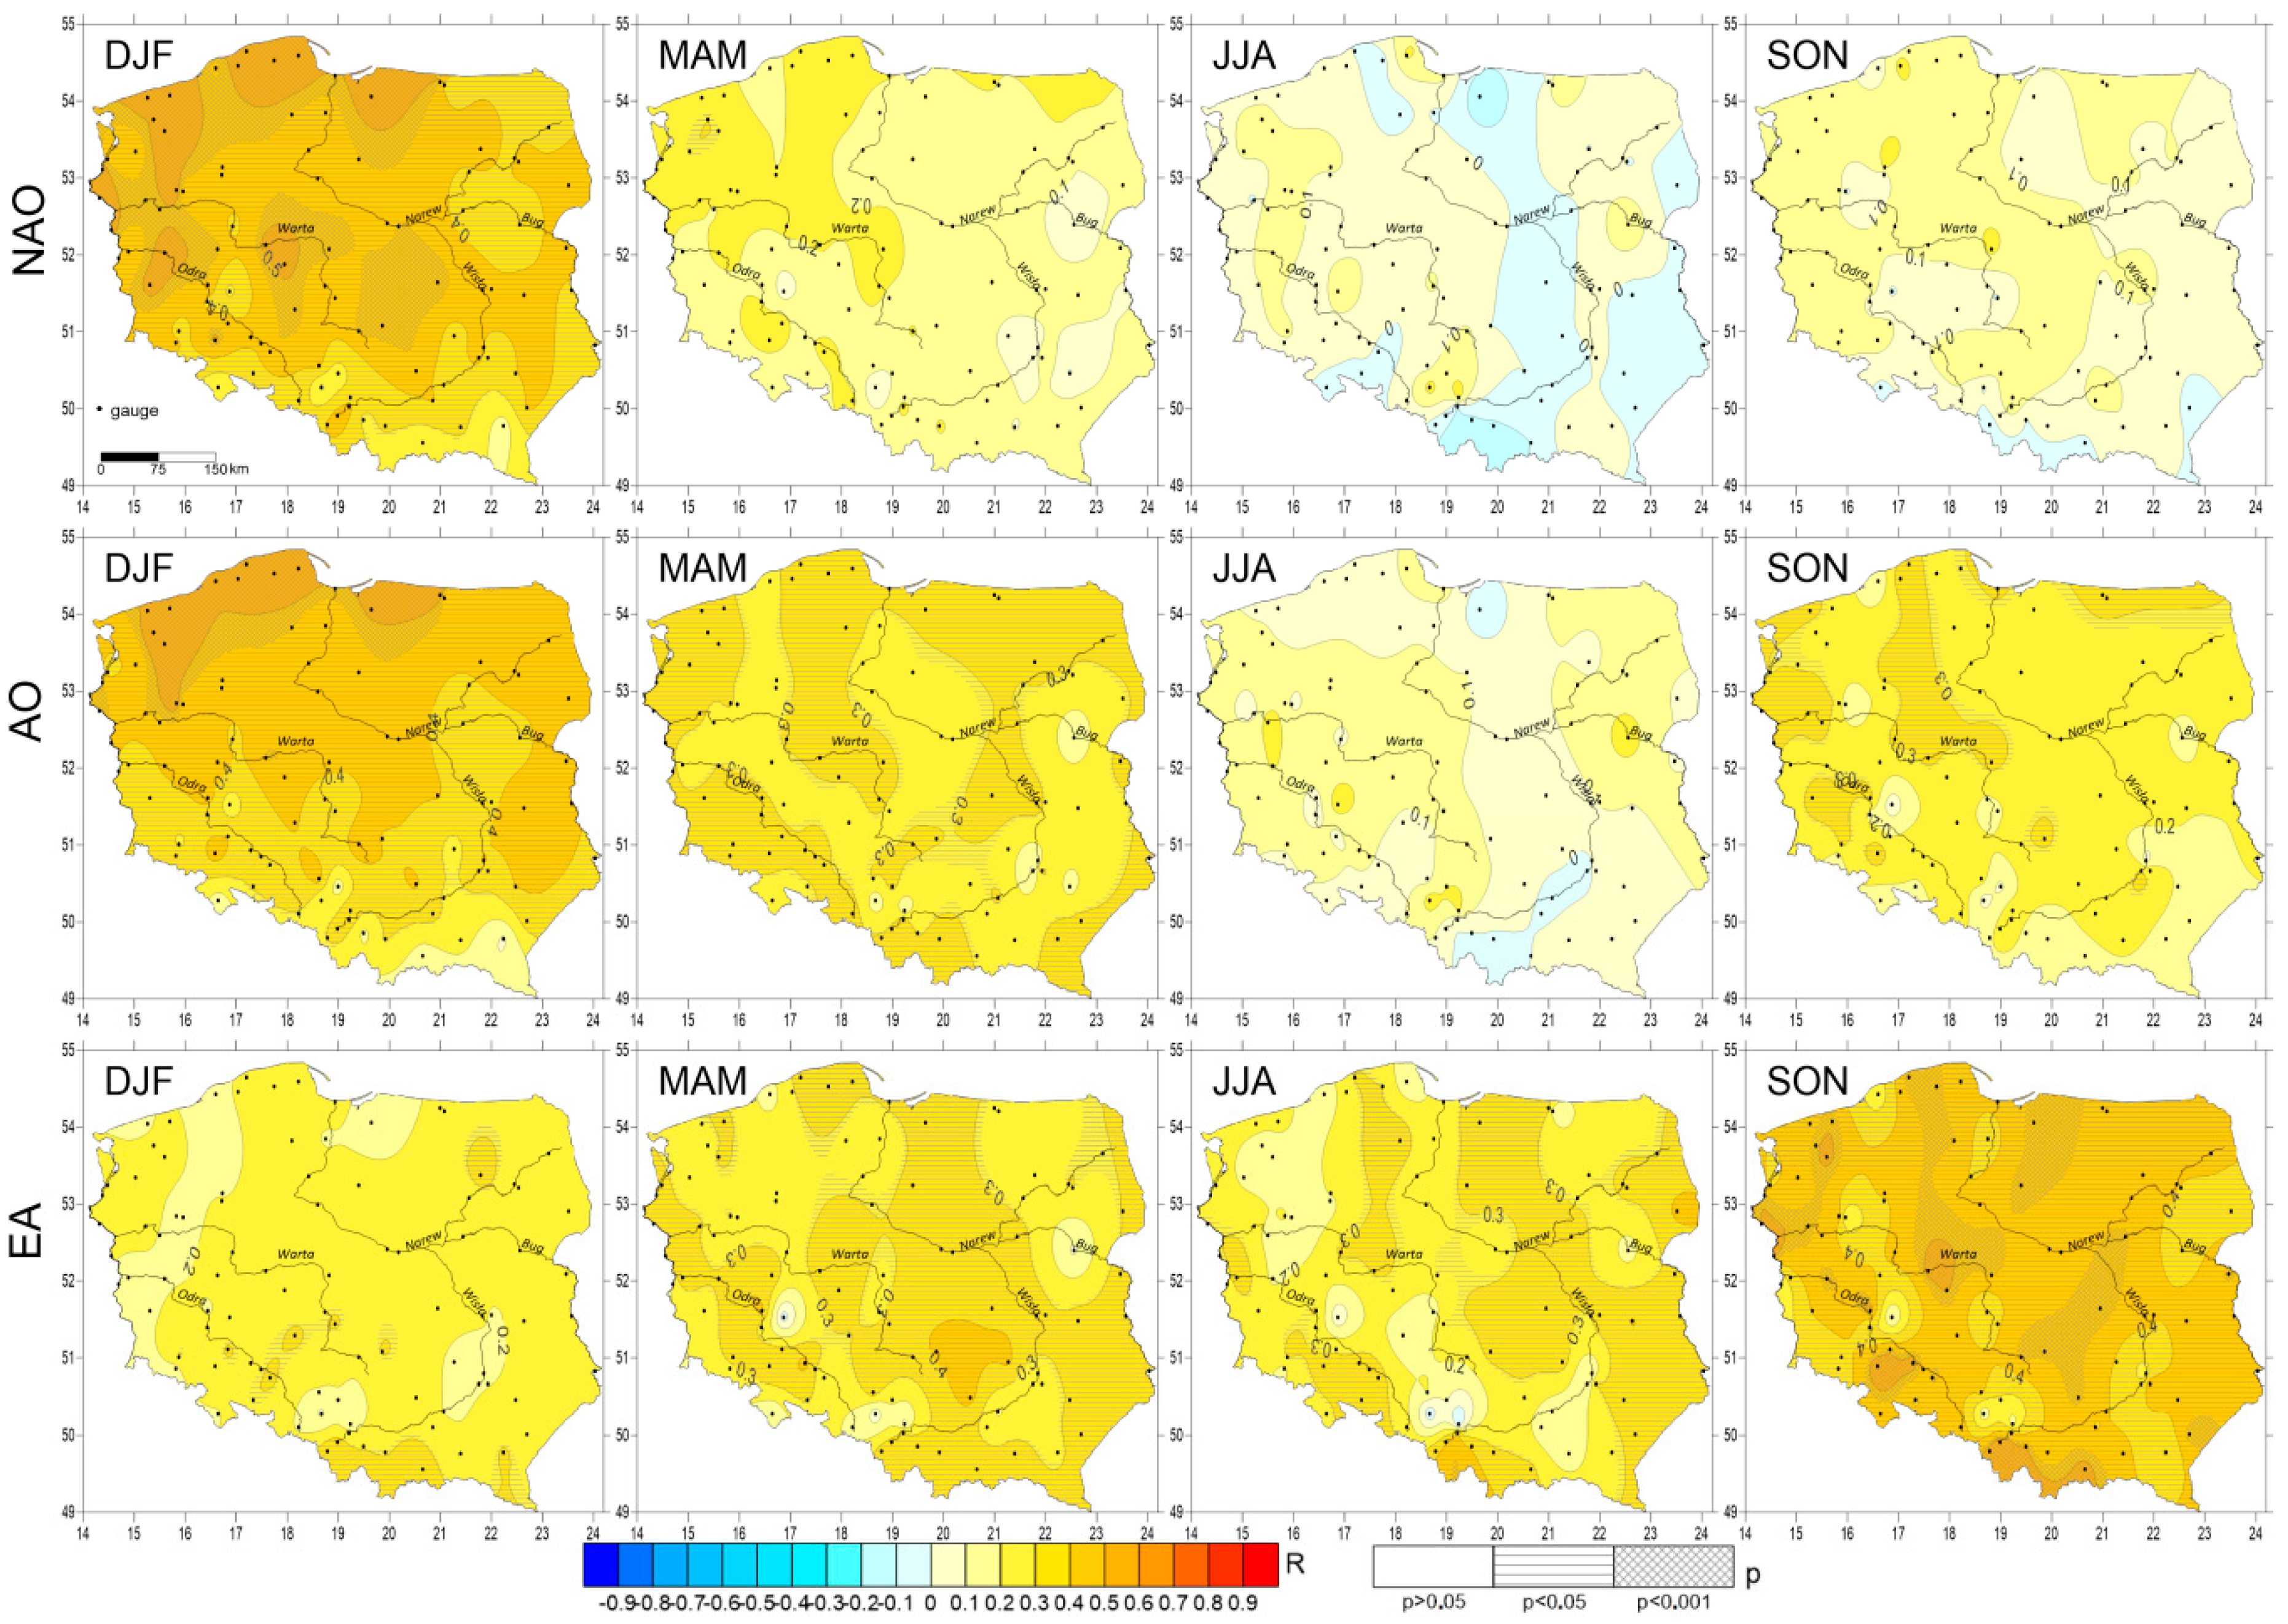
The results of the correlational analysis made it possible to determine the percentage shares of positive and negative coefficients of correlation, at various levels of statistical significance, between annual seasonal and monthly indices of macroscale circulation types and air and river water temperature. For each teleconnection pattern—i.e., NAO, AO, EA, EA/WR, SCAND, and AMO—an analysis was performed of the spatial distribution of coefficients of correlation of annual seasonal (additionally monthly) water temperature values with circulation type indices.
During the next stage determinations were made of deviations of water temperature in various phases of the studied macroscale circulation types from average values for the years 1971–2015, and the statistical significance thereof established. Average annual, seasonal, and monthly temperatures were calculated for the entire research period (1971–2015), and thereafter for 11 years with low and 11 years with high analyzed circulation indices. Index threshold values correspond to the first- and third-quartile from the whole set of indices for the period 1971–2015. Statistical significance was determined using the
t test for dependent samples. In each and every instance, the hypothesis H
0:
μ =
μ0 as to the equality of expected values was against H
1:
μ ≠
μ0. The rejection of the hypothesis makes it possible to draw conclusions as to significant differences between average temperatures observed in various phases and their average values from the period 1971–2015. In order to verify the hypothesis, use was made of the small sample test based on the
t-Student distribution at
n − 1 degrees of freedom
where:
n—sample size,
s—standard deviation,
—sample average,
μ0—population average.
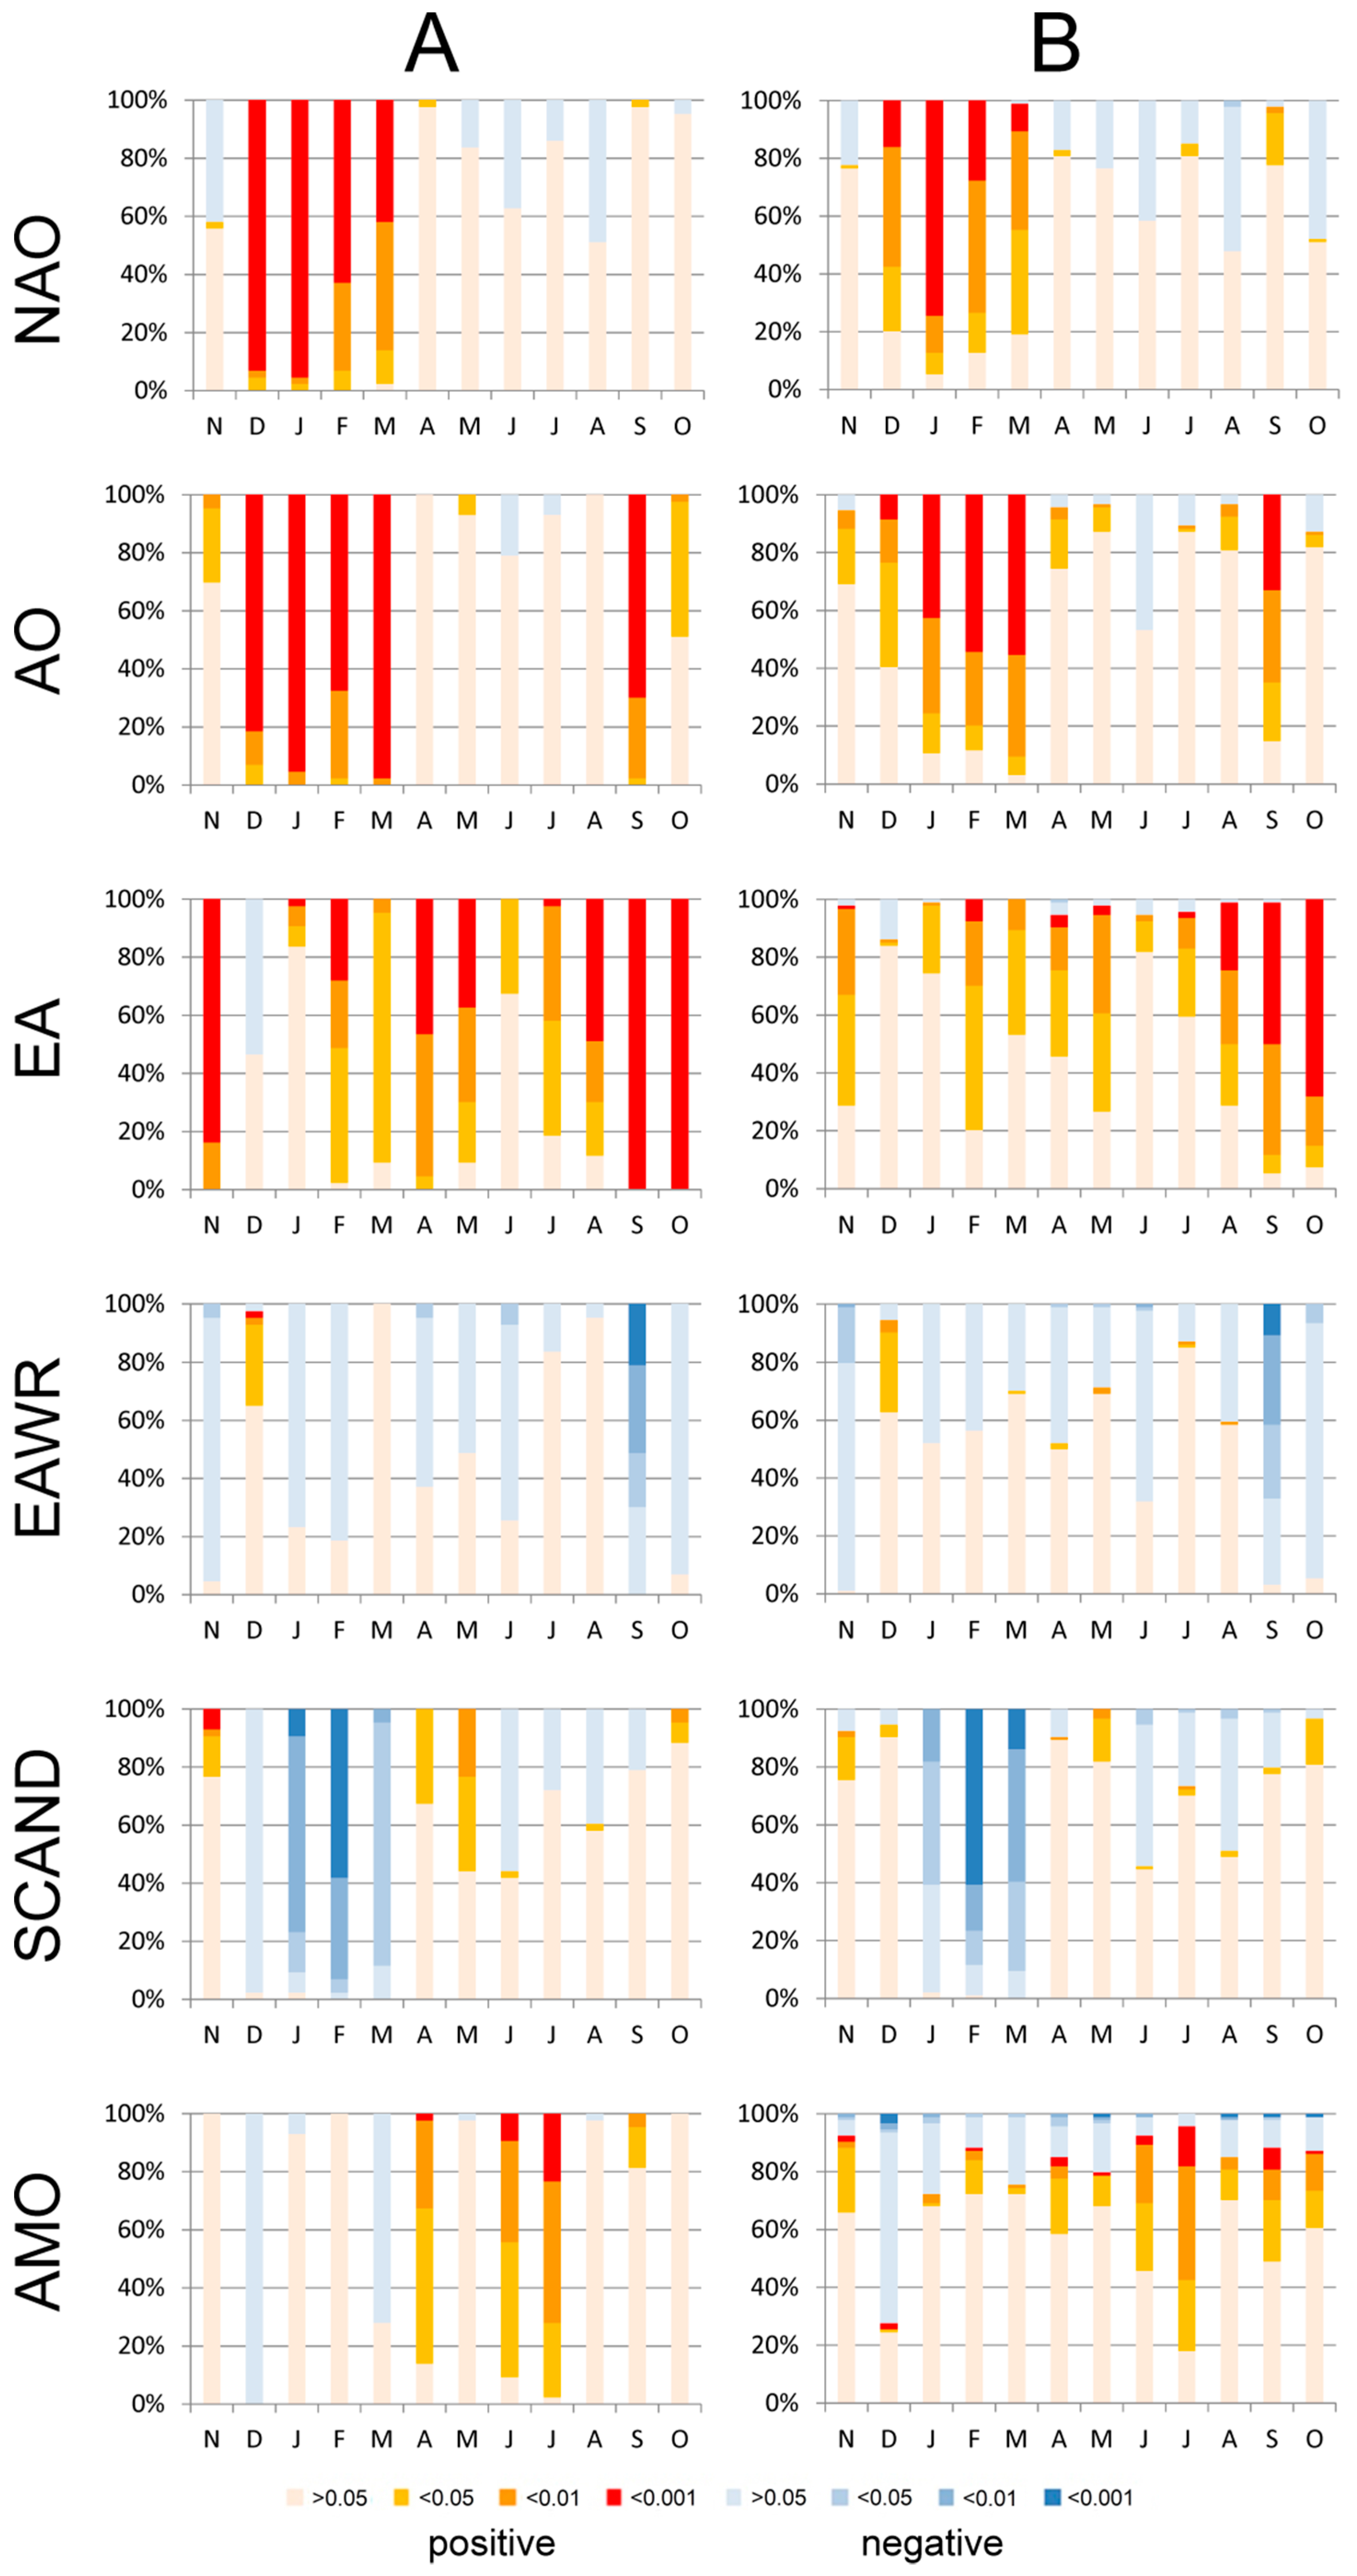
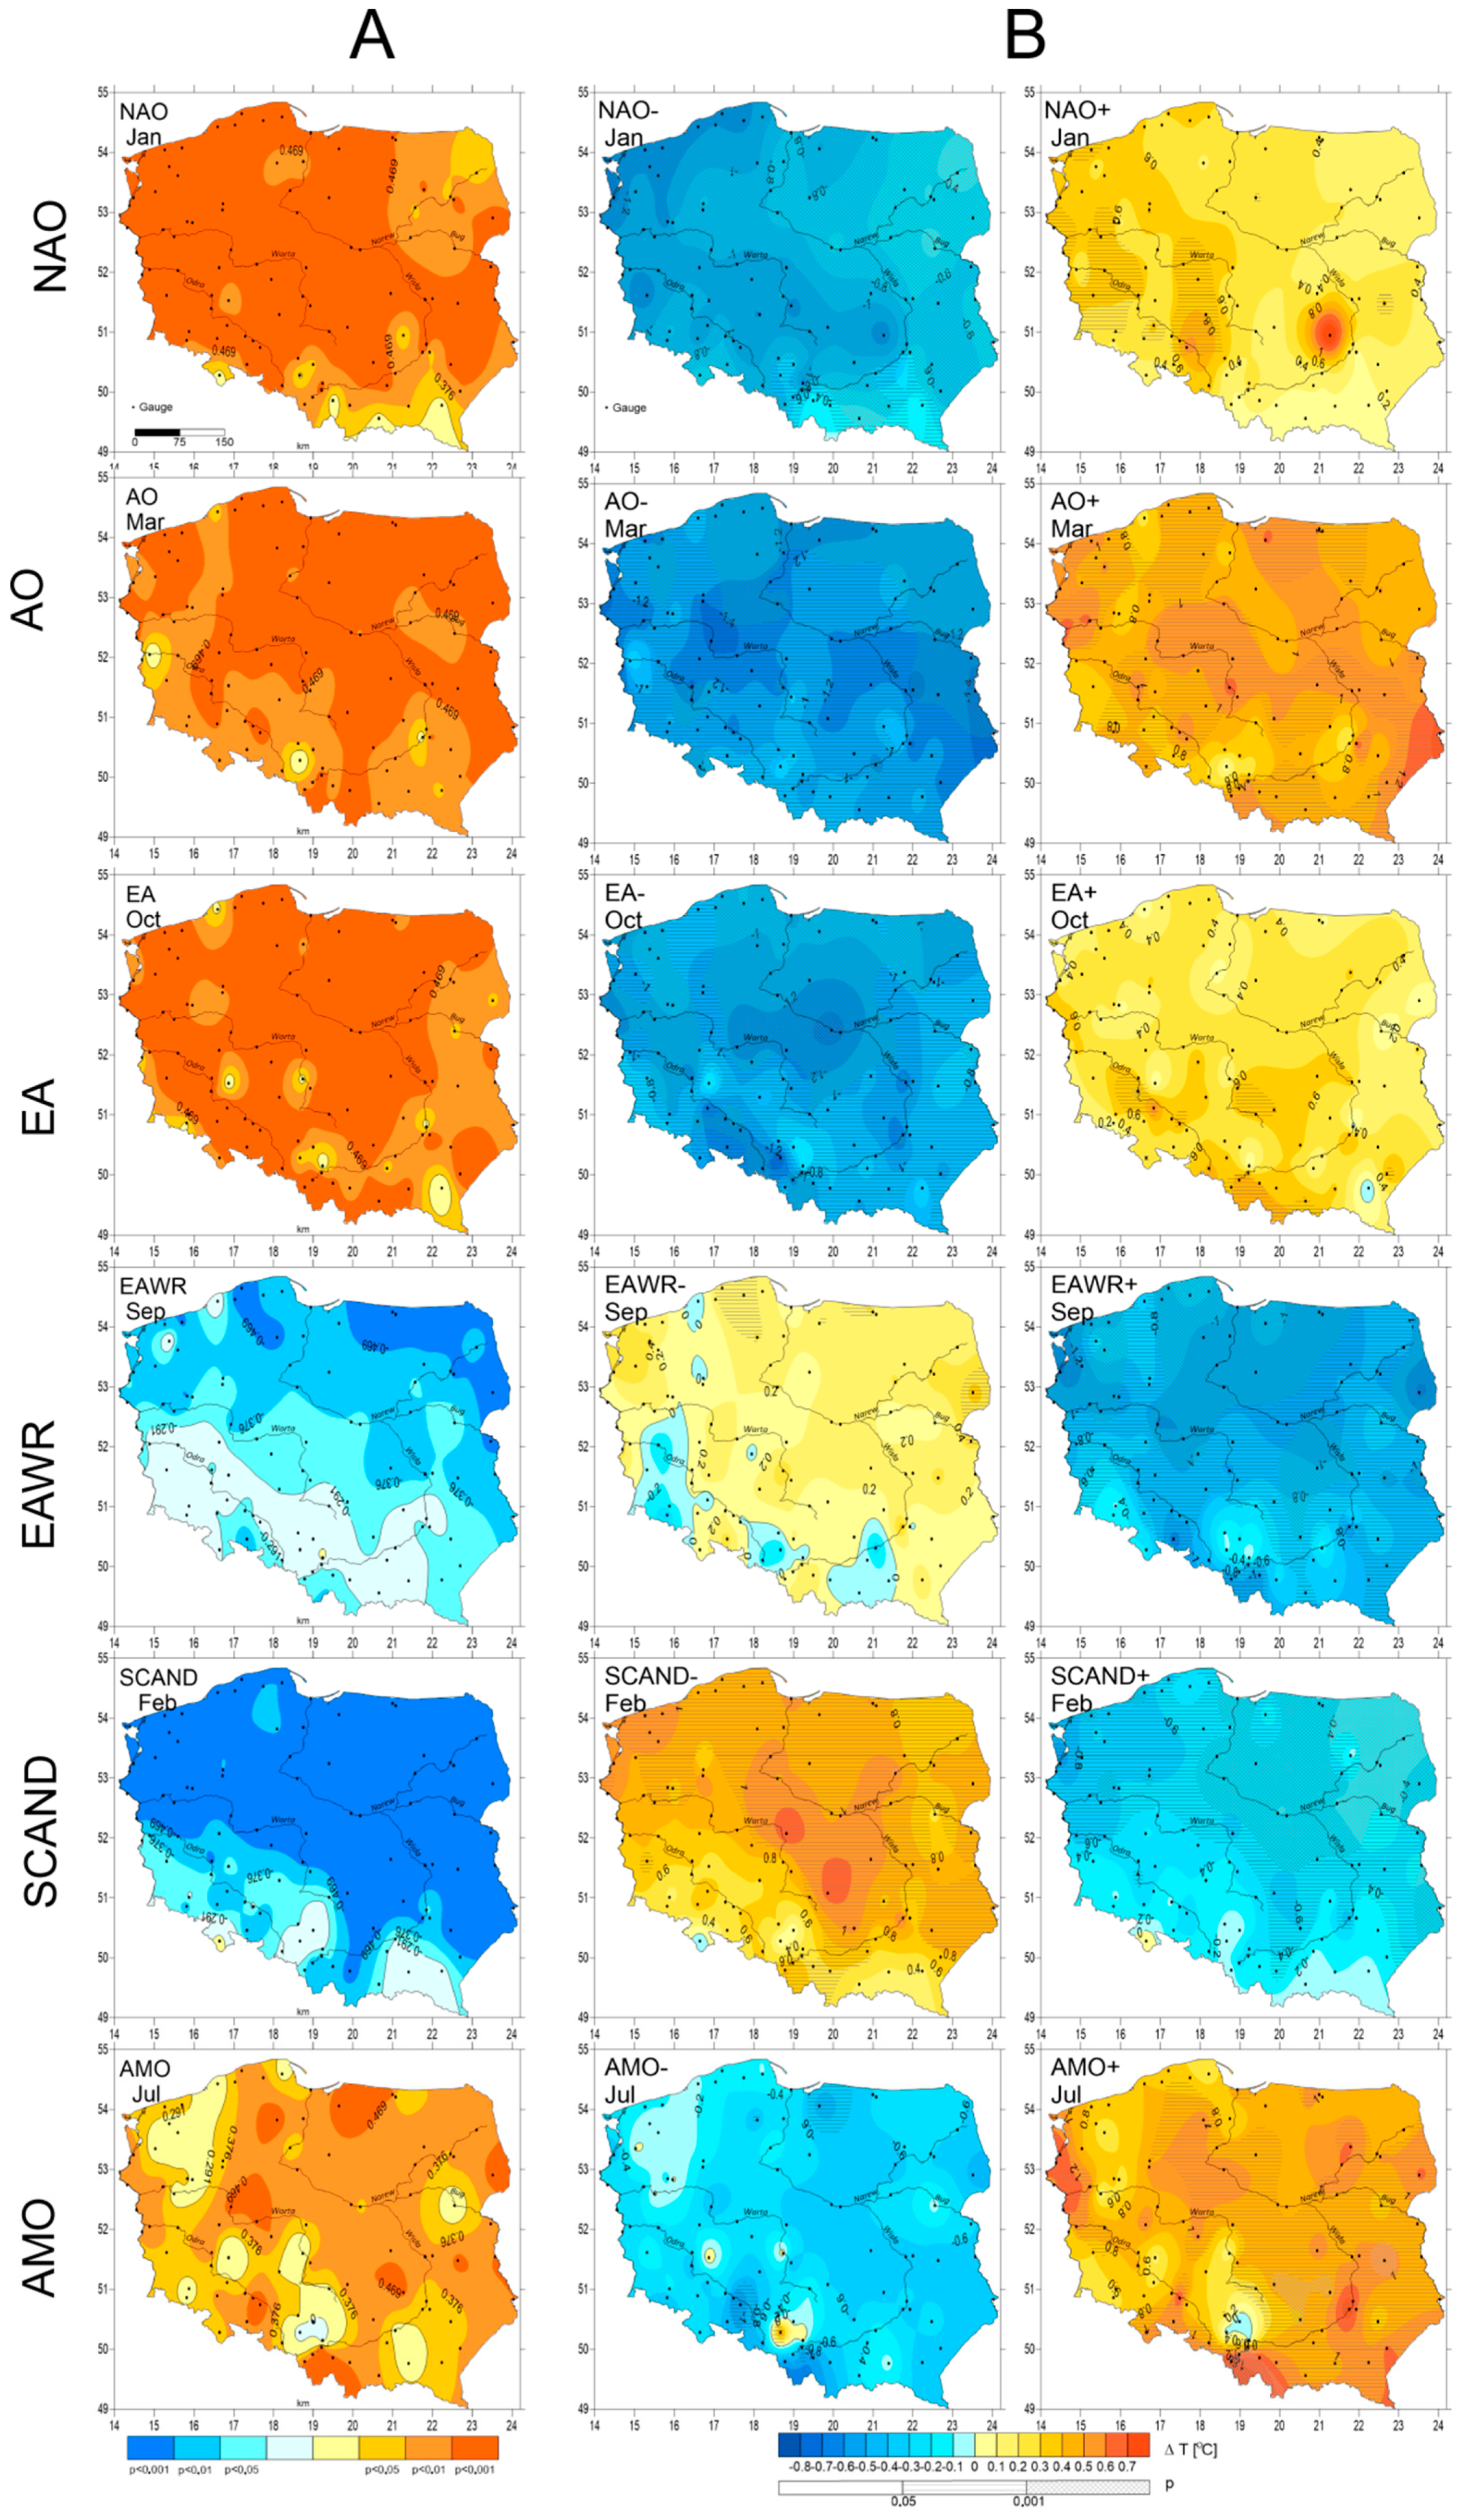
Detailed analyses of seasonal deviations of water temperature values from average values for the years 1971–2015 were conducted for various phases of circulation types for two selected indices with the highest teleconnection activity. The spatial distribution of coefficients of correlation of monthly water temperature values with circulation type indices and of deviations of monthly temperature values in various phases thereof from average values for the years 1971–2015 was interpreted for selected months. For each teleconnection pattern, a month was selected with the highest percentage share of positive or negative coefficients of correlation of monthly circulation type indices with water temperature. The graphical part, which concerns the results of analyses of relations between indices and water temperature values of Polish rivers, performed utilizing monthly data, has been included in the manuscript as
Appendix A.
Calculations were performed by means of the Statistica 12 software suite (Statistica, Tulsa, OK, USA). Graphic elements were executed using the Surfer 10 [GoldenSoftware] program, while the kriging procedure was applied for the construction of isolinear maps.
Study Area
Poland is situated in Central Europe within the moderate transient climate zone, which has properties intermediate between the maritime climate and the continental climate. An increase in continentalism is observed in the easterly direction. Due to the country’s physico-geographical location, various masses of air clash above its territory and impact the development of weather states, and therefore the climate, which is characterized by considerable weather variability and high fluctuations in the course of seasons in successive years. The following masses of air are most frequently encountered over the territory of Poland: polar maritime air from the northern part of the Atlantic Ocean, polar continental air from over Eastern Europe and Asia, Arctic air from over the Arctic Sea, subtropical maritime air from around the Azores, and subtropical continental air from over Africa [
40,
56,
70,
71]. The country’s climate is most greatly impacted by masses of polar maritime air and polar continental air, which appear over the territory of Poland practically throughout the year.
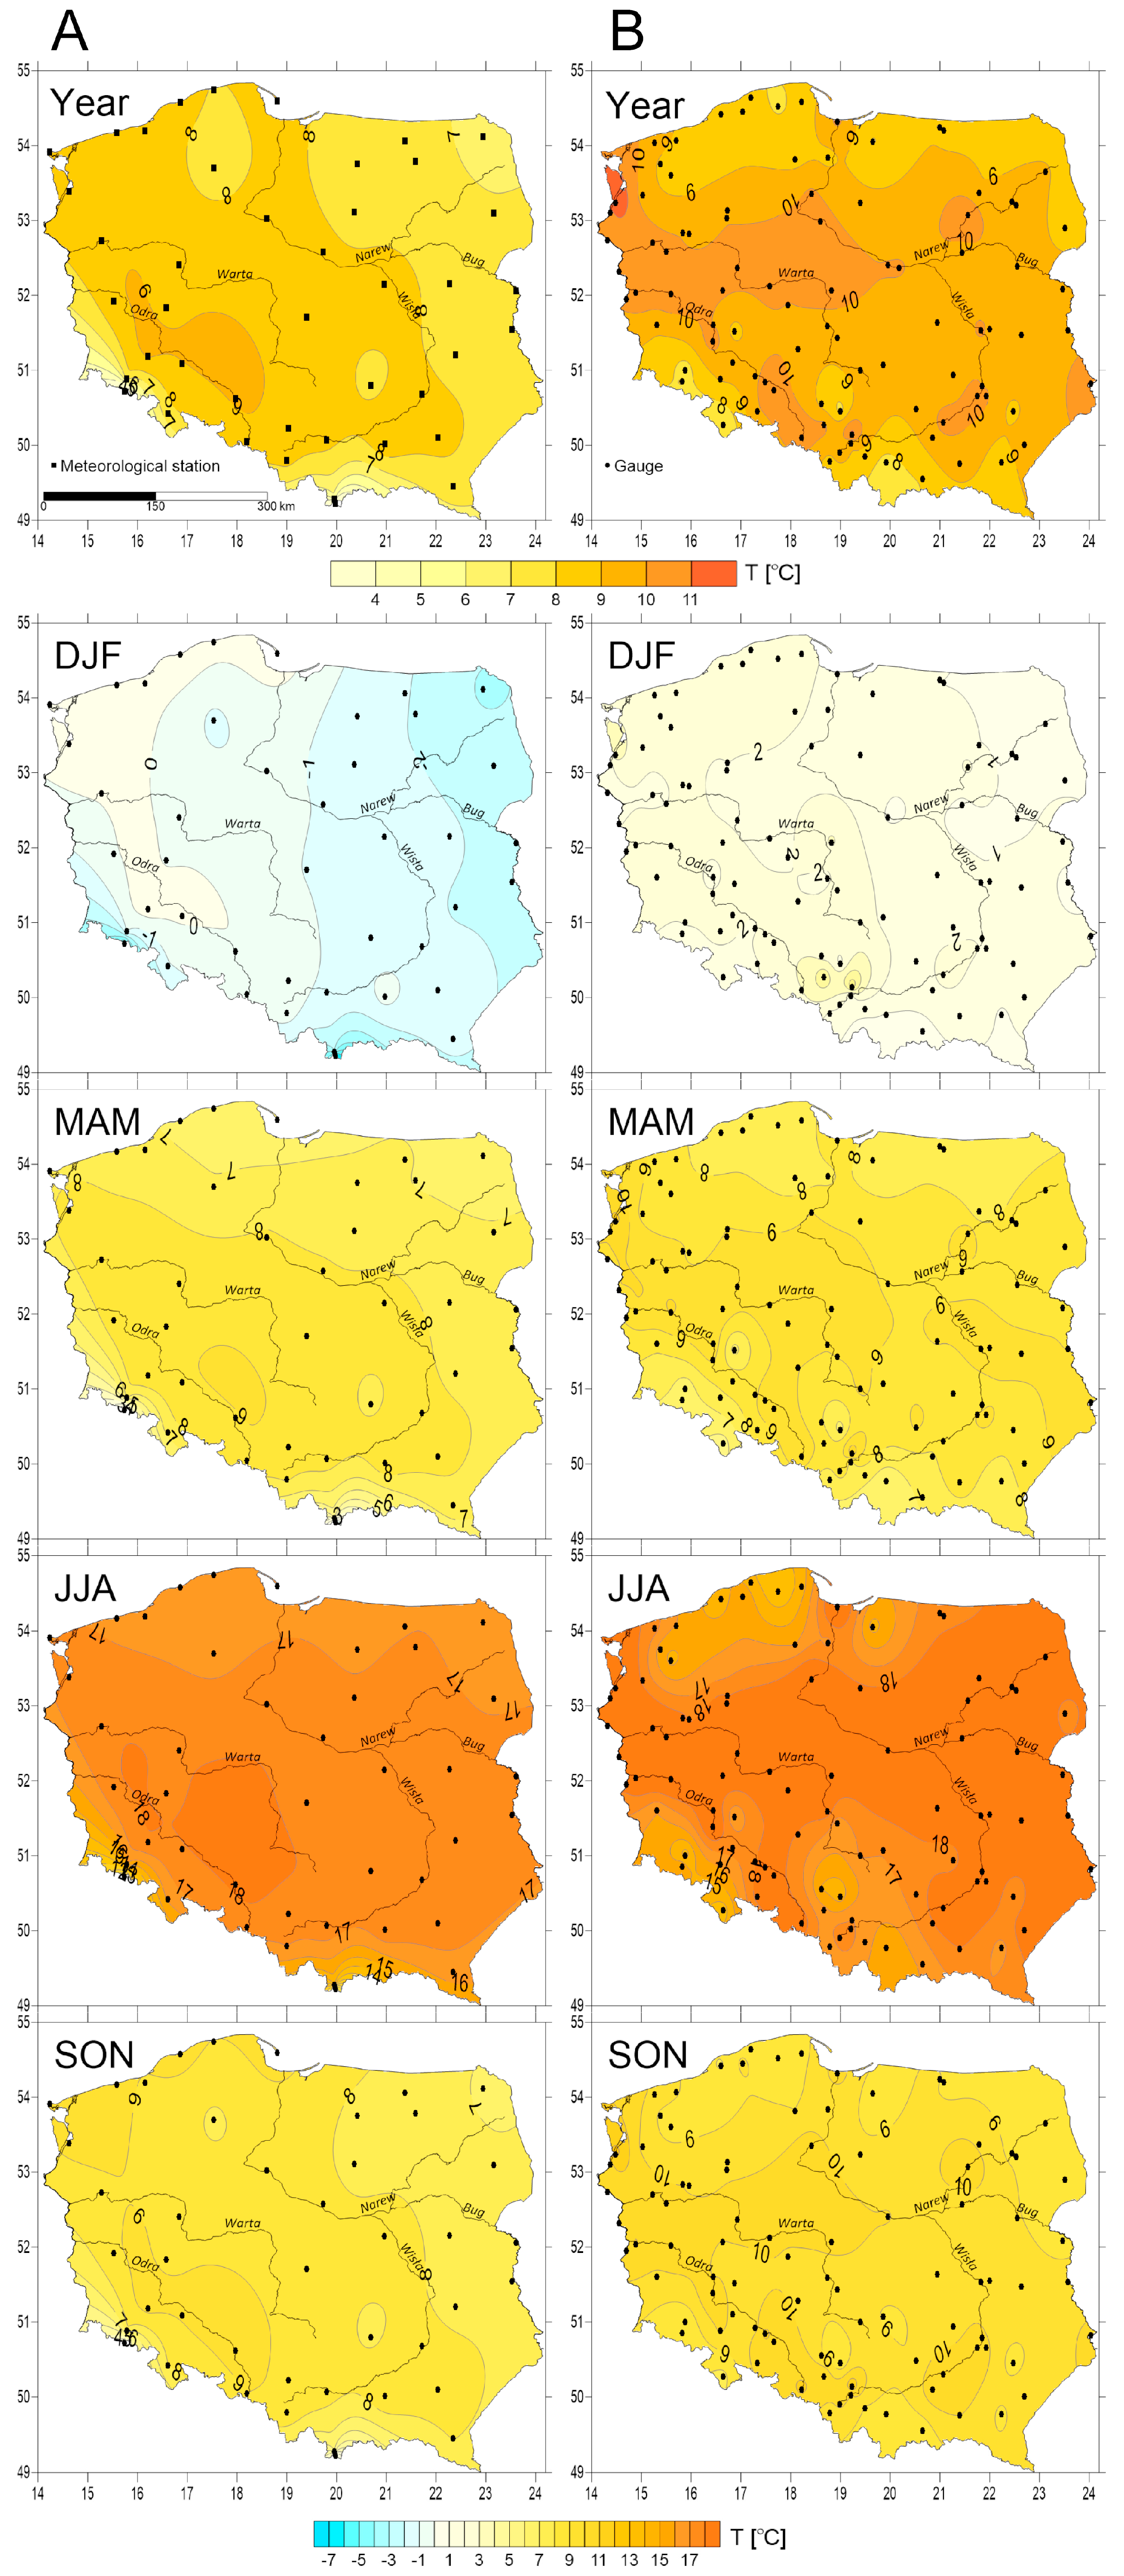
In the case of Poland, the average annual air temperature indicative of the area’s macroclimatic and mesoclimatic differentiation is 6–8.5 °C (
Figure 2A). The course of annual isotherms is close to the meridional, while the temperature decreases from the south-west to the north-east. Average annual temperatures are also lower in the south, in the mountains, totaling less than 4 °C. In contrast to air temperature, the distribution of average annual river water temperatures of river water is close to the latitudinal (
Figure 2B). The highest average annual water temperatures occur in rivers of central and Northwestern Poland (>10 °C), while the lowest, below 8.0 °C, in Southern Poland, in the mountain tributaries of the Wisła and Odra rivers.
Characteristic features of the Polish thermal system include season-dependent changes in the courses of isotherms from latitudinal to longitudinal. During the winter season (DJF), the decrease in air temperature from west to east (to below −2 °C) is conditioned by atmospheric circulation. The arrangement of isotherms in winter is similar to the longitudinal, with the exception of mountainous areas (in the south of the country) and the Baltic coast (in the north); this is the result of the influence of masses of continental air, which declines in a westward direction. In winter, the distribution of air temperature is to some extent copied by the temperature of river waters, which falls from the west (approximately 2 °C) to the east (below 1 °C)—
Figure 2B. Rivers in the southern mountainous region also attain low temperatures. The coldest month in Poland is January.
In the spring season (MAM), the distribution of air temperature values is similar to the latitudinal, with the highest temperatures being observed in central Poland (in excess of 8 °C, and locally 9 °C). Whereas in individual regions of the country the temperature of water usually exceeds air temperature by some 1–2 °C, and attains the highest values in central Poland (over 9 °C).
In the summer season (JJA), with considerably higher air temperatures, isotherms are arranged latitudinally or closely resemble this arrangement. The summer drop in temperature from central Poland (in excess of 18 °C) in a southward (under 14 °C in mountainous regions) and northward direction (under 17 °C, Pomerania) is associated with hypsometric conditions. For the researched period, the spatial distribution of water temperature values references the distribution of air temperature values (
Figure 2), whereas it attains the highest values (in excess of 18 °C) in the central part of the area, and the lowest in the mountains (the tributaries of the Wisła and Odra rivers) and in Pomerania (below 15 °C).
In the autumn season (SON), air temperature changes from approximately 8 °C in Western Poland to below 7 °C in the eastern part of the country. Lower temperatures occur in the coastal region (in the north) and in the south of the country, in the mountains (below 5 °C). Whereas water temperature displays greater spatial diversity and a greater scope of variability. The arrangement of isotherms is similar to the latitudinal; the highest temperatures exceed 8 °C, while mountain rivers (the southern part of the area) and the rivers of the northern coastal strip are cooler (under 9 °C).
4. Discussion
The NAO and AO indices are of particular importance for determining weather patterns in central Europe (Poland), and this has been confirmed by the present study, with a high statistical significance of correlation being ascertained for the majority of air temperature measurement stations in relation to annual and monthly indices. The activity of both circulations becomes particularly marked in the winter season.
Positive NAO and AO indices are usually indicative of thaws and an increase in air temperature, which result in a rise in river water temperature, particularly in the western part of the country, whereas in the east air temperature values are often maintained at a level of 0 °C. An exception occurs when Poland is under the influence of a deep Russian high-pressure system, which brings about frosty weather. Research conducted by Kenyon and Hegerl [
45] confirmed that during positive NAO phases the seasonal results of the DJFM index (for the 4 winter months) display up to 10% more warm days and up to 10% less cold days in Europe, and also in Siberia, attaining a peak in the vicinity of Scandinavia, which is concordant with the results obtained by Scaife et al. [
58]. Observations of NAO indicate that the index also attains positive correlation with average temperature in winter in other regions of the Northern Hemisphere, for example in the eastern part of the United States [
89,
90]. In the negative NAO phase, lower temperatures are observed in northern Europe and Asia, whereas the Mediterranean region is warmer. During the period of activity of oscillation in the positive phase, extremely cold days are on average 4 °C warmer, while exceptionally warm days are on average 2 °C warmer. Negative NAO and AO indices lead to a reduction in air temperature (particularly in the north of the country) and long-term snowfalls, which may also cause a reduction of river water temperature values.
The following are the main factors impacting the relation between NAO and temperature in the winter season: total NAO magnitudes, and the magnitude and longitude of the NAO center over the Azores Islands. At the time, the probable mechanism of activity of NAO are positive pressure anomalies, which block the inflow of polar air over specific regions during the positive NAO phase [
91]. Of special importance for research into the impact of future changes in NAO on regional temperature in the winter season is the location and changes in values of individual NAO centers.
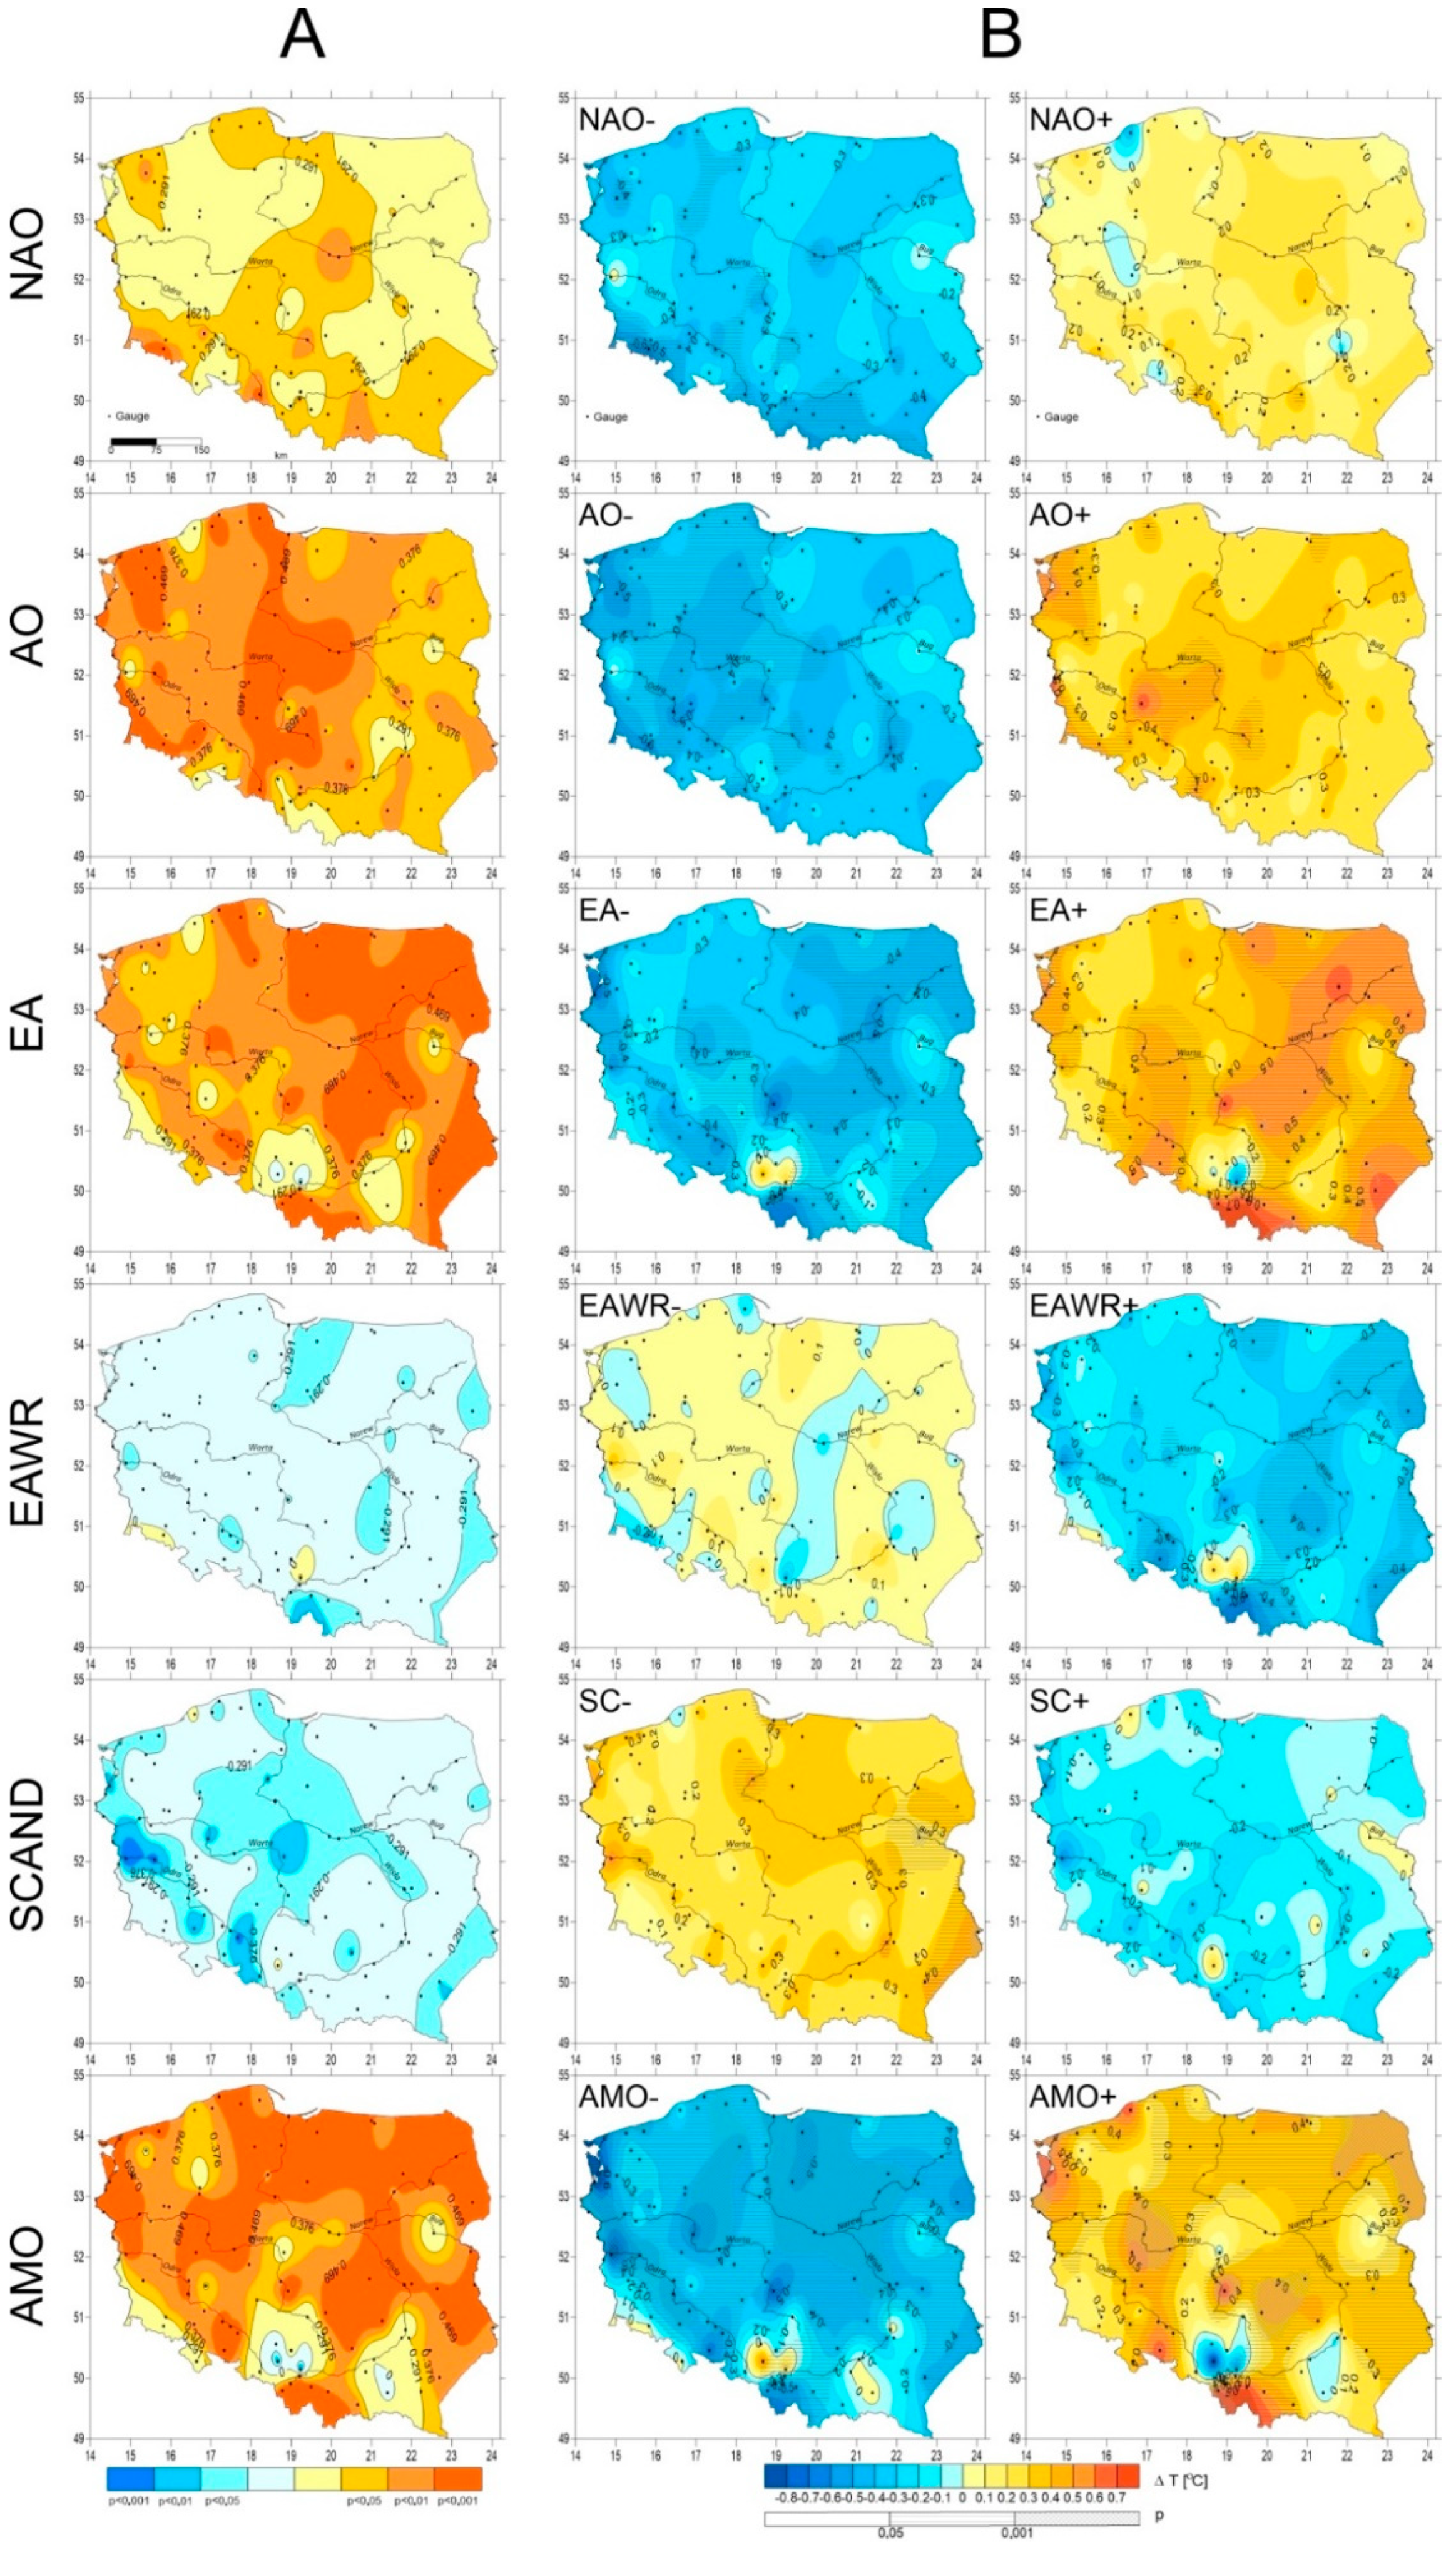
For Polish rivers, the correlational relations of macroscale circulation types with average annual river water temperature values are similar to those of air temperature, with the difference being that the strength of the former is weaker. The impact of specific teleconnection patterns on changes in river water temperature may be observed with greater clarity when we apply the seasonal approach.
The relations existing between indices of atmospheric circulation and water temperature values in Poland were confirmed by earlier research into selected groups of lakes on the territory of Poland [
64,
65]. Using the results of studies conducted on the Iberian Peninsula as their basis, Frais et al. [
92] have suggested that the NAO and AO indices may differently impact the hydrological regime, and thus the thermal characteristics of waters. The effect of such change, which frequently leads to changes of the run-off regime and the thermal characteristics of waters, depends on the susceptibility of the river system to the changing climate. As regards other teleconnection patterns, the body of data gathered for the territory of Poland is insufficient to draw valid conclusions.
On the territory of Poland, the impact of individual circulation types in the studied period is more clearly visible in the spatial distribution of the annual average of air temperature values, and this is further confirmed by the results of research previously conducted by Ptak et al. [
65]. The distribution of air temperature values discloses typical patterns documenting features of the temporariness of the Polish climate, with the distinguishment of features of continentalism in the east and features of the oceanic climate in the west. As regards average annual river water temperature values, relations with macroscale types of atmospheric circulation are less clear, this due to the fact that their intensity changes seasonally.
The strongest dependences between circulation indices and water temperature occur in winter, mainly due to the intense activity of atmospheric circulation and the weaker effects of solar radiation [
93,
94]. The activity of atmospheric circulation follows from the stronger baric gradients over Europe in the cool season of the year. At this time of the year, the frequency of occurrence of deep low-pressure systems over the Baltic Sea increases, and thus the thermal properties of air masses inflowing over Poland will impact the variability of temperature of river waters. However, the thermal effects of winter circulation coded in the temperature of river waters will recede over time. In successive seasons, these dependences are clearly weaker due to the decreased activity of atmospheric circulation. In the spring and summer season, the impact of the differentiation of solar radiation increases; in summer, it attains its maximum, and has a dominant impact on the thermal conditions of waters [
94]. In the summer season the differences in temperature between inflowing masses of air are relatively slight, and thus there occur only slight fluctuations of water temperature, which may impact its weaker relations with macroscale types of atmospheric circulation.
In Poland, similarly as in other regions of the moderate climate zone, river freezing is a common phenomenon in the winter season, and it tends to intensify in periods that are at least very cool. The formation of ice cover is facilitated in days that are very frosty (
t < −10 °C) or with a strong frost (
t < −20 °C) [
37].
In their study of trends and fluctuations of dates of termination of ice phenomena on the lakes and rivers of Northern Europe with reference to the impact of NAO, Yoo and D’Odorico [
29] have stressed that the North Atlantic Oscillation influences mainly late winter temperature (January–March), which also exerts a significant impact in the mid-spring period (April–May), when air temperature is strongly correlated with river icing dates. In this case, a regional analysis demonstrated the existence in the series of winter temperatures of the same fluctuations as in the winter NAO index; furthermore, the same components were identified in the series of spring temperatures. When studying multi-annual changes in the icing and run-off regime of regions in the Baltic region with reference to climate change, Klavins et al. [
33] determined that these are strongly influenced by processes associated with the macroscale type of atmospheric circulation over the North Atlantic, and this manifests itself in a close correlation with the NAO index. Ćmielewski and Grześ [
95] in their research into the time of formation and disappearance of ice cover on two Polish rivers, the Wisła and the Niemen, have shown that the correlation of air temperature with the dates of formation and disappearance of ice cover explains approximately 35–40% of the variability of these phenomena, whereas the coefficient of correlation of the dates of disappearance of ice cover with the NAO index makes it possible to explain approximately 30% of freezing changes occurring in these rivers. During the past 40 years, the frequency of occurrence and duration of ice phenomena on European rivers has diminished as the result of climate change [
96]. We are observing the increasingly later appearance of ice cover and its steadily earlier disappearance, while on some rivers no ice cover has been observed since the second half of the 20th century. Statistically significant trends consisting in the shortening of the duration of ice cover on rivers are typical of the majority of rivers in the Northern Hemisphere [
97].
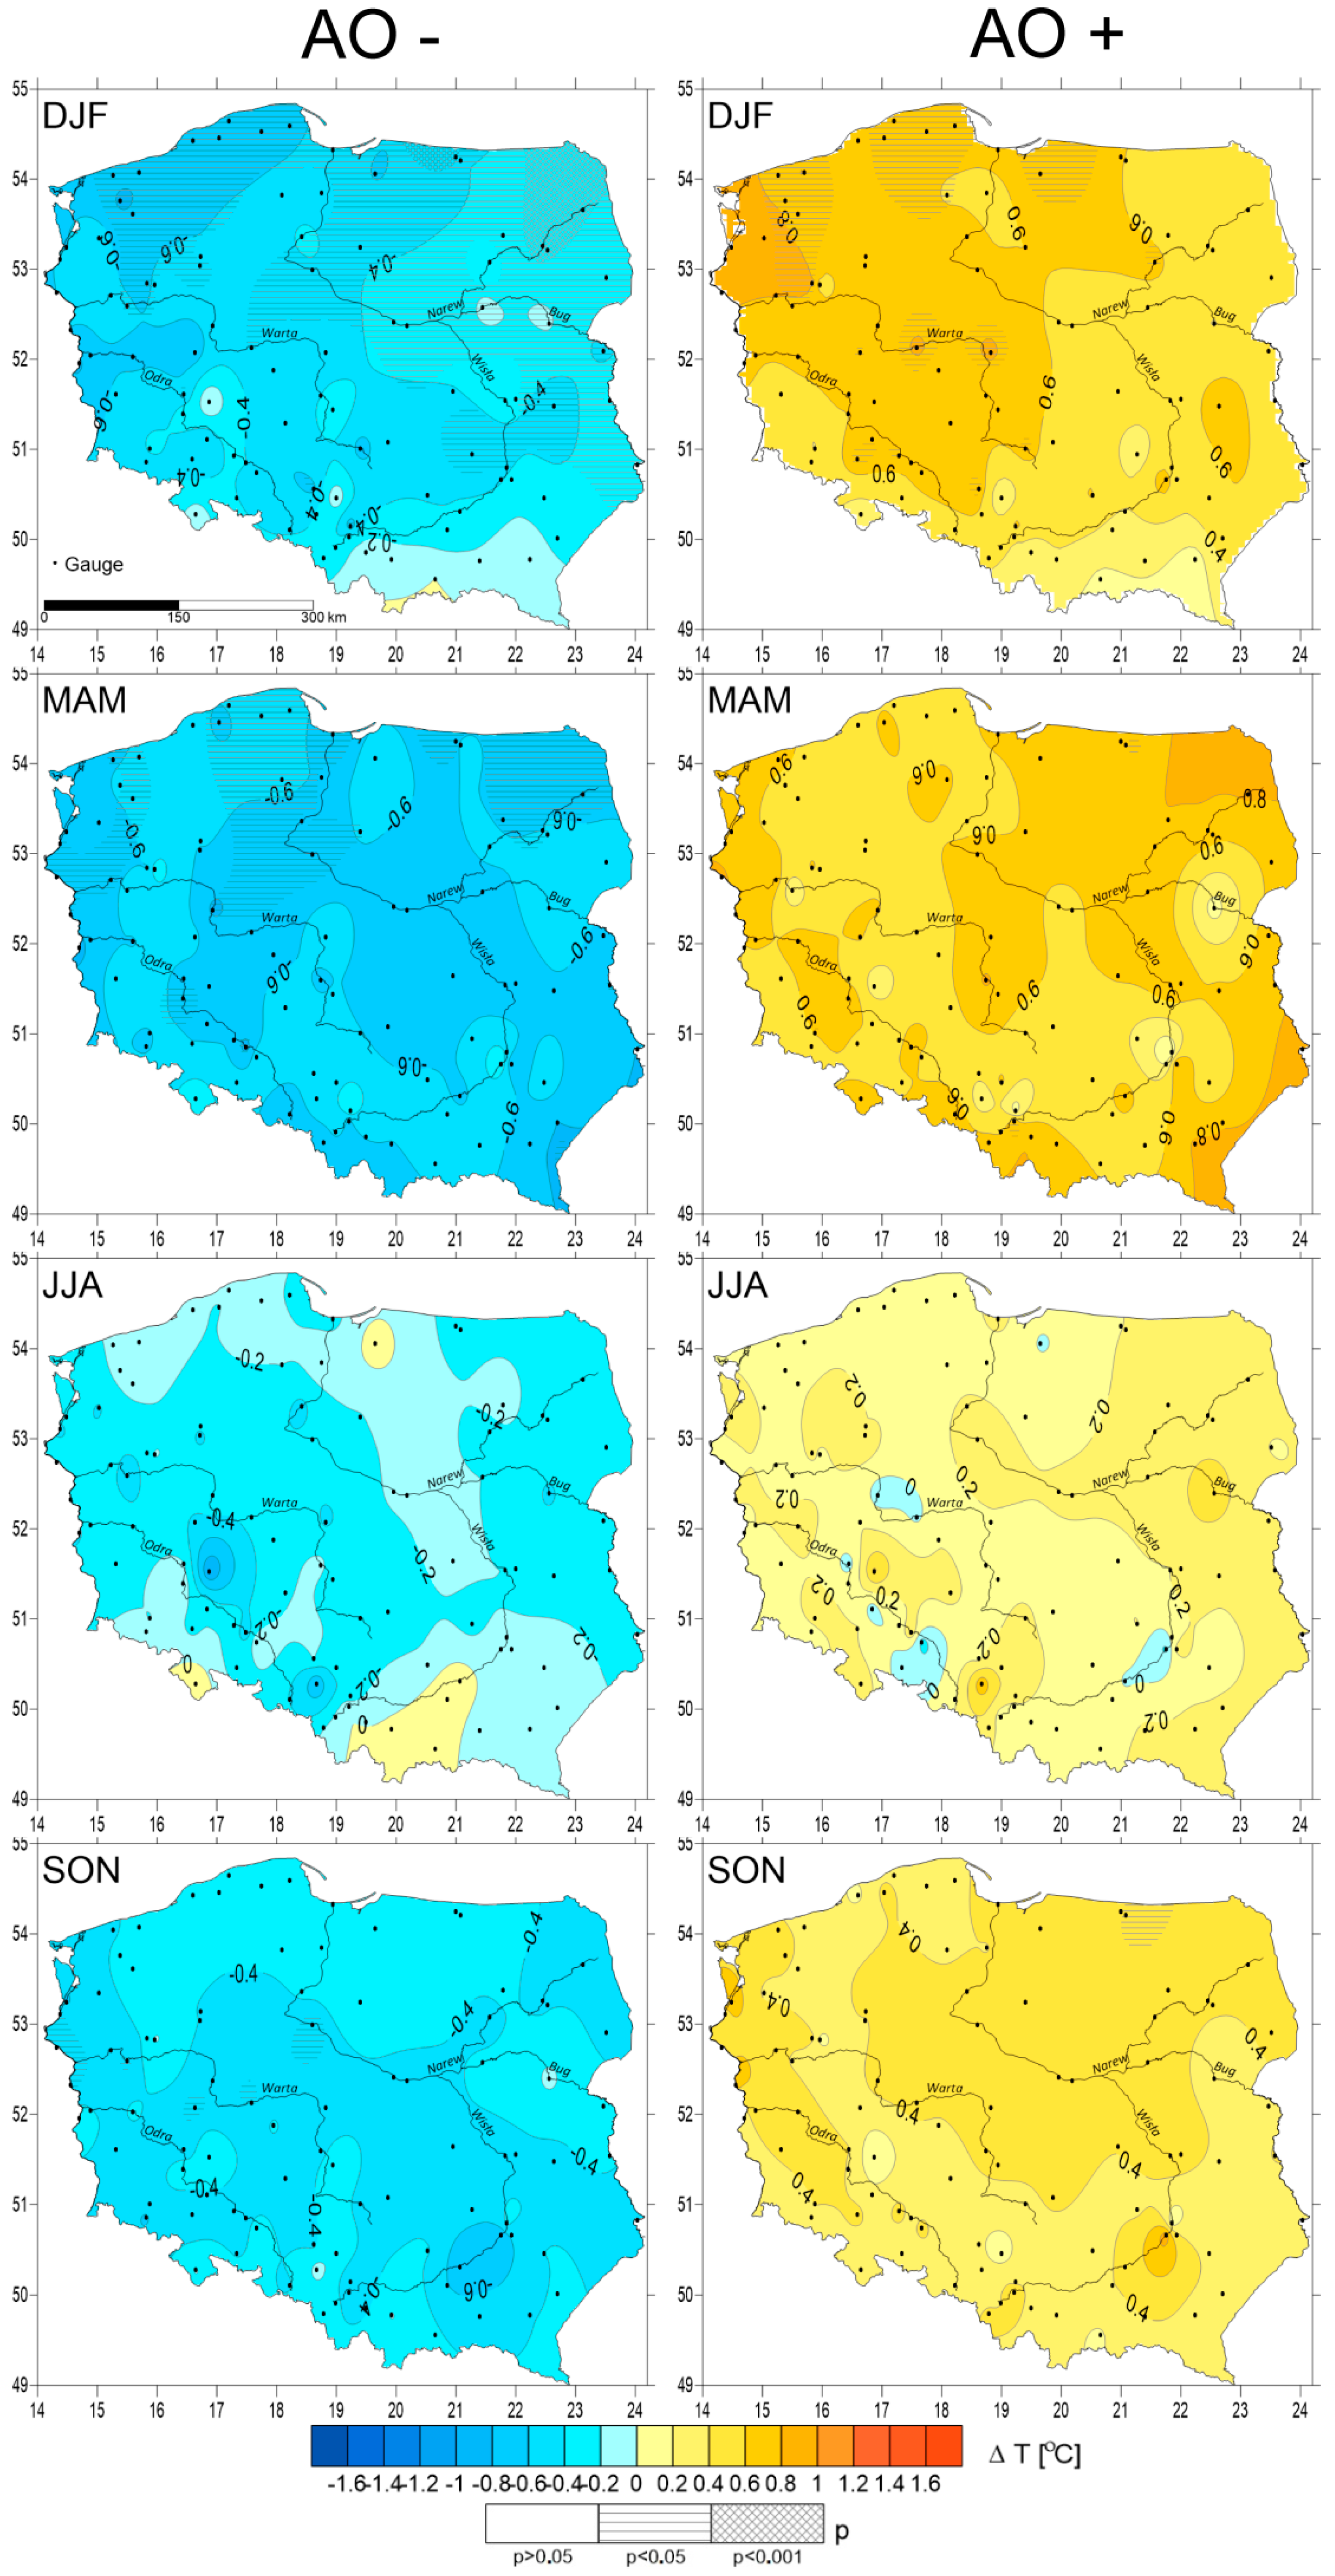
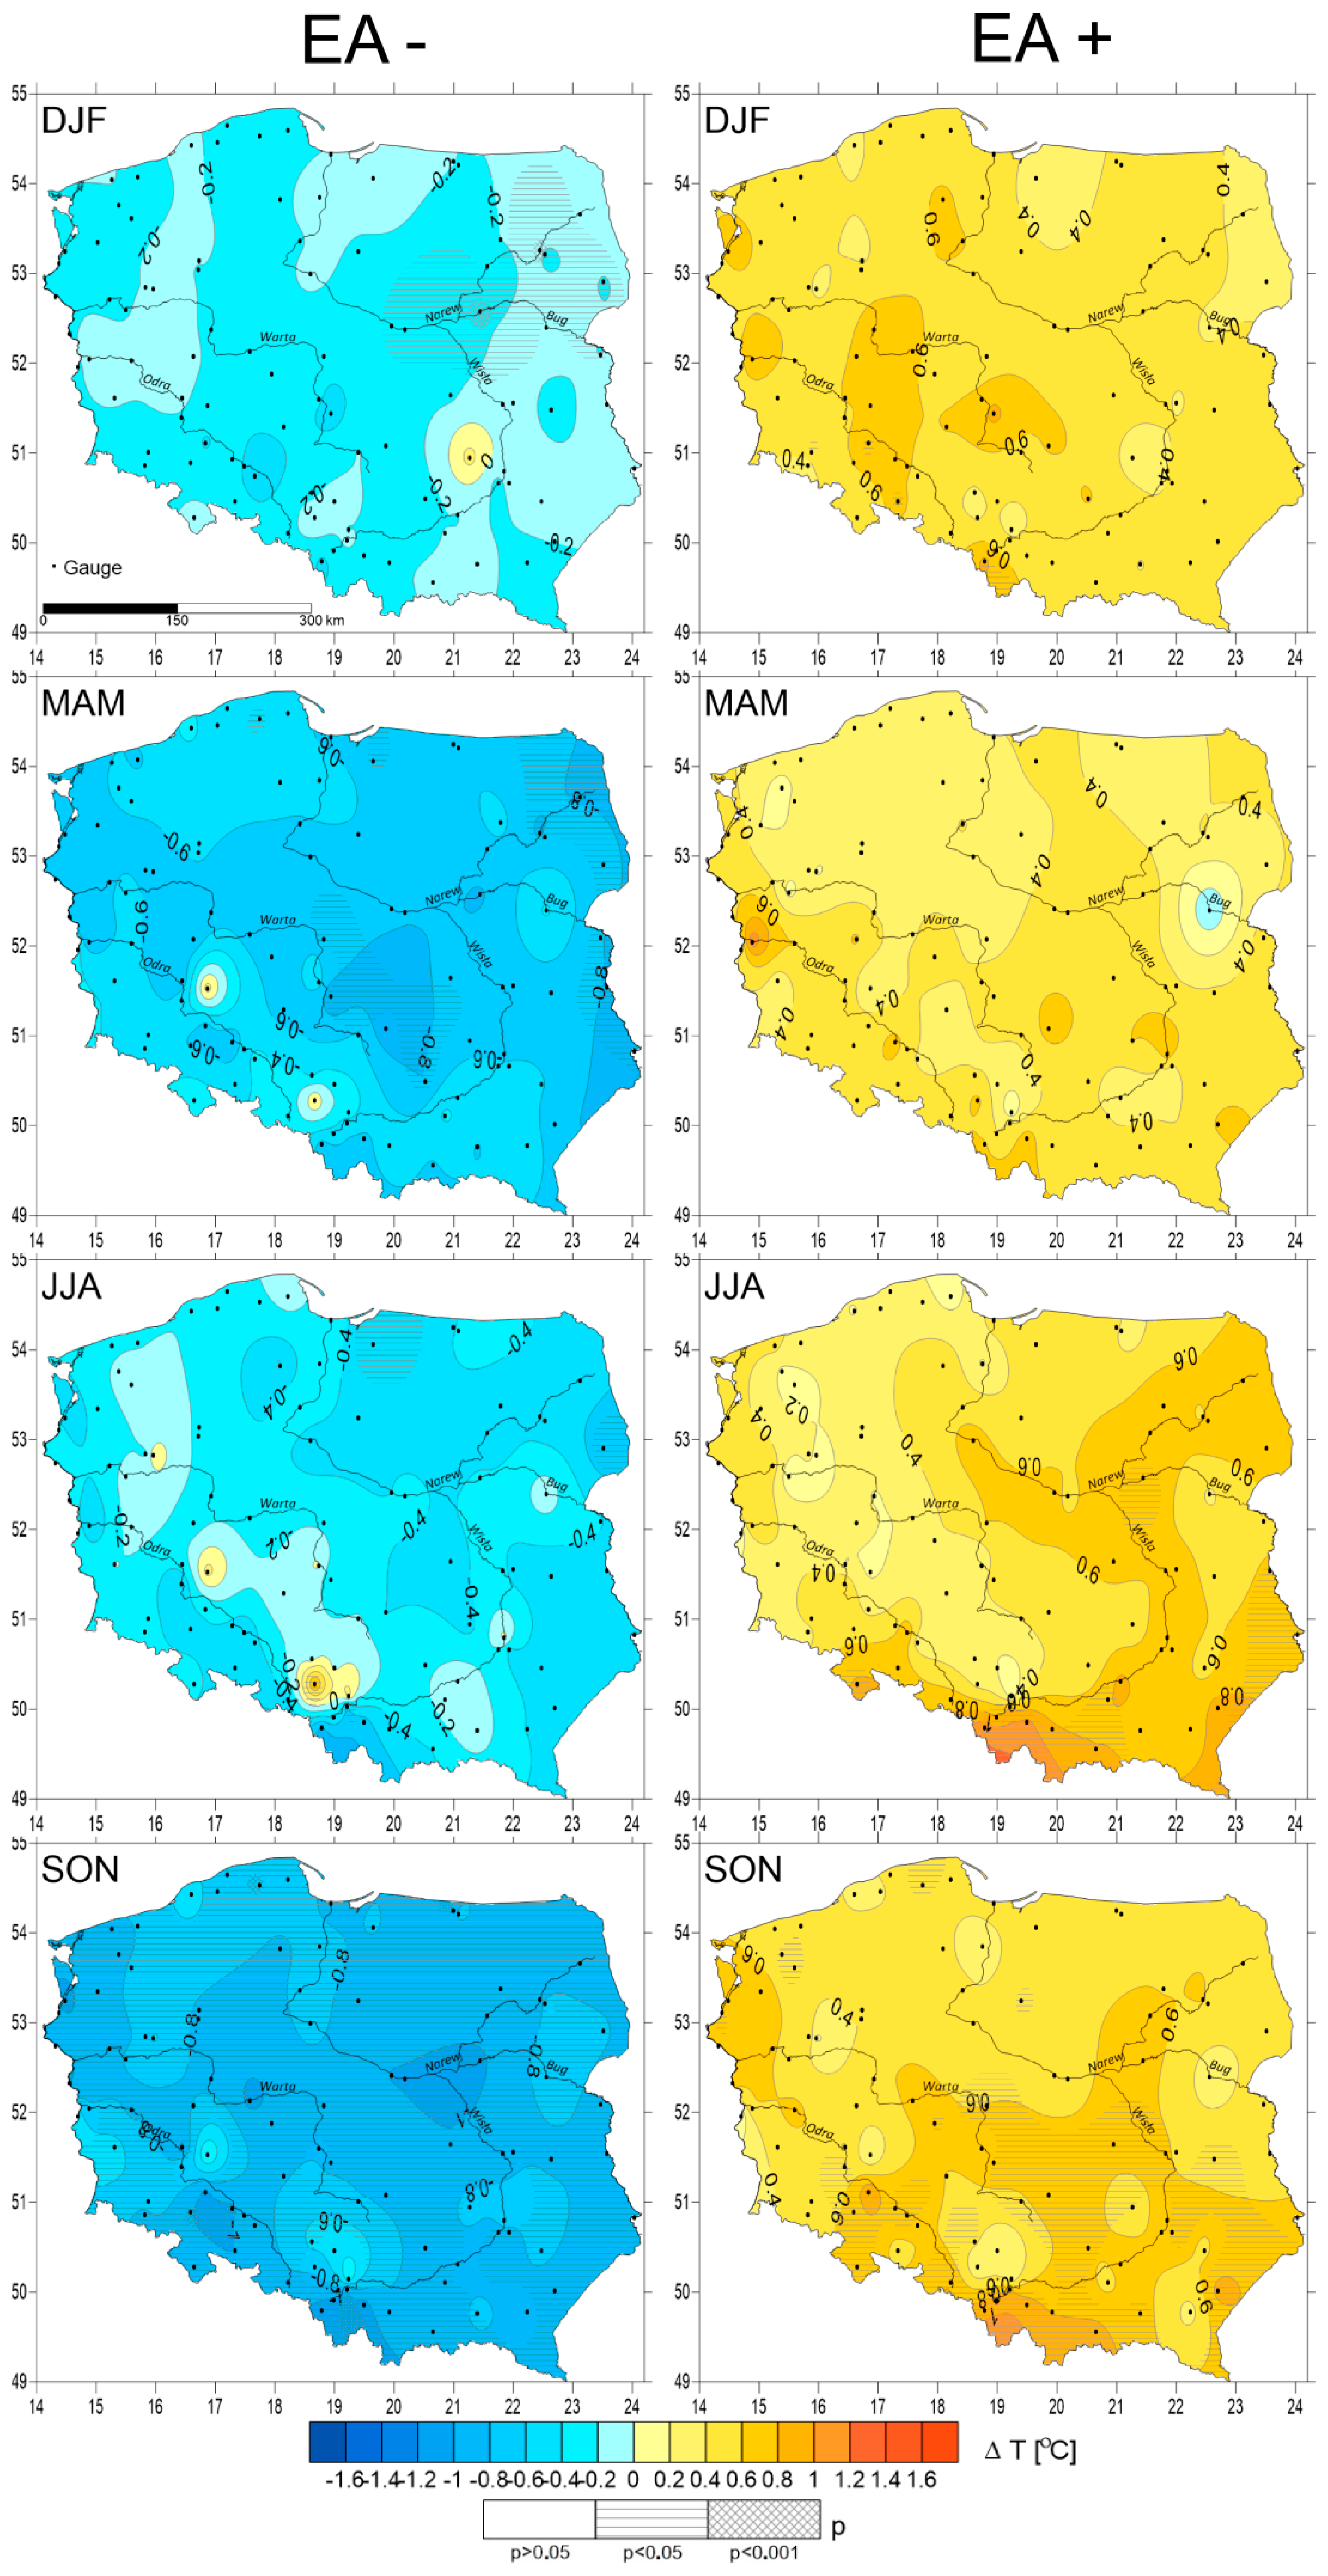
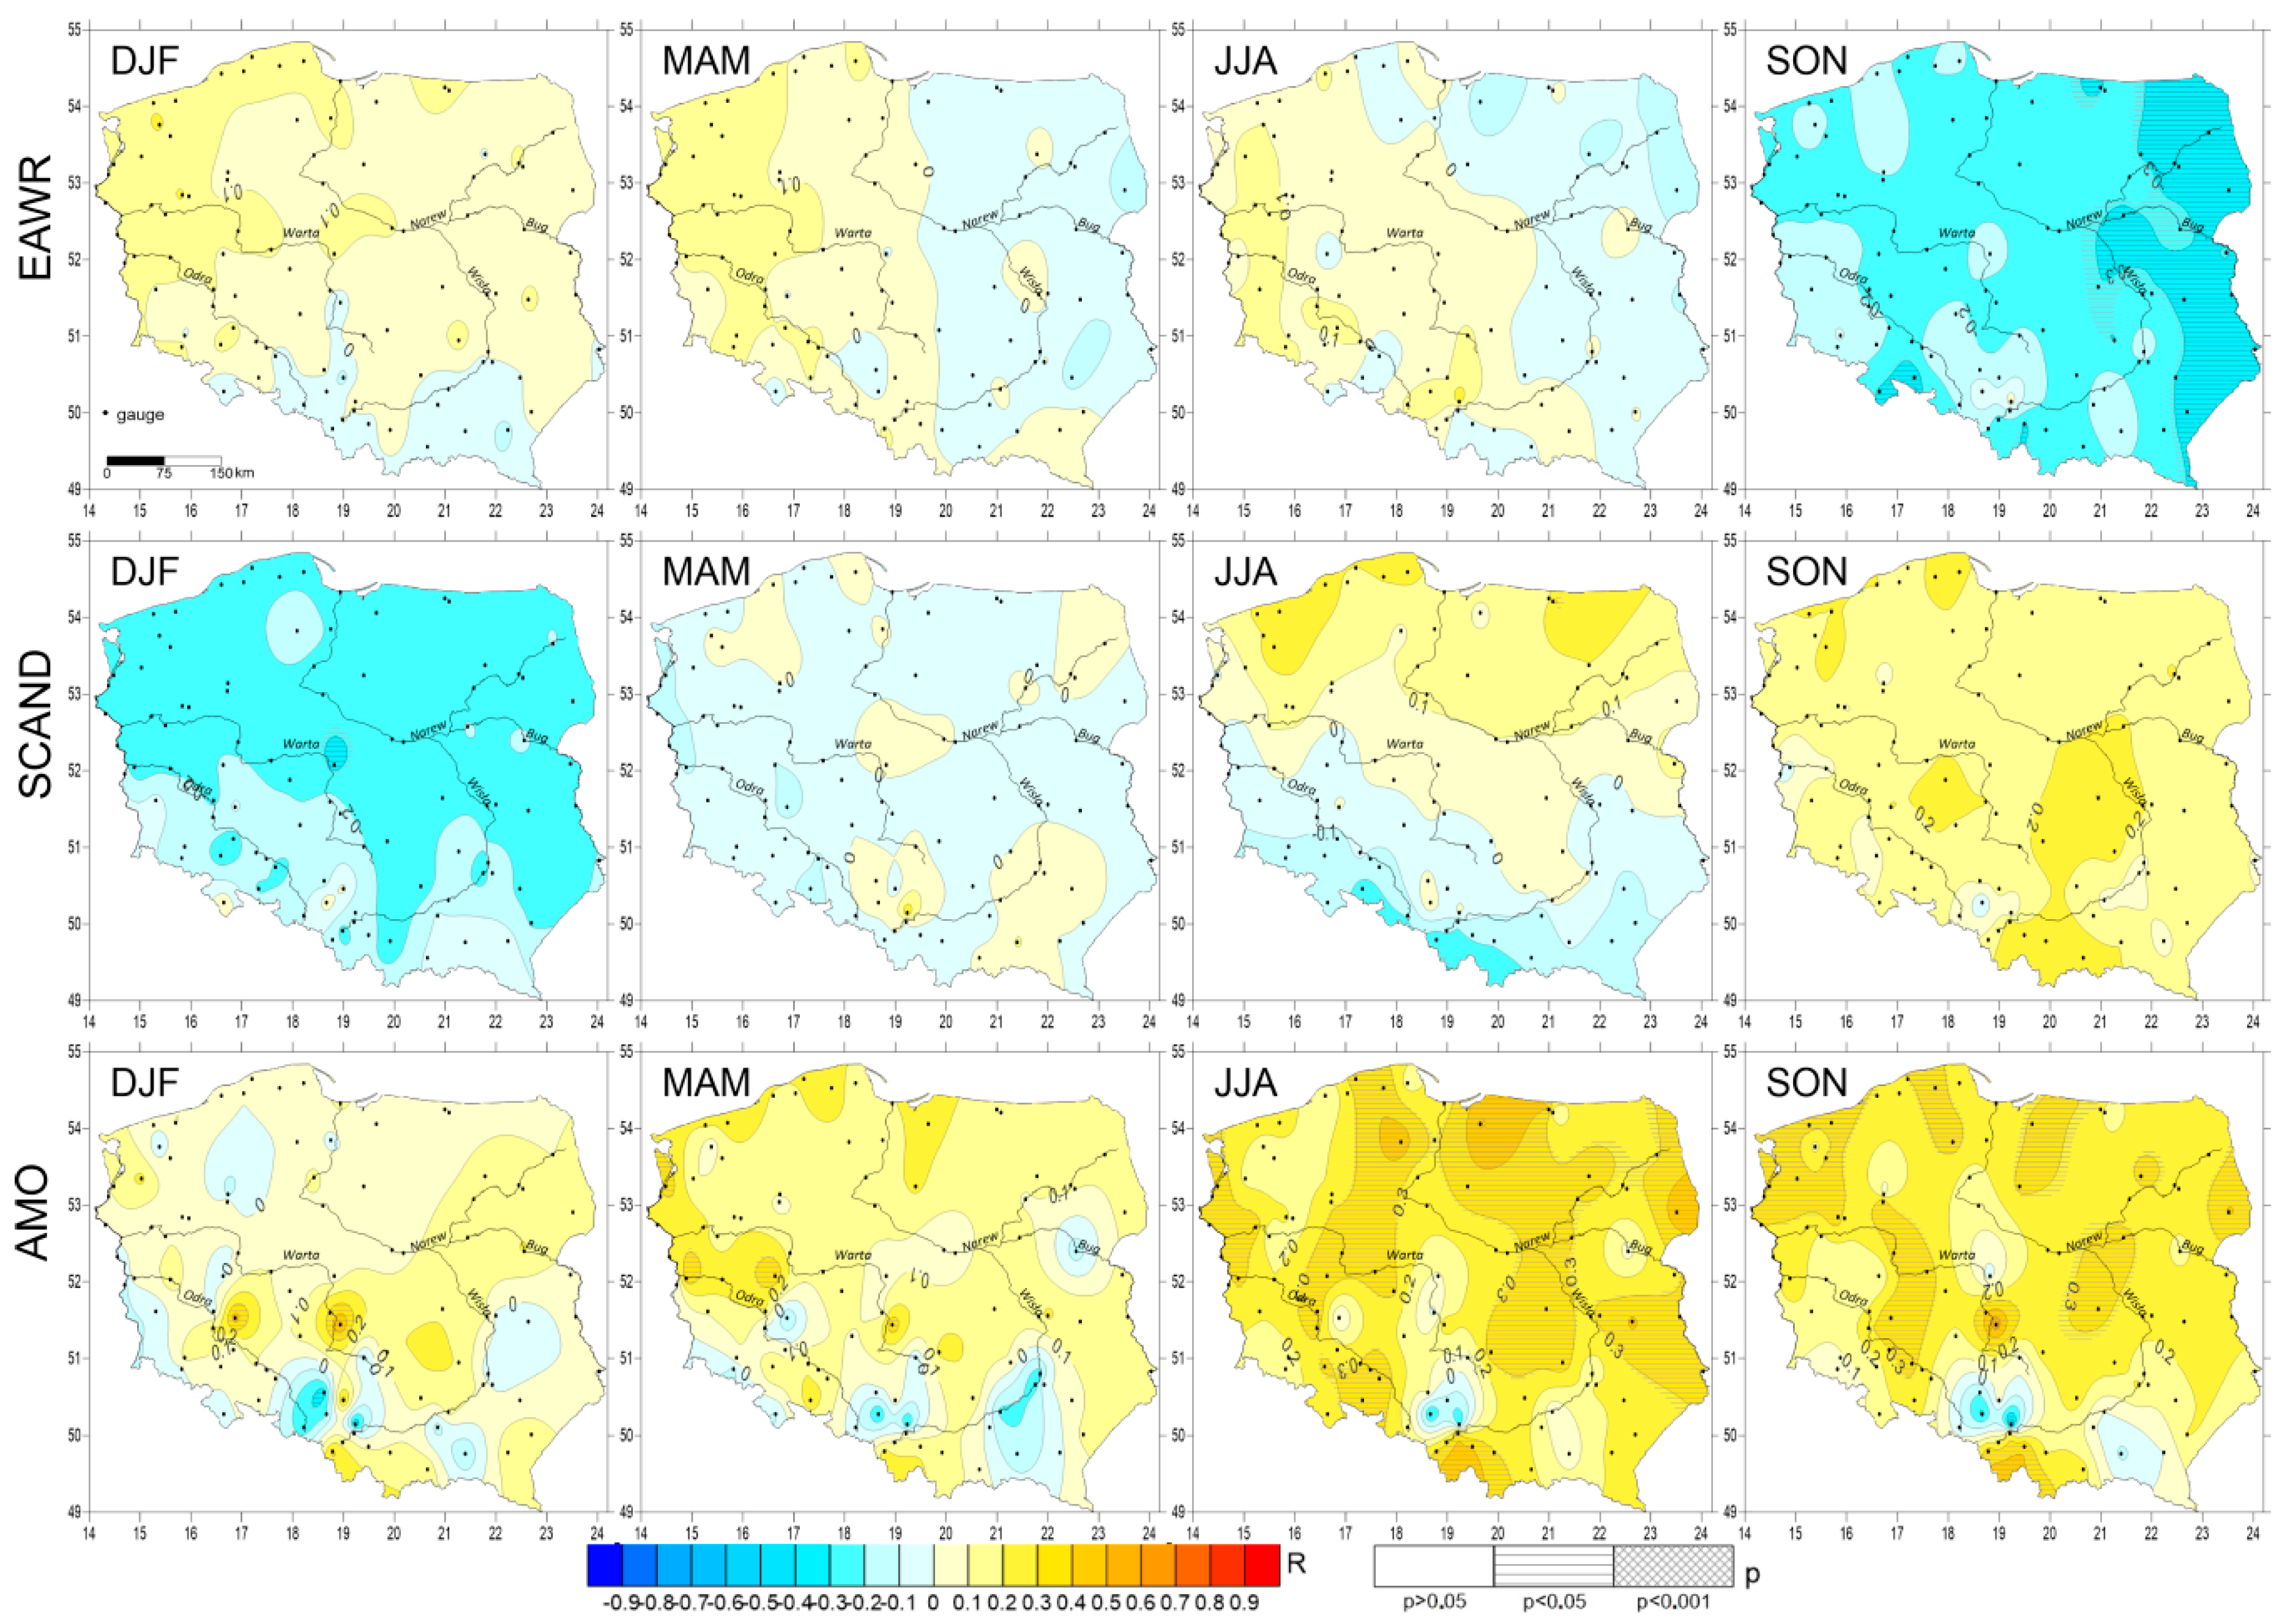
Research into the relationship between water temperature values of Polish rivers and large-scale atmospheric circulation has shown that for various phases of the analysed types of microscale circulations, deviations of water temperature values of Polish rivers have a tendency to vary both as regards their individual magnitudes and statistical significance. The spatial distribution of rivers with the largest statistically significant coefficients of annual correlation shows that they are predominant on a countrywide scale, with the exception of Northeastern Poland and rivers in the upper reach of the drainage basin of the Wisła (particularly its mountain tributaries). The results of analyses of relations between seasonal indices of macroscale types of atmospheric circulation and seasonal river water temperature values in Poland have confirmed the occurrence of positive correlations in the case of NAO, AO, EA, and AMO, and of negative correlations for the two remaining indices (EA/WR and SCAND). An intensification of the activity of NAO, AO, and SCAND was observed in the researched area in the winter season (with the exception of the Carpathian tributaries of the River Wisła), and this may in future contribute to an increase in river water temperature (in extreme instances by as much as 1 °C) and reduce the occurrence of ice phenomena thereon.
The percentage increase in the positive phase of the North Atlantic Oscillation (NAO) that occurred in the years 1987–1989 has led to a considerable decrease in the severity of winters in Poland after 1989 [
98]. The impact of the positive air temperature trend in the first decade of the 21st century on warming in the spring season has also been confirmed [
56,
70,
94,
99]. In Poland, climate changes find expression in the positive trend of air temperatures not only in the winter months, but also in those of summer and autumn.
Analyses of teleconnection patterns carried out by the authors in relation to changes in river water temperature values have demonstrated that in the summer season (and particularly in July) the activity of the AMO circulation in Poland increases, and that in the positive phase this brings about an increase in river water temperature values by even more than 1 °C (0.6–1.6 °C). This may bring about an increased share in the temperature observation series of measurements exceeding the permitted thermal thresholds, which is particularly dangerous for fish. Research carried out by Graf [
100] into the thermal characteristics of waters of the River Warta has demonstrated that in the years 1991–2010 the maximum temperature of waters registered in the summer season attained or exceeded 24 °C, while the thermal thresholds for cyprinids and salmonoids are 21.5 °C and 28.0 °C, respectively. An increase in river water temperatures in the summer, which is the result of circulatory conditions, may negatively influence the maintenance of thermal stabilization in the water-course, which contributes among others to the strengthening of the biodiversity of species, e.g., aquatic ichthyofauna. As regards the EA and EA/WR indices analyzed by the authors, the intensification of their activity occurred in the autumn season, particularly in the months of September and October. In autumn, the impact of these indices on seasonal water temperature values of Polish rivers may contribute to the lengthening of the period of warming or to the more rapid cooling of rivers. Research performed by Graf and Tomczyk [
37] has confirmed the appearance in Poland (the catchment area of the River Noteć) of negative air temperature values in October, which were registered for a number of years of the period 1987–2013. These were individual days or series of a few days with negative temperatures, which, however, did not contribute to the appearance of ice phenomena on the river; these were initiated only under conditions of greater water over-cooling.
The results obtained confirm that macroscale types of atmospheric circulation are characterized by varying relations with features of the thermal regime of Polish rivers. This is concordant with the results of research conducted, among others, by Frais et al. [
92] on the Iberian Peninsula. Relations between macroscale types of atmospheric circulation and river water temperature are analyzed less often than relations between air and water temperature. This is because air temperature is recognized as the main regional factor impacting its variability.
The observed increase in river water temperature values may be the result of the rise in air temperature, confirmed by strong air–water relations, or of anthropogenic factors [
12,
22,
101]. Research into water temperature variability trends has confirmed that trend patterns are the result of anthropogenic factors impacting the river system (riverbed regulation, land melioration), and may therefore become dominant or influence the direction of climate change [
2,
10,
17,
19]. Statistically insignificant relations were determined for some Polish rivers and analyzed macroscale types of atmospheric circulation. In the majority of instances, these are rivers strongly impacted by anthropogenic factors. Among others, they include the rivers in the Upper Silesian Industrial Region (Katowice area,
Figure 1), which for years have been the recipients of polluted mine waters [
102].
The impact of anthropogenic factors on the structure of the measurement series of river water temperature values has been confirmed, among others, by Westhoff and Paukert [
3] and Hester and Doyjle [
12]. Whereas Ptak et al. [
65] and Hernández et al. [
103], who researched the relations existing between types of atmospheric circulation and lake water temperature values, have stressed the considerable role of anthropopressure in stifling signals of teleconnection patterns. In their opinion, changes in the thermal regime of lakes may be caused by the supply of pollutants from urbanized areas. While studying the impact of the North Atlantic Oscillation on the hydrological conditions of Lake Morskie Oko (Carpathian Mountains), the authors have demonstrated that in this instance, too, local factors may mask the effect of macroscale atmospheric circulation [
104].
Numerous studies conducted under different climatic and environmental conditions have shown that regional climatic tendencies are coincident with variable, local river water temperature trends. Without a doubt, a good synthesis of the circulatory conditions existing over Poland and an assessment of their impact on the thermal characteristics of river waters would be provided by a simultaneous analysis of the so-called indices of the Polish oscillation, which have been determined on the basis of differences in atmospheric pressure (reduced to sea level) between selected meteorological stations (e.g., the index of the Polish western oscillation (PLO-W), determined on the basis of the pressure difference PKraków–PHel). However, pertinent research has not been conducted to date with reference to river waters.
The features of the thermal regime of rivers are shaped under the influence of the large-scale spatial and temporal variability of climate–water temperature associations, and of river basin properties which act as modifiers of these relationships [
10,
14]. Whereas the thermal susceptibility of rivers to climate change and its seasonal variability are controlled by complex factors: air temperature, downward short-wave and long-wave radiation, wind speed, specific humidity, and precipitation, which must be distinguished in order to properly understand the patterns of temporal and spatial change. Seasonal changes in river water temperature shaped by correlations between positive and negative phases of macroscale atmospheric circulation are presented in only a small number of articles. The significance of this problem for research into relations between macroscale types of atmospheric circulation and climatic and hydrological factors has been duly recognized—among others by de Beurs et al. [
28]. Its crucial importance is underscored by the fact that these changes are critical for maintaining the ecological function of rivers.
5. Conclusions
Research carried out for the territory of Poland has demonstrated that regional climatic patterns play an important role in shaping the temperature of river waters and its seasonal variability. The analysis focused on six macroscale types of atmospheric circulation, and this made it possible to ascertain their annual and seasonal intensity and determine the months in which their joint impact on the studied variables is strongest. Research has shown that relations between the temperature of river waters in Poland and macroscale circulation types are not strong; however, it is noticeable and both temporally and spatially diverse. NAO, AO, EA, and AMO indices are characterized by a generally positive correlation with air and water temperature, whereas SCAND and EW/AR indices are characterized by a negative correlation. The relation between the temperatures of Polish rivers and macroscale types of atmospheric circulation varies; however, a greater effectiveness becomes apparent in the winter season (NAO, AO, EA, SCAND). As regards the EA index, its relation with water temperature is high in various seasons of the hydrological year, and displays an increased intensity in autumn, whereas in the case of the EW/AR index the relation was observed as being strong in September. Stronger relations between AMO and temperature values were registered mainly in summer.
The spatial distribution of coefficients of correlation of annual indices with annual river water temperature values shows that the NAO index (1971–2015) is more strongly connected with river water temperature in Central and Southern Poland, and the AO index in the western and central parts of the country—as opposed to the EA index, which has a strong association with water temperature values in the eastern part of the country. Teleconnections between the AMO index and water temperature values have been confirmed in the northern and southern part of the country, and in the rivers of Western and Central Poland for the SCAND index. As regards the EW/AR index, no regular spatial patterns of the distribution of coefficients of correlation have been observed.
It has been demonstrated that in the negative NAO, AO, EA and AMO phases, river water temperature values are visibly lower, by approximately 0.1–0.4 °C, and seasonally by as much as 0.8–1.0 °C (negative EA phase)—than the multi-annual averages for the years 1971–2015; these differences are statistically significant. In the positive phase, deviations of annual water temperature from average values are greater and range from 0.1 to 0.5 °C, while seasonally these deviations may even exceed 1.0 °C (positive EA phase). During the negative SCAND phase, the annual river water temperature values in Poland are approximately 0.1–0.4 °C higher, while in the positive phase deviations are negative and statistically insignificant. As regards the positive phase of the EA/WR index, deviations of annual water temperature from average values are greater and statistically significant, while in the negative phase of this index these relations are statistically insignificant.
The present paper is the first to take up the issue on such a scale—not only in Poland, but also in this part of Europe. The results obtained possess a considerable informational and utilitarian potential, and may be utilized in comparative hydrological and environmental research, particularly as regards the transformation of river ecosystems caused by climate change. The relations determined between atmospheric circulation types and water temperature may constitute an indicator of the degree of risk for habitats and species susceptible to changes in river water temperature, which is of special significance for the functioning of aquatic ecosystems and the rationalization of fisheries management.


