Abstract
The expansion of unconventional oil and gas development (UD) across the US continues to be at the center of debates regarding safety to health and the environment. This descriptive study evaluated the water quality of private water wells in the Eagle Ford Shale as well as community members’ perceptions of their water. Community members (n = 75) were surveyed about their health status and perceptions of drinking water quality. Water samples from respondent volunteers (n = 19) were collected from private wells and tested for a variety of water quality parameters. Of the private wells sampled, eight had exceedances of maximum contaminant limits (MCLs) for drinking water standards. Geospatial descriptive analysis illustrates the distributions of the well exceedance as well as the well owners’ overall health status. Point-biserial correlational analysis of the haversine distance between respondents and well exceedances revealed four statistically significant relationships {Well 11, Well 12, Well 13, Well 14} with correlations of {0.47, 53, 0.50, 0.48} and p-values of {0.04, 0.02, 0.03, 0.04}, respectively. These correlations suggest that as distance from these northwestern wells increase, there is a higher likelihood of exceedances. Those relying on municipal water or purchased water assessed that it was less safe to drink than those relying on private wells for drinking (p < 0.001, Odds Ratio, OR = 44.32, 95% CI = {5.8, 2003.5}) and cooking (p < 0.003, OR = 13.20, 95% CI = {1.8, 589.9}. Tests of proportional differences between self-reported conditions and provider-reported conditions revealed statistical significance in most cases, perhaps indicating that residents believed they have illnesses for which they are not yet diagnosed (including cancer). In many cases, there are statistically significant differences between self-reported, provider undiagnosed conditions and self-reported, provider diagnosed conditions.
1. Introduction
The expansion of unconventional oil and gas development (UD) across American shale basins, along with the economic, environmental, and human health implications, have kept the topics of hydraulic fracturing and UD in the center of a contentious debate over its safety. One of the major concerns regarding the various phases of UD involves the contamination of groundwater. In particular, the inherent nature of the UD process requires that it penetrates through aquifers to extract hydrocarbons from petroliferous strata, which represents a potential liability. The oil and gas industry exercises a number of precautionary measures to ensure that groundwater quality is not impacted by UD; however, the degradation of protective surface casing and cement have been identified as one of the major points of weakness throughout the lifetime of hydrocarbon production wells [1,2,3]. As such, it is not surprising that recent environmental investigations have revealed elevated levels of dissolved gases [4,5,6], heavy [7] and alkaline earth metals [8], and various volatile organic compounds (VOCs) [9,10,11,12] in groundwater overlying unconventional production zones. It has also been discovered that surface water [13] and soil [14] can be impacted by naturally-occurring radioactive material (NORM) in shale energy basins, a phenomenon that is likely attributed to surface spills and lapses in proper waste management.
Collectively, these findings and how they are portrayed in the mainstream media, have had a significant influence on the general populace’s perception [15,16]. Personal views expressed through outlets such as Twitter [17] are a notable reflection of mass media’s influence. As such, the latest peer-reviewed environmental and human health data pertaining to UD, in conjunction with provocative documentaries on the subject [18], have triggered the mobilization of concerned citizens to become more engaged with respect to the UD activities in their communities. Furthermore, Sangaramoorthy et al. [19] found that UD causes a disruption in local communities, affecting residents’ sense of place and social identity through rapid transformations of their surroundings, causing stress within communities [19]. The unwavering energy development in the communities surveyed brought economic benefits, but nonetheless influenced residents’ perceptions of UD as mostly negative due to potential environmental and health impacts. Additionally, Choma et al. found a correlation between political ideology and knowledge regarding UD as key predictors of attitudes towards UD [20].
There are a number of rural communities and small towns in the Eagle Ford Shale in Texas. This shale hydrocarbon-producing geological formation is important to Texas, as it is can produce both natural gas and also more oil than other traditional shale plays. It stretches across Texas from the border with Mexico to East Texas, is approximately 50 miles wide and 400 miles long, and runs through 27 mostly rural counties. The Eagle Ford Shale contains a much higher carbonate shale percentage, close to 70%, which makes it more brittle and better for hydraulic fracturing activities, especially in the southern region [21].
This study takes place in Frio, County Texas, located in the southern portion of the Eagle Ford Shale. This county has a population of approximately 19,820 people with the largest city being Pearsall, which has a population of approximately 9150 [22]. There are currently 313 oil and gas producing leases, 57 producing operators, and 5918 drilled wells in Frio County [23]. As of January 2019, there were 584,836 barrels of oil and 867,478 MCF of gas produced in the county. This south Texas region saw a fracking boom in 2009 followed by a bust in 2014, in which the communities in surrounding areas were greatly affected. There has been a slow increase in production over the last year or so; however, the region has not fully recovered. No previous water research had been performed in this area and the community expressed an interest in learning more about the impacts of UD in their area.
Frio County was selected as the site for the study due to concerns raised by the community and because at one time, the county was the most prolific shale energy basin in the world. The actual wells selected were based solely on owner participation and availability. The water for these wells derives from the Carrizo-Wilcox, Yequa-Jackson, and Gulf Coast aquifers, which slope southeastward towards the Gulf Coast and have interbedded sedimentary formations.
Sand, clay, sandstone, silt, and lignite compose the Carrizo-Wilcox aquifer. Interbedded sand, silt, and clay are the most significant components of the Yegua-Jackson aquifer. The Gulf Coast aquifer is of similar composition to the Yegua-Jackson but with gravel as well. These hydraulically- connected deposits form a leaky artesian aquifer system. In the Eagle Ford Shale region, there are some unique geological features that may influence groundwater quality including the San Marcos Arch and the Yegua faults. While groundwater pumping along the coast has resulted in saltwater intrusion, this effect has been largely restricted to big cities along the coast rather than the study area [24].
In the work presented here, we assess groundwater quality and quantifiable perceptions of UD in the Eagle Ford Shale region of southern Texas (Figure 1). This study is primarily descriptive in nature. Multiple reconnaissance efforts have recently evaluated groundwater quality throughout the Western Gulf Basin revealing elevated levels of biogenic and thermogenic natural gas [25,26]; benzene, toluene, ethylbenzene and xylene (BTEX) compounds [27]; and total organic carbon, and various organic solvents [24] in private and public water supply wells. However, these data are the first to evaluate the prevalence of organic and inorganic groundwater constituents within the context of community members’ perceptions, providing unique insight into the relationship between residents and the UD industry operations.
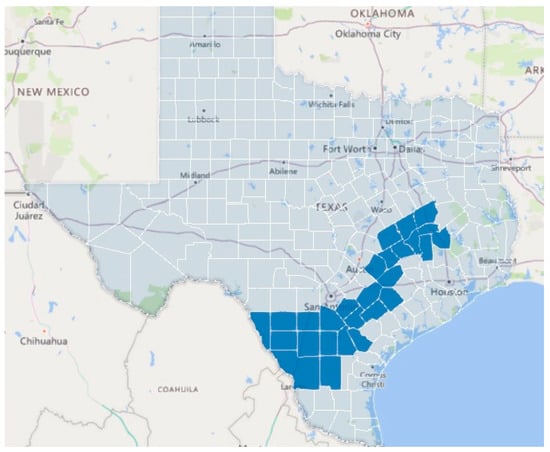
Figure 1.
Map of Eagle Ford region in Texas (all counties in blue, Eagle Ford counties in dark blue).
2. Materials and Methods
2.1. Water Well Sampling
The groundwater samples analyzed in this study were collected from 19 private water wells in Frio County Texas within the Eagle Ford Shale region (Figure 1). Sampling sites were selected as a function of well owner participation and availability. We observed a large range in well depth (10–600 m), which corresponded with samples being acquired from multiple hydrogeological strata (Gulf Coast, Queen City, Yegua, Mount Selma, and Carrizo aquifers). Well depth information was acquired for 17 of the 19 sampled wells from owner recollection and available documentation.
Water samples were collected as described previously [28]. Briefly, each water sample was collected as close to the water wellhead as possible, prior to any filtration or treatment systems. The water wells were purged until temperature, dissolved oxygen (DO), conductivity, total dissolved solids (TDS), salinity, pH, and ORP measurements, as determined by a YSI Professional Plus multi-parametric probe (YSI Incorporated, Yellow Springs, Ohio, USA), stabilized to ensure that the samples were representative of groundwater from their respective aquifers following USGS protocols. At each site, multiple samples were collected in 125-mL HDPE bottles with no headspace and held for no longer than 48 h on ice before transport to The University of Texas at Arlington. Field blanks were prepared with deionized water and randomized duplicate samples were used for quality assurance. Samples collected for metal ions analysis were filtered and preserved with concentrated nitric acid to a final concentration of 2% v/v. Samples collected for organic ion analysis were preserved with chromatography grade chloroform to prevent microbial degradation. Samples collected for the analysis of volatile organic and semi-volatile organic compounds, total organic carbon (TOC), and total nitrogen were untreated [10,11,27,29]. Select samples for dissolved hydrocarbons gases (methane, ethane, and propane) were collected using Isoflask containers as per Molofsky et al. [30].
2.2. Water Quality Analysis
Methodology for chemical analyses followed those from our previous studies [7,10] and included gas chromatography mass spectrometry (GC-MS), headspace-gas chromatography (HS-GC), inductively coupled plasma mass spectrometry (ICP-MS), and ion chromatography (IC). Specific organic chemical species were selected from a Congressional Report on hydraulic fracturing fluid ingredients [31], frequently listed components of UD fluids in the national hydraulic fracturing chemical registry (www.fracfocus.org), and from compounds identified in previous studies [10,32]. These compounds included alcohols, aromatic compounds, aldehydes, amines, and chlorinated species. Whenever possible, we evaluated constituents in relation to their respective primary or secondary maximum contaminant limits (MCL) as provided in the United States Environmental Protection Agency’s Drinking Water Standards [33]. Information about locations of UD activity in the region was obtained from www.fracfocus.org and the Texas Railroad Commission, the governing body for oil and gas drilling in the state of Texas [21].
2.3. Survey and Geospatial Analysis
The study population was a sample of 75 residents in Frio County, Texas, which is within the Eagle Ford Shale region. Eighteen of these residents agreed to have their water wells tested. One resident owned two wells, so there are 19 completed water tests. The residents who received water testing also took the survey and are included in the 75 responses. Data were collected in 2017 through a structured survey administered by interview. The survey included questions about attitudes, perceptions, and knowledge regarding water quality as well as an assessment of individual health status. The Institutional Review Board (IRB) of UTHealth School of Public Health (HSC-SPH-15-0954) approved the study. Participants were recruited by snowball and convenience sampling methods at local establishments, libraries, and community-wide events. All survey responses were anonymous and geographic information was visualized as generalized points to prevent identification of participants. Descriptive analysis of the survey was intended to provide insight into the perceptions and attitudes of the participants. Geospatial analysis was performed in Excel and evaluated self-reported health status and well contamination levels. Additional inferential analysis investigated knowledge as a function of demographics. Several other qualitative variables were evaluated for independence. R statistical software was used to analyze the data along with several R packages including “lemon”, “psych”, “ggplot2”, “knitr”, and “scales” [34].
3. Results
3.1. Demographics
The total number of participants in the study was 75 and all were residents living within the Eagle Ford Shale region. Of those 75 participants, 18 agreed to well water testing. Of the respondents, 37% of the participants were male, and the average age was 52. The modal ethnicity was Hispanic (60%), and the most commonly identified race was White (75%). Most participants (28%) had some college, with the second-most (25%) reporting as high school graduates. In terms of income, 29% earned more than $75 K annually, while 25% earned less than $25 K. Most respondents reported that they were in good, very good, or excellent health (75%). Only 10 individuals reported active or previous work in the oil and gas industry. On average, the number of household members was 2.84.
The Census Bureau estimates the male population of Frio county at 49.3%, the median age as 31.7, and the Hispanic population at nearly 80%, somewhat different from the sample statistics [22]. There is little reason to expect that the voluntary sample in the high-fracking region would represent the entire county population due to survey opt-out prevalent in various groups such as Hispanics (see results).
3.2. Health Status
Participants were asked if they had or had ever been diagnosed with several health conditions. Of the respondents, 39% self-reported asthma and skin disorders, and 40% self-reported cancer. These conditions were not provider-diagnosed (based on the respondents’ reporting) at the same rate with only 17% indicating a formal diagnosis for asthma, 12% indicating a formal diagnosis for skin disorders, and 8% indicating a formal diagnosis for cancer. Table 1 shows percentages of self-reported and MD-diagnosed conditions.

Table 1.
Self-reported, provider undiagnosed and self-reported, provider-diagnosed conditions of the respondents are shown.
3.3. Qualitative Perceptions of Water Quality
Respondents of the survey provided qualitative perceptions of the taste, smell, look, and concerns about the water. Many comments were associated with these criteria; however, 10 out of 75 respondents provided specific concerns that may be associated with fracking. Table 2 shows those comments.
Table 2.
Qualitative responses likely associated with fracking activities without spelling corrections.
3.4. Descriptive Statistics: Water Questions
The respondents reported the primary source of drinking water was from a municipal source (59%), while 33% derived their water from private water wells. Most used city water for cooking (56%), while 35% never drank from the tap. Forty percent reported to have filtered their water. Sixty-one percent reported changes in taste, smell, and or appearance of their water in the last year. Many (39%) reported that the water smell changed in the last year. Of those respondents, seven reported a sewage smell, and five reported a sulfur or “rotten egg” smell. Twenty percent reported that the water taste changed, with six of those indicating that the water tasted bad or odd. Forty-seven percent noted an unusual appearance during that time with 29 of those indicating that the water was yellow, brown, or rusty. Only 23% of respondents had their water tested; however, the majority did not know or report the results. Fifty-nine percent of respondents had concerns about their water, and 33% indicated they did not believe their water was safe to drink or safe to cook (Appendix A).
3.5. Descriptive Statistics: Well and Well Chemicals
Eighteen respondents agreed to have their well water tested. One respondent owned two wells, so a total of 19 tests were conducted. The average well age was approximately 38 years old (median = 30), although it was impossible to determine the exact average, as many wells existed for generations. The average well depth was about 600 feet (median 445 feet) with a mean/median temperature of 27 degrees Celsius (80 degrees Fahrenheit). On average, the dissolved oxygen was 2.67 mg/L (median 1.94), although the highest concentration was nearly 6 mg/L. Average conductance was 1.05 mS/cm (median 1.1), and the total dissolved solids was high for each well with an average of 684.26 mg/L (median 715). Average salinity was 0.52 mg/L (median 0.54) with an average pH of 7.24 (median 7.22), slightly alkaline. Chloride levels averaged 261.67 mg/L (median 183), above the EPA recommended 250 mg/L, with one well reading 1090 mg/L. The nitrate average across wells was 8.48 mg/L (median < 0.03, acceptable level = 10 mg/L); however, one well exceeded the EPA recommended standard at 148 mg/L. Sulfates averaged 200 mg/L (median = 109, acceptable level = 250 mg/L), but six wells exceeded the EPA recommended levels. One well exceeded the strontium allowable maximum contaminant level (MCL), and another well had high levels of methanol, ethanol, and isopropyl alcohol. Table 3 provides the descriptive statistics for the well and parameters measured.
Table 3.
Descriptive statistics for the wells sampled and associated parameters measured.
A study from Fontenot et al. [7] evaluated 100 wells in the vicinity of natural gas extraction sites in the Barnett shale formation of Texas. Table 4 provides descriptive statistics from this study for identical variables to support comparison. The samples appear to be similar.
Table 4.
Descriptive statistics for the wells sampled and associated parameters measured.
Another study of well water quality in northwestern Texas by Hudak [44] provides the basis for comparison of chlorides, nitrates, and sulfates. Table 5 provides those findings. In this study, chlorides were lower and sulfates were higher than in the current sample.
Table 5.
Descriptive statistics for the wells sampled and associated parameters measured.
Eight of the 18 (44%) wells had chemical or biological contamination above the EPA drinking water limits, while the remaining 11 (56%) were within standards. Of the eight wells, two also had biological contamination (see Section 3.5 for a discussion). A list of the exceedances of drinking water standards for each of the wells is presented in Table 6.
Table 6.
List of wells that had exceedances of drinking water standards and the parameters in bold that exceeded US EPA standards.
3.6. Descriptive Statistics: Well Biological Contamination
The EPA goal for maximum coliforms in water is zero; therefore, no coliforms should be found in drinking water samples. All 19 samples showed presence of bacteria [28]. However, bacteria from fecal sources (E. coli C. amalonaticus) that could present a serious health risk were found in only two samples. One of the wells with fecal contamination is located near a septic tank that is most likely contaminating the water well. The other well was surrounded by livestock, which could explain the origin of these coliforms. The other forms of bacteria found in the wells may have been naturally occurring and not necessarily harmful. Detailed descriptions of bacteria found in the wells have been previously reported [28].
3.7. Geospatial Analysis
Figure 2 depicts the location of all the wells surveyed with their associated numbers. Figure 3 is a heat map of the wells exceeding EPA drinking water and Figure 4 is a heat map of health status. The intent of these maps is to provide insights into the geographic distributions of both variables. In Figure 3, the majority of wells with exceedances (6 out of 8) are distributed within ½-mile of the major interstate, with the two wells having the most exceedances (red center) directly off the highway. In Figure 4, the majority of “Excellent” health status is to the North and West with one exception in the far South. From viewing these two charts, there is no discernible relationship between “health status” and “well exceedances”.
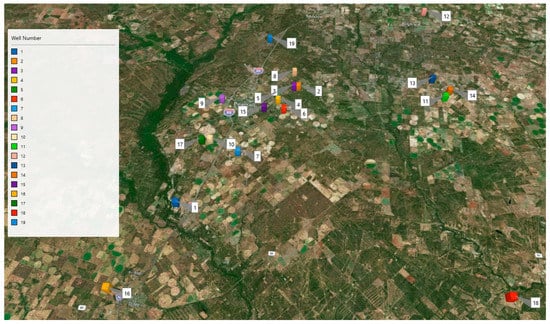
Figure 2.
Well locations.
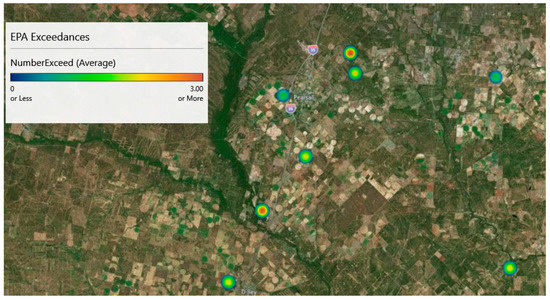
Figure 3.
EPA exceedances heat map.
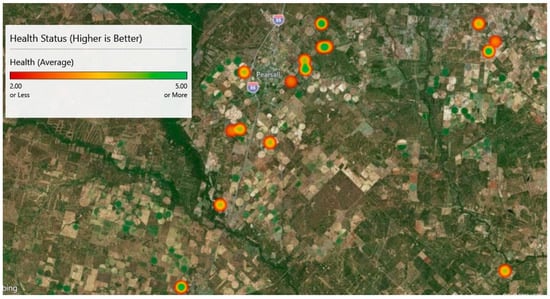
Figure 4.
Health status heat map.
3.8. Inferential Statistics
Due to the small sample size and selection bias, inferential analysis was restricted to a few interesting questions. Men were most likely to allow well testing (χ2 = 4.47, p = 0.03), and only one of 45 Hispanics allowed testing, a statistically significant finding by Fisher’s Exact Test (FET p < 0.01). Hispanics were more likely to report “Fair” health (14/45) whereas only two others reported the same (2/30, FET p = 0.004). Self-reported health of both genders was not statistically different (p = 0.927), and gender assessment of water safety for drinking was also not statistically different (p = 0.307). Using Fisher’s Exact Test (FET) and simulating the p-value (2000 replicates), health status and income were associated (p = 0.026); however, education level and assessment of drinking water safety were not related (p = 0.747). Drinking water safety and health status were also not associated based on FET (p = 0.9303).
Well tests were linked to the respondents. Of the 11 respondents without exceedances, three reported water concerns (27%), whereas three of seven with exceedances reported water concerns (43%). Possibly due to the small sample size, tests of the odds ratio (OR = 2.0) were not statistically significant (p = 0.63).
The correlation between the number of exceedances and health status was positive, r = 0.36. Although not statistically significant at the α = 0.05 level (p = 0.12), the sample size is necessarily limited to those permitting a well test (voluntary).
Point-biserial correlational analysis of the haversine distance between respondents and well exceedances revealed four statistically significant relationships {Well 11, Well 12, Well 13, Well 14} with correlations of {0.47, 53, 0.50, 0.48} and p-values of {0.04, 0.02, 0.03, 0.04}, respectively. These correlations suggest that as distance from these wells increase, there is a higher likelihood of exceedances. These wells are located in the northwestern area of the study, outside of the urban area and away from the interstate (see Figure 1).
With respect to perceptions and sources of drinking water, an FET suggested that the perceived safety of drinking water was a function of the respondents’ drinking water source (p < 0.001). Twelve out of 17 (71%) on city water indicated that they believed their water was not at all safe or only a little bit safe (versus quite a bit and extremely safe) to drink. Only one out of 14 individuals (7%) who used a private well for water indicated that the water was not at all safe. Also, 35 out of 44 (80%) of the individuals who reported drinking purchased water indicated that their tap water was not at all safe or only a little bit safe. Table 7 shows those results.
Table 7.
Results of the cross-tabulation of safety of water to drink versus source of drinking water.
When combining the bottom two categories and top two categories for “confident of home tap Tests of proportional differences between self-reported conditions and provider-reported conditions revealed statistically significance in most cases (Table 8). Twenty-two percent (22%) of respondents self-reported presence of cancer without a provider’s diagnosis.
Table 8.
Self-reported, provider undiagnosed and self-reported, provider-diagnosed conditions of the respondents are shown. Asterisks indicate statistically significant differences at the α = 0.05 level.
Water safety to drink,” an FET test actually demonstrated that those relying on municipal water or purchased water assessed that it was less safe to drink than those relying on private wells for drinking (p < 0.001, Odds Ratio, OR = 44.32, 95% CI = {5.8, 2003.5}) and cooking (p < 0.003, OR = 13.20, 95% CI = {1.8, 589.9}). A reason behind this interesting finding may be that all but one well owner use filtration systems, whereas only seven of 17 filtered the municipal water. (The single well owner who did not filter used purchased water and avoided drinking the well water).
4. Discussion
Perceptions about drinking water quality are rather complex. According to deFranca Doria, most people are influenced to believe their water is safe to drink based on organoleptic properties (mostly taste/smell) and risk perceptions. These risks might include perceived contamination of water by chemicals, past health problems, and trust of the water supplier or system [45]. The majority of the surveyed participants in this study did not have confidence in the quality of their drinking water with many reporting changes in smell and appearance. Those relying on non-well water reported higher distrust of their water sources than those relying on well water. Although most reported to be overall in good health, there was a much higher perception of their negative health outcomes than recorded by their healthcare providers. We can speculate that several factors contribute to these perceptions, the most prominent ones are the lack of trust in the UD industry, secret ingredients in the chemicals used, and living near an industrial process that harms some people in the communities where they operate.
The findings of our study show that as distance increases from Wells 11, 12, 13, and 14, so does the risk of exceedances. These wells are in fairly close proximity and located in the northwestern area of the study, away from the interstate and main urban area.
Further, the results of the Fisher Exact Tests provide evidence that those residents relying on municipal water or purchased water for drinking or cooking were surprisingly more distrustful than those relying on well water. The reasons for this are unknown, and the exceedances described suggest that this trust may be misguided.
Proportional differences between self-reported versus physician-confirmed diagnosis are statistically significant at the a = 0.05 level for all health issues except for diabetes and obesity. Why respondents reported much higher undiagnosed health issues is unknown. In the case of cancer, 22% of the respondents stated the presence of this disease without provider diagnosis. It is possible that this result is associated with skin cancers, which are quite prevalent in South Texas [46].
While this study provides data regarding water quality, it cannot link these findings directly to fracking activities. Perceptions of water quality; however, may be influenced by fracking activities. As an example, one respondent stated the following: “city has problems with pipes, sewer pipes, afraid they leak. Also, fracking, heard waste going into river. Maybe that’s causing cancer.” Another respondent stated the following: “since fracking started, some of that stuff getting into my water. Earthquakes, casing breaks. Just don’t know. we can live without oil, but we can’t live without drinking water.” These statements likely reflect the influence of fracking on these two respondents’ perspectives.
Another limitation of this study is that the sample size is small. While the survey provides sufficient data for inferential analysis, the small number of wells sampled limits the power of this study. Further, the voluntary nature of the study may result in biased responses that do not reflect the entirety of the population. No other studies are available for evaluating the effects of this potential bias.
Residents of the region have complaints about their water quality. Due to the non-response bias and small sample size, it is impossible to conclude that there is a relationship between fracking, water quality, or their perceptions. Perhaps, living near oil and gas alone affects the residents’ perceptions of water quality, even without specific evidence that water quality has actually been affected. Perhaps, this fact alone might affect the well-being of residents. While we detail the water quality by well and have evidence of exceedances, these cannot be correlated to fracking or to health.
The lack of trust by residents is most likely derived from the poor reputation that the UD industry developed in relation to their environmental stewardship, which leads to blaming the industry for negative health and environmental outcomes [15]. Another reason for distrust may be a result of the 2005 Energy Policy Act (i.e., the Halliburton loophole), which allows UD companies to keep their chemicals as a proprietary and undisclosed mix, keeping the public in the dark about what products are being used near their communities [47,48]. This lack of information also creates knowledge gaps for healthcare providers who are unable to test for sensitivities or exposure to harmful chemicals if they do not know what they are looking for, possibly missing a diagnosis. This lack of transparency and knowledge can lead to increased fear.
Roughly 17 million Americans live within one mile of an active oil and/or gas well and are exposed to pollution related to fracking [49,50]. There have been reports of residents in heavy UD areas developing health problems caused by industrial activities related to UD [10,11,51,52,53,54,55,56,57,58] heightening the perception and awareness of these outcomes in their community. Mental health disturbances were self-reported at 29% vs. only 8% diagnosed, which could be due to the lack of access or stigma related to seeking mental health care. It is incredibly challenging to test health outcomes that may be a result of exposure because of lifestyle, genetics, access to care, and the lack of funding for longitudinal studies, since some of the health issues might only develop after repeated exposure [59].
Author Contributions
Conceptualization, investigation, formal analysis, writing-reviewing and editing P.S.G., Z.L.H., C.M., S.H., M.M., D.C.J., I.C.S., K.A.S. Methodology, formal analysis, writing-original draft preparation: L.F.
Funding
This research received no external funding.
Acknowledgments
This research was partially supported by donations from concerned mineral rights owners to the Collaborative Laboratories for Environmental Analysis and Remediation at the University of Texas at Arlington. These efforts were supported by charitable donations by the Earth Day Texas organization. The project described was also supported by the National Center for Advancing Translational Sciences, National Institutes of Health, through the Institute for Integration of Medicine & Science/Clinical and Translational Science Award (IIMS/CTSA) UL1 TR001120. The content is solely the responsibility of the authors and does not necessarily represent the official views of the NIH. The authors would also like to thank the community members of the Translational Advisory Board in Frio County, faculty mentors at UTHealth and the South Texas AHEC for their support.
Conflicts of Interest
The authors declare no conflict of interest.
Appendix A
Table A1.
Drinking Water Use and Perception.
References
- Bol, G.; Grant, H.; Keller, S.; Marcassa, F.; De Rozieres, J. Putting a stop to gas channeling. Oilfield Rev. 1991, 3, 35–43. [Google Scholar]
- Darrah, T.H.; Jackson, R.B.; Vengosh, A.; Warner, N.R.; Poreda, R.J. Noble gases: A new technique for fugitive gas investigation in groundwater. Ground Water 2015, 53, 23–28. [Google Scholar] [PubMed]
- Ingraffea, A.R.; Wells, M.T.; Santoro, R.L.; Shonkoff, S.B.C. Assessment and risk analysis of casing and cement impairment in oil and gas wells in Pennsylvania, 2000–2012. Proc. Natl. Acad. Sci. USA 2014, 111, 10955–10960. [Google Scholar] [CrossRef] [PubMed]
- Darrah, T.H.; Vengosh, A.; Jackson, R.B.; Warner, N.R.; Poreda, R.J. Noble gases identify the mechanisms of fugitive gas contamination in drinking-water wells overlying the Marcellus and Barnett Shales. Proc. Natl. Acad. Sci. USA 2014, 111, 14076–14081. [Google Scholar] [CrossRef]
- Osborn, S.G.; Vengosh, A.; Warner, N.R.; Jackson, R.B. Methane contamination of drinking water accompanying gas-well drilling and hydraulic fracturing. Proc. Natl. Acad. Sci. USA 2011, 108, 8172–8176. [Google Scholar] [CrossRef] [PubMed]
- Sherwood, O.A.; Rogers, J.D.; Lackey, G.; Burke, T.L.; Osborn, S.G.; Ryan, J.N. Groundwater methane in relation to oil and gas development and shallow coal seams in the Denver-Julesburg Basin of Colorado. Proc. Natl. Acad. Sci. USA 2016, 113, 8391–8396. [Google Scholar] [CrossRef]
- Fontenot, B.E.; Hunt, L.R.; Hildenbrand, Z.L.; Carlton, D.D., Jr.; Oka, H.; Walton, J.L.; Hopkins, D.; Osorio, A.; Bjorndal, B.; Hu, Q.H.; et al. An Evaluation of Water Quality in Private Drinking Water Wells Near Natural Gas Extraction Sites in the Barnett Shale Formation. Environ. Sci. Technol. 2013, 47, 10032–10040. [Google Scholar] [CrossRef] [PubMed]
- Burton, T.G.; Rifai, H.S.; Hildenbrand, Z.L.; Carlton, D.D.; Fontenot, B.E.; Schug, K.A. Elucidating hydraulic fracturing impacts on groundwater quality using a regional geospatial statistical modeling approach. Sci. Total Environ. 2016, 545, 114–126. [Google Scholar] [CrossRef]
- Drollette, B.D.; Hoelzer, K.; Warner, N.R.; Darrah, T.H.; Karatum, O.; O’Connor, M.P.; Nelson, R.K.; Fernandez, L.A.; Reddy, C.M.; Vengosh, A.; et al. Elevated levels of diesel range organic compounds in groundwater near Marcellus gas operations are derived from surface activities. Proc. Natl. Acad. Sci. USA 2015, 112, 13184–13189. [Google Scholar] [CrossRef]
- Hildenbrand, Z.L.; Carlton, D.D., Jr.; Fontenot, B.E.; Meik, J.M.; Walton, J.L.; Taylor, J.T.; Thacker, J.B.; Korlie, S.; Shelor, C.P.; Henderson, D.; et al. A comprehensive analysis of groundwater quality in the barnett shale region. Environ. Sci. Technol. 2015, 49, 8254–8262. [Google Scholar] [CrossRef]
- Hildenbrand, Z.L.; Mach, P.M.; McBride, E.M.; Dorreyatim, M.N.; Taylor, J.T.; Carlton, D.D.; Meik, J.M.; Fontenot, B.E.; Wright, K.C.; Schug, K.A.; et al. Point source attribution of ambient contamination events near unconventional oil and gas development. Sci. Total Environ. 2016, 573, 382–388. [Google Scholar] [CrossRef] [PubMed]
- Llewellyn, G.T.; Dorman, F.; Westland, J.L.; Yoxtheimer, D.; Grieve, P.; Sowers, T.; Humston-Fulmer, E.; Brantley, S.L. Evaluating a groundwater supply contamination incident attributed to Marcellus Shale gas development. Proc. Natl. Acad. Sci. USA 2015, 112, 6325–6330. [Google Scholar] [CrossRef] [PubMed]
- Warner, N.R.; Christie, C.A.; Jackson, R.B.; Vengosh, A. Impacts of Shale Gas Wastewater Disposal on Water Quality in Western Pennsylvania. Environ. Sci. Technol. 2013, 47, 11849–11857. [Google Scholar] [CrossRef] [PubMed]
- Lauer, N.E.; Harkness, J.S.; Vengosh, A. Brine Spills Associated with Unconventional Oil Development in North Dakota. Environ. Sci. Technol. 2016, 50, 5389–5397. [Google Scholar] [CrossRef] [PubMed]
- Habib, S.; Hinojosa, M.S. Representation of fracking in mainstream American newspapers. Environ. Pract. 2016, 18, 83–93. [Google Scholar] [CrossRef]
- Williams, L.; Macnaghten, P.; Davies, R.; Curtis, S. Framing ‘fracking’: Exploring public perceptions of hydraulic fracturing in the United Kingdom. Public Underst. Sci. 2017, 26, 89–104. [Google Scholar] [CrossRef] [PubMed]
- Hopke, J.E.; Simis, M. Discourse over a contested technology on twitter: A case study of hydraulic fracturing. Public Underst. Sci. 2017, 26, 105–120. [Google Scholar] [CrossRef]
- Vasi, I.B.; Walker, E.T.; Johnson, J.S.; Tan, H.F. “No fracking way!” documentary film, discursive opportunity, and local opposition against hydraulic fracturing in the united states, 2010 to 2013. Am. Sociol. Rev. 2015, 80, 934–959. [Google Scholar] [CrossRef]
- Sangaramoorthy, T.; Jamison, A.M.; Boyle, M.D.; Payne-Sturges, D.C.; Sapkota, A.; Milton, D.K.; Wilson, S.M. Place-based perceptions of the impacts of fracking along the Marcellus Shale. Soc. Sci. Med. 2016, 151, 27–37. [Google Scholar] [CrossRef]
- Choma, B.L.; Hanoch, Y.; Currie, S. Attitudes toward hydraulic fracturing: The opposing forces of political conservatism and basic knowledge about fracking. Glob. Environ. Chang. 2016, 38, 108–117. [Google Scholar] [CrossRef]
- Railroad Commission of Texas Eagle Ford Shale Information. Available online: https://www.rrc.state.tx.us/oil-gas/major-oil-and-gas-formations/eagle-ford-shale-information/ (accessed on 21 May 2019).
- United States Census Quick Facts Pearsall City, Texas; Frio County, Texas. Available online: https://www.census.gov/quickfacts/fact/table/pearsallcitytexas,friocountytexas,US/PST045218 (accessed on 21 May 2019).
- Texas Drilling.com Oil Wells and Production in Frio County, TX. Available online: http://www.texas-drilling.com/frio-county (accessed on 21 May 2019).
- Hildenbrand, Z.L.; Carlton, D.D.; Meik, J.M.; Taylor, J.T.; Fontenot, B.E.; Walton, J.L.; Henderson, D.; Thacker, J.B.; Korlie, S.; Whyte, C.J.; et al. A reconnaissance analysis of groundwater quality in the Eagle Ford shale region reveals two distinct bromide/chloride populations. Sci. Total Environ. 2017, 575, 672–680. [Google Scholar] [CrossRef]
- Nicot, J.; Larson, T.; Darvari, R.; Mickler, P.; Uhlman, K.; Costley, R. Controls on Methane Occurrences in Aquifers Overlying the Eagle Ford Shale Play, South Texas. Ground Water 2017, 55, 455–468. [Google Scholar] [CrossRef]
- Scanlon, B.R.; Reedy, R.C.; Nicot, J.-P. Response to Comment on “Comparison of Water Use for Hydraulic Fracturing for Unconventional Oil and Gas versus Conventional Oil”. Environ. Sci. Technol. 2015, 49, 6360–6361. [Google Scholar] [CrossRef]
- McMahon, P.B.; Barlow, J.R.; Engle, M.A.; Belitz, K.; Ging, P.B.; Hunt, A.G.; Jurgens, B.C.; Kharaka, Y.K.; Tollett, R.W.; Kresse, T.M. Methane and Benzene in Drinking-Water Wells Overlying the Eagle Ford, Fayetteville, and Haynesville Shale Hydrocarbon Production Areas. Environ. Sci. Technol. 2017, 51, 6727–6734. [Google Scholar] [CrossRef]
- Santos, I.C.; Martin, M.S.; Reyes, M.L.; Carlton, D.D.; Stigler-Granados, P.; Valerio, M.A.; Whitworth, K.W.; Hildenbrand, Z.L.; Schug, K.A. Exploring the links between groundwater quality and bacterial communities near oil and gas extraction activities. Sci. Total Environ. 2018, 618, 165–173. [Google Scholar] [CrossRef]
- Hildenbrand, Z.L.; Carlton, D.D.; Fontenot, B.E.; Meik, J.M.; Walton, J.L.; Thacker, J.B.; Korlie, S.; Shelor, C.P.; Kadjo, A.F.; Clark, A.; et al. Temporal variation in groundwater quality in the Permian Basin of Texas, a region of increasing unconventional oil and gas development. Sci. Total Environ. 2016, 562, 906–913. [Google Scholar] [CrossRef]
- Molofsky, L.J.; Richardson, S.D.; Gorody, A.W.; Baldassare, F.; Black, J.A.; McHugh, T.E.; Connor, J.A. Effect of Different Sampling Methodologies on Measured Methane Concentrations in Groundwater Samples. Ground Water 2016, 54, 669–680. [Google Scholar] [CrossRef]
- Waxman, H.A.; Markey, E.J.; DeGette, D. Chemicals Used in Hydraulic Fracturing; United States House of Representatives Committee on Energy and Commerce Minority Staff: Washington, DC, USA, 2011. [Google Scholar]
- Thacker, J.B.; Carlton, D.D.; Hildenbrand, Z.L.; Kadjo, A.F.; Schug, K.A. Chemical Analysis of Wastewater from Unconventional Drilling Operations. Water 2015, 7, 1568–1579. [Google Scholar] [CrossRef]
- US Environmental Protections Agency. 2018 Edition of the Drinking Water Standards and Health Advisories; US Environmental Protections Agency: Washington, DC, USA, 2018.
- R Development Core Team. R: A Language and Environment for Statistical Computing; R Foundation for Statistical Computing: Vienna, Austria, 2013. [Google Scholar]
- Asthma Facts and Figures. Asthma and Allergy Foundation of America. Available online: https://www.aafa.org/asthma-facts/ (accessed on 9 July 2019).
- Lim, H.; Collins, S.A.B.; Resneck, J.S., Jr.; Bolognia, J.L.; Hodge, J.A.; Rohrer, T.A.; Van Beek, M.J.; Margolis, D.J.; Sober, A.J.; Weinstock, M.A.; et al. The burden of skin disease in the United States. J. Am. Acad. Dermatol. 2017, 76, 958–972. [Google Scholar] [CrossRef]
- NIH National Cancer Institute. Available online: https://www.cancer.gov/about-cancer/understanding/statistics (accessed on 9 July 2019).
- Eke, P.I.; Dye, B.A.; Wei, L.; Thornton-Evans, G.O.; Genco, R.J. Prevalence of Periodontitis in Adults in the United States: 2009 and 2010. J. Dent. Res. 2012, 91, 914–920. [Google Scholar] [CrossRef]
- Fryar, C.D.; Ostchega, Y.; Hales, C.M.; Zhang, G.; Kruszon-Moran, D. Hypertension Prevalence and Control among Adults: United States, 2015–2016. 2017. Available online: https://www.cdc.gov/nchs/products/databriefs/db289.htm (accessed on 9 July 2019).
- National Center for Health Statistics Heart Disease. Available online: https://www.cdc.gov/nchs/fastats/heart-disease.htm (accessed on 9 July 2019).
- American Diabetes Association Statistics about Diabetes. Available online: http://www.diabetes.org/diabetes-basics/statistics/ (accessed on 9 July 2019).
- 2016 Statistics Disability Annual Report. Available online: https://disabilitycompendium.org/sites/default/files/user-uploads/2016_AnnualReport.pdf (accessed on 9 July 2019).
- Center for Disease Control and Prevention Adult Obesity Facts. Available online: https://www.cdc.gov/obesity/data/adult.html (accessed on 9 July 2019).
- Hudak, P. Solute distribution in the Ogallala Aquifer, Texas: Lithium, fluoride, nitrate, chloride and bromide. Carbonates Evaporites 2016, 31, 437–448. [Google Scholar] [CrossRef]
- De França Doria, M. Factors influencing public perception of drinking water quality. Water Policy 2010, 12, 1–19. [Google Scholar] [CrossRef]
- 2018 Cancer Fact Sheet-Texas, Texas Department of Health and Human Services. Available online: https://www.dshs.state.tx.us/tcccp/pdf/2018-Cancer-Factsheet.pdf (accessed on 9 July 2019).
- McFeeley, M. State Hydraulic Fracturing Disclosure Rules and Enforcement: A Comparison; Natural Resources Defense Council: Washington, DC, USA, 2012. [Google Scholar]
- Elliott, E.G.; Ettinger, A.S.; Leaderer, B.P.; Bracken, M.B.; Deziel, N.C. A systematic evaluation of chemicals in hydraulic-fracturing fluids and wastewater for reproductive and developmental toxicity. J. Expo. Sci. Environ. Epidemiol. 2017, 27, 90–99. [Google Scholar] [CrossRef]
- US Environmental Protection Agency. Hydraulic Fracturing for Oil and Gas: Impacts from the Hydraulic Fracturing Water Cycle on Drinking Water Resources in the United States (Final Report); US Environmental Protection Agency: Washington, DC, USA, 2016.
- US Environmental Protection Agency. Underground Injection Control (UIC); US Environmental Protection Agency: Washington, DC, USA, 2017.
- Epstein, A.C. Health and environment risks from oil and gas development. In Hydraulic Fracturing Impacts and Technologies; CRC Press: Boca Raton, FL, USA, 2015; pp. 122–135. [Google Scholar]
- Field, R.; Soltis, J.; Murphy, S. Air quality concerns of unconventional oil and natural gas production. Environ. Sci. Process. Impacts 2014, 16, 954–969. [Google Scholar] [CrossRef]
- Finkel, M. Shale gas development and cancer incidence in southwest Pennsylvania. Public Health 2016, 141, 198–206. [Google Scholar] [CrossRef]
- Helmig, D.; Thompson, C.R.; Evans, J.; Boylan, P.; Hueber, J.; Park, J.-H. Highly Elevated Atmospheric Levels of Volatile Organic Compounds in the Uintah Basin, Utah. Environ. Sci. Technol. 2014, 48, 4707–4715. [Google Scholar] [CrossRef]
- McKenzie, L.M.; Witter, R.Z.; Newman, L.S.; Adgate, J.L. Human health risk assessment of air emissions from development of unconventional natural gas resources. Sci. Total Environ. 2012, 424, 79–87. [Google Scholar] [CrossRef]
- Moore, C.W.; Zielinska, B.; Pétron, G.; Jackson, R.B. Air Impacts of Increased Natural Gas Acquisition, Processing, and Use: A Critical Review. Environ. Sci. Technol. 2014, 48, 8349–8359. [Google Scholar] [CrossRef]
- Payne, B.F., Jr.; Ackley, R.; Wicker, A.P.; Hildenbrand, Z.L.; Carlton, D.D., Jr.; Schug, K.A. Characterization of methane plumes downwind of natural gas compressor stations in Pennsylvania and New York. Sci. Total Environ. 2017, 580, 1214–1221. [Google Scholar] [CrossRef]
- Werner, A.K.; Vink, S.; Watt, K.; Jagals, P. Environmental health impacts of unconventional natural gas development: A review of the current strength of evidence. Sci. Total Environ. 2015, 505, 1127–1141. [Google Scholar] [CrossRef]
- Vera, L. Community health impacts from oil and gas development in Texas: The perspective of Sharon Wilson. New Solut. 2016, 26, 496–507. [Google Scholar] [CrossRef]


© 2019 by the authors. Licensee MDPI, Basel, Switzerland. This article is an open access article distributed under the terms and conditions of the Creative Commons Attribution (CC BY) license (http://creativecommons.org/licenses/by/4.0/).