LUCC and Ecosystem Service Value Assessment for Wetlands: A Case Study in Nansi Lake, China


Abstract

1. Introduction
2. Materials and Methods
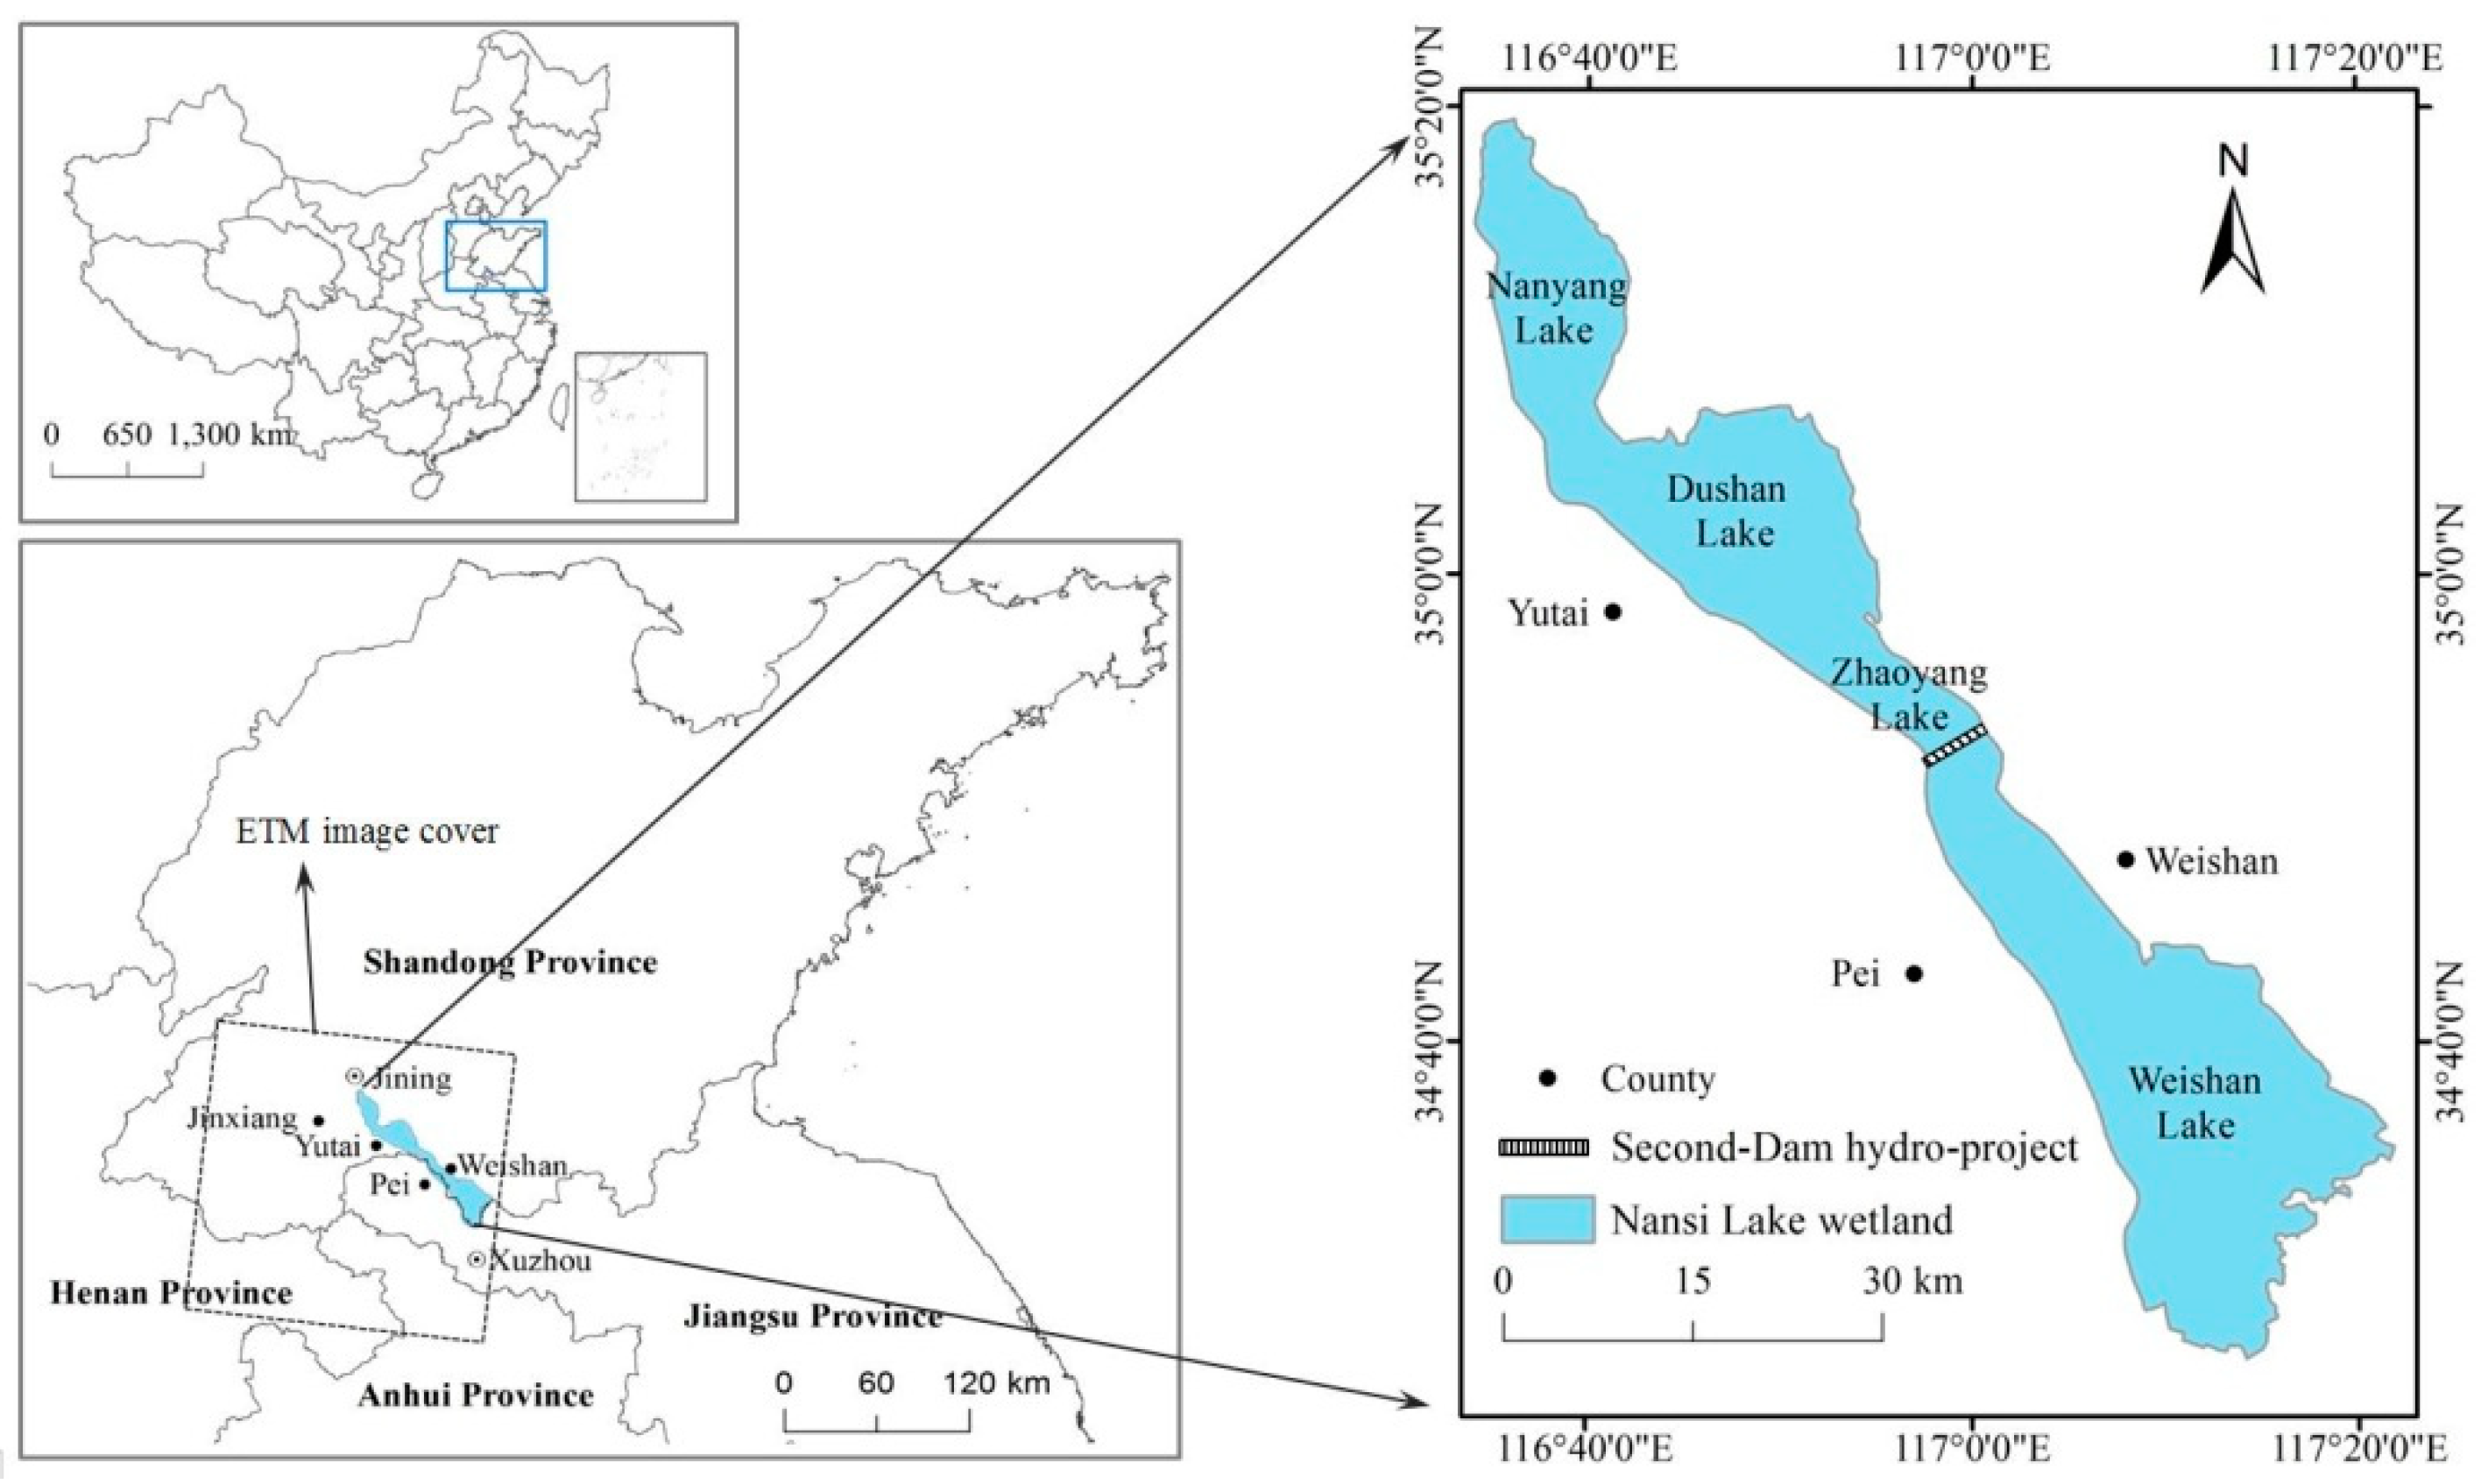
2.1. Study Area
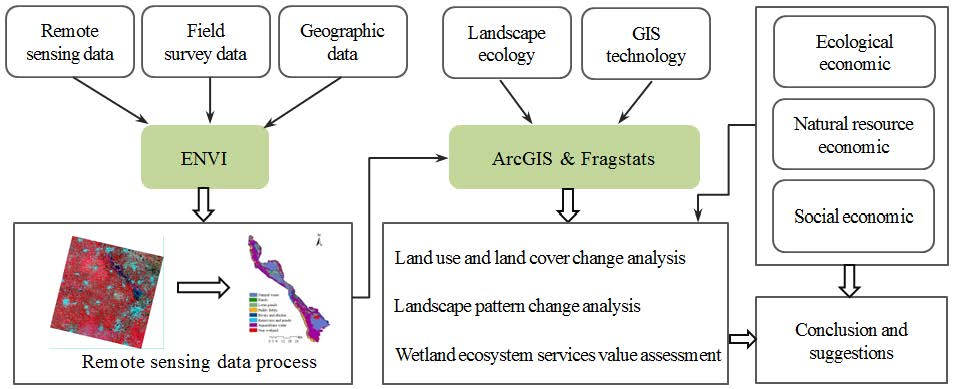
2.2. Data Sources and Processing
2.3. Research Methods
2.3.1. Classification of Land Use Types
2.3.2. Analysis of Landscape Pattern Change
2.3.3. Assessment of the ESV
3. Results
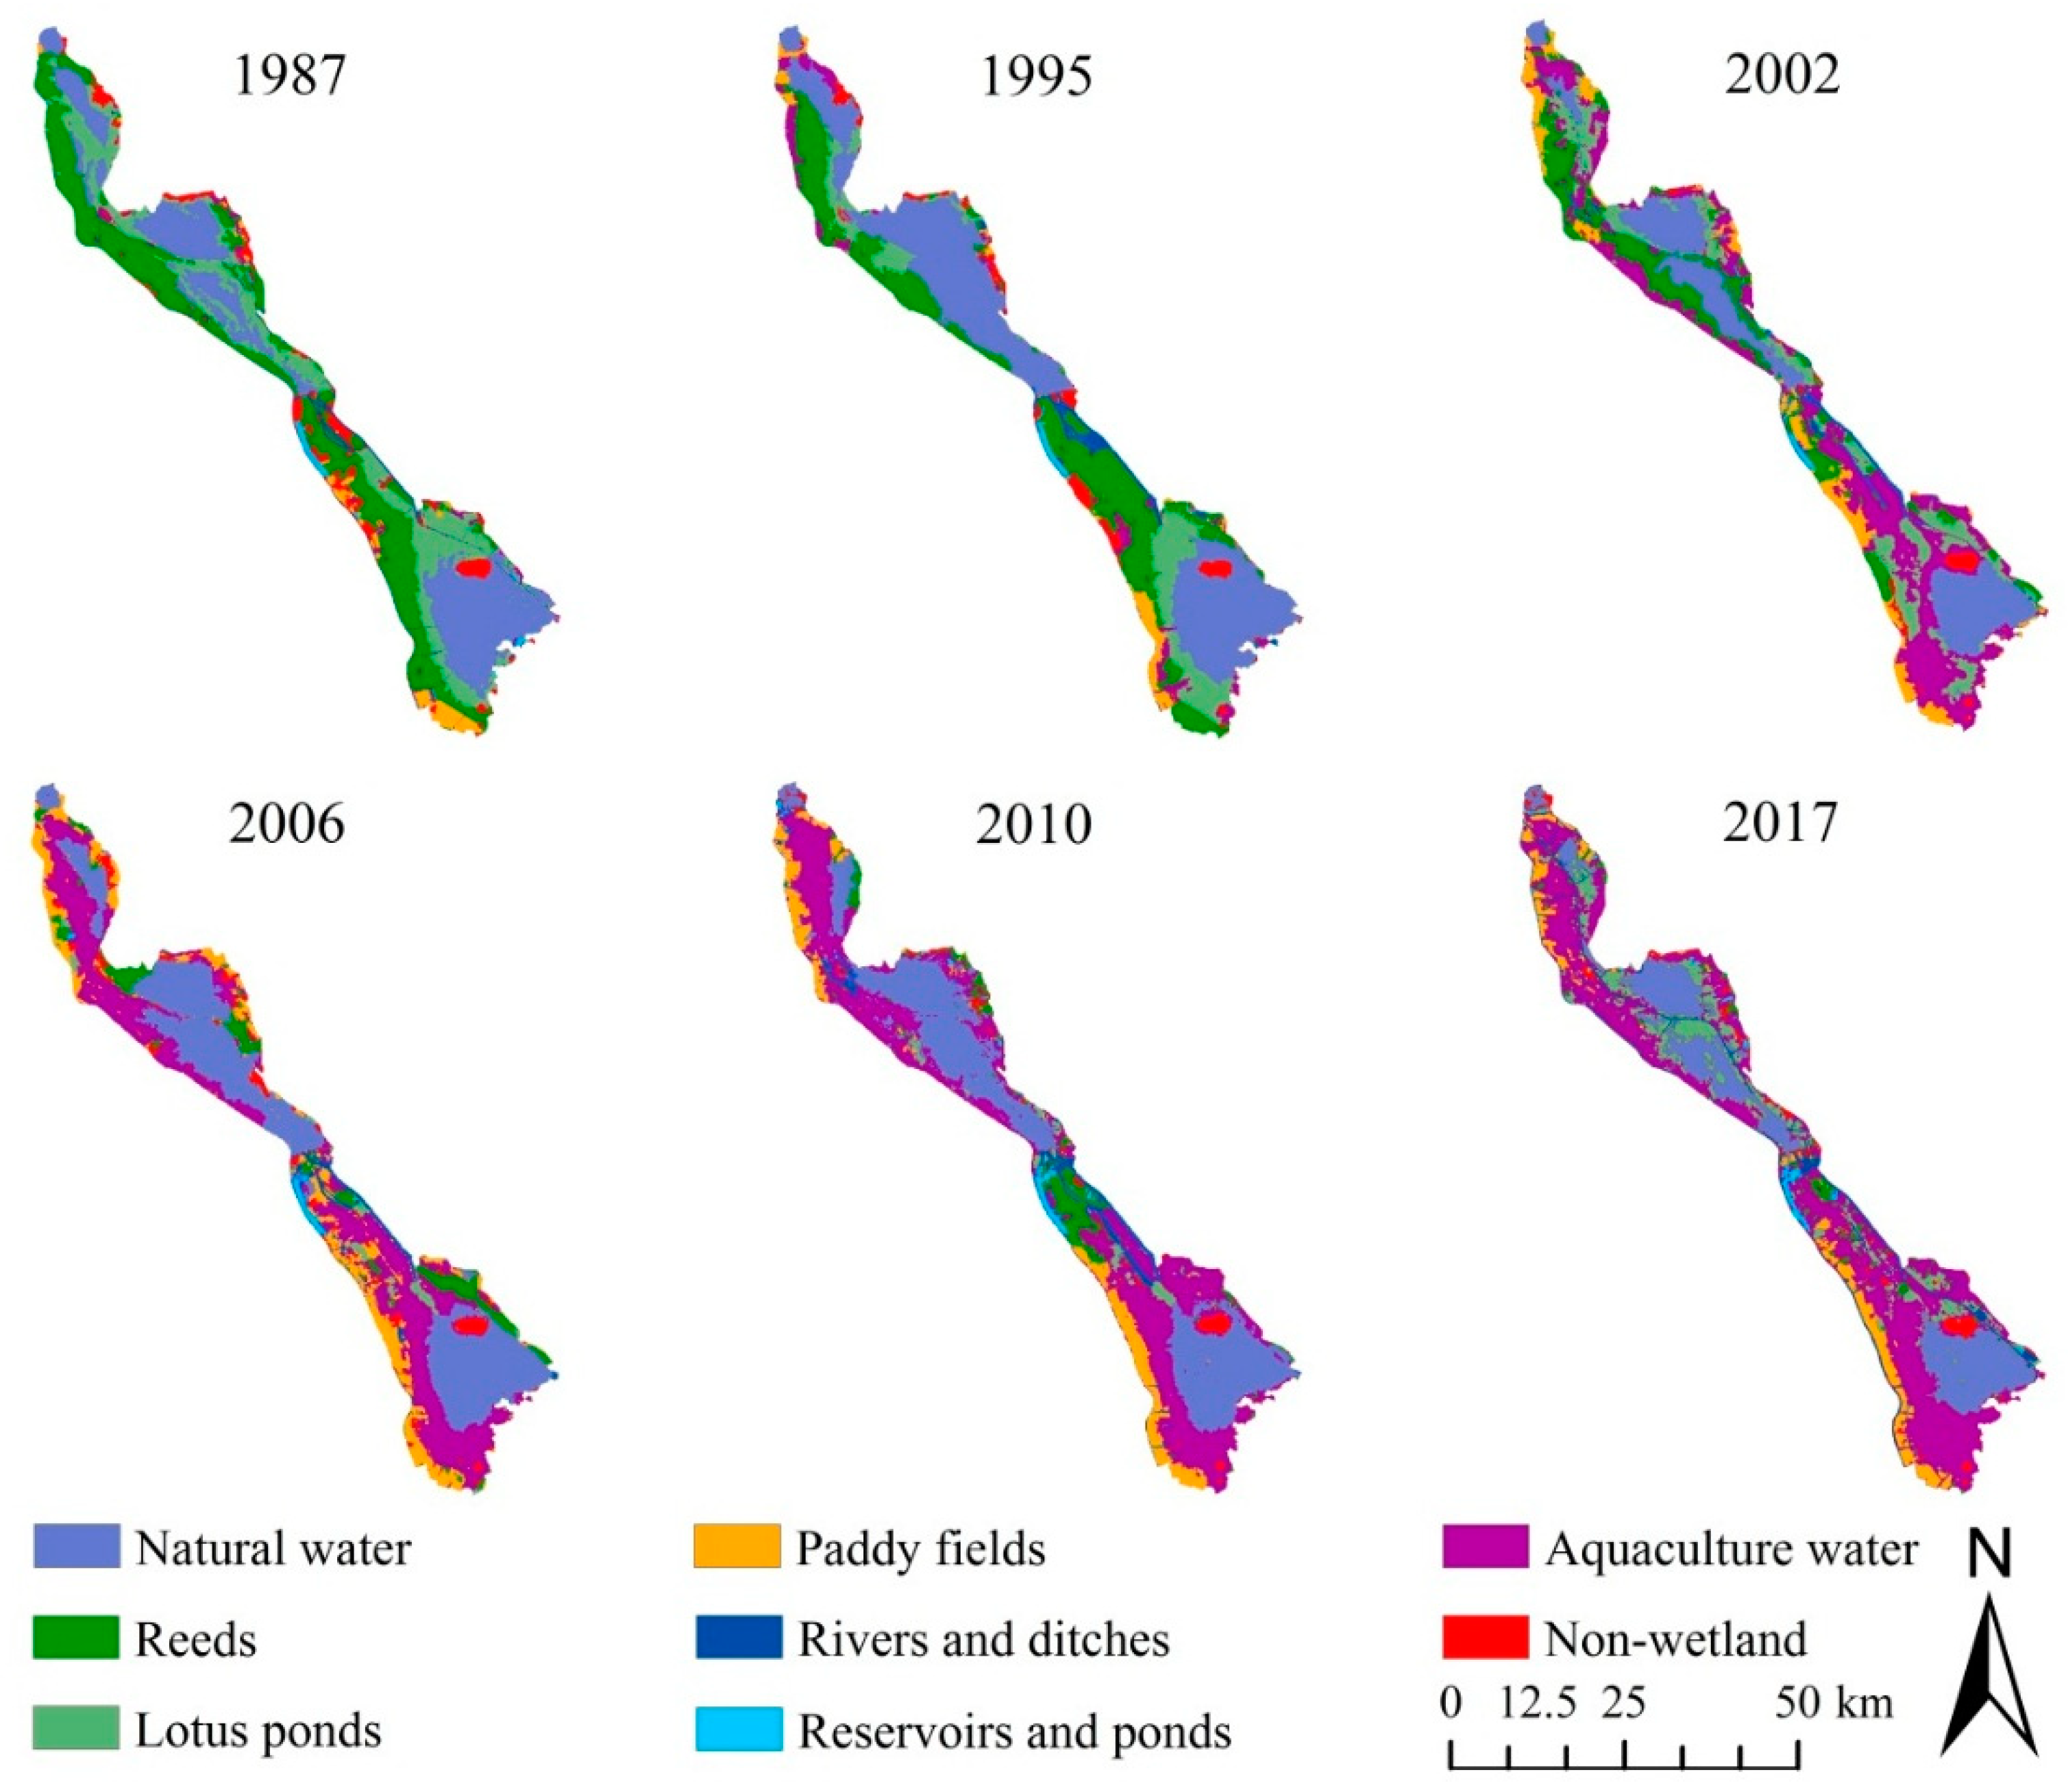
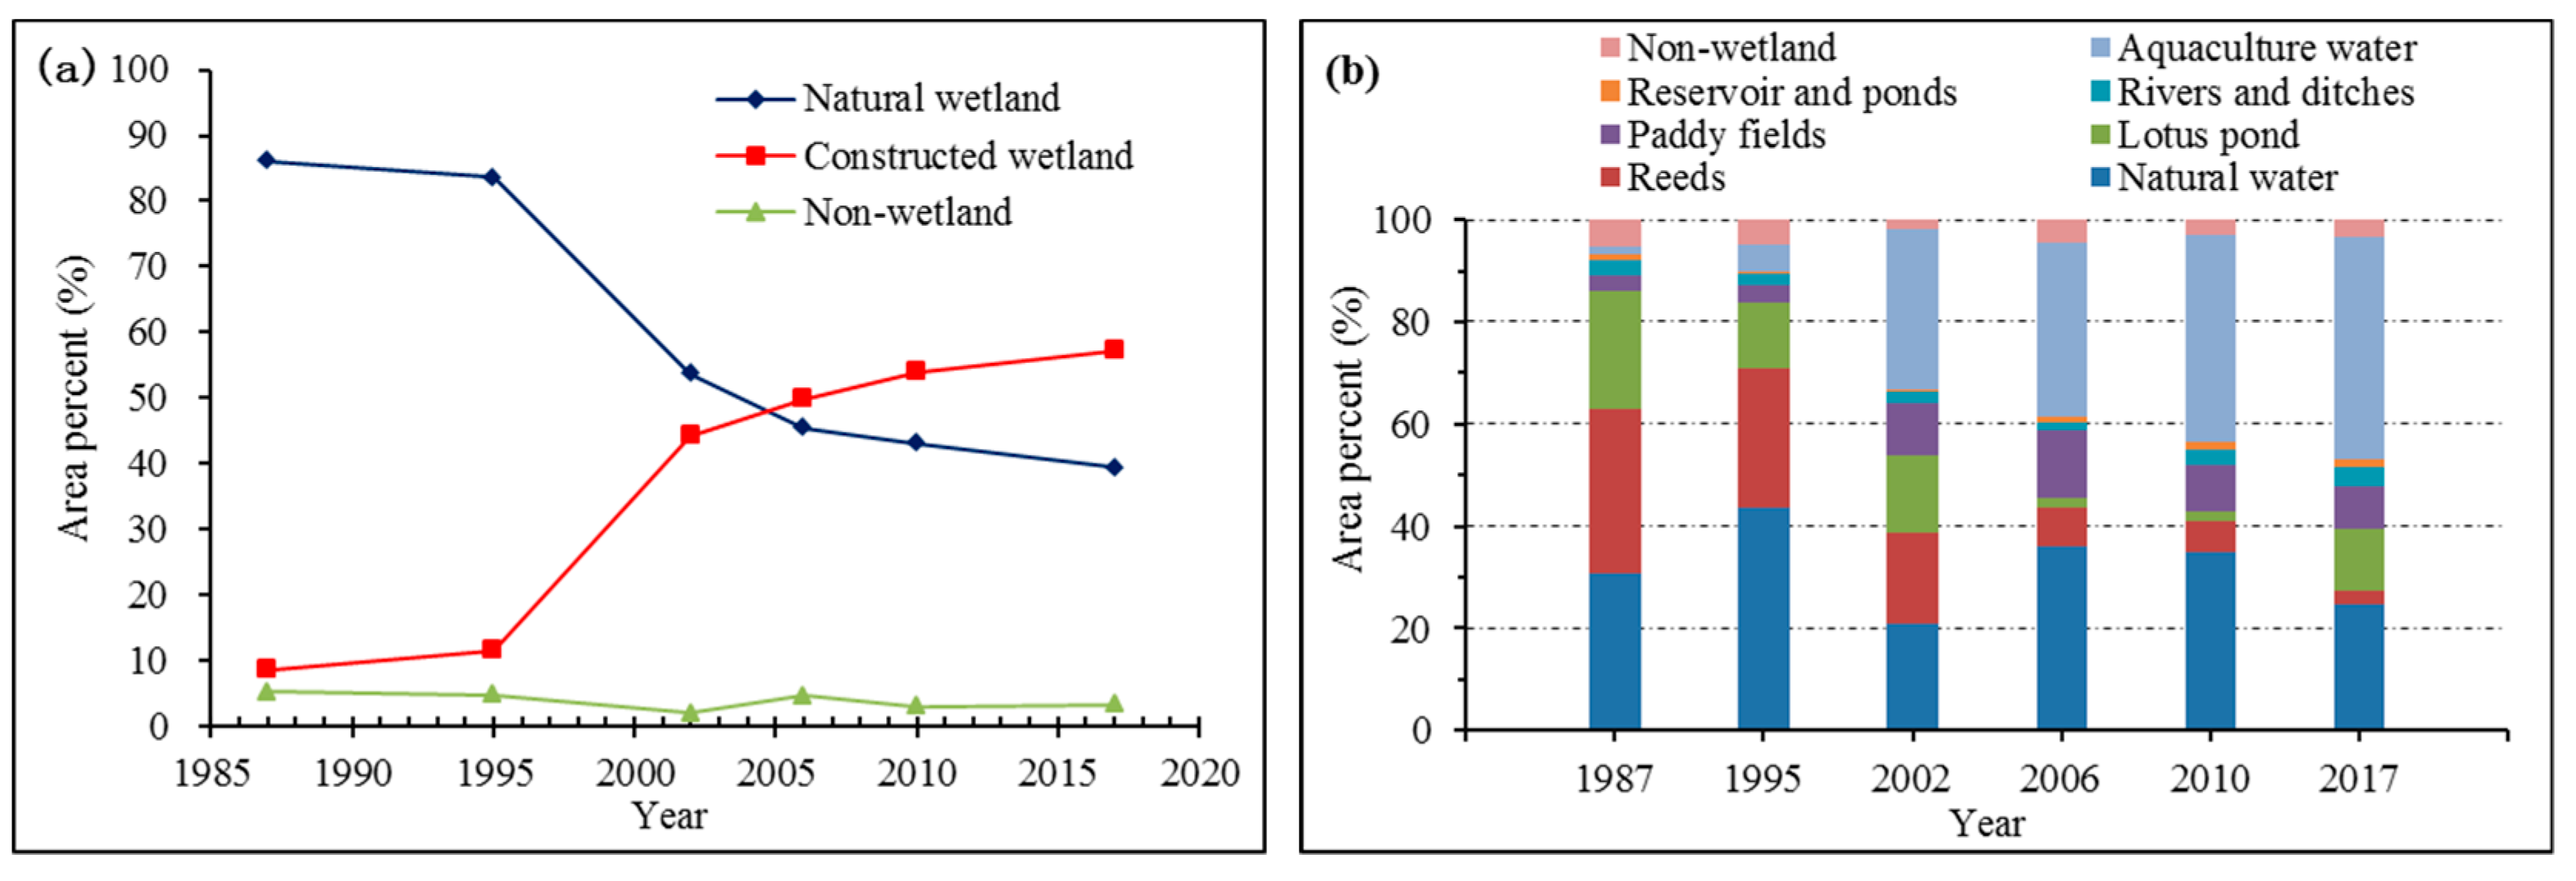
3.1. LUCC and Landscape Pattern Change in Nansi Lake Wetland
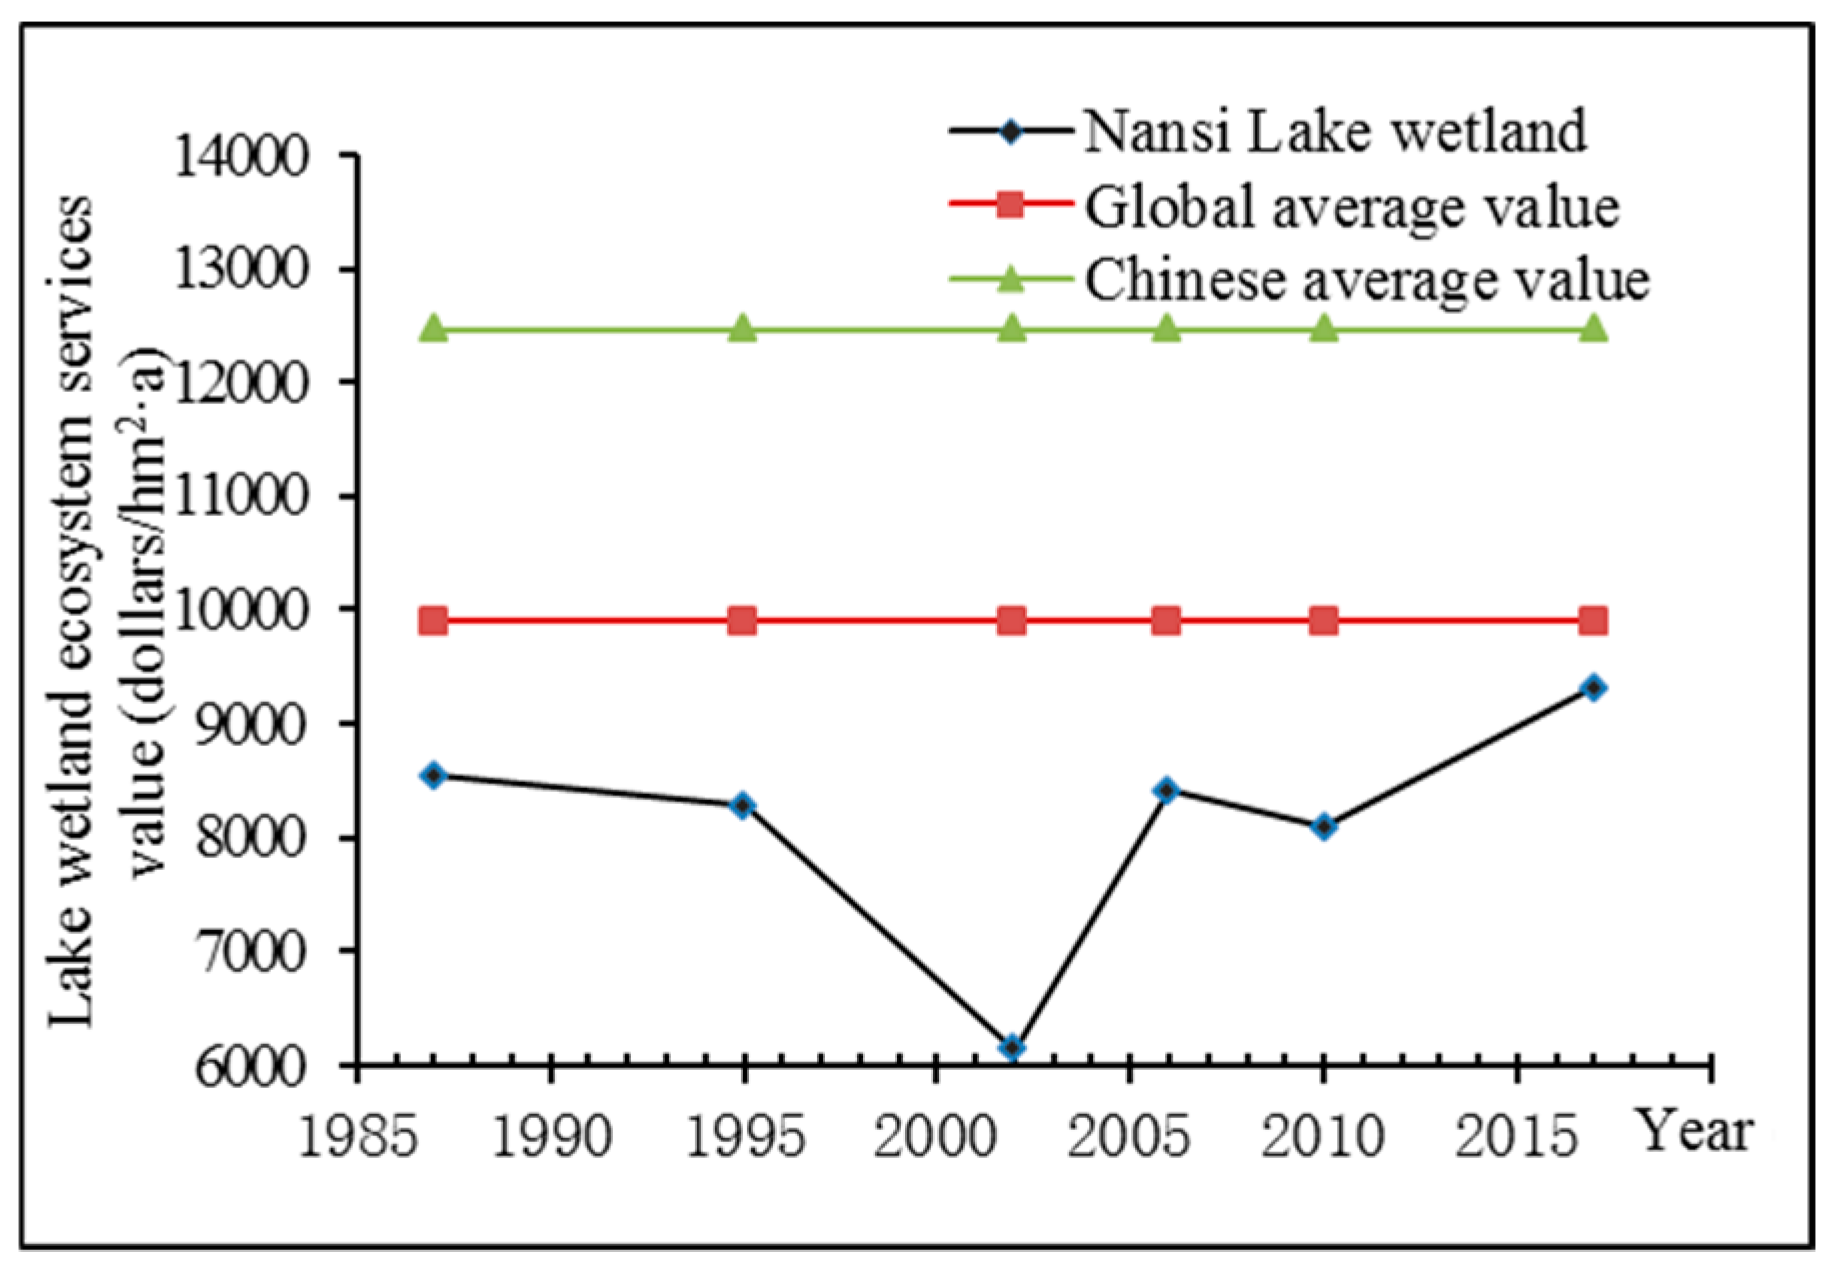
3.2. The ESV in Nansi Lake Wetland
4. Discussion
4.1. Factors Driving LUCC and Landscape Pattern Change
4.2. Impact of Landscape Change on the ESV
4.3. Implications for Wetland Protection and Management
5. Conclusions
Supplementary Materials
Author Contributions
Funding
Conflicts of Interest
References
- Assessment, M.E. Millennium Ecosystem Assessment: Ecosystems and Human Well-Being: Wetlands and Water Synthesis; Island Press: Washington, DC, USA, 2005. [Google Scholar]
- Li, T.; Gao, X. Ecosystem Services Valuation of Lakeside Wetland Park beside Chaohu Lake in China. Water 2016, 8, 301. [Google Scholar] [CrossRef]
- Odgaard, M.V.; Turner, K.G.; Bocher, P.K.; Svenning, J.C.; Dalgaard, T. A multi-criteria, ecosystem-service value method used to assess catchment suitability for potential wetland reconstruction in Denmark. Ecol. Indic. 2017, 77, 151–165. [Google Scholar] [CrossRef]
- Zhang, D.Q.; Gersberg, R.M.; Tansoon, K. Constructed wetlands in China. Ecol. Eng. 2009, 35, 1367–1378. [Google Scholar] [CrossRef]
- Yu, K.; Hu, C.M. Changes in vegetative coverage of the Hongze Lake national wetland nature reserve: A decade-long assessment using MODIS medium-resolution data. J. Appl. Remote Sens. 2013, 7, 3589. [Google Scholar] [CrossRef]
- McInnes, R.J.; Everard, M. Rapid Assessment of Wetland Ecosystem Services (RAWES): An example from Colombo, Sri Lanka. Ecosyst. Serv. 2017, 25, 89–105. [Google Scholar] [CrossRef]
- Leon, A.S.; Tang, Y.; Chen, D.; Yolcu, A.; Glennie, C.; Pennings, S.C. Dynamic Management of Water Storage for Flood Control in a Wetland System: A Case Study in Texas. Water 2018, 10, 325. [Google Scholar] [CrossRef]
- Maltby, E.; Acreman, M.C. Ecosystem services of wetlands: Pathfinder for a new paradigm. Hydrol. Sci. J. 2011, 56, 1341–1359. [Google Scholar] [CrossRef]
- Russi, D.; Ten Brink, P.; Farmer, A.; Badura, T.; Coates, D.; Förster, J.; Kumar, R.; Davidson, N. The Economics of Ecosystems and Biodiversity for Water and Wetlands; IEEP: London, UK; Brussels, Belgium, 2013. [Google Scholar]
- Vitousek, P.M.; Mooney, H.A.; Lubchenco, J.; Melillo, J.M. Human Domination of Earth’s Ecosystems. In Urban Ecology: An International Perspective on the Interaction Between Humans and Nature; Marzluff, J.M., Shulenberger, E., Endlicher, W., Alberti, M., Bradley, G., Ryan, C., Simon, U., ZumBrunnen, C., Eds.; Springer US: Boston, MA, USA, 2008; pp. 3–13. [Google Scholar] [CrossRef]
- Bennett, E.M.; Peterson, G.D.; Levitt, E.A. Looking to the future of ecosystem services. Ecosystems 2005, 8, 125–132. [Google Scholar] [CrossRef]
- Imteaz, M.; Uddameri, V.; Ahsan, A. Numerical model for the transport and degradation of pollutants through wetlands. Int. J. Water 2016, 10, 1–12. [Google Scholar] [CrossRef]
- Jiang, W. Ecosystem services research in China: A critical review. Ecosyst. Serv. 2017, 26, 10–16. [Google Scholar] [CrossRef]
- Gong, N.; Niu, Z.; Wei, Q.; Zhang, H. Driving forces of wetland change in China. J. Remote Sens. 2016, 20, 172–183. [Google Scholar]
- Ignar, S.; Grygoruk, M. Wetlands and Water Framework Directive: Protection, Management and Climate Change. In Wetlands and Water Framework Directive: Protection, Management and Climate Change; Ignar, S., Grygoruk, M., Eds.; Springer International Publishing: Cham, Switzerland, 2015; pp. 1–7. [Google Scholar] [CrossRef]
- Kaczorowska, A.; Kain, J.-H.; Kronenberg, J.; Haase, D. Ecosystem services in urban land use planning: Integration challenges in complex urban settings—Case of Stockholm. Ecosyst. Serv. 2016, 22, 204–212. [Google Scholar] [CrossRef]
- Westman, W.E. How Much Are Nature’s Services Worth? Science 1977, 197, 960–964. [Google Scholar] [CrossRef] [PubMed]
- Heal, G. Valuing ecosystem services. Ecosystems 2000, 3, 24–30. [Google Scholar] [CrossRef]
- Schroter, D.; Cramer, W.; Leemans, R.; Prentice, I.C.; Araujo, M.B.; Arnell, N.W.; Bondeau, A.; Bugmann, H.; Carter, T.R.; Gracia, C.A.; et al. Ecosystem service supply and vulnerability to global change in Europe. Science 2005, 310, 1333–1337. [Google Scholar] [CrossRef] [PubMed]
- Balvanera, P.; Pfisterer, A.B.; Buchmann, N.; He, J.S.; Nakashizuka, T.; Raffaelli, D.; Schmid, B. Quantifying the evidence for biodiversity effects on ecosystem functioning and services. Ecol. Lett. 2006, 9, 1146–1156. [Google Scholar] [CrossRef]
- Tallis, H.; Taylor, H.R. Natural Capital: Theory and Practice of Mapping Ecosystem Services; Francis, R., Peter, M.K., Heather, T., Taylor, H.R., Gretchen, D., Stephen, P., Eds.; Oxford University Press: Oxford, UK, 2011; Volume 35, pp. 365, 701–704. ISBN 9780199588992. [Google Scholar]
- Sherrouse, B.C.; Clement, J.M.; Semmens, D.J. A GIS application for assessing, mapping, and quantifying the social values of ecosystem services. Appl. Geogr. 2011, 31, 748–760. [Google Scholar] [CrossRef]
- Villa, F.; Ceroni, M.; Bagstad, K.; Johnson, G.; Krivov, S. In ARIES (Artificial Intelligence for Ecosystem Services): A new tool for ecosystem services assessment, planning, and valuation. In Proceedings of the 11th International BioECON Conference on Economic Instruments to Enhance the Conservation and Sustainable Use of Biodiversity, Venice, Italy, 21 September 2009. [Google Scholar]
- Austin, Z.; McVittie, A.; McCracken, D.; Moxey, A.; Moran, D.; White, P.C.L. The co-benefits of biodiversity conservation programmes on wider ecosystem services. Ecosyst. Serv. 2016, 20, 37–43. [Google Scholar] [CrossRef]
- Firbank, L.; Bradbury, R.B.; McCracken, D.I.; Stoate, C. Delivering multiple ecosystem services from Enclosed Farmland in the UK. Agric. Ecosyst. Environ. 2013, 166, 65–75. [Google Scholar] [CrossRef]
- Meng, L.; Huang, J.; Dong, J. Assessment of rural ecosystem health and type classification in Jiangsu province, China. Sci. Total Environ. 2018, 615, 1218–1228. [Google Scholar] [CrossRef]
- Vymazal, J. Enhancing ecosystem services on the landscape with created, constructed and restored wetlands. Ecol. Eng. 2011, 37, 1–5. [Google Scholar] [CrossRef]
- Asah, S.; Blahna, D.; Ryan, C. Involving Forest Communities in Identifying and Constructing Ecosystem Services: Millennium Assessment and Place Specificity. J. For. 2012, 110, 149–156. [Google Scholar] [CrossRef]
- Venkatachalam, L. The contingent valuation method: A review. Environmental Impact Assessment Review 2004, 24, 89–124. [Google Scholar] [CrossRef]
- Camacho-Valdez, V.; Ruiz-Luna, A.; Ghermandi, A.; Berlanga-Robles, A.; Nunes, P. Effects of land use changes on the ecosystem service values of coastal wetlands. Environ. Manag. 2014, 54, 852–864. [Google Scholar] [CrossRef] [PubMed]
- Evenson, G.R.; Golden, H.E.; Lane, C.R.; McLaughlin, D.L.; D’Amico, E. Depressional wetlands affect watershed hydrological, biogeochemical, and ecological functions. Ecol. Appl. 2018, 28, 953–966. [Google Scholar] [CrossRef] [PubMed]
- Steen, V.A.; Skagen, S.K.; Melcher, C.P. Implications of Climate Change for Wetland-Dependent Birds in the Prairie Pothole Region. Wetlands 2016, 36, S445–S459. [Google Scholar] [CrossRef]
- Xiao, Y.; Huang, Z.; Lu, X. Changes of soil labile organic carbon fractions and their relation to soil microbial characteristics in four typical wetlands of Sanjiang Plain, Northeast China. Ecol. Eng. 2015, 82, 381–389. [Google Scholar] [CrossRef]
- Uuemaa, E.; Palliser, C.C.; Hughes, A.O.; Tanner, C.C. Effectiveness of a Natural Headwater Wetland for Reducing Agricultural Nitrogen Loads. Water 2018, 10, 287. [Google Scholar] [CrossRef]
- Muster, S.; Heim, B.; Abnizova, A.; Boike, J. Water Body Distributions Across Scales: A Remote Sensing Based Comparison of Three Arctic Tundra Wetlands. Remote Sens. 2013, 5, 1498–1523. [Google Scholar] [CrossRef]
- Ning, J.C.; Gao, Z.Q.; Xu, F.X. Effects of land cover change on evapotranspiration in the Yellow River Delta analyzed with the SEBAL model. J. Appl. Remote Sens. 2017, 11, 016009. [Google Scholar] [CrossRef]
- Liu, G.; Zhang, L.; Zhang, Q.; Musyimi, Z.; Jiang, Q. Spatio–Temporal Dynamics of Wetland Landscape Patterns Based on Remote Sensing in Yellow River Delta, China. Wetlands 2014, 34, 787–801. [Google Scholar] [CrossRef]
- Töyrä, J.; Pietroniro, A. Towards operational monitoring of a northern wetland using geomatics-based techniques. Remote Sens. Environ. 2005, 97, 174–191. [Google Scholar] [CrossRef]
- Melese, D.; Suryabhagavan, K.V.; Gelet, M.; Balakrishnan, M. Remote sensing and geographic information system-based African civet habitat mapping in Andracha, Ethiopia. J. Appl. Remote Sens. 2014, 8, 12. [Google Scholar] [CrossRef]
- McInnes, R.J.; Simpson, M.; Lopez, B.; Hawkins, R.; Shore, R. Wetland Ecosystem Services and the Ramsar Convention: An Assessment of Needs. Wetlands 2017, 37, 123–134. [Google Scholar] [CrossRef]
- Ramsar, I.S. RIS for Site No. 2346, Shandong Jining Nansi Lake, China; Ramsar Sites Information Service: Ramsar, Iran, 2018. [Google Scholar]
- Yu, H.; Wang, Y.; Wang, S.; Wu, J.; Xia, H.; Pan, C.; Shi, X.; Chang, J.; Wei, Z.; Feng, Z. Natural Resources Investigation and Exploitation of Nansi Lake; Shangdong Science and Technology Press: Jinan, China, 1987. [Google Scholar]
- Fang, J.; Zhao, S.; Tang, Z. Basis of Wetland Biodiversity Conservation Ecology of the Middle Reaches of the Yangtze River; Higher Education Press: Beijing, China, 2006. [Google Scholar]
- Bureau, J.S. Jining Statistical Yearbook; China Statistics Press: Beijing, China, 2012. [Google Scholar]
- Frohn, R.; Chaudhary, N. Multi-scale Image Segmentation and Object-Oriented Processing for Land Cover Classification. Gisci. Remote Sens. 2008, 45, 377–391. [Google Scholar] [CrossRef]
- Fichera, C.R.; Modica, G.; Pollino, M. Land Cover classification and change-detection analysis using multi-temporal remote sensed imagery and landscape metrics. Eur. J. Remote Sens. 2012, 45, 1–18. [Google Scholar] [CrossRef]
- Costanza, R.; de Groot, R.; Sutton, P.; van der Ploeg, S.; Anderson, S.J.; Kubiszewski, I.; Farber, S.; Turner, R.K. Changes in the global value of ecosystem services. Glob. Environ. Chang. 2014, 26, 152–158. [Google Scholar] [CrossRef]
- Xu, J.; Dong, J. Response of Ecosystem in Service Value to Changes in Landscape Pattern of the Nansi Lake Wetland. J. Ecol. Rural Environ. 2013, 29, 471–477. [Google Scholar]
- Li, W. Evaluation on Ecosystem Service Function Value of Theory, Methods and Applications; China Renmin University Press: Beijing, China, 2008. [Google Scholar]
- Li, S.; Xie, G.; Yu, G.; Zhang, C.; Ge, L. Seasonal dynamics of gas regulation service in forest ecosystem. J. For. Res. 2010, 21, 99–103. [Google Scholar] [CrossRef]
- Plantinga, A.J.; Mauldin, T. A Method for Estimating the Cost of CO2 Mitigation through Afforestation. Clim. Chang. 2001, 49, 21–40. [Google Scholar] [CrossRef]
- Ricke, K.; Drouet, L.; Caldeira, K.; Tavoni, M. Country-level social cost of carbon. Nat. Clim. Chang. 2018, 8, 895–900. [Google Scholar] [CrossRef]
- Mitsch, W.J.; Gosselink, J.G. The value of wetlands: Importance of scale and landscape setting. Ecol. Econ. 2000, 35, 25–33. [Google Scholar] [CrossRef]
- Xiao, Y.; Xie, G.D.; Chun-Xia, L.U.; Ding, X.Z.; Yao, L.U. The gas regulation function of rice paddy ecosystems and its value. J. Nat. Resour. 2004, 19, 617–623. [Google Scholar]
- Liu, H.; Xuan, C. Elementary study on evaluation of CO_2 emissions from aquaculture in China. South China Fish. Sci. 2010, 6, 77–80. [Google Scholar]
- Lee, S.-C.; Oh, D.-H.; Lee, J.-D. A new approach to measuring shadow price: Reconciling engineering and economic perspectives. Energy Econ. 2014, 46, 66–77. [Google Scholar] [CrossRef]
- Xie, G.; Zhang, C.; Zhang, C.; Xiao, Y.; Lu, C. The value of ecosystem services in China. Resour. Sci. 2015, 37, 1740–1746. [Google Scholar]
- Daniel, T.C.; Muhar, A.; Arnberger, A.; Aznar, O.; Boyd, J.W.; Chan, K.M.; Costanza, R.; Elmqvist, T.; Flint, C.G.; Gobster, P.H.; et al. Contributions of cultural services to the ecosystem services agenda. Proc. Natl. Acad. Sci. USA 2012, 109, 8812–8819. [Google Scholar] [CrossRef] [PubMed]
- Zhang, S. Research on the Tourism Development and Management Reform of Weishan Lake; Guizhou University: Guizhou, China, 2010. [Google Scholar]
- Cai, Z.; Wang, Q.; Liu, G. Value Re-Evaluation for Ecosystem Services of China. Ecol. Econ. 2014, 30, 16–23. [Google Scholar]
- Guo-Xia, M.A.; Fang, Y.U.; Wang, J.N.; Zhou, X.F.; Yuan, J.; Mou, X.H.; Zhou, Y.; Yang, W.S.; Peng, F. Measuring gross ecosystem product(GEP) of 2015 for terrestrial ecosystems in China. China Environ. Sci. 2017, 37, 1474–1482. [Google Scholar]
- Liu, Y.; Dong, X. Comparison and reference of Chinese and foreign wetland protection legal system. Environ. Prot. 2018, 46, 63–67. [Google Scholar]
- Verstraete, M.; Pinty, B.; Myneni, R. Potential and limitations of information extraction on the terrestrial biosphere from satellite remote sensing. Remote Sens. Environ. 1996, 58, 201–214. [Google Scholar] [CrossRef]
- Yang, W.; Chang, J.; Xu, B.; Peng, C.; Ge, Y. Ecosystem service value assessment for constructed wetlands: A case study in Hangzhou, China. Ecol. Econ. 2008, 68, 116–125. [Google Scholar] [CrossRef]


| Type | Output/Input (t/year) | Unit Price ($/t) | Total Value ($) | |
|---|---|---|---|---|
| Fish | Carp | 1.3 × 10⁴ | 1.365 × 10³ | 1.774 × 10⁷ |
| Crucian | 1.6 × 10⁴ | 1.845 × 10³ | 2.952 × 10⁷ | |
| Mandarin fish | 500 | 7.774 × 10³ | 3.870 × 10⁶ | |
| Turtle | 40 | 1.063 × 10⁴ | 4.252 × 10⁵ | |
| Total | 2.954 × 10⁴ | - | 5.156 × 10⁷ | |
| Average price | - | 1.745×10³ | - | |
| Paddy | Seed | 45 | 396.574 | 1.785 × 10⁴ |
| Chemical fertilizer | 214.677 | 375.37 | 8.058 × 10⁴ | |
| Pesticide | 3.245 | 2.982 × 10³ | 9.677 × 10³ | |
| Diesel (farm machinery) | 35.926 | 841.648 | 3.024 × 10⁴ | |
| Electricity | 3.352 × 10⁴ | 0.082 | 2.749 × 10³ | |
| Labour force | 385.86 | 91.371 | 3.526 × 10⁴ | |
| Total | - | - | 1.762 × 10⁵ | |
| Type | Biomass (t·km−2) | Release of CO2 (t·km−2·a−1) | Release of CH4 (t·km−2·a−1) | Service Value ($·km2·a−1) | Data Source |
|---|---|---|---|---|---|
| Phytoplankton | 2.48 | - | - | 2.84 × 10² | CSIR, 2006 |
| Hydrophyte (reedsand lotus ponds) | 2.58 × 10³ | - | 1.37 × 10² | 2.81 × 10⁵ | CSIR, 2006; [49] |
| Paddy field | - | - | - | 1.45 × 10⁵ | [54] |
| Aquaculture area (fish) | - | 121.5 | - | −2.92 × 10³ | [55] |
| Flood Storage Capacity | 1987 | 1995 | 2002 | 2006 | 2010 | 2017 |
|---|---|---|---|---|---|---|
| Upper lake | 10.02 | 9.29 | 0 | 10.85 | 10.2 | 10.98 |
| Lower lake | 5.68 | 7.78 | 0.61 | 8.37 | 6.8 | 9.47 |
| Total | 15.7 | 17.07 | 0.61 | 19.22 | 17 | 20.45 |
| 1987 | Natural Water | Reed | Lotus Ponds | Paddy Fields | Rivers and Ditches | Reservoirs and Ponds | Aquacul-ture Area | Non-Wetland | |
|---|---|---|---|---|---|---|---|---|---|
| 2017 | |||||||||
| Natural Water | 239.41 | 13.29 | 38.76 | 1.97 | 9.52 | 1.96 | 0.87 | 4.09 | |
| Reed | 4.46 | 12.67 | 7.66 | 1.77 | 2.50 | 0.37 | 0.41 | 8.27 | |
| Lotus Ponds | 36.49 | 30.38 | 69.54 | 1.08 | 1.26 | 1.03 | 0.84 | 2.77 | |
| Paddy Fields | 0.48 | 62.64 | 2.23 | 18.06 | 0.57 | 0.87 | 1.63 | 13.14 | |
| Rivers and Ditches | 6.53 | 9.43 | 9.99 | 0.35 | 16.39 | 1.00 | 0.89 | 2.84 | |
| Reservoirs and Ponds | 0.91 | 5.22 | 0.56 | 0.58 | 0.06 | 5.15 | 0.08 | 2.31 | |
| Aquaculture Area | 79.40 | 232.20 | 144.05 | 13.02 | 10.45 | 4.46 | 11.23 | 26.25 | |
| Non- wetland | 3.28 | 9.19 | 2.38 | 1.21 | 0.92 | 0.67 | 3.83 | 18.16 | |
| Change Statistics | −73.76 | −341.58 | −131.84 | 63.26 | 13.99 | 1.43 | 502.05 | −35.02 | |
| Index | NP | PD | LSI | SHDI | SHEI | CONTAG | |
|---|---|---|---|---|---|---|---|
| Year | |||||||
| 1987 | 483 | 0.40 | 11.19 | 1.48 | 0.71 | 50.81 | |
| 1995 | 413 | 0.34 | 9.56 | 1.51 | 0.73 | 51.60 | |
| 2002 | 640 | 0.53 | 14.26 | 1.70 | 0.82 | 40.82 | |
| 2006 | 621 | 0.52 | 12.18 | 1.52 | 0.73 | 47.93 | |
| 2010 | 719 | 0.60 | 12.82 | 1.48 | 0.71 | 48.31 | |
| 2017 | 783 | 0.65 | 14.33 | 1.64 | 0.72 | 43.63 | |
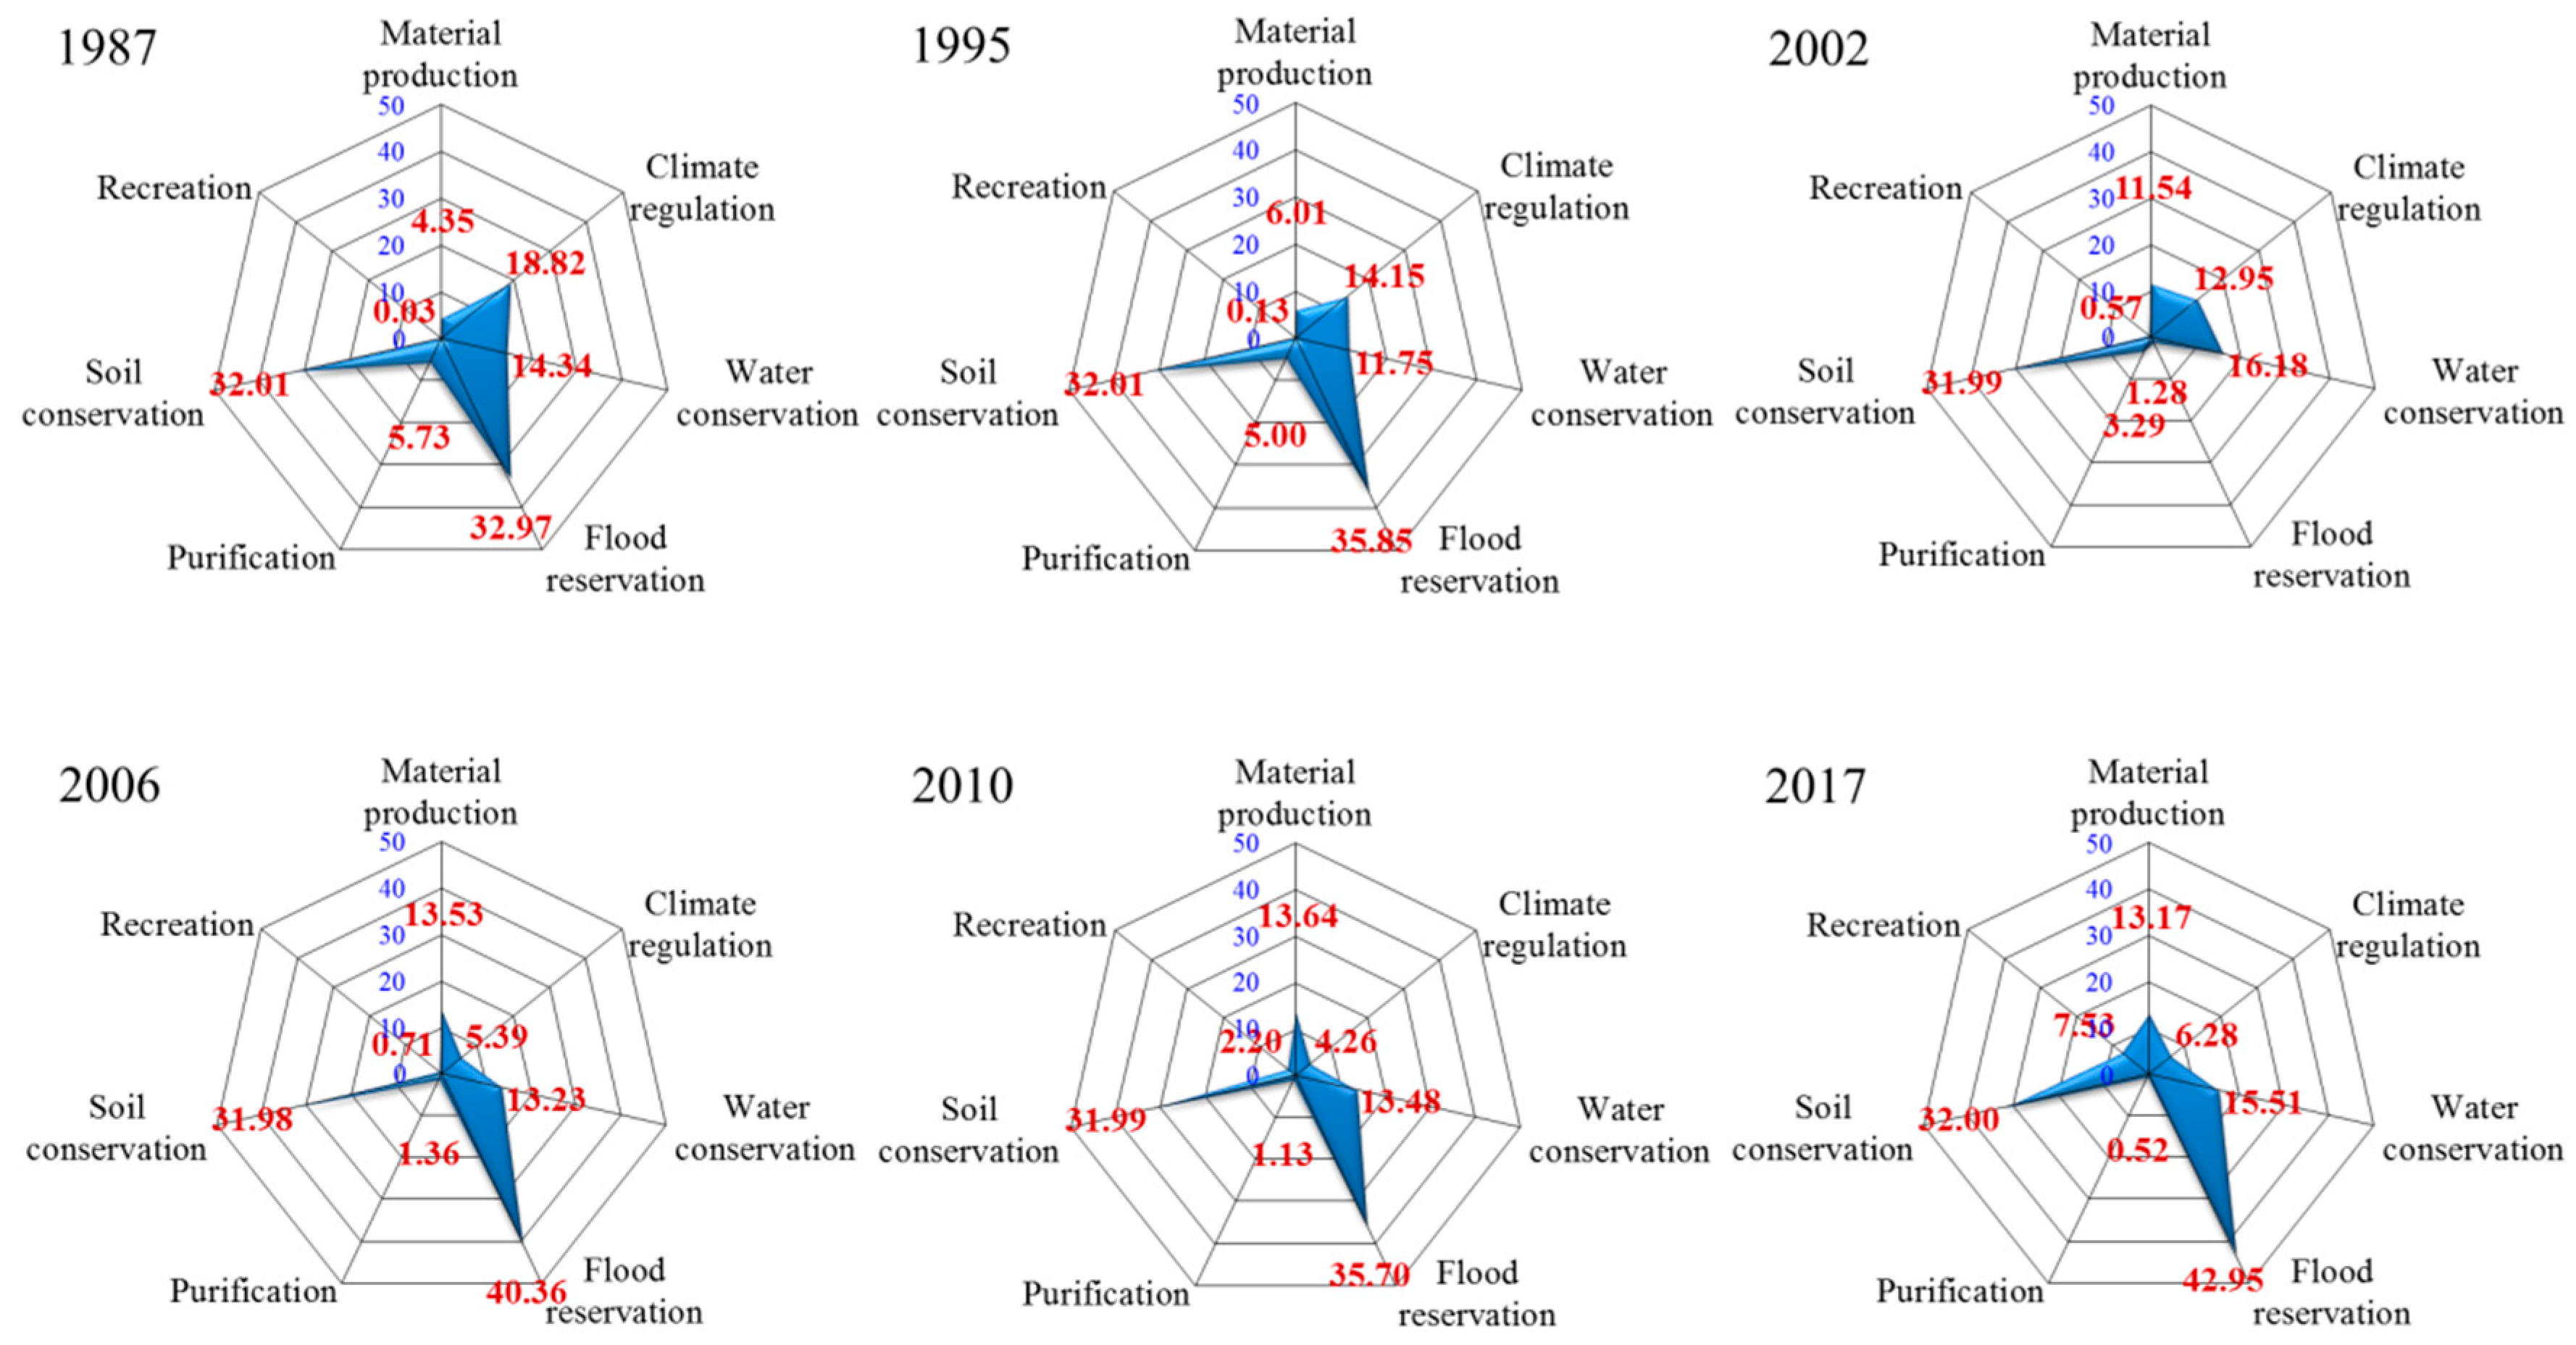
| Ecosystem Service | Second Class | Unit Value/ Total Value | Valuation Method | ESV | ||||||
|---|---|---|---|---|---|---|---|---|---|---|
| 1987 | 1995 | 2002 | 2006 | 2010 | 2017 | |||||
| Provisioning services | ||||||||||
| Material production | Fish | $3.927 × 10⁵/km2 | MV | 4.35 | 6.01 | 11.54 | 13.53 | 13.64 | 13.17 | |
| Paddy | $2.194 × 10⁵/km2 | |||||||||
| Reed | $3.174 × 10⁴/km2 | |||||||||
| Regulating services | ||||||||||
| Climate regulation | Phytoplankton | $2.84 × 10²/km2 | IO/CT, AC | 18.82 | 14.15 | 12.95 | 5.39 | 4.26 | 6.28 | |
| Hydrophyte | $2.81 × 10⁵ /km2 | |||||||||
| Paddy fields | $1.45 × 10⁵/km2 | |||||||||
| Aquaculture area | $−2.92 × 10³/km2 | |||||||||
| Water regulation | - | $1.575 × 10⁵/km2 | SE | 14.34 | 11.75 | 16.18 | 13.23 | 13.48 | 15.51 | |
| Flood reservation | - | $0.21/m3 | SE | 32.97 | 35.85 | 1.28 | 40.36 | 35.70 | 42.95 | |
| Purification | - | $1.526 × 10⁵/km2 | RC | 5.73 | 5.00 | 3.29 | 1.36 | 1.13 | 0.52 | |
| Supporting services | ||||||||||
| Soil conservation | - | $3.06 × 10⁷/km2 | SE | 32.01 | 32.01 | 31.99 | 31.98 | 31.99 | 32.0 | |
| Cultural services | ||||||||||
| Recreation | - | $14.2 | TC | 0.03 | 0.13 | 0.57 | 0.71 | 2.20 | 7.53 | |
| Total | - | - | - | 108.25 | 104.90 | 77.80 | 106.56 | 102.40 | 117.96 | |
© 2019 by the authors. Licensee MDPI, Basel, Switzerland. This article is an open access article distributed under the terms and conditions of the Creative Commons Attribution (CC BY) license (http://creativecommons.org/licenses/by/4.0/).
Share and Cite
Meng, L.; Dong, J. LUCC and Ecosystem Service Value Assessment for Wetlands: A Case Study in Nansi Lake, China. Water 2019, 11, 1597. https://doi.org/10.3390/w11081597
Meng L, Dong J. LUCC and Ecosystem Service Value Assessment for Wetlands: A Case Study in Nansi Lake, China. Water. 2019; 11(8):1597. https://doi.org/10.3390/w11081597
Chicago/Turabian StyleMeng, Lingran, and Jihong Dong. 2019. "LUCC and Ecosystem Service Value Assessment for Wetlands: A Case Study in Nansi Lake, China" Water 11, no. 8: 1597. https://doi.org/10.3390/w11081597
APA StyleMeng, L., & Dong, J. (2019). LUCC and Ecosystem Service Value Assessment for Wetlands: A Case Study in Nansi Lake, China. Water, 11(8), 1597. https://doi.org/10.3390/w11081597