Hydrogeochemical Characteristics and the Suitability of Groundwater in the Alluvial-Diluvial Plain of Southwest Shandong Province, China


Abstract
:1. Introduction
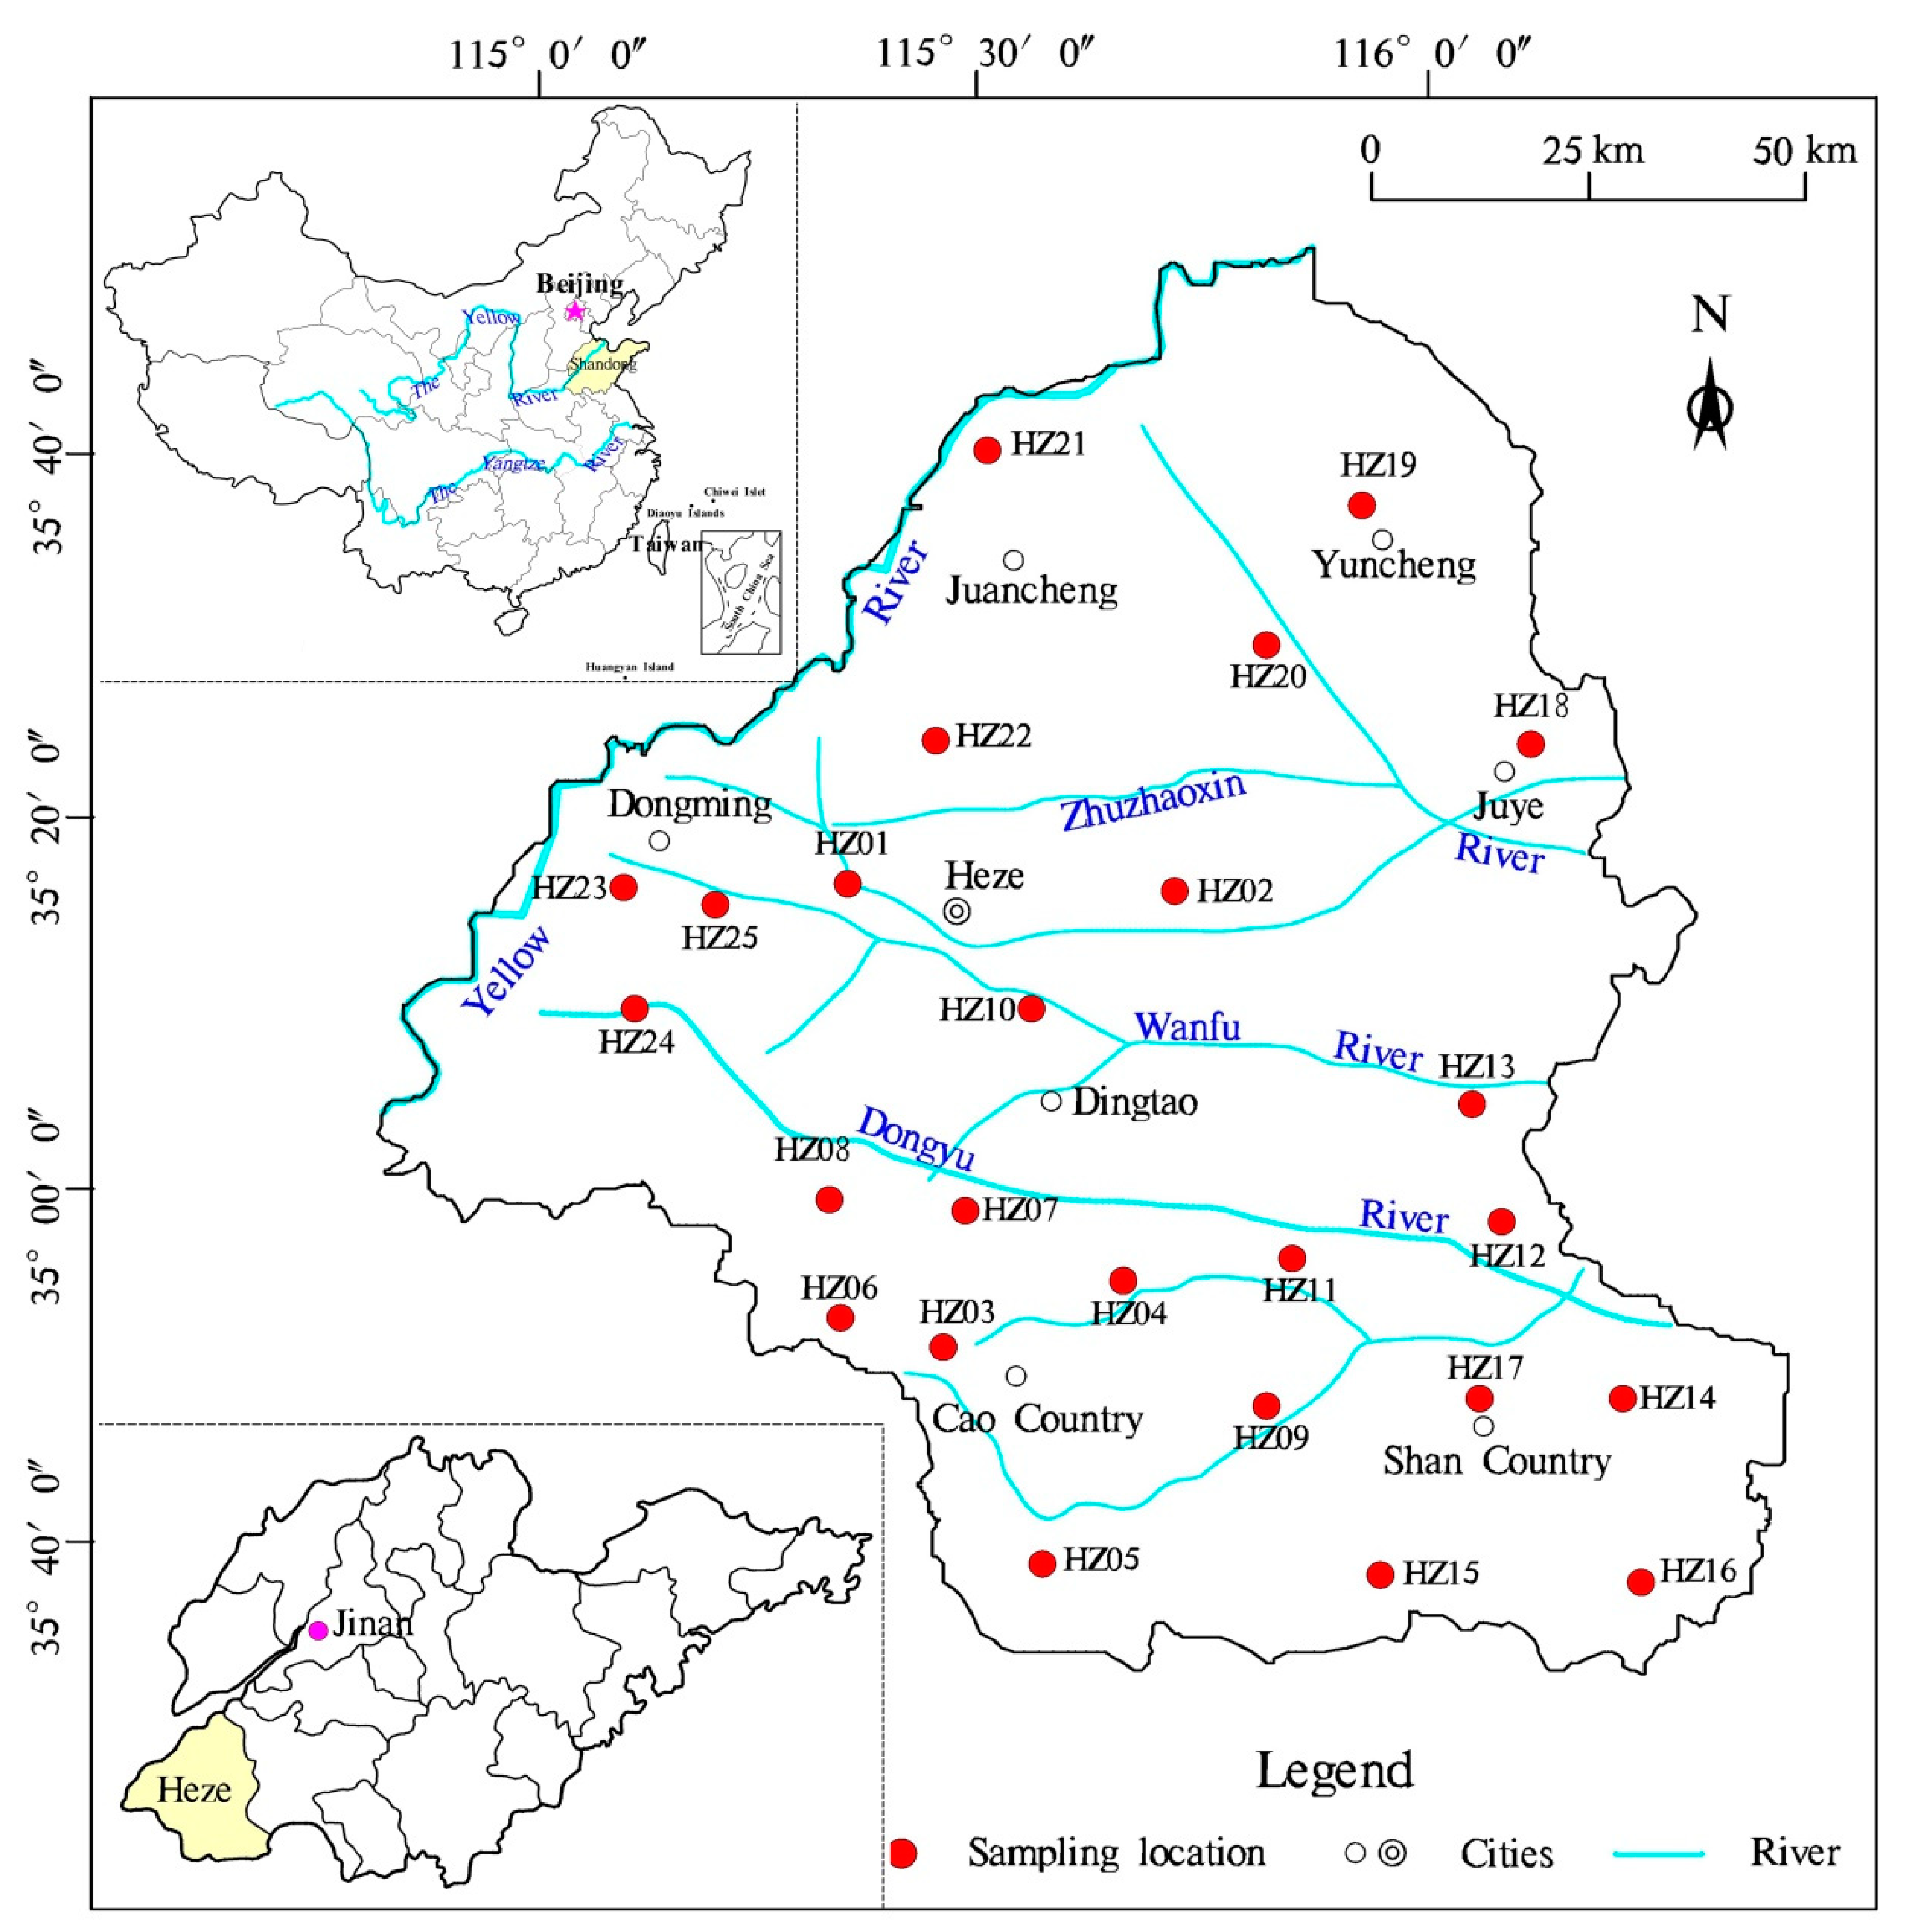
2. Study Area
3. Materials and Methods
3.1. Sampling and Analysis
3.2. Water Quality Assessment
4. Results and Discussion
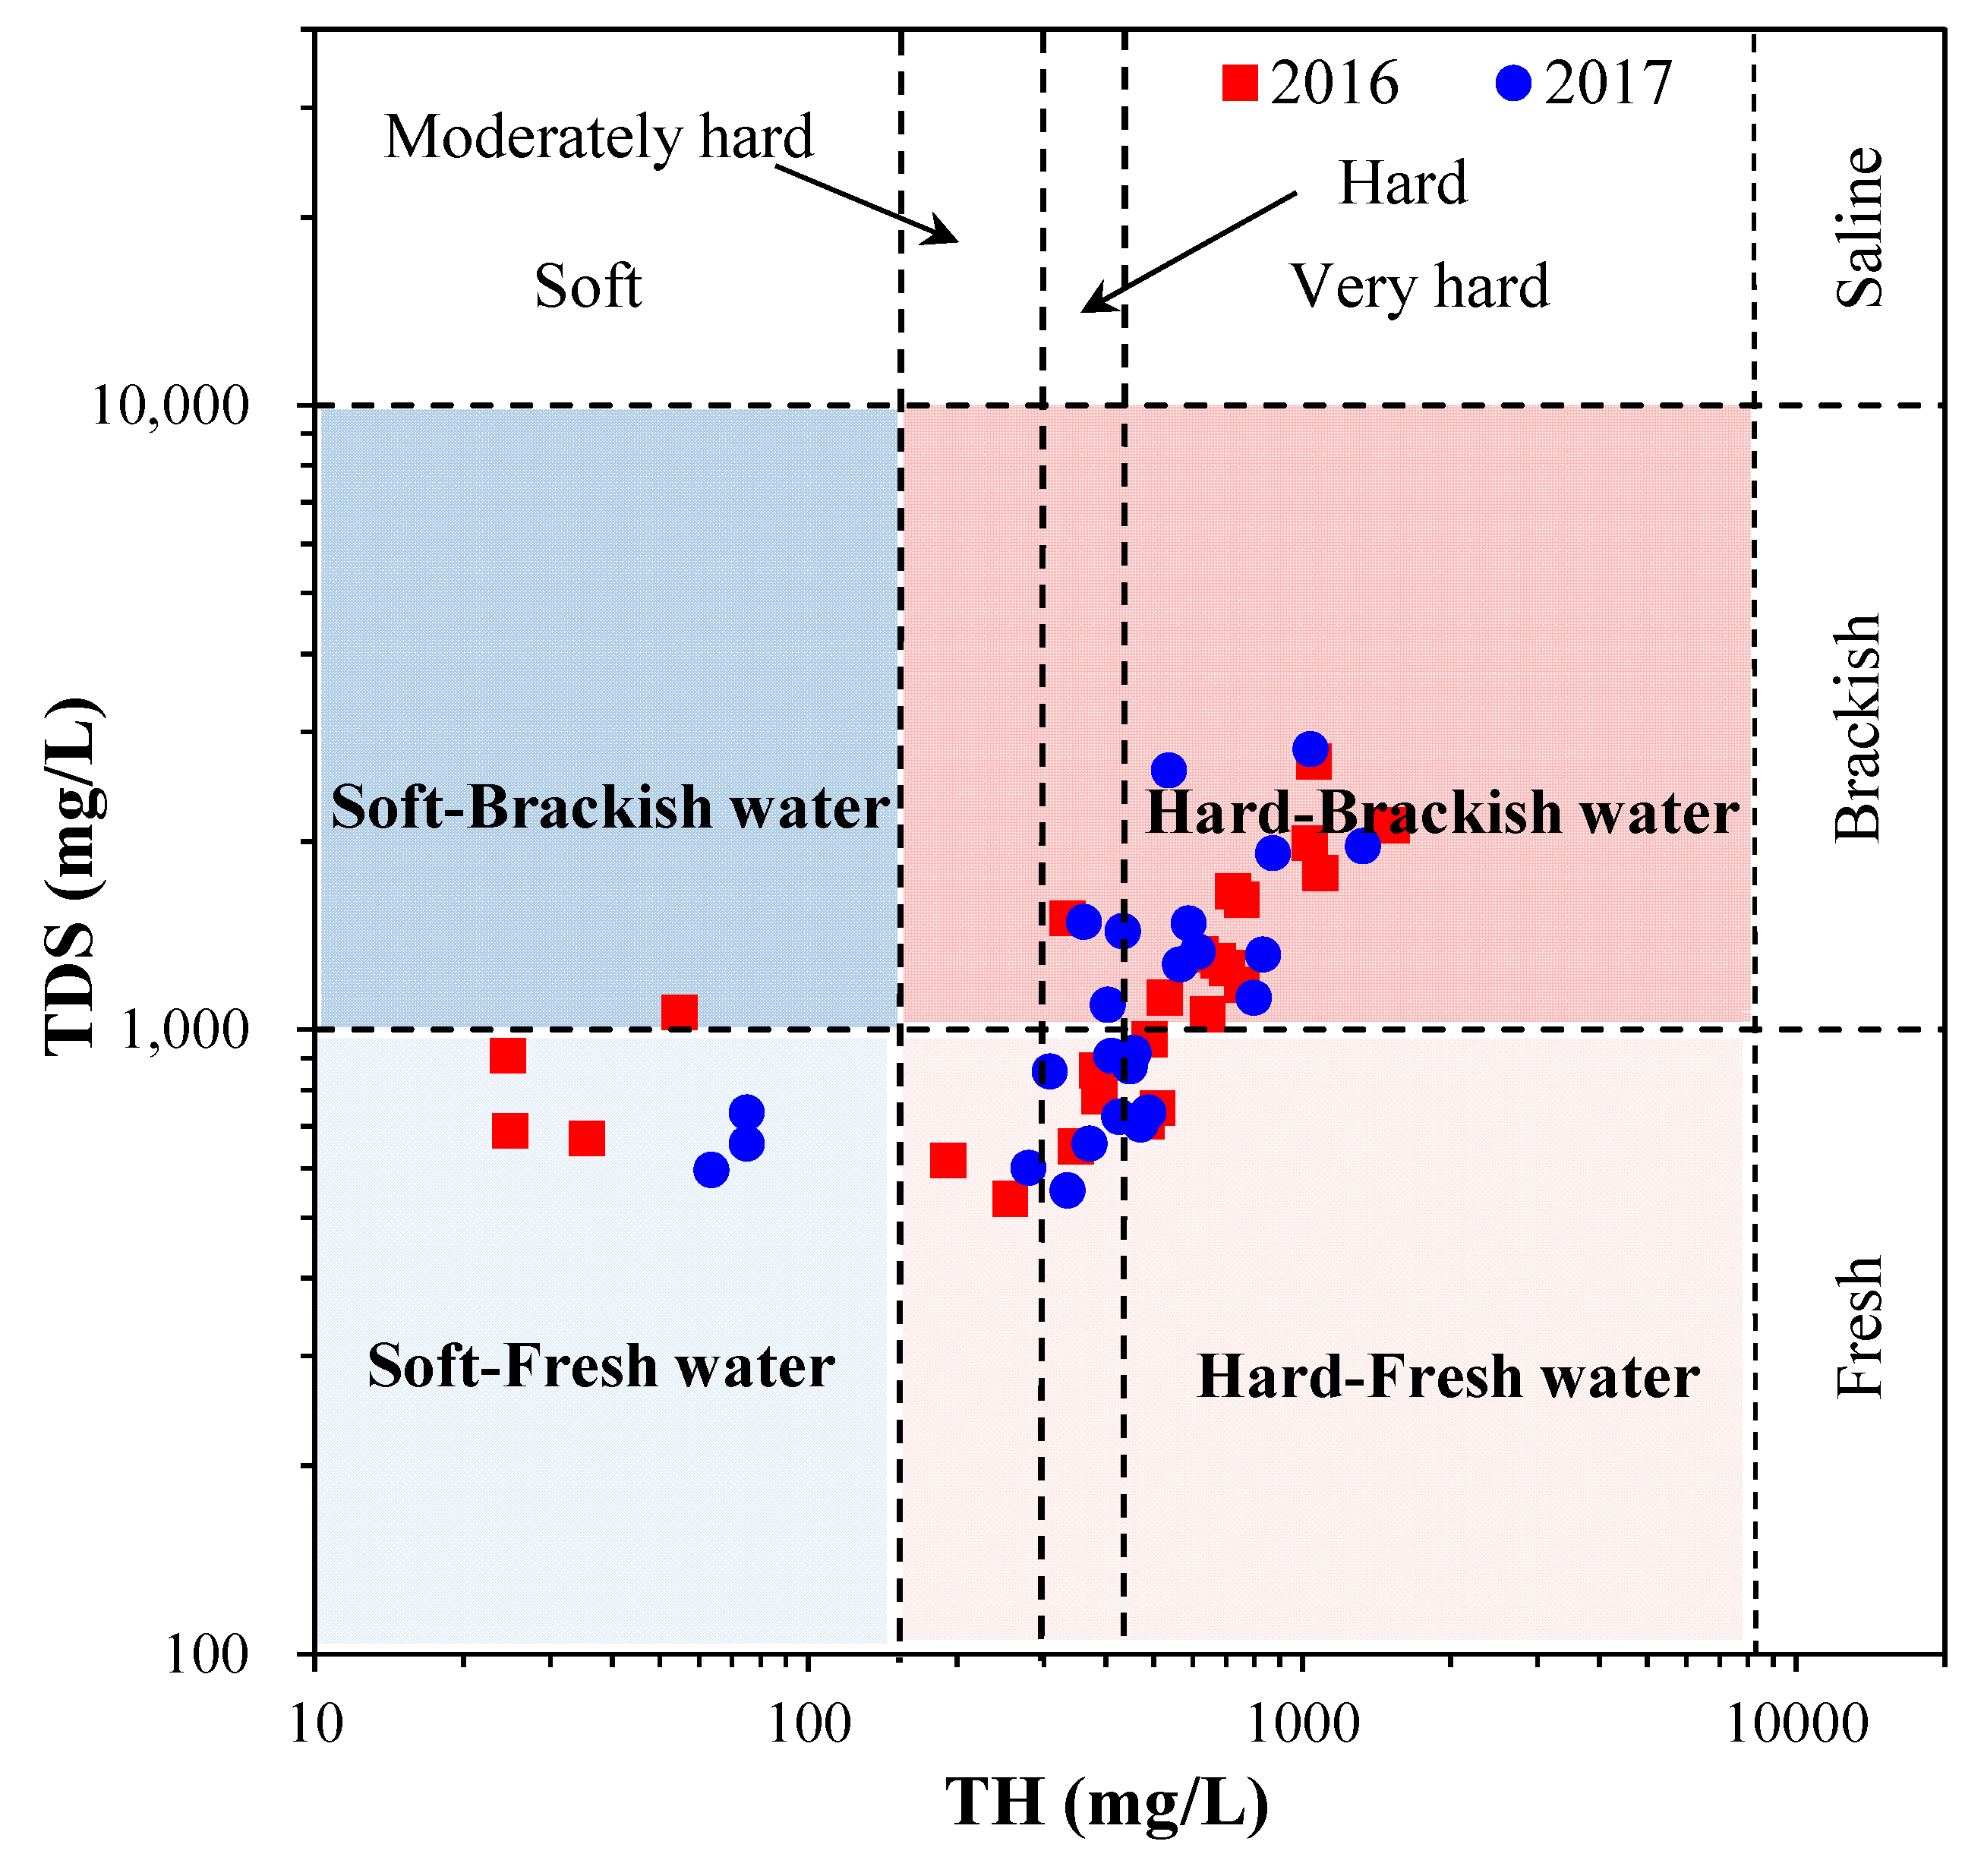
4.1. Major Ion Chemistry
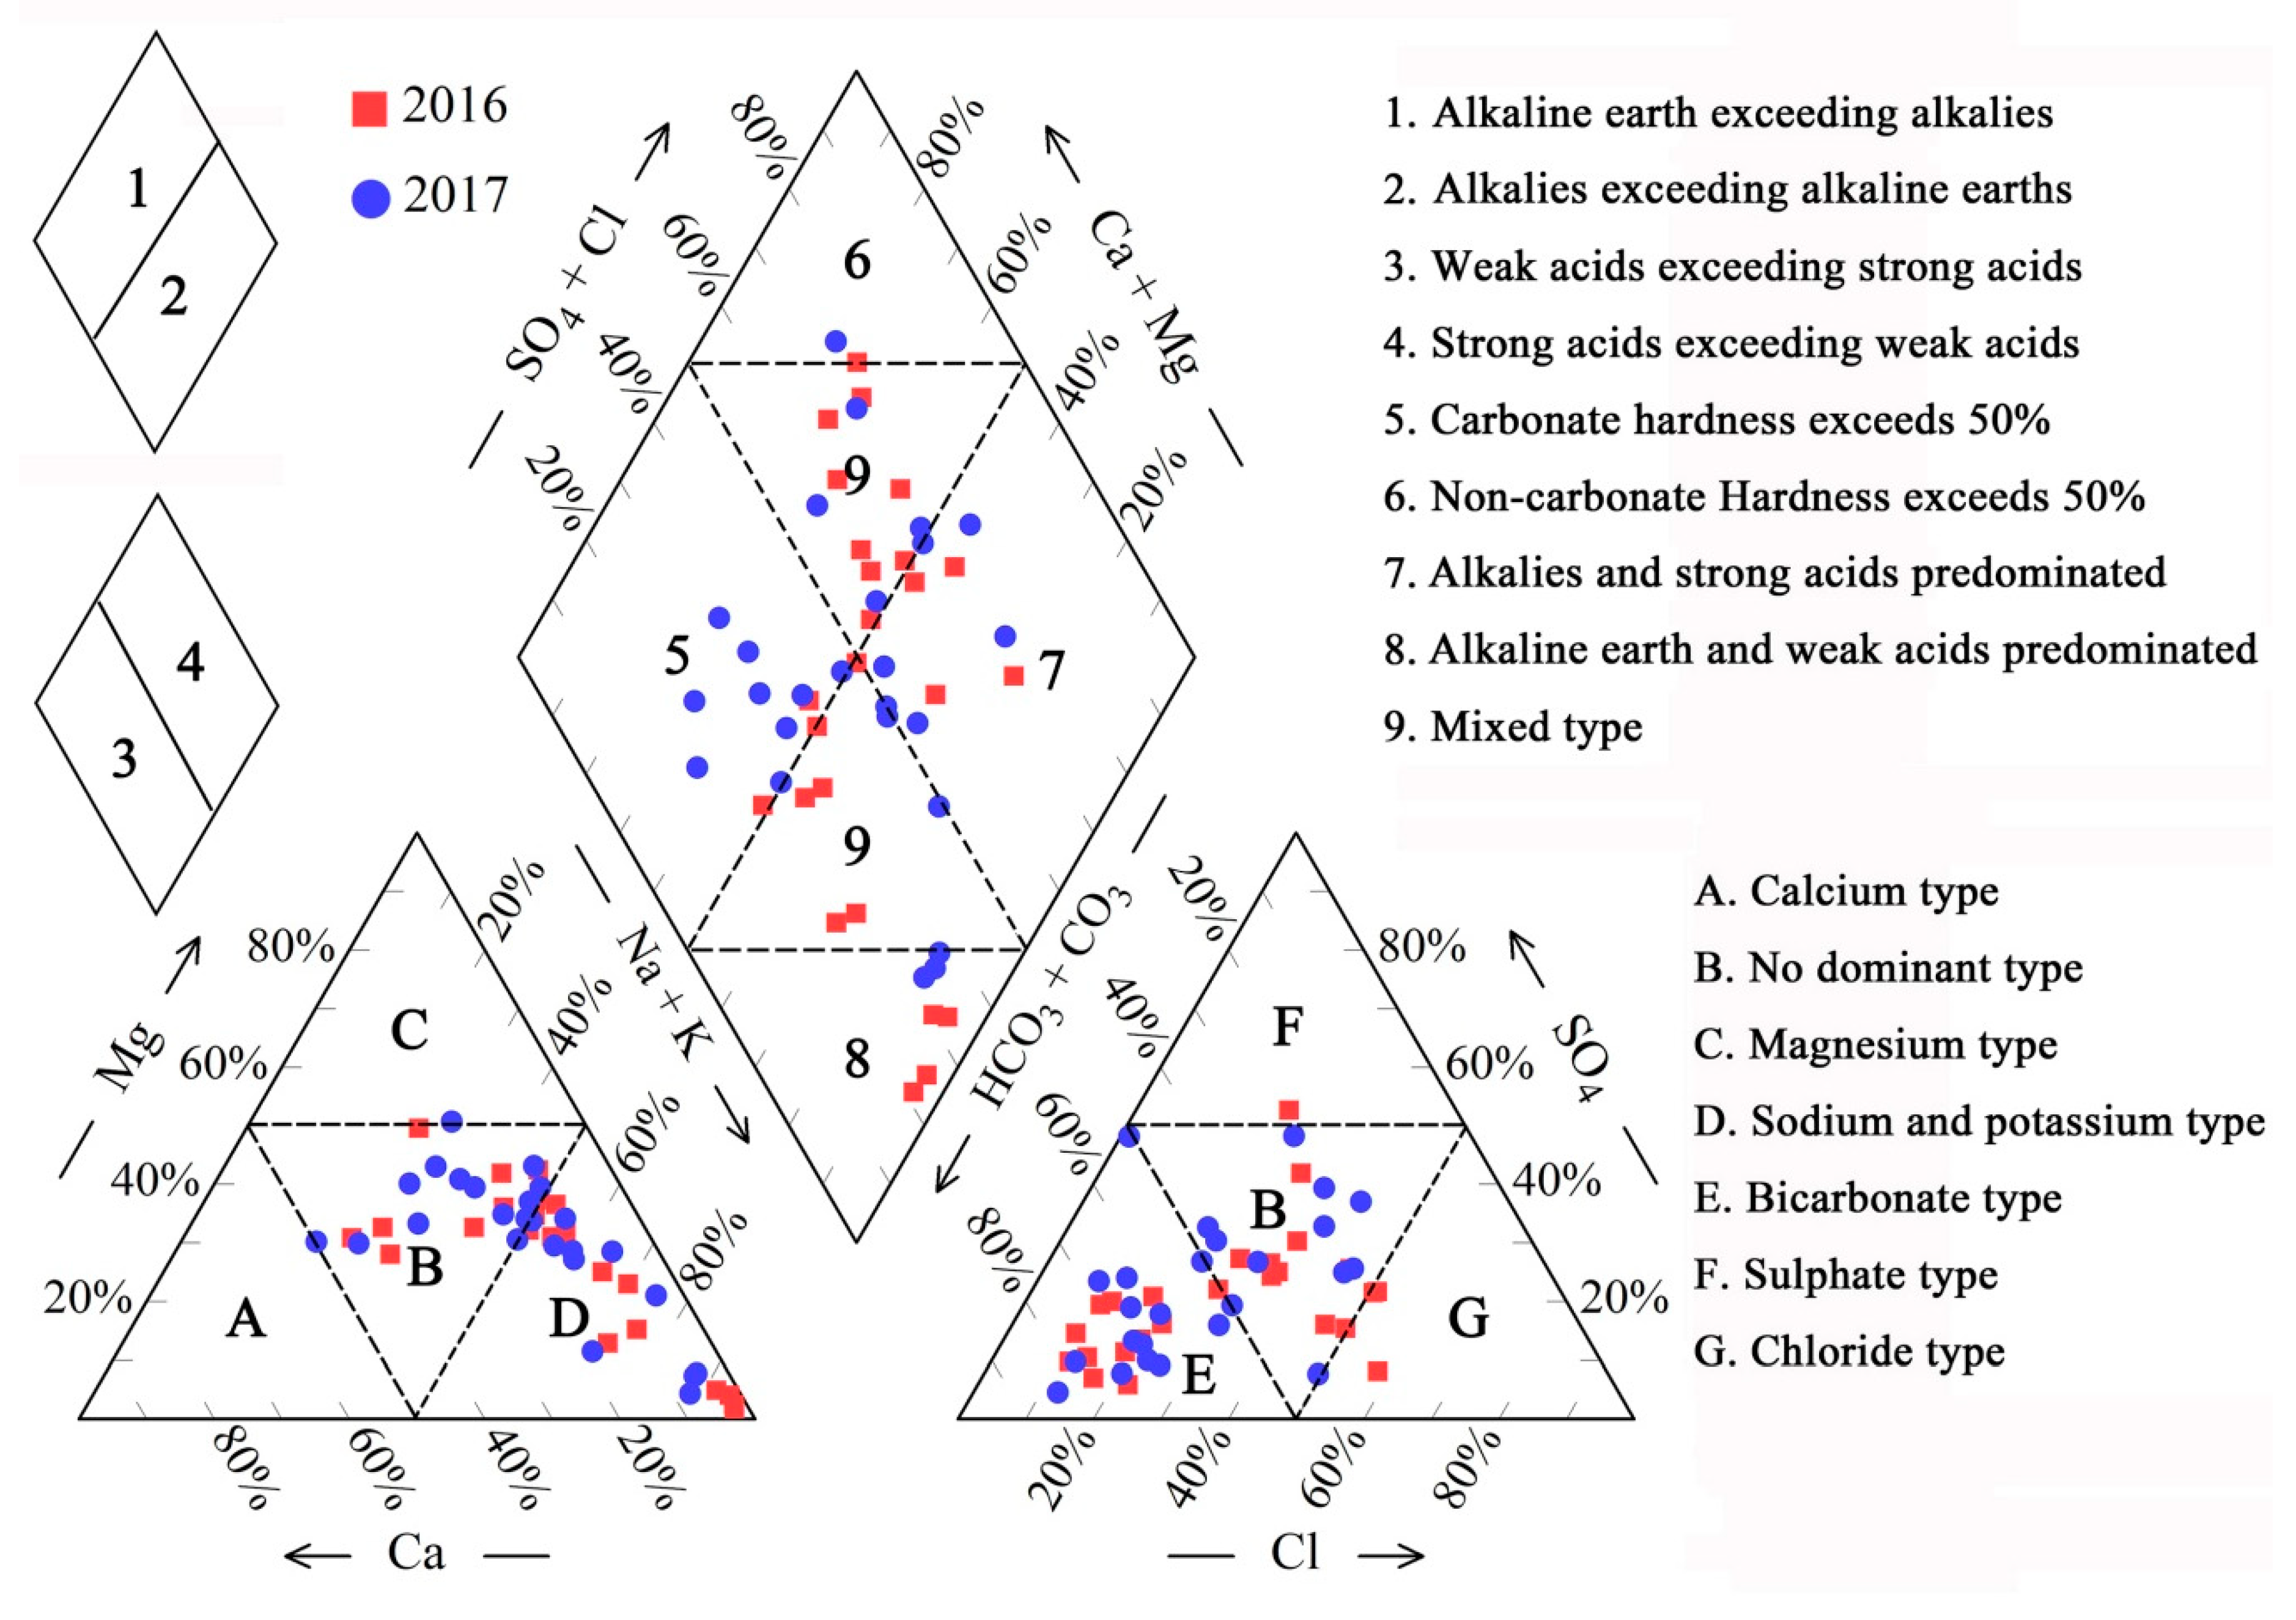
4.2. Water Types
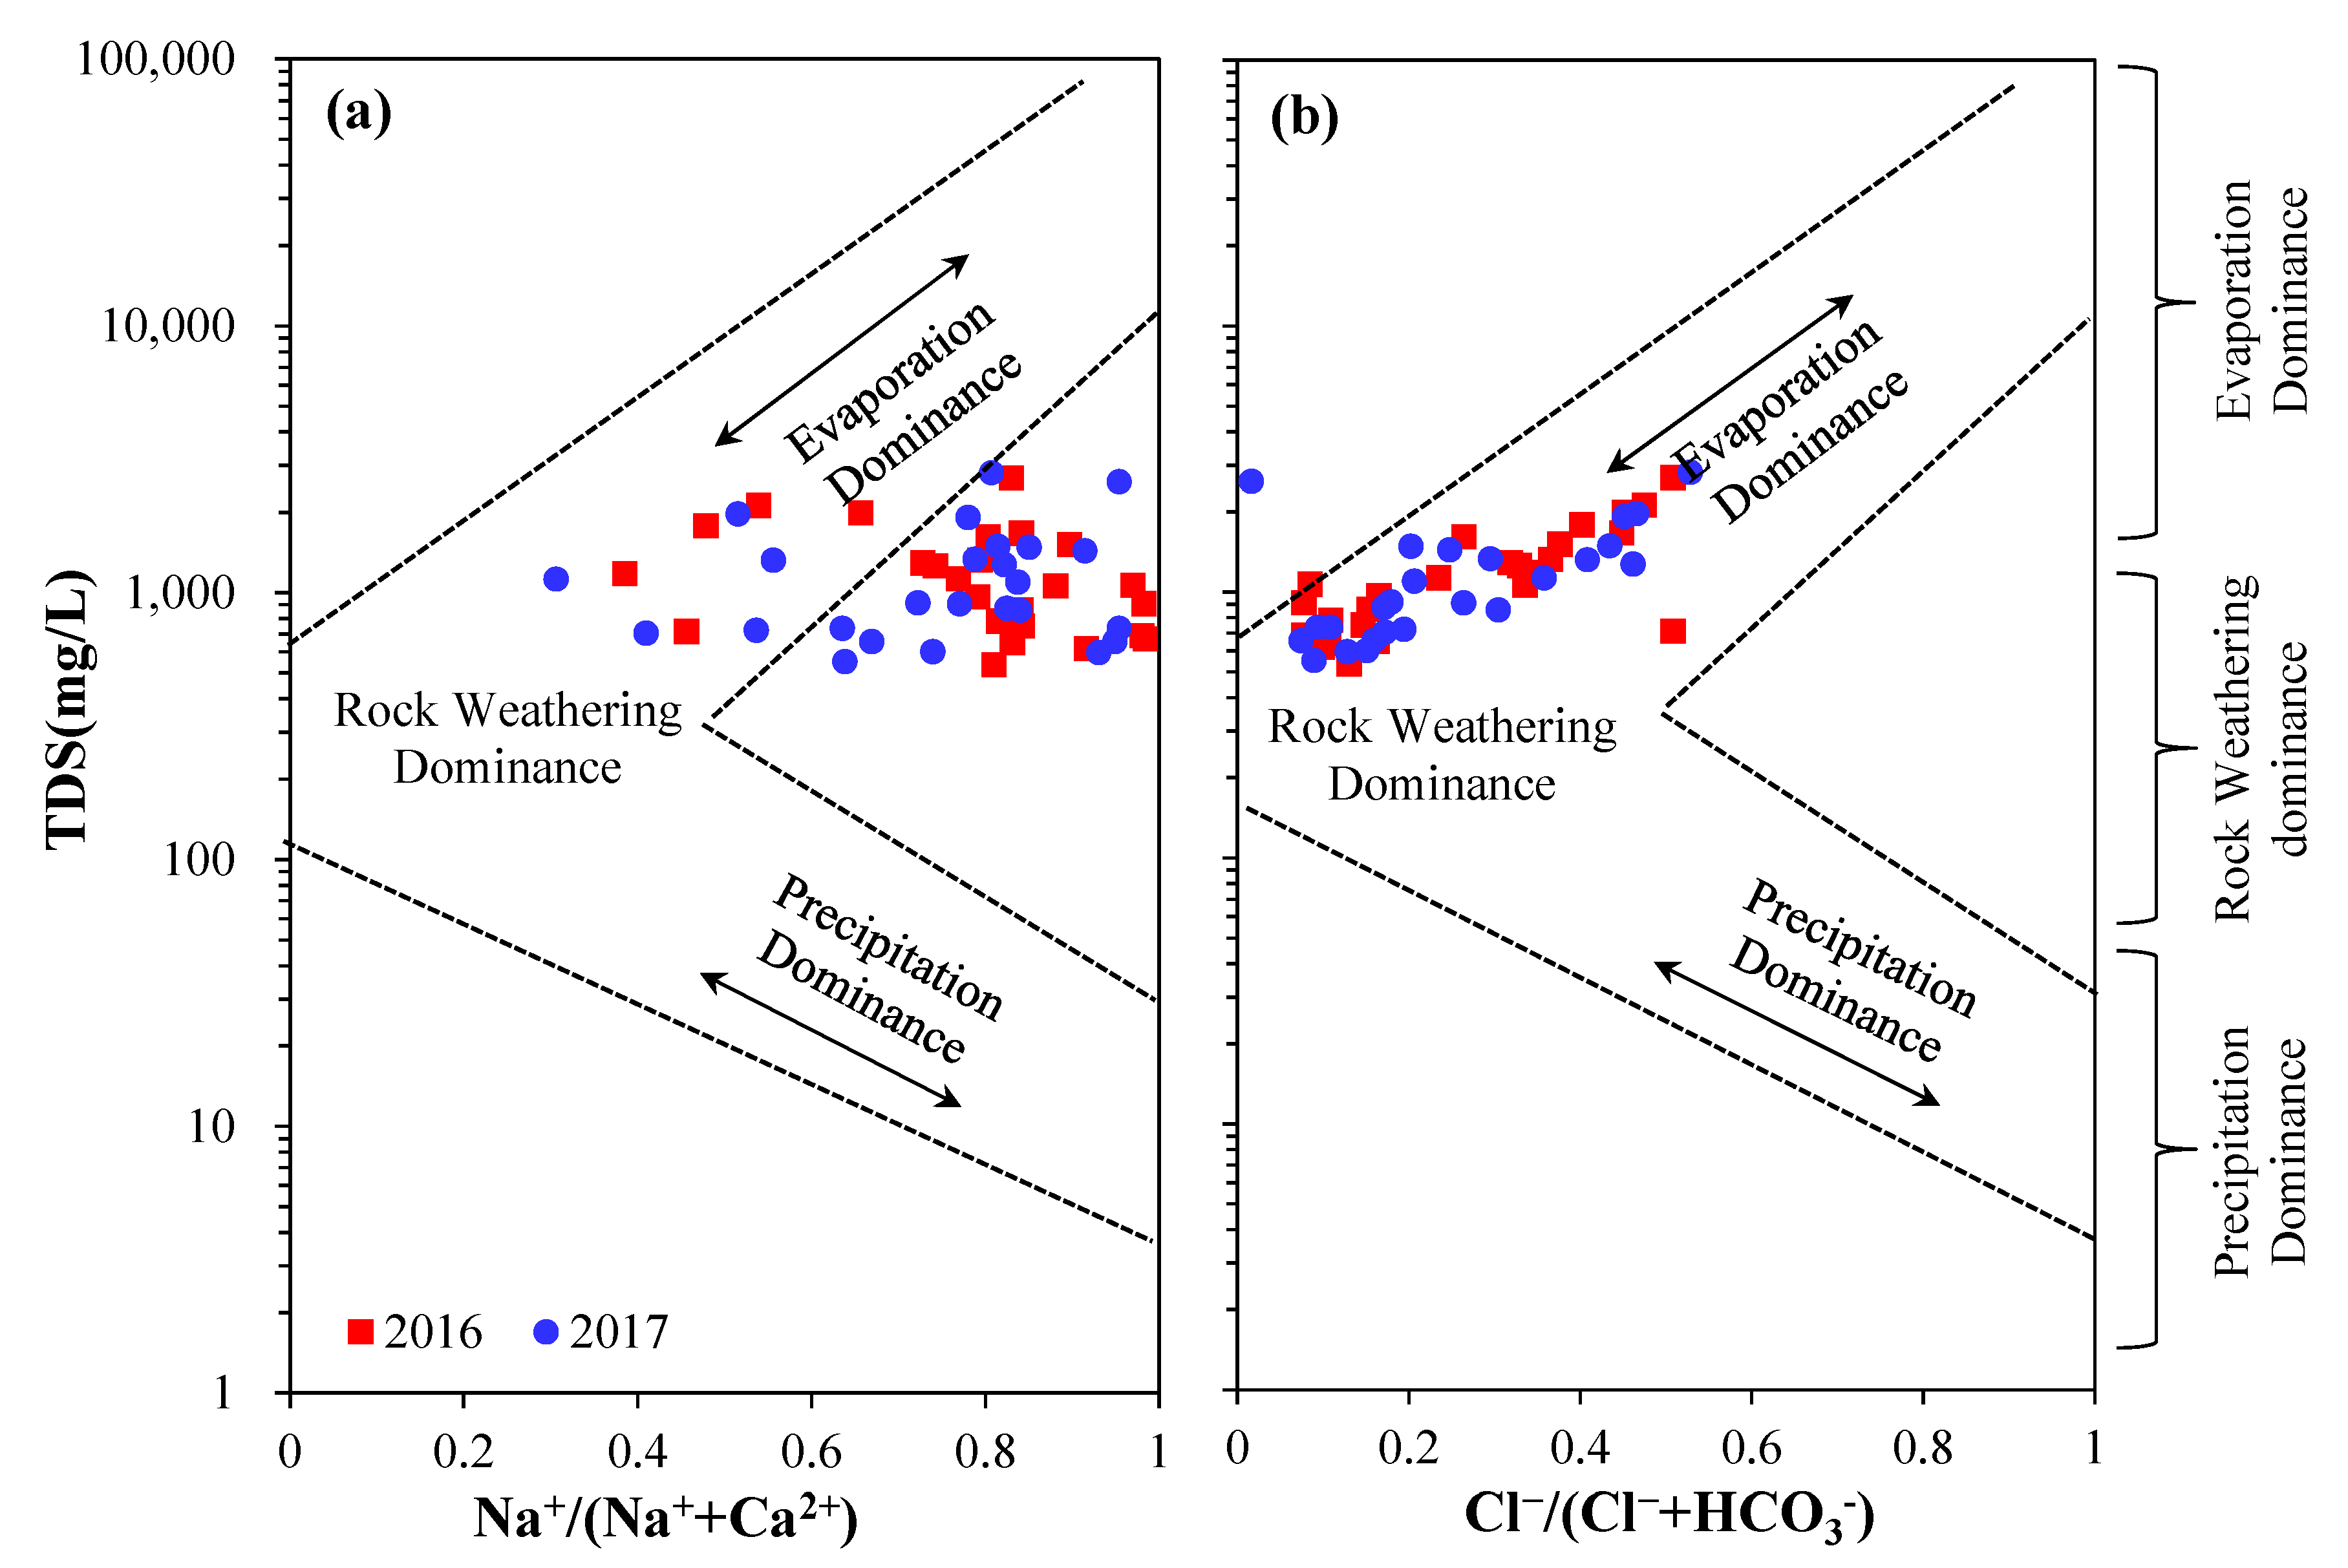
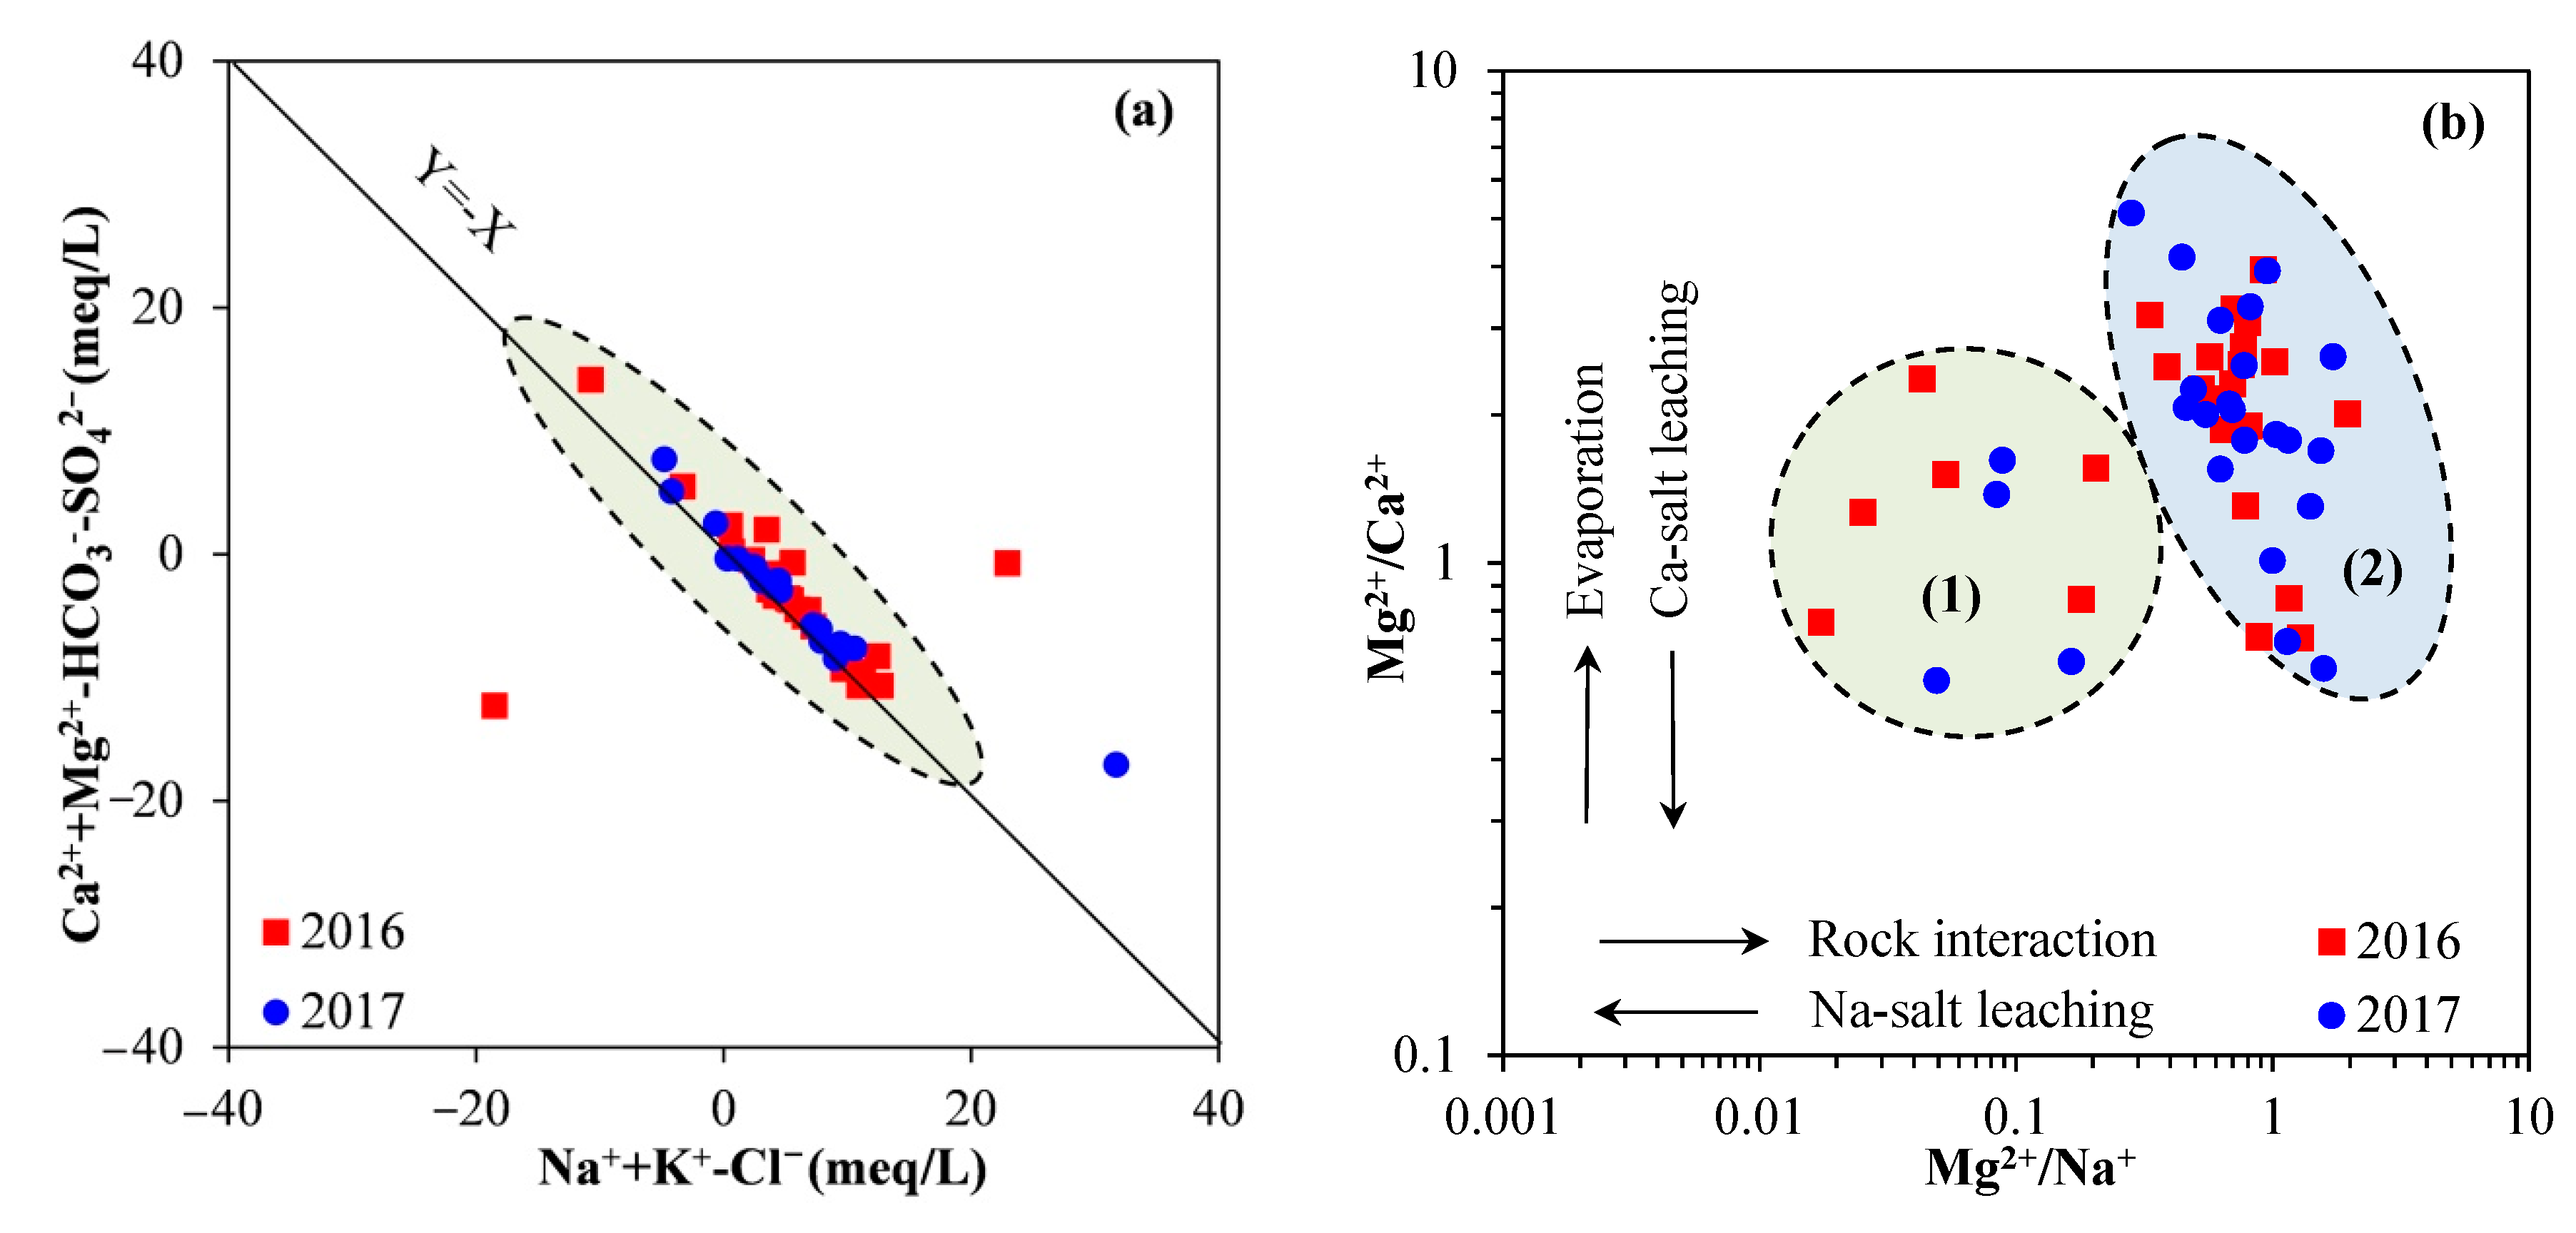
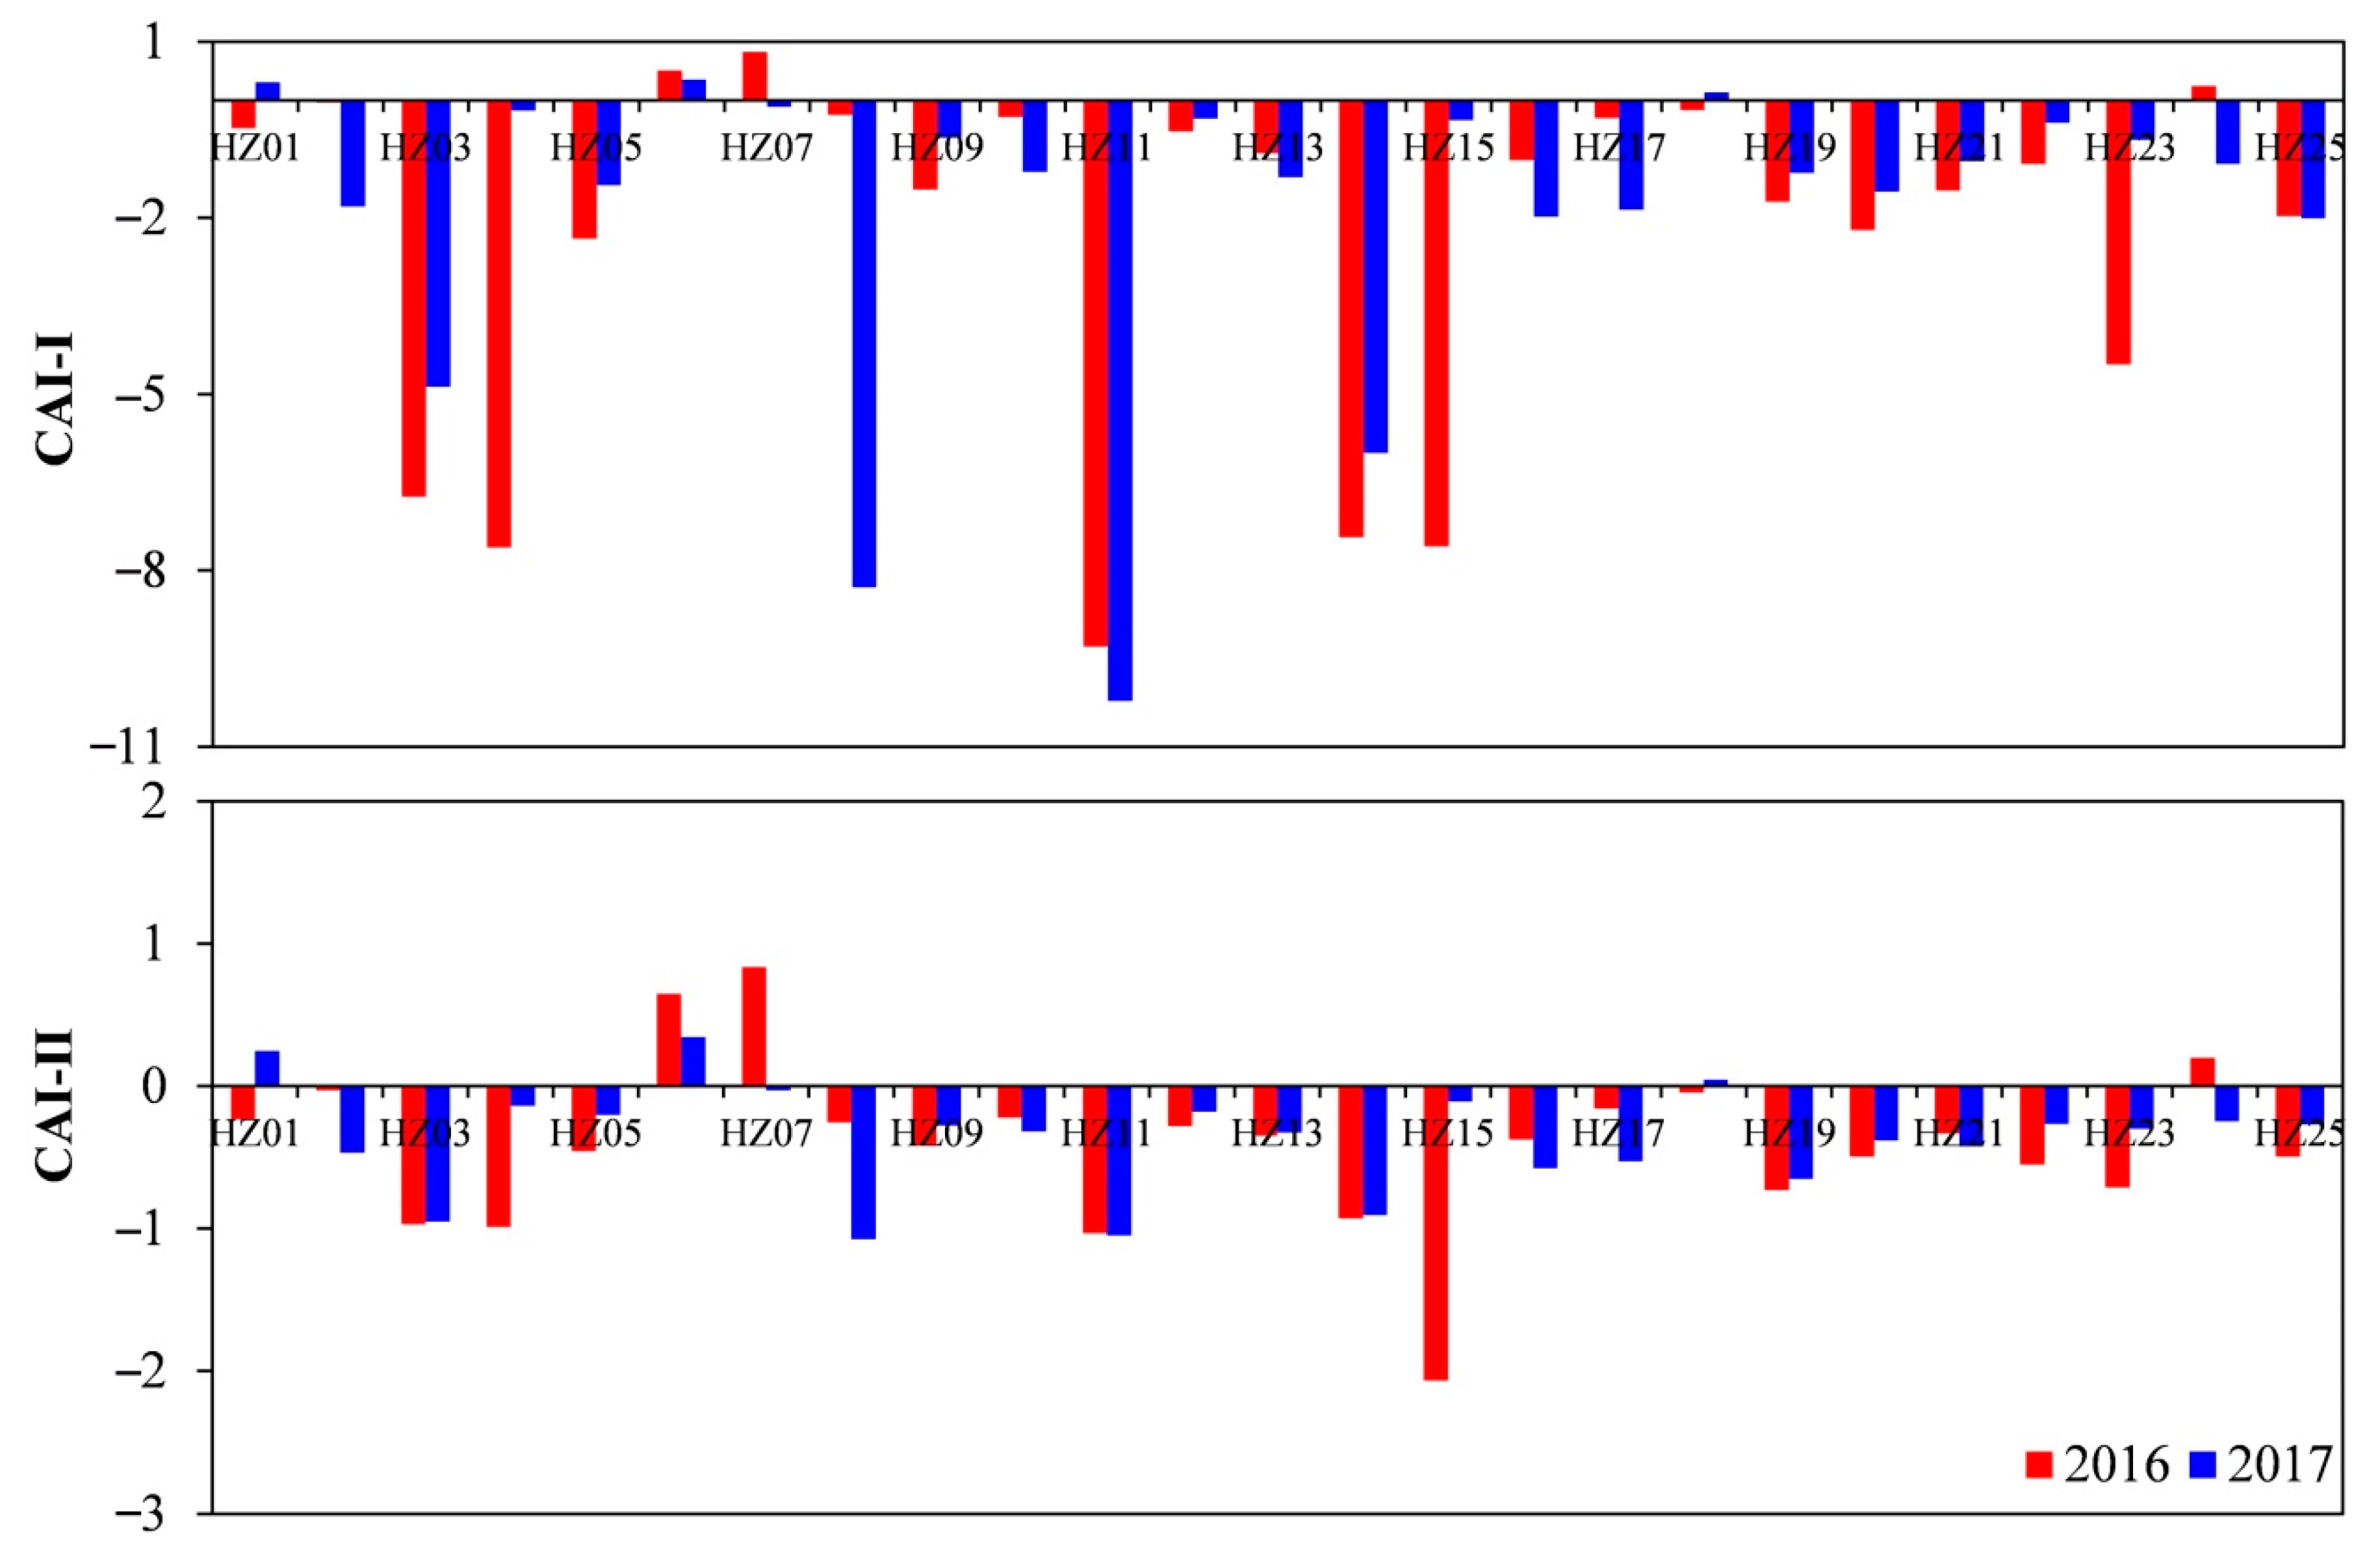
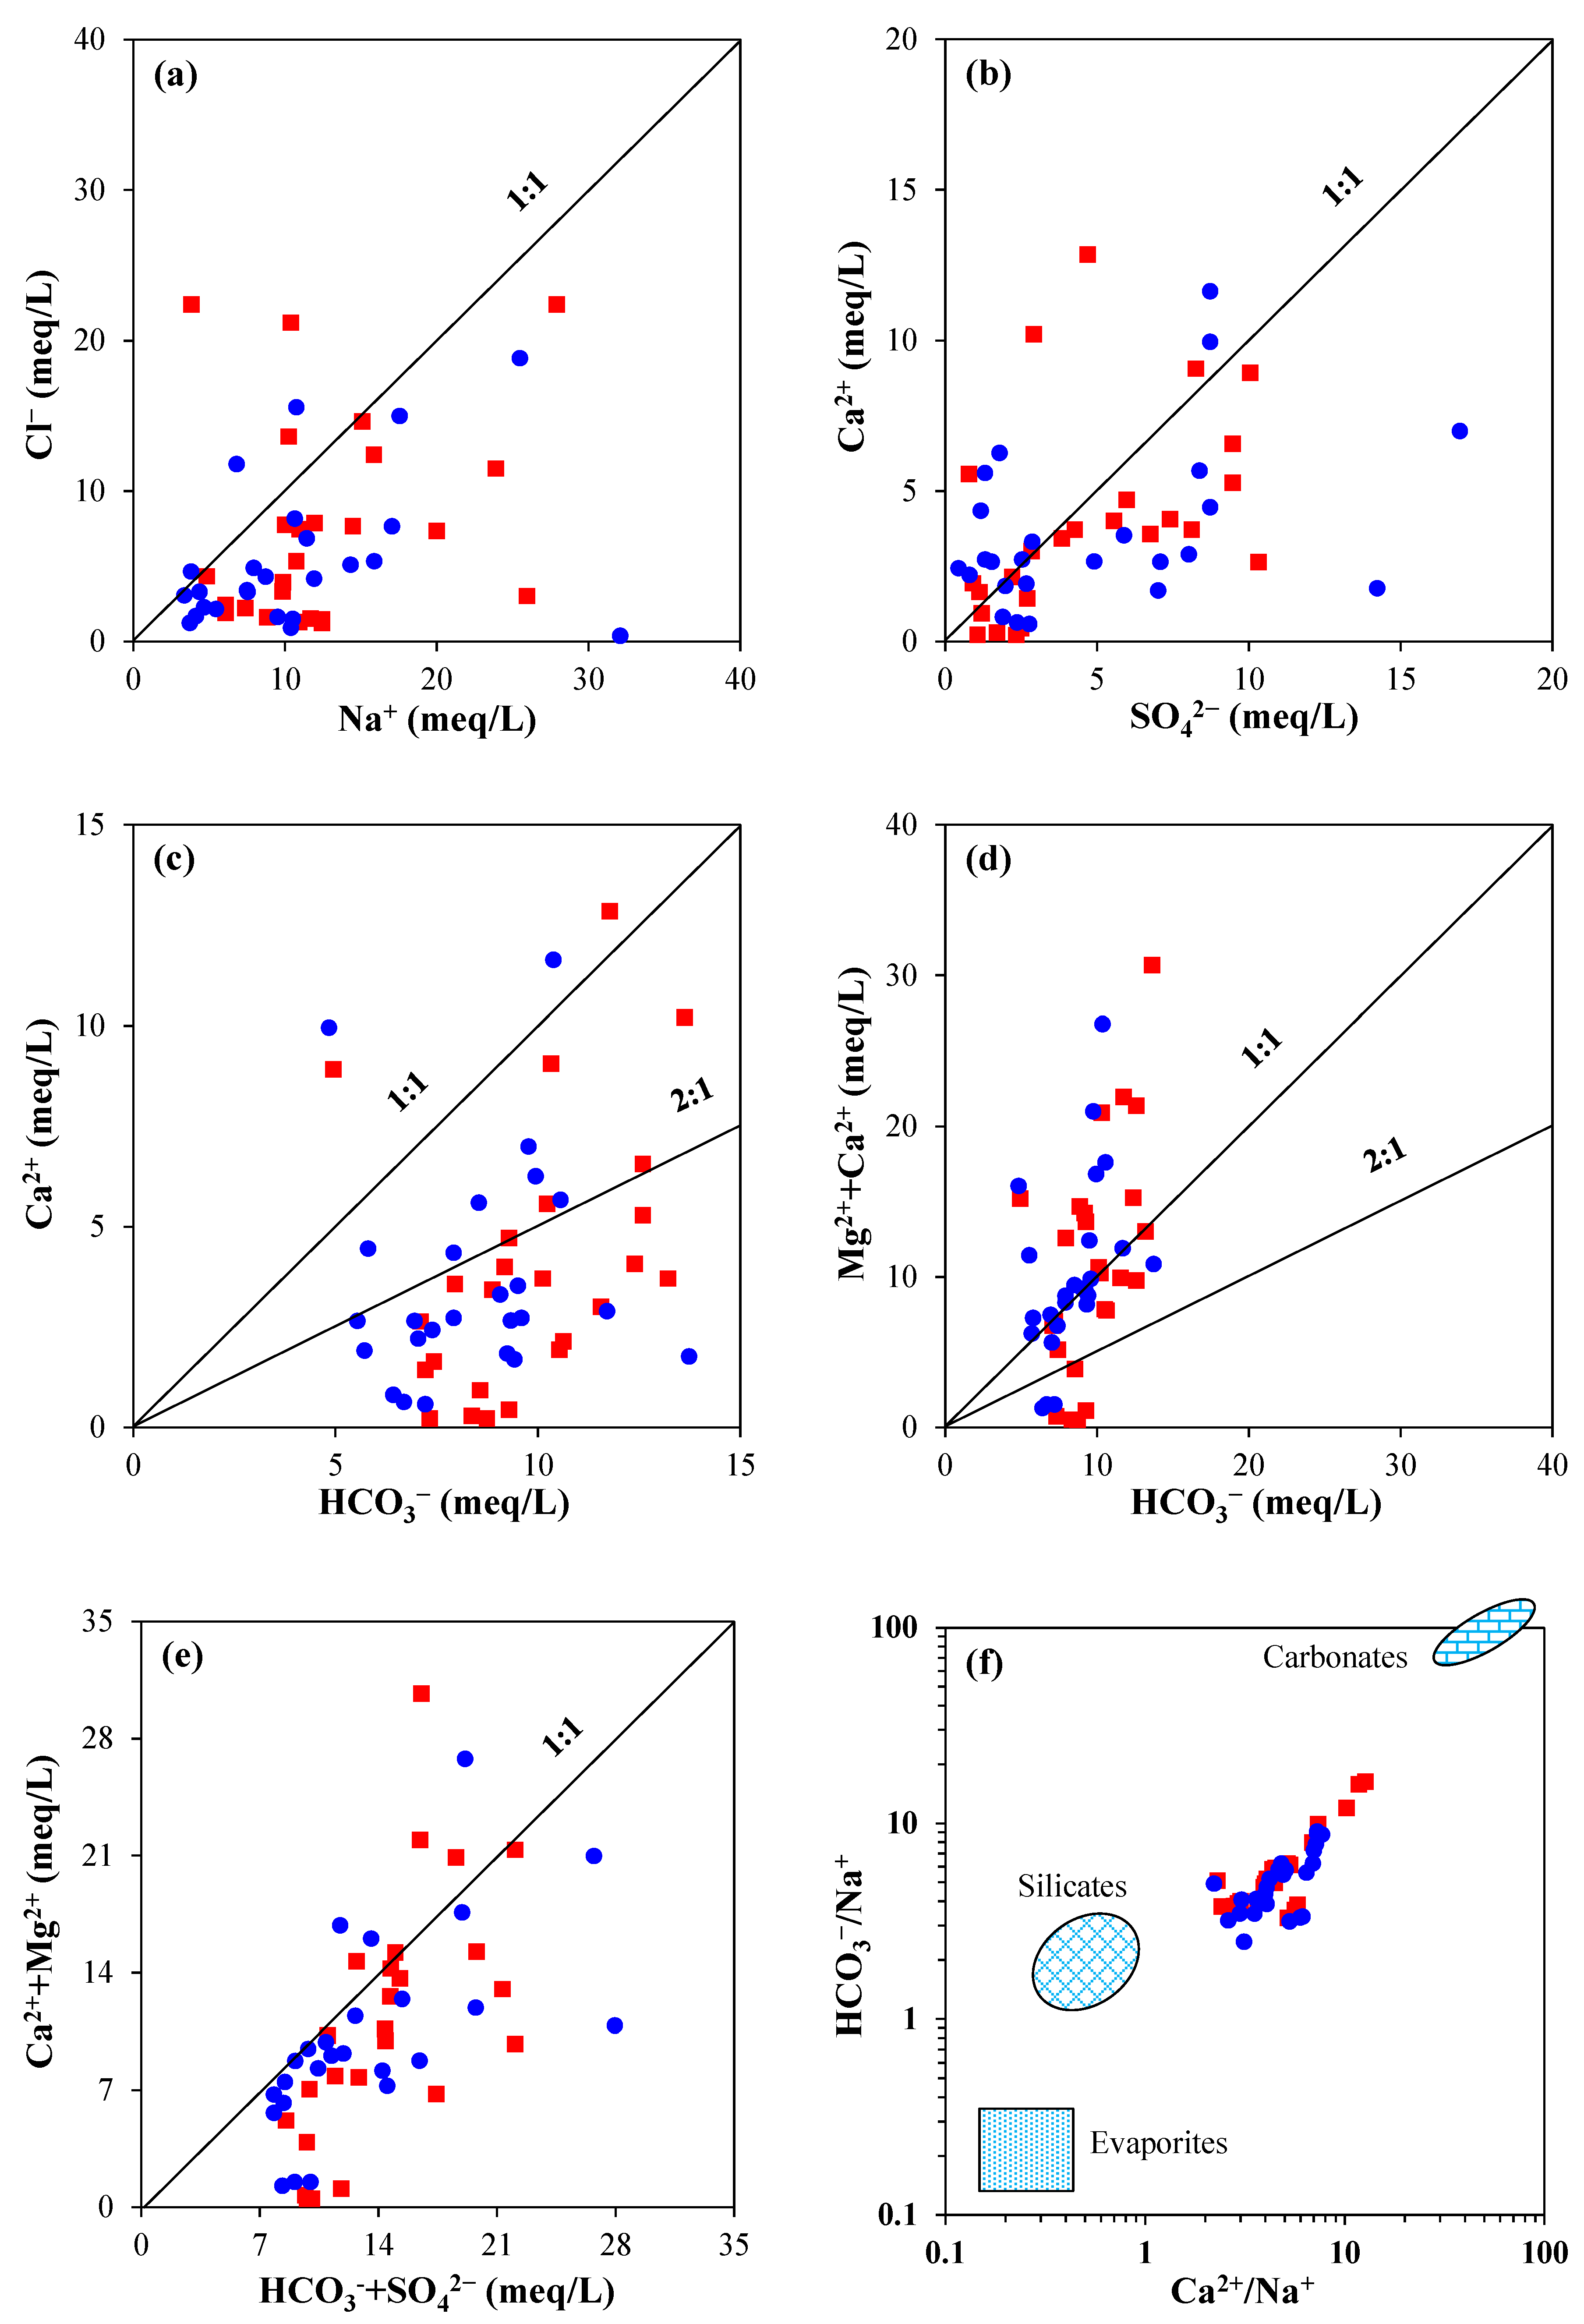
4.3. Processes Influencing Groundwater Chemistry
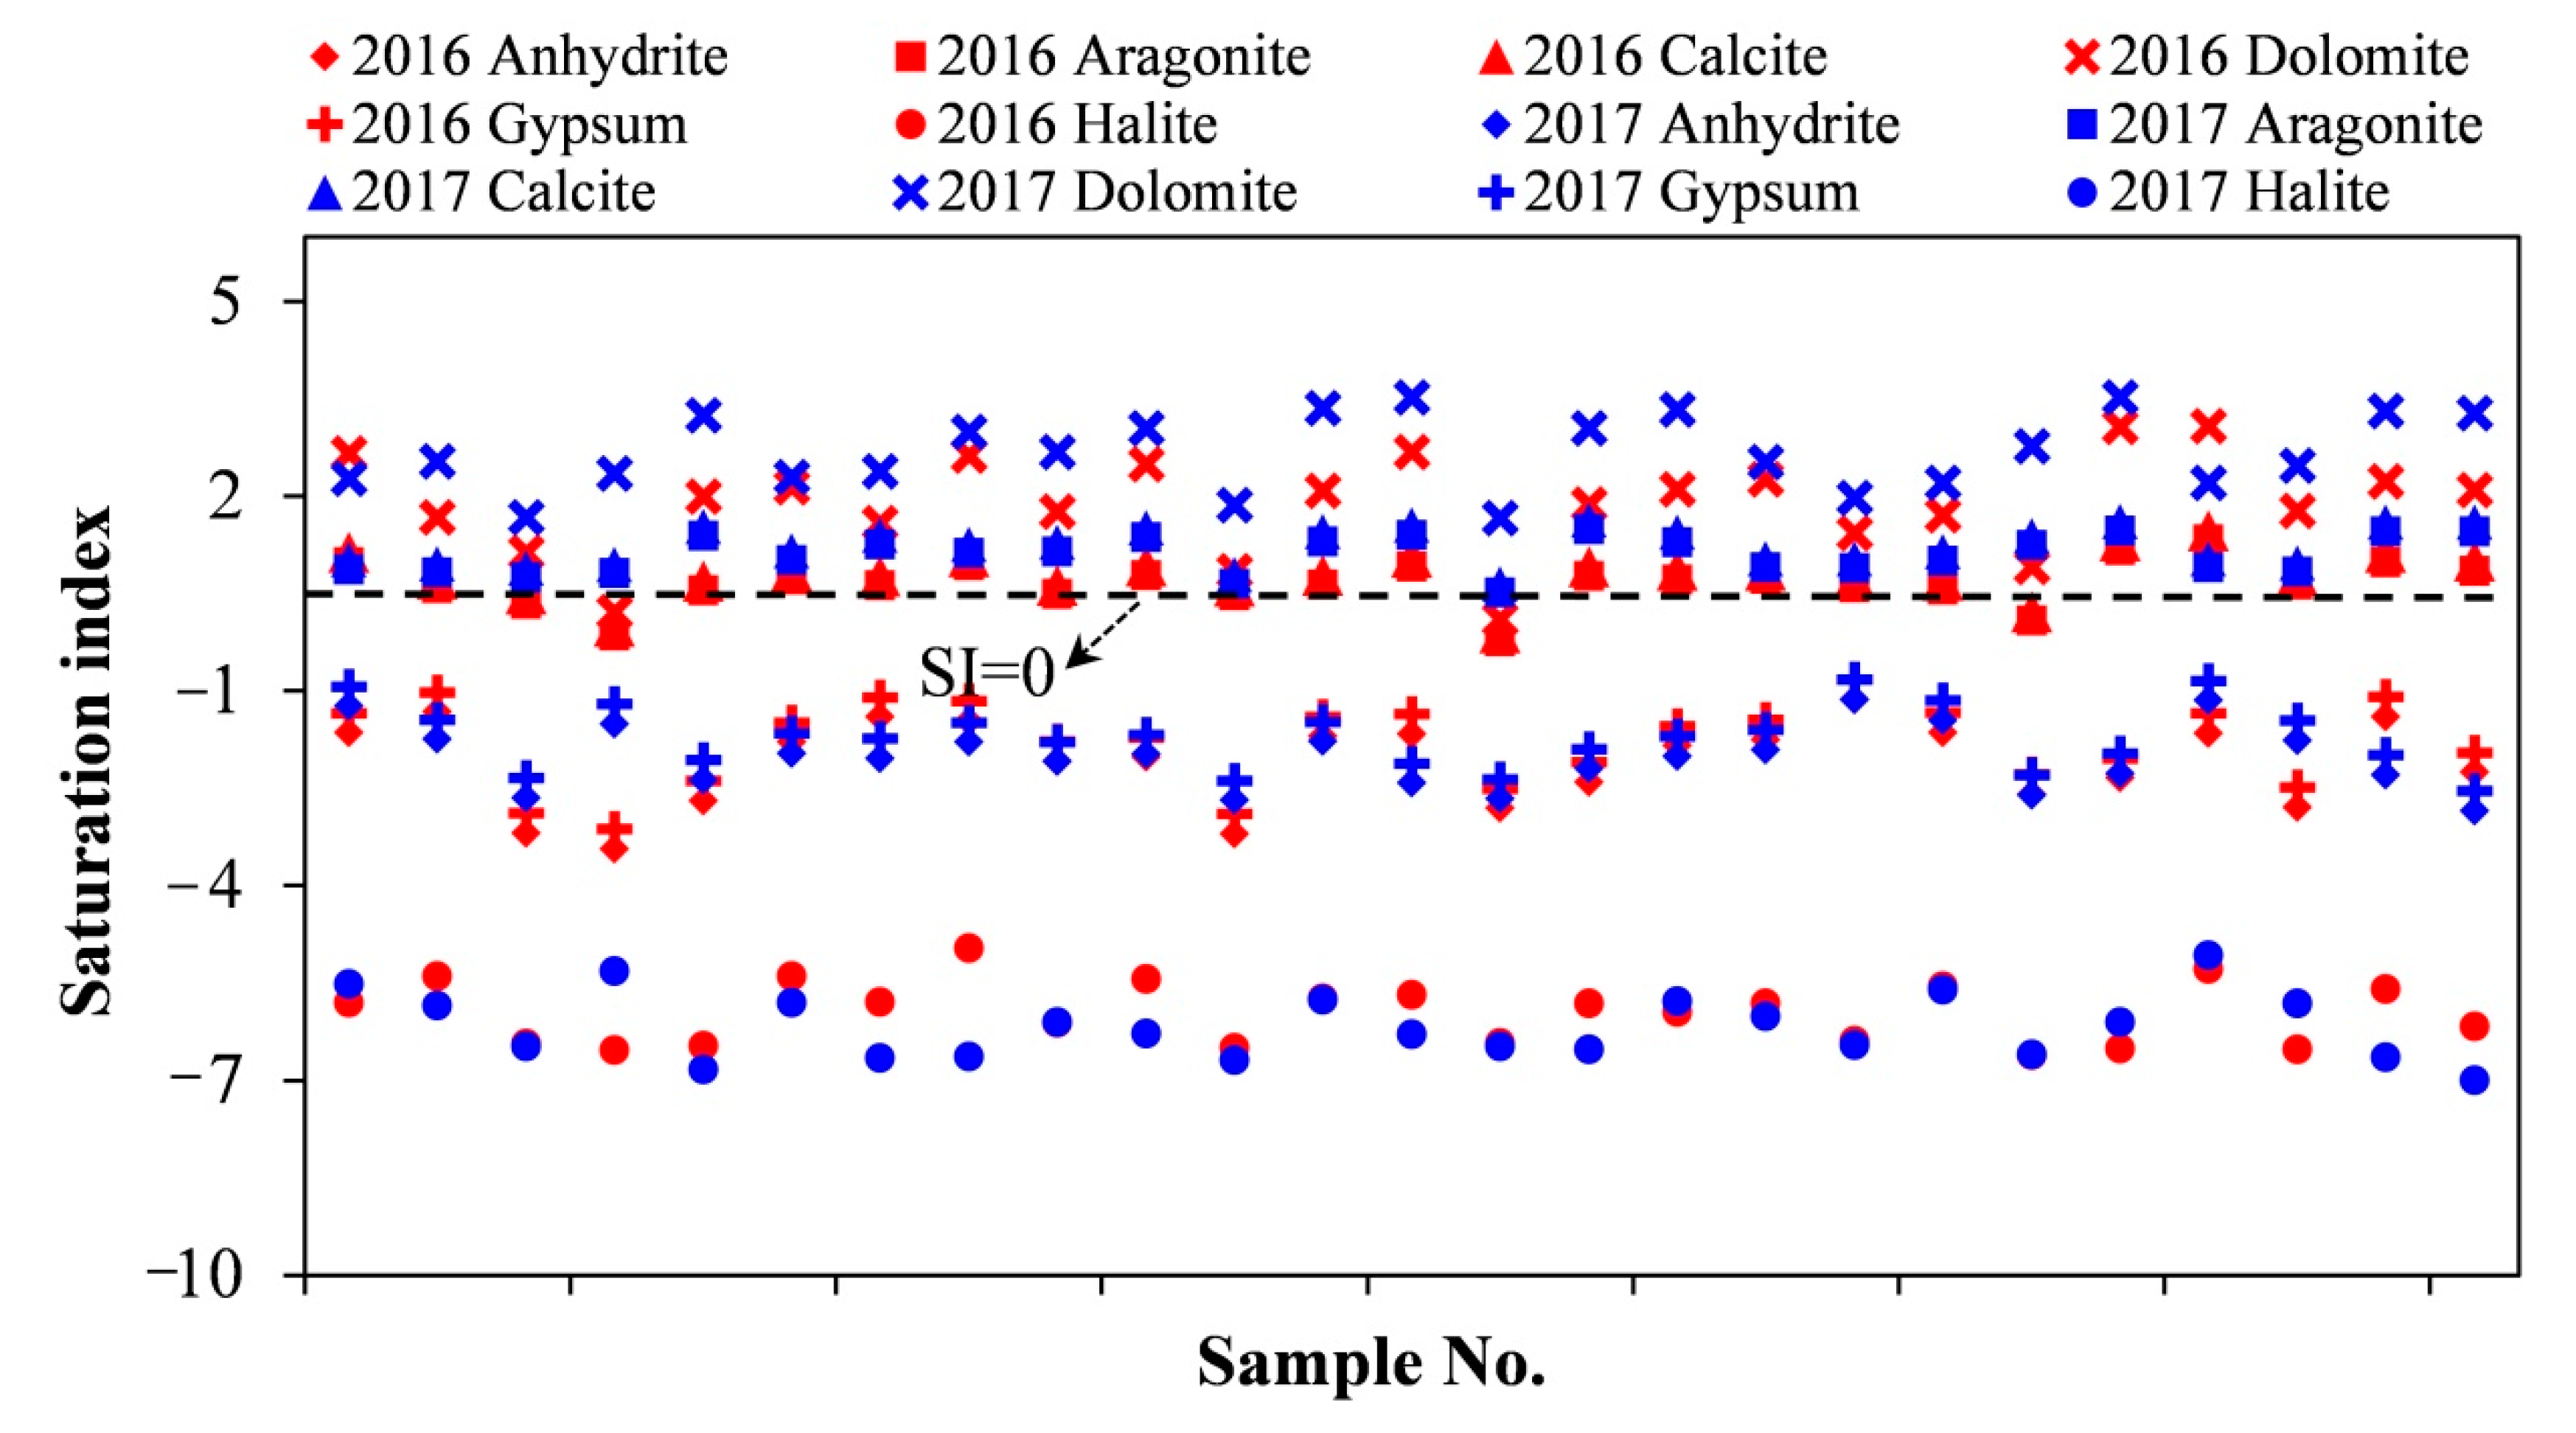
4.4. Saturation Index (SI)
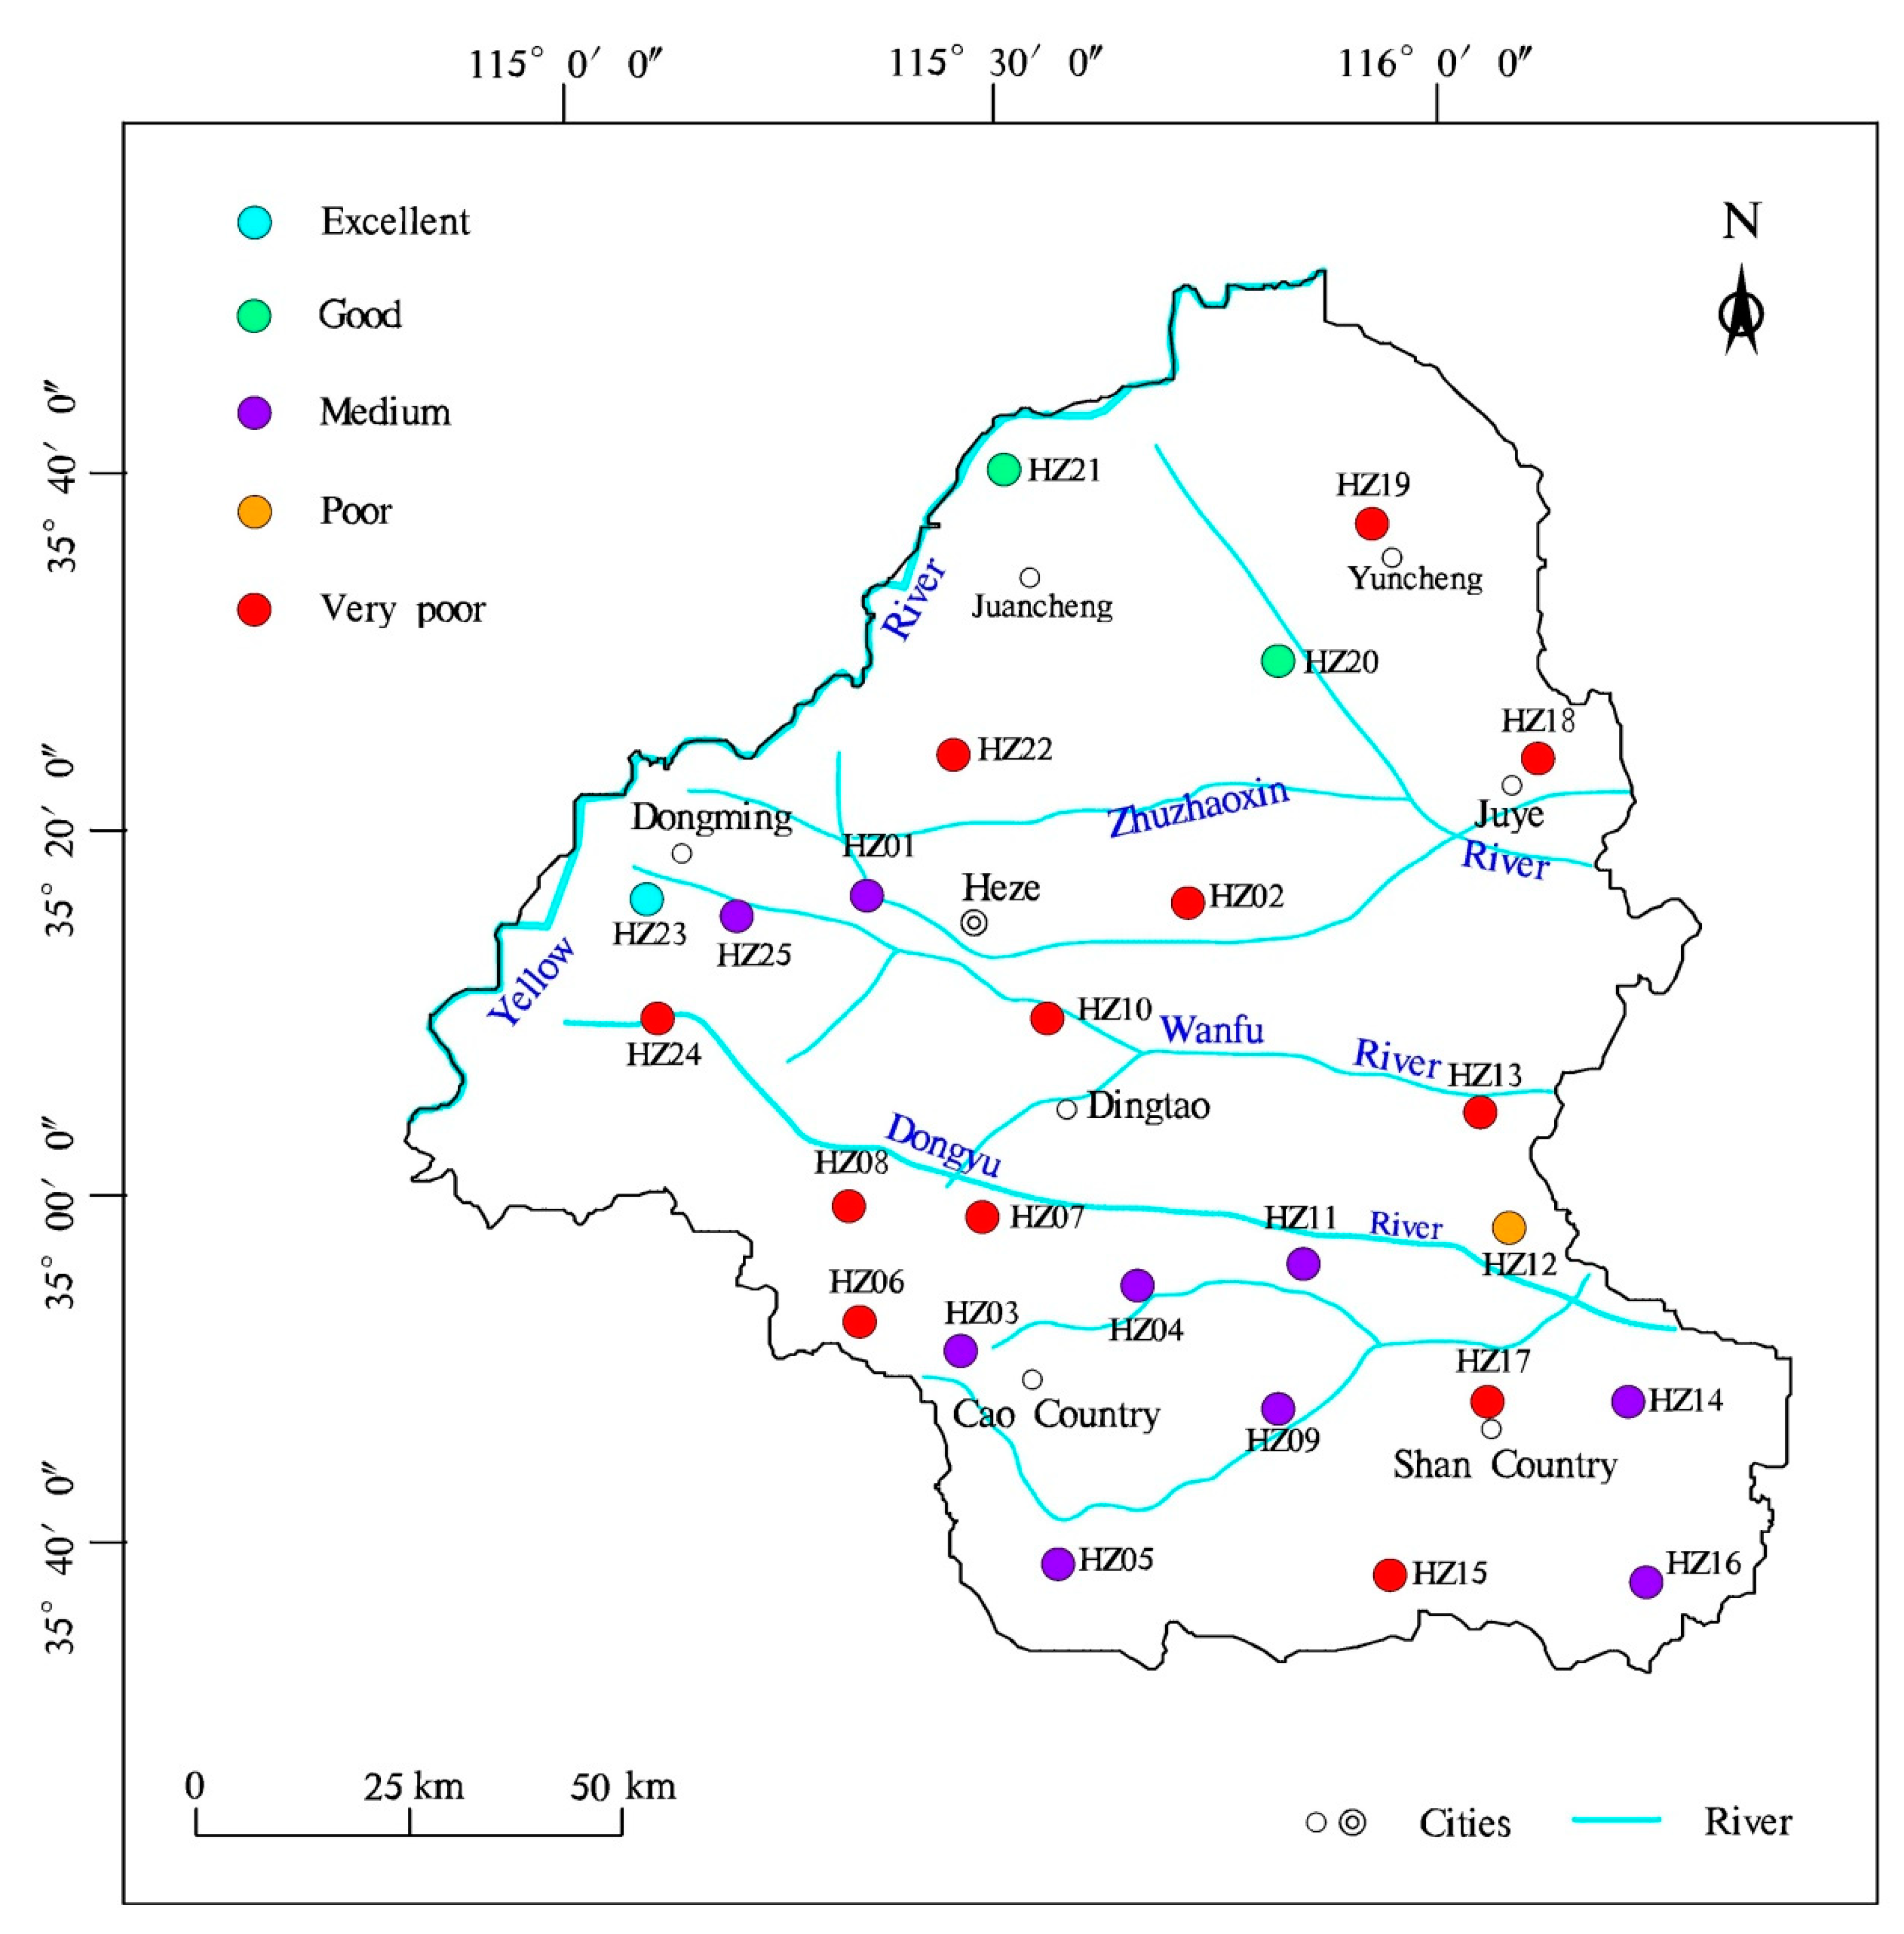
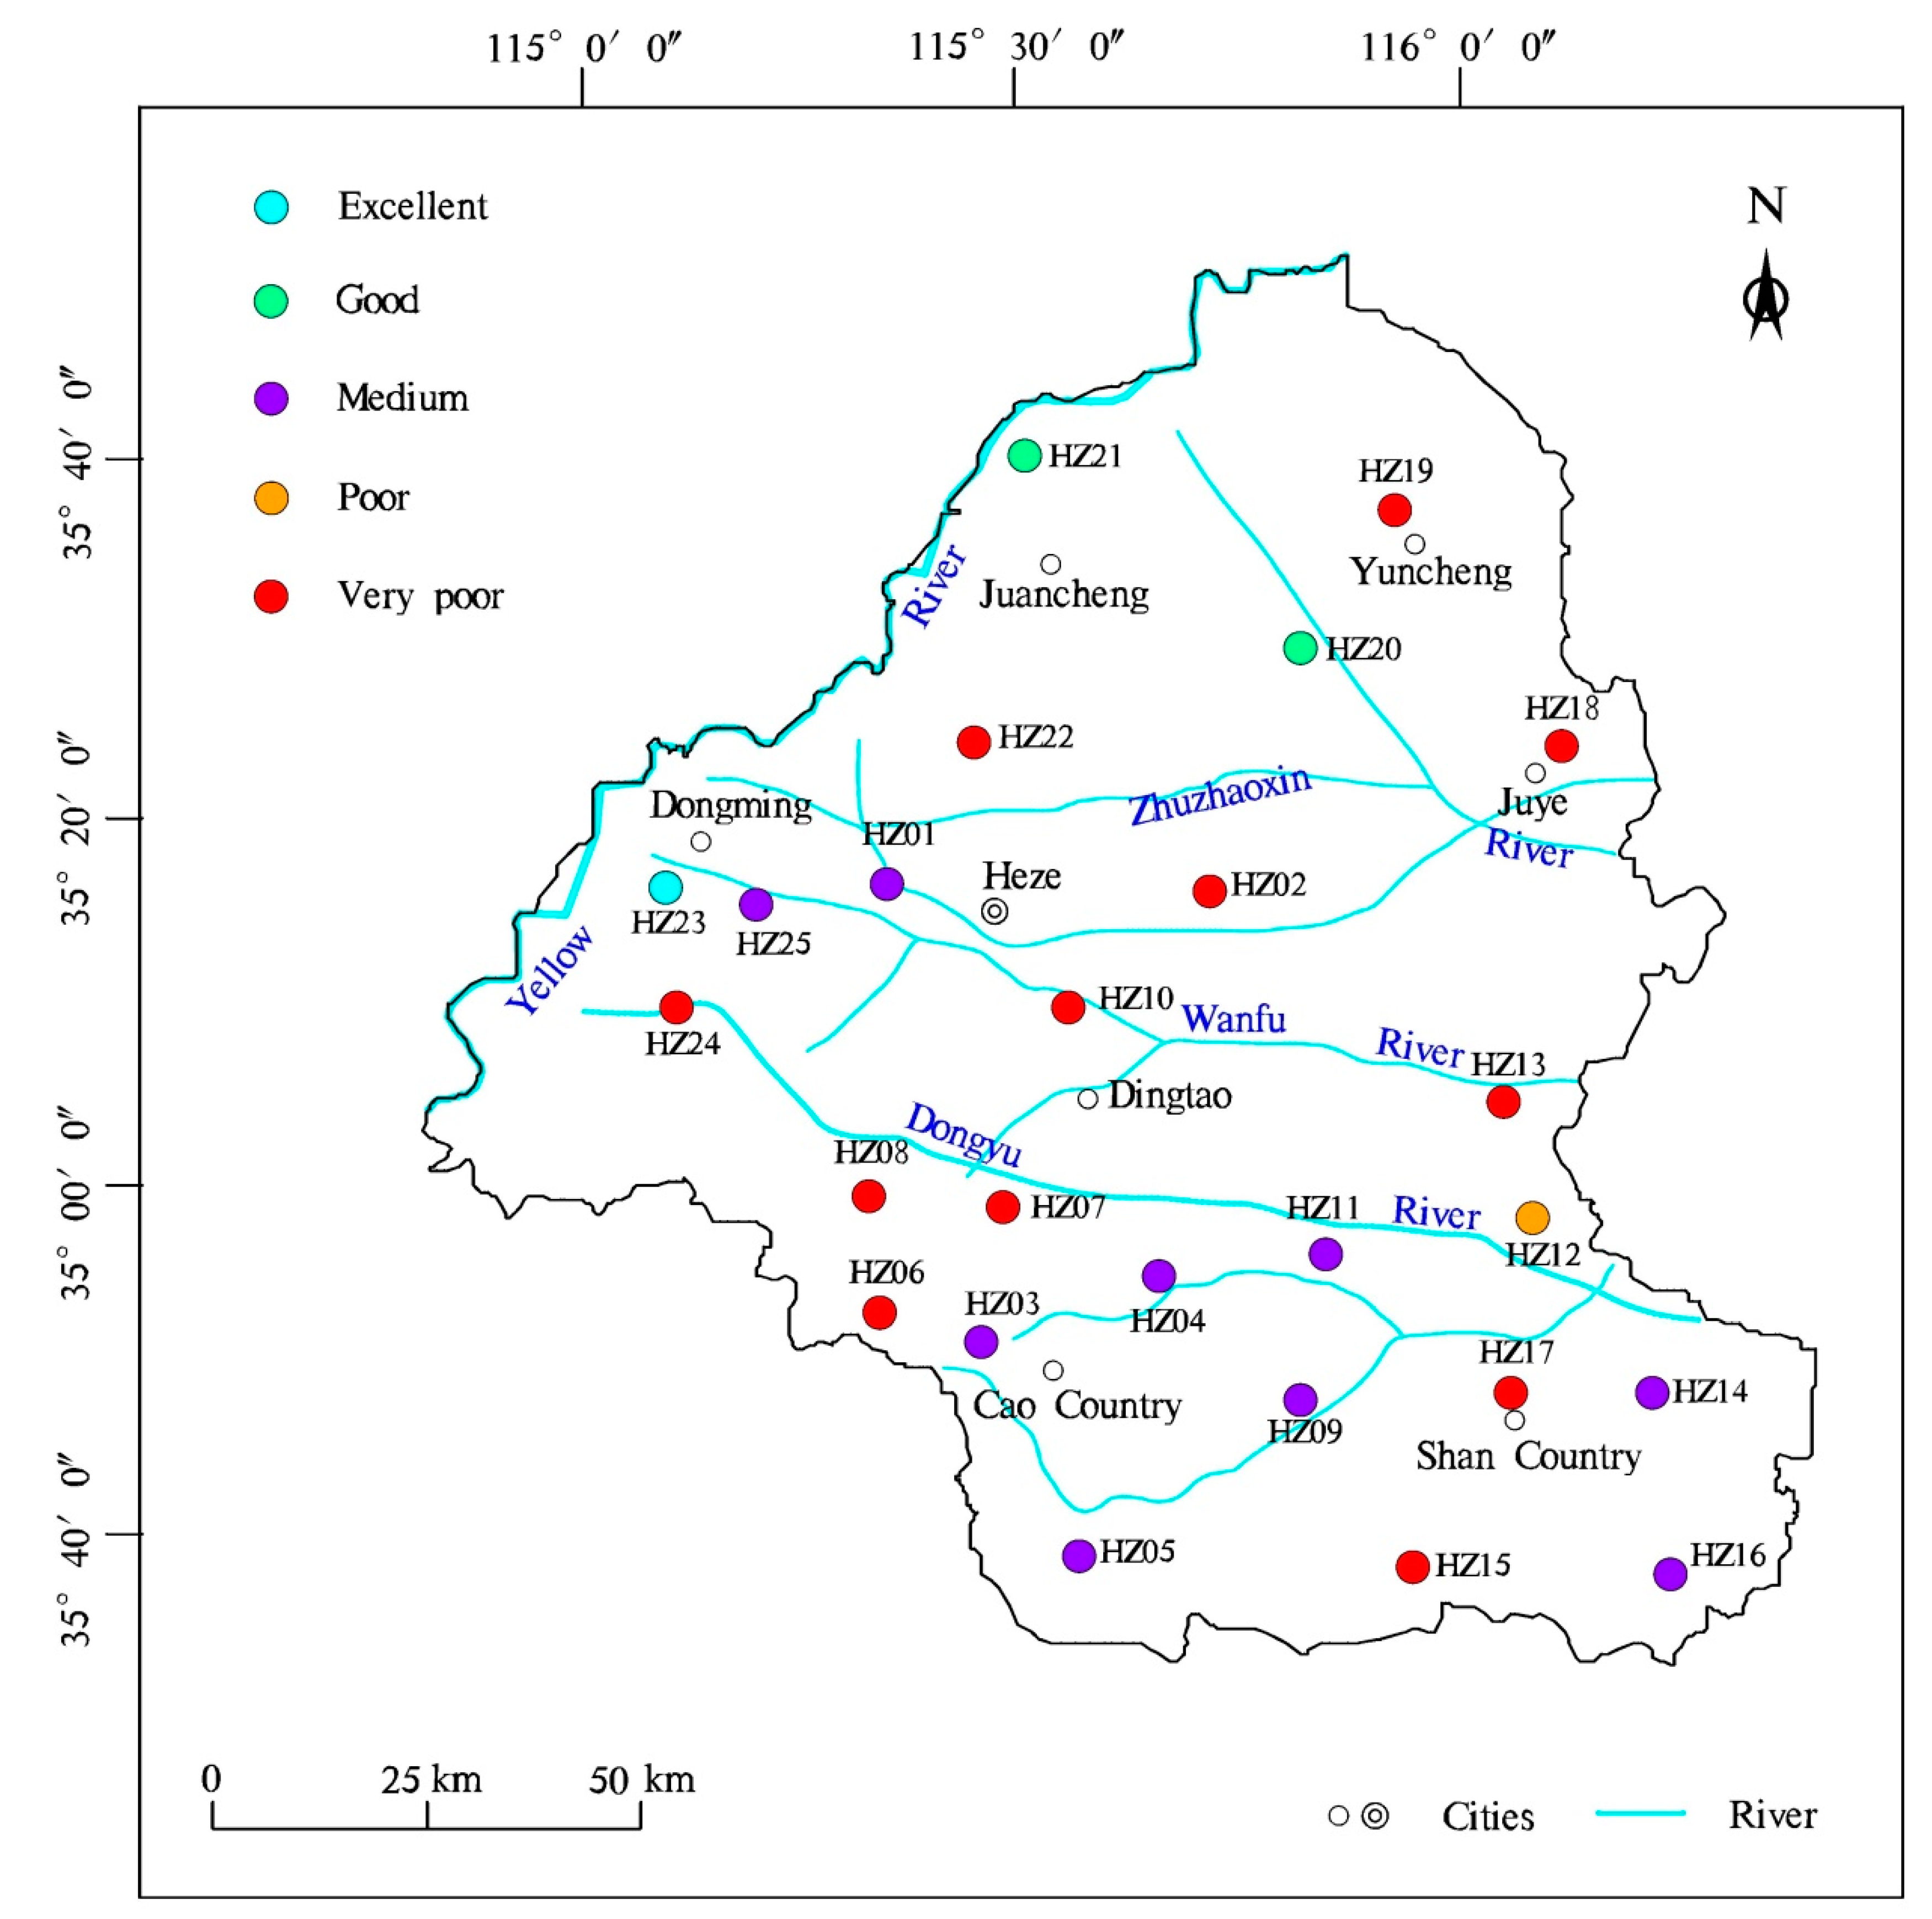
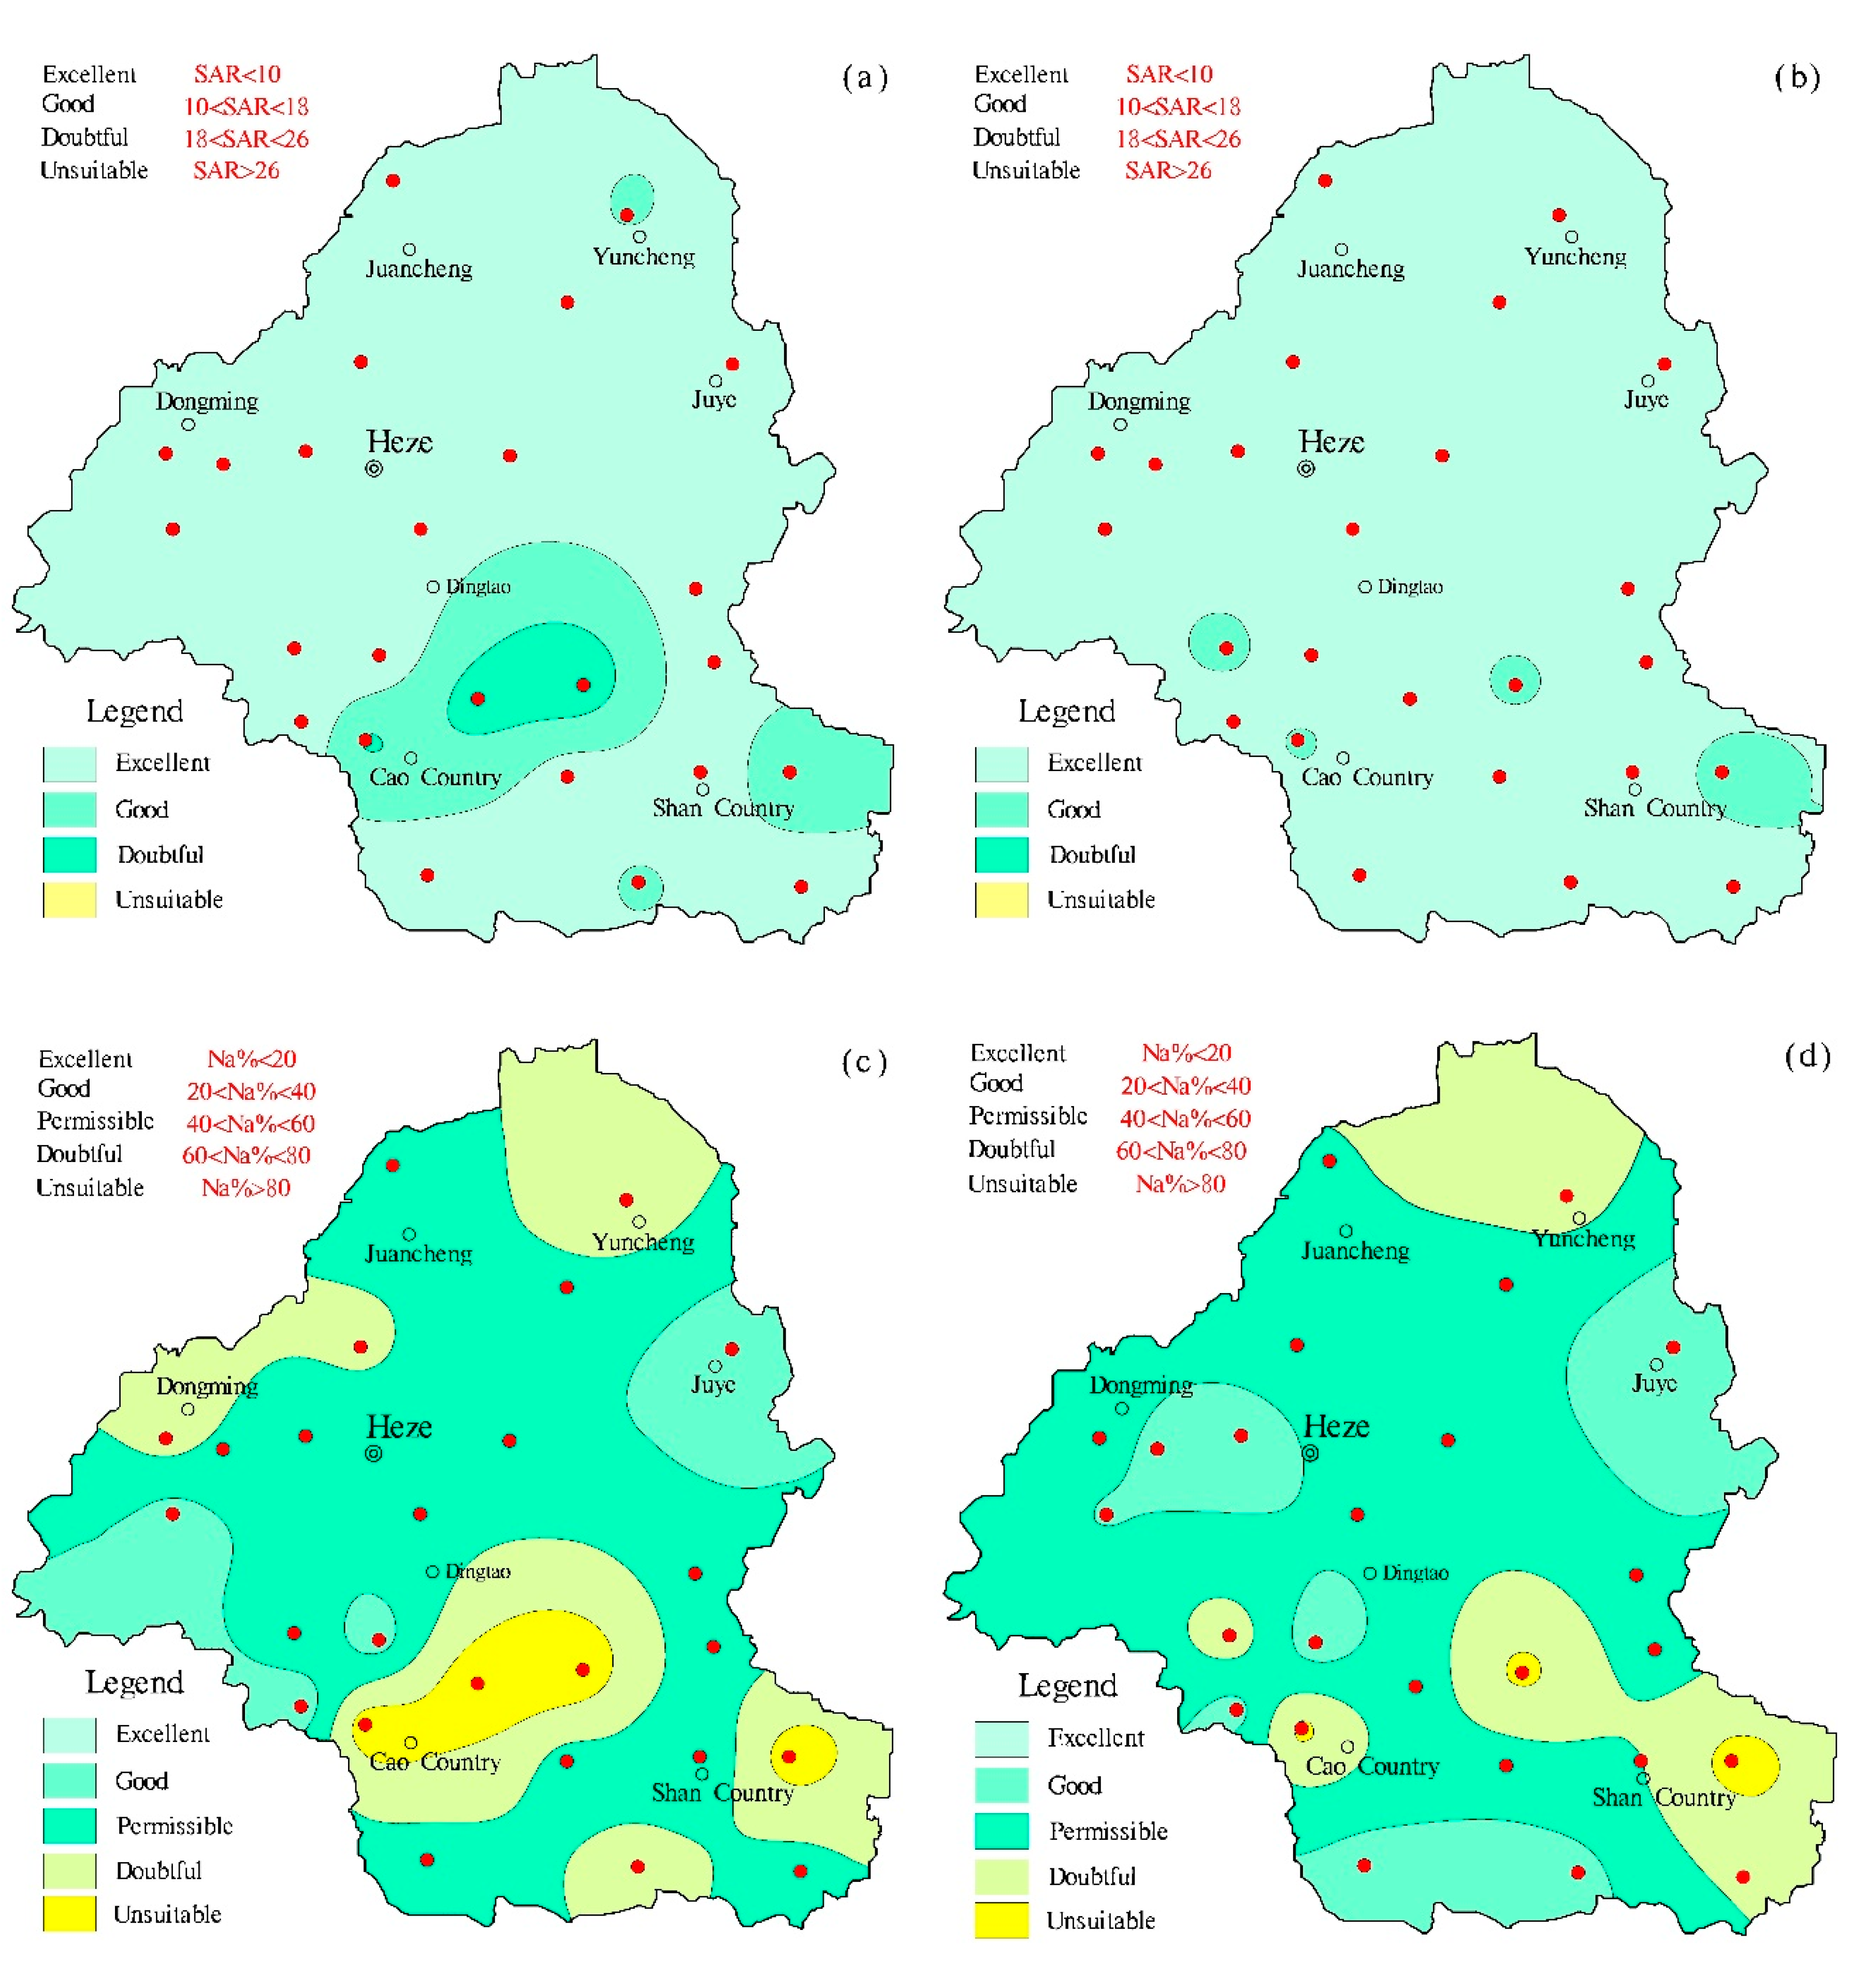
4.5. Water Quality Assessment
5. Conclusions
Author Contributions
Funding
Acknowledgments
Conflicts of Interest
References
- Yang, J.; Yu, Z.B.; Yi, P.; Aldahan, A. Assessment of groundwater quality and 222Rn distribution in the Xuzhou region, China. Environ. Monit. Assess. 2018, 190, 549. [Google Scholar] [CrossRef] [PubMed]
- Liu, J.T.; Gao, Z.J.; Wang, M.; Li, Y.Z.; Ma, Y.Y.; Shi, M.J.; Zhang, H.Y. Study on the dynamic characteristics of groundwater in the valley plain of Lhasa City. Environ. Earth Sci. 2018, 77, 646. [Google Scholar] [CrossRef]
- Qin, R.; Wu, Y.; Xu, Z.; Xie, D.; Zhang, C. Assessing the impact of natural and anthropogenic activities on groundwater quality in coastal alluvial aquifers of the lower Liaohe River Plain, NE China. Appl. Geochem. 2013, 31, 142–158. [Google Scholar] [CrossRef]
- Foster, S.; Chilton, J.; Nijsten, G.J.; Richts, A. Groundwater—A global focus on the ‘local resource’. Curr. Opin. Environ. Sustain. 2013, 5, 685–695. [Google Scholar] [CrossRef]
- An, Y.K.; Lu, W.X. Assessment of groundwater quality and groundwater vulnerability in the northern Ordos Cretaceous Basin, China. Arab. J. Geosci. 2018, 11, 118. [Google Scholar] [CrossRef]
- Kumar, P.J.S.; James, E.J. Geostatistical and geochemical model-assisted hydrogeochemical pattern recognition along the groundwater flow paths in Coimbatore district, South India. Environ. Dev. Sustain. 2019, 21, 369–384. [Google Scholar] [CrossRef]
- Wu, C.; Wu, X.; Qian, C.; Zhu, G. Hydrogeochemistry and groundwater quality assessment of high fluoride levels in the Yanchi endorheic region, northwest China. Appl. Geochem. 2018, 98, 404–417. [Google Scholar] [CrossRef]
- Abboud, I.A. Geochemistry and quality of groundwater of the Yarmouk basin aquifer, north Jordan. Environ. Geochem. Health 2018, 40, 1405–1435. [Google Scholar] [CrossRef]
- Li, P.Y.; Wu, J.H.; Qian, H. Hydrogeochemistry and Quality Assessment of Shallow Groundwater in the Southern Part of the Yellow River Alluvial Plain (Zhongwei Section), Northwest China. Earth Sci. Res. J. 2014, 18, 27–38. [Google Scholar] [CrossRef]
- Yang, Q.C.; Li, Z.J.; Ma, H.Y.; Wang, L.C.; Martín, J.D. Identification of the hydrogeochemical processes and assessment of groundwater quality using classic integrated geochemical methods in the Southeastern part of Ordos basin, China. Environ. Pollut. 2016, 218, 879–888. [Google Scholar] [CrossRef]
- Zaki, S.R.; Redwan, M.; Masoud, A.M.; Moneim, A.A.A. Chemical characteristics and assessment of groundwater quality in Halayieb area, southeastern part of the Eastern Desert, Egypt. Geosci. J. 2018, 23, 149–164. [Google Scholar] [CrossRef]
- Li, P.Y.; Wu, J.H.; Qian, H. Hydrochemical appraisal of groundwater quality for drinking and irrigation purposes and the major influencing factors: A case study in and around Hua County, China. Arab. J. Geosci. 2016, 9, 1–17. [Google Scholar] [CrossRef]
- Jain, C.K.; Vaid, U. Assessment of groundwater quality for drinking and irrigation purposes using hydrochemical studies in Nalbari district of Assam, India. Environ. Earth Sci. 2018, 77, 254. [Google Scholar] [CrossRef]
- Tiwari, A.K.; Ghione, R.; Maio, M.D.; Lavy, M. Evaluation of hydrogeochemical processes and groundwater quality for suitability of drinking and irrigation purposes: A case study in the Aosta Valley region, Italy. Arab. J. Geosci. 2017, 10, 264. [Google Scholar] [CrossRef]
- Zhang, T.; Cai, W.T.; Li, Y.Z.; Geng, T.T.; Zhang, Z.Y.; Lv, Y.G.; Zhao, M.; Liu, J.W. Ion chemistry of groundwater and the possible controls within Lhasa River Basin, SW Tibetan Plateau. Arab. J. Geosc. 2018, 11, 510. [Google Scholar] [CrossRef]
- Liu, J.T.; Gao, Z.J.; Wang, M.; Li, Y.Z.; Ma, Y.Y.; Shi, M.J.; Zhang, H.; Ma, Y. Hydrochemical characteristics and possible controls in the groundwater of the Yarlung Zangbo River Valley, China. Environ. Earth Sci. 2019, 78, 76. [Google Scholar] [CrossRef]
- Xiao, J.; Jin, Z.D.; Wang, J.; Zhang, F. Hydrochemical characteristics, controlling factors and solute sources of groundwater within the Tarim River Basin in the extreme arid region, NW Tibetan Plateau. Quatern. Int. 2015, 380, 237–246. [Google Scholar] [CrossRef]
- Nematollahi, M.J.; Ebrahimi, P.; Razmara, M.; Ghasemi, A. Hydrogeochemical investigations and groundwater quality assessment of Torbat-Zaveh plain, Khorasan Razavi, Iran. Environ. Monit. Assess. 2016, 188, 2. [Google Scholar] [CrossRef]
- Zhang, B.; Song, X.; Zhang, Y.; Han, D.; Tang, C.; Yu, Y.; Ma, Y. Hydrochemical characteristics and water quality assessment of surface water and groundwater in Songnen plain, Northeast China. Water Res. 2012, 46, 2737–2748. [Google Scholar] [CrossRef]
- Zhang, Q.; Wang, S.; Yousaf, M.; Wang, S.; Nan, Z.; Ma, J.; Wang, D.; Zang, F. Hydrochemical characteristics and water quality assessment of surface water in the northeast Tibetan plateau of China. Water Sci. Technol. Water Supply 2017, 5, 1757–1768. [Google Scholar] [CrossRef]
- Xu, J.Y.; Mao, L.; Zhang, T.; Wang, Z.S. The development and utilization of water resources and security assurance planning study in Heze City. China Popul. Resour. Environ. 2017, 27, 200–203. [Google Scholar]
- Richards, L. Diagnosis and improvement of saline and alkali soils. In United States Salinity Laboratory; (vol.60, Agriculture Handbook); US Department of Agriculture: Washington, DC, USA, 1954; p. 160. [Google Scholar]
- Wilcox, L.V. The quality of water for irrigation use. US Dep. Agric. Technol. Bull. 1948, 40, 962. [Google Scholar]
- Zhou, P.P.; Wang, Z.M.; Zhang, J.Y.; Yang, Z.X.; Li, X.L. Study on the hydrochemical characteristics of groundwater along the Taklimakan Desert Highway. Environ. Earth Sci. 2016, 75, 1378. [Google Scholar] [CrossRef]
- Li, P.Y.; Zhang, Y.T.; Yang, N.; Jing, L.J.; Yu, P.Y. Major Ion Chemistry and Quality Assessment of Groundwater in and Around a Mountainous Tourist Town of China. Expos. Health 2016, 8, 239–252. [Google Scholar] [CrossRef]
- Venturelli, G.; Boschetti, T.; Duchi, V. Na-carbonate waters of extreme composition: Possible origin and evolution. Geochem. J. 2003, 37, 351–366. [Google Scholar] [CrossRef]
- Toran, L.E.; Saunders, J.A. Modeling alternative paths of chemical evolution of Na-HCO3-type groundwater near Oak Ridge, Tennessee, USA. Hydrogeol. J. 1999, 7, 355–364. [Google Scholar] [CrossRef]
- Gibbs, R.J. Mechanisms controlling world water chemistry. Science 1970, 170, 870. [Google Scholar] [CrossRef]
- Xiao, J.; Jin, Z.D.; Zhang, F.; Wang, J. Solute geochemistry and its sources of the groundwaters in the Qinghai Lake catchment, NW China. J. Asian. Earth Sci. 2012, 52, 21–30. [Google Scholar] [CrossRef]
- Schoeller, H. Qualitative evaluation of groundwater resources. In Methods and Techniques of Groundwater Investigation and Development; Water Research Series; UNESCO: Paris, France, 1965; pp. 54–83. [Google Scholar]
- Zhang, Y.; Xu, M.; Li, X.; Qi, J.; Zhang, Q.; Guo, J.; Yu, L.; Zhao, R. Hydrochemical characteristics and multivariate statistical analysis of natural water system: A case study in Kangding County, Southwestern China. Water 2018, 10, 80. [Google Scholar] [CrossRef]
- Gaillardet, J.; Dupré, B.; Louvat, P.; Allegre, C.J. Global silicate weathering and CO2 consumption rates deduced from the chemistry of large rivers. Cheml. Geol. 1999, 159, 3–30. [Google Scholar] [CrossRef]
- Ministry of Natural Resources of the People’s Republic of China. Standard for Groundwater Quality of China; Ministry of Natural Resources of the People’s Republic of China: Beijing, China, 2017.
- Li, Y.; Ji, L.J.; Dou, B.C.; Li, F.R.; Sun, J.F. Research on characteristics of groundwater quality and slection of assessment method in Liaocheng. J. Water Resour. Water Eng. 2015, 26, 29–34. [Google Scholar]
- Ma, Y.H.; Su, C.L.; Liu, W.J.; Zhu, Y.P.; Li, J.X. Identification of sulfate sources in the groundwater system of Zaozhuang: Evidences from isotopic and hydrochemical characteristics. Environ. Sci. 2016, 37, 4690–4699. [Google Scholar]


| Chronostratigraphic Unit | Lithostratigraphic Unit | Code | Thickness (m) | ||
|---|---|---|---|---|---|
| Erathem | System | Group | Formation | ||
| Cenozoic | Quaternary | Huanghe Formation | QHh | 15–30 | |
| Pingyuan Formation | QP | 160–210 | |||
| Neogene | Huanghua Group | Minghuazhen Formation | NhM | 500–700 | |
| Guantao Formation | NhG | 170–200 | |||
| Paleogene | Guanzhuang Group | Dawenkou Formation | EgD | 0–260 | |
| Palaeozoic | Permian | Shihezi Formation | PŜ | 0–200 | |
| Yuemeigou Group | Shanxi Formation | PyŜ | 0–160 | ||
| Carboniferous | Taiyuan Formation | C-PyT | 0–180 | ||
| Bnexi Formation | CyB | 0–20 | |||
| Ordovician | Majiagou Formation | OM | 800 | ||
| Equation | Equation | Range | Water class | Reference |
|---|---|---|---|---|
| 1 | <10 | Excellent | [22] | |
| 10–18 | Good | |||
| 18–26 | Doubtful | |||
| >26 | Unsuitable (S4) | |||
| 2 | <20 | Excellent | [23] | |
| 20–40 | Good | |||
| 40–60 | Permissible | |||
| 60–80 | Doubtful | |||
| >80 | Unsuitable |
| Parameters | 2016 | 2017 | ||||||
|---|---|---|---|---|---|---|---|---|
| Max | Min | Mean | SD | Max | Min | Mean | SD | |
| pH | 8.66 | 7.28 | 7.88 | 0.37 | 8.79 | 7.51 | 8.41 | 0.35 |
| TH (mg/L) | 1521.34 | 24.67 | 546.16 | 372.25 | 1329.54 | 63.59 | 503.77 | 294.31 |
| TDS (mg/L) | 2687.00 | 536.00 | 1191.12 | 542.68 | 2812.00 | 552.00 | 1174.24 | 610.56 |
| Na+ (mg/L) | 641.80 | 88.65 | 287.06 | 142.33 | 738.19 | 77.71 | 244.58 | 159.20 |
| K+ (mg/L) | 6.55 | 0.35 | 1.53 | 1.18 | 30.09 | 0.21 | 3.26 | 7.10 |
| Ca2+ (mg/L) | 256.83 | 4.28 | 80.37 | 66.54 | 232.65 | 11.57 | 73.55 | 54.72 |
| Mg2+ (mg/L) | 245.78 | 2.60 | 83.92 | 57.79 | 181.83 | 5.61 | 77.83 | 45.85 |
| HCO3− (mg/L) | 831.40 | 302.33 | 595.17 | 134.31 | 837.68 | 295.33 | 513.13 | 128.39 |
| Cl− (mg/L) | 794.86 | 42.97 | 269.58 | 239.63 | 668.50 | 13.86 | 194.79 | 174.32 |
| SO42− (mg/L) | 495.86 | 37.62 | 223.96 | 154.54 | 813.49 | 21.18 | 238.54 | 207.42 |
| NO3− (mg/L) | 189.64 | 0 | 8.92 | 37.77 | 28.74 | 0 | 2.36 | 5.87 |
| T (°C) | 20.1 | 15.4 | 13.1 | 3.54 | 19.3 | 12.6 | 15.2 | 3.16 |
| SI (Anhydrite) | −1.13 | −3.44 | −2.09 | 0.65 | −1.14 | −2.85 | −2.02 | 0.49 |
| SI (Aragonite) | 1.33 | −0.24 | 0.64 | 0.36 | 1.49 | 0.51 | 1.09 | 0.29 |
| SI (Calcite) | 1.47 | −0.10 | 0.78 | 0.36 | 1.63 | 0.65 | 1.24 | 0.29 |
| SI (Dolomite) | 3.08 | 0.11 | 1.86 | 0.77 | 3.53 | 1.66 | 2.66 | 0.58 |
| SI (Gypsum) | −0.82 | −3.13 | −1.78 | 0.65 | −0.83 | −2.54 | −1.72 | 0.49 |
| SI (Halite) | −4.96 | −6.61 | −5.96 | 0.48 | −5.07 | −7.00 | −6.17 | 0.50 |
| Class | TDS | TH | NO3− | SO42− | Cl− | Na+ | COD | Suitability |
|---|---|---|---|---|---|---|---|---|
| I | 300≤ | 150≤ | 8.86≤ | 50≤ | 50≤ | 100≤ | 1≤ | Excellent |
| II | 500≤ | 300≤ | 22.14≤ | 150≤ | 150≤ | 150≤ | 2≤ | Good |
| III | 1000≤ | 450≤ | 88.57≤ | 250≤ | 250≤ | 200≤ | 3≤ | Medium |
| IV | 2000≤ | 650≤ | 132.86≤ | 350≤ | 350≤ | 400≤ | 10≤ | Poor |
| V | >2000 | >650 | >132.86 | >350 | >350 | >400 | >10 | Very poor |
| 2016 | 2017 | |||||||||||
|---|---|---|---|---|---|---|---|---|---|---|---|---|
| FCE | Water Quality | SAR | Water Quality | Na% | Water Quality | FCE | Water Quality | SAR | Water Quality | Na% | Water Quality | |
| HZ01 | III | Medium | 4.20 | Excellent | 44.62 | Permissible | V | Very Poor | 2.94 | Excellent | 28.70 | Good |
| HZ02 | V | Poor | 4.67 | Excellent | 42.02 | Permissible | IV | Poor | 5.87 | Excellent | 54.66 | Permissible |
| HZ03 | III | Medium | 19.49 | Doubtful | 94.22 | Unsuitable | III | Medium | 11.92 | Good | 88.21 | Unsuitable |
| HZ04 | III | Medium | 21.98 | Doubtful | 95.67 | Unsuitable | V | Very Poor | 5.92 | Excellent | 49.95 | Permissible |
| HZ05 | III | Medium | 3.74 | Excellent | 48.67 | Permissible | I | Excellent | 1.86 | Excellent | 29.67 | Good |
| HZ06 | V | Very Poor | 2.65 | Excellent | 25.39 | Good | V | Very Poor | 2.35 | Excellent | 31.12 | Good |
| HZ07 | V | Very Poor | 1.75 | Excellent | 28.53 | Good | III | Medium | 1.55 | Excellent | 26.34 | Good |
| HZ08 | V | Very Poor | 8.54 | Excellent | 56.71 | Permissible | V | Very Poor | 13.78 | Good | 74.76 | Doubtful |
| HZ09 | III | Medium | 4.44 | Excellent | 49.93 | Permissible | III | Medium | 3.91 | Excellent | 48.95 | Permissible |
| HZ10 | V | Very Poor | 5.86 | Excellent | 52.02 | Permissible | III | Medium | 3.51 | Excellent | 45.10 | Permissible |
| HZ11 | III | Medium | 24.81 | Doubtful | 96.13 | Unsuitable | III | Medium | 11.95 | Good | 87.32 | Unsuitable |
| HZ12 | IV | Poor | 4.77 | Excellent | 48.79 | Permissible | IV | Poor | 4.46 | Excellent | 48.31 | Permissible |
| HZ13 | V | Very Poor | 5.24 | Excellent | 48.78 | Permissible | III | Medium | 3.55 | Excellent | 45.55 | Permissible |
| HZ14 | III | Medium | 16.73 | Good | 91.85 | Unsuitable | III | Medium | 12.11 | Good | 87.47 | Unsuitable |
| HZ15 | V | Very Poor | 11.46 | Good | 71.70 | Doubtful | III | Medium | 2.09 | Excellent | 33.44 | Good |
| HZ16 | III | Medium | 4.67 | Excellent | 50.35 | Permissible | IV | Poor | 7.59 | Excellent | 64.47 | Doubtful |
| HZ17 | III | Medium | 3.76 | Excellent | 41.40 | Permissible | III | Medium | 5.90 | Excellent | 59.44 | Permissible |
| HZ18 | V | Very Poor | 1.76 | Excellent | 24.87 | Excellent | V | Very Poor | 1.35 | Excellent | 19.99 | Excellent |
| HZ19 | V | Very Poor | 10.89 | Good | 74.82 | Doubtful | IV | Poor | 8.95 | Excellent | 70.19 | Doubtful |
| HZ20 | II | Good | 3.79 | Excellent | 54.27 | Permissible | II | Good | 3.25 | Excellent | 49.38 | Permissible |
| HZ21 | II | Good | 3.26 | Excellent | 46.51 | Permissible | II | Good | 4.96 | Excellent | 58.48 | Permissible |
| HZ22 | V | Very Poor | 9.37 | Excellent | 64.79 | Doubtful | V | Very poor | 7.87 | Excellent | 55.38 | Permissible |
| HZ23 | I | Excellent | 6.35 | Excellent | 69.55 | Doubtful | III | Good | 4.59 | Excellent | 47.99 | Permissible |
| HZ24 | V | Very Poor | 3.09 | Excellent | 31.98 | Good | II | Good | 2.41 | Excellent | 38.65 | Good |
| HZ25 | III | Medium | 5.00 | Excellent | 56.02 | Permissible | II | Good | 2.03 | Excellent | 35.72 | Good |
© 2019 by the authors. Licensee MDPI, Basel, Switzerland. This article is an open access article distributed under the terms and conditions of the Creative Commons Attribution (CC BY) license (http://creativecommons.org/licenses/by/4.0/).
Share and Cite
Gao, Z.; Liu, J.; Feng, J.; Wang, M.; Wu, G. Hydrogeochemical Characteristics and the Suitability of Groundwater in the Alluvial-Diluvial Plain of Southwest Shandong Province, China. Water 2019, 11, 1577. https://doi.org/10.3390/w11081577
Gao Z, Liu J, Feng J, Wang M, Wu G. Hydrogeochemical Characteristics and the Suitability of Groundwater in the Alluvial-Diluvial Plain of Southwest Shandong Province, China. Water. 2019; 11(8):1577. https://doi.org/10.3390/w11081577
Chicago/Turabian StyleGao, Zongjun, Jiutan Liu, Jianguo Feng, Min Wang, and Guangwei Wu. 2019. "Hydrogeochemical Characteristics and the Suitability of Groundwater in the Alluvial-Diluvial Plain of Southwest Shandong Province, China" Water 11, no. 8: 1577. https://doi.org/10.3390/w11081577
APA StyleGao, Z., Liu, J., Feng, J., Wang, M., & Wu, G. (2019). Hydrogeochemical Characteristics and the Suitability of Groundwater in the Alluvial-Diluvial Plain of Southwest Shandong Province, China. Water, 11(8), 1577. https://doi.org/10.3390/w11081577