1. Introduction
The redesign of the stormwater management systems is fundamental in addressing the issues that lead to the decaying situation of flooding and water pollution in most Brazilian large cities, in which the upstream flows increase by urbanization and stormwater removal only by means of structures to take out the water rapidly, leading to significant impacts on receiving water bodies.
New technologies emerged, which consider other aspects of urban stormwater management, such as sustainable management solutions. According to Kourtis et al. [
1] some examples of improvements on stormwater management systems have been achieved: (i) runoff quality; (ii) visual amenity; (iii) recreational value; and, (iv) ecological protection. Nowadays, these techniques are widely recommended and applied in different cities around the world, and a common application is focused on evaluating LID—Low Impact Development—hydrological performance and hydraulic behavior on flooding [
2,
3,
4,
5,
6].
Unfortunately, the traditional approach for urban drainage systems without sustainable techniques is still widely used in Brazilian cities, in which the natural watercourses and floodplains are not necessarily taken into account.
In Brazil, separated sewage and stormwater systems are mostly used due to the high-intensity rainfalls and the costs of wastewater treatment in combined systems. However, rapidly removing stormwaters that are generated in urbanized areas just transfers the either to downstream areas or to the future development [
7]. Sewage is treated by wastewater treatment plants (WWTP) in part of the cities, but stormwaters are usually discharged into the receiving watercourses without any treatment and, in many cases, neither peak discharge attenuation.
An very efficient alternative in some drainage systems is the implementation of detention ponds. This structure is deployed to reduce downstream flood hazards by temporarily detaining stormwaters in the basin and slowly releasing through outflow control structures over an extended period [
8,
9,
10,
11].
The use of hydrological models can improve the understanding of hydrological dynamics, as well provide support for studying and analysing alternatives for flood mitigation, the effect of changes in hydrological basin conditions, and predicting critical events, allowing for the evaluation of preventive and/or remedial measures [
12]. However, Bertrand−Krajewski [
13] studying problems and difficulties with practical consequences in the application of stormwater quality models, strongly emphasized their dependence on the data sets that were used for their calibration and verification and, thus, to collect more and reliable data is absolutely necessary.
Among other computational hydrological models (such as DR3M–QUAL, HSPF, STORM), Storm Water Management Model—SWMM can simulate the quantity and quality of surface runoff in urban basins [
14]. This tool allows for applications, such as design and dimensioning of drainage network components, the design of detention structures, the diffuse pollution modelling, and LID efficiency assessment [
15]. SWMM is best known for the modeling of urban water cycle [
16].
Tsuji et al. [
17] evaluated the concentration of pollutants in stormwater and the application of the SWMM model to an urban catchment in Lake Paranoá watershed to carry out the simulation of flow discharge with the hydraulic model, and subsequently to estimate the loads that were conveyed to the lake in ordinary events of precipitation. They noted that SWMM works well in simulating real events when the rainfall spatial distribution was uniform throughout the watershed, and good fit was achieved after calibration, leading to NSE and R
2 as high as 0.82 and 0.84, respectively, for events that are more regularly distributed on the catchment, however pollutant loads simulation needs improvement, as Dotto et al. [
18] had already suggested, because SWMM use simple regressive models, in which concentrations are estimated within a timestep as a power function of rainfall intensities and routed runoff.
This study aims to analyze different combinations of detention ponds in order to evaluate the hydrological and hydraulic processes in an urban catchment in the Paranoa lake basin while using the SWMM model into PCSWMM—Personal Computer Storm Water Management Model—program. Effect of detention ponds location along the drainage pipe network on the flow peak reduction in the critical network nodes and in the outlet were evaluated.
2. Materials and Methods
2.1. Study Area
Brasília was created in 1960 to become the new capital of Brazil inside the Federal District. It is located within the Cerrado biome and its biodiversity can be compared to Amazon’s [
19]. It is the highest region of the Brazilian Central Plateau, with springs of headwaters of the three great Brazilian hydrographic regions: Paraná, São Francisco, and Araguaia/Tocantins.
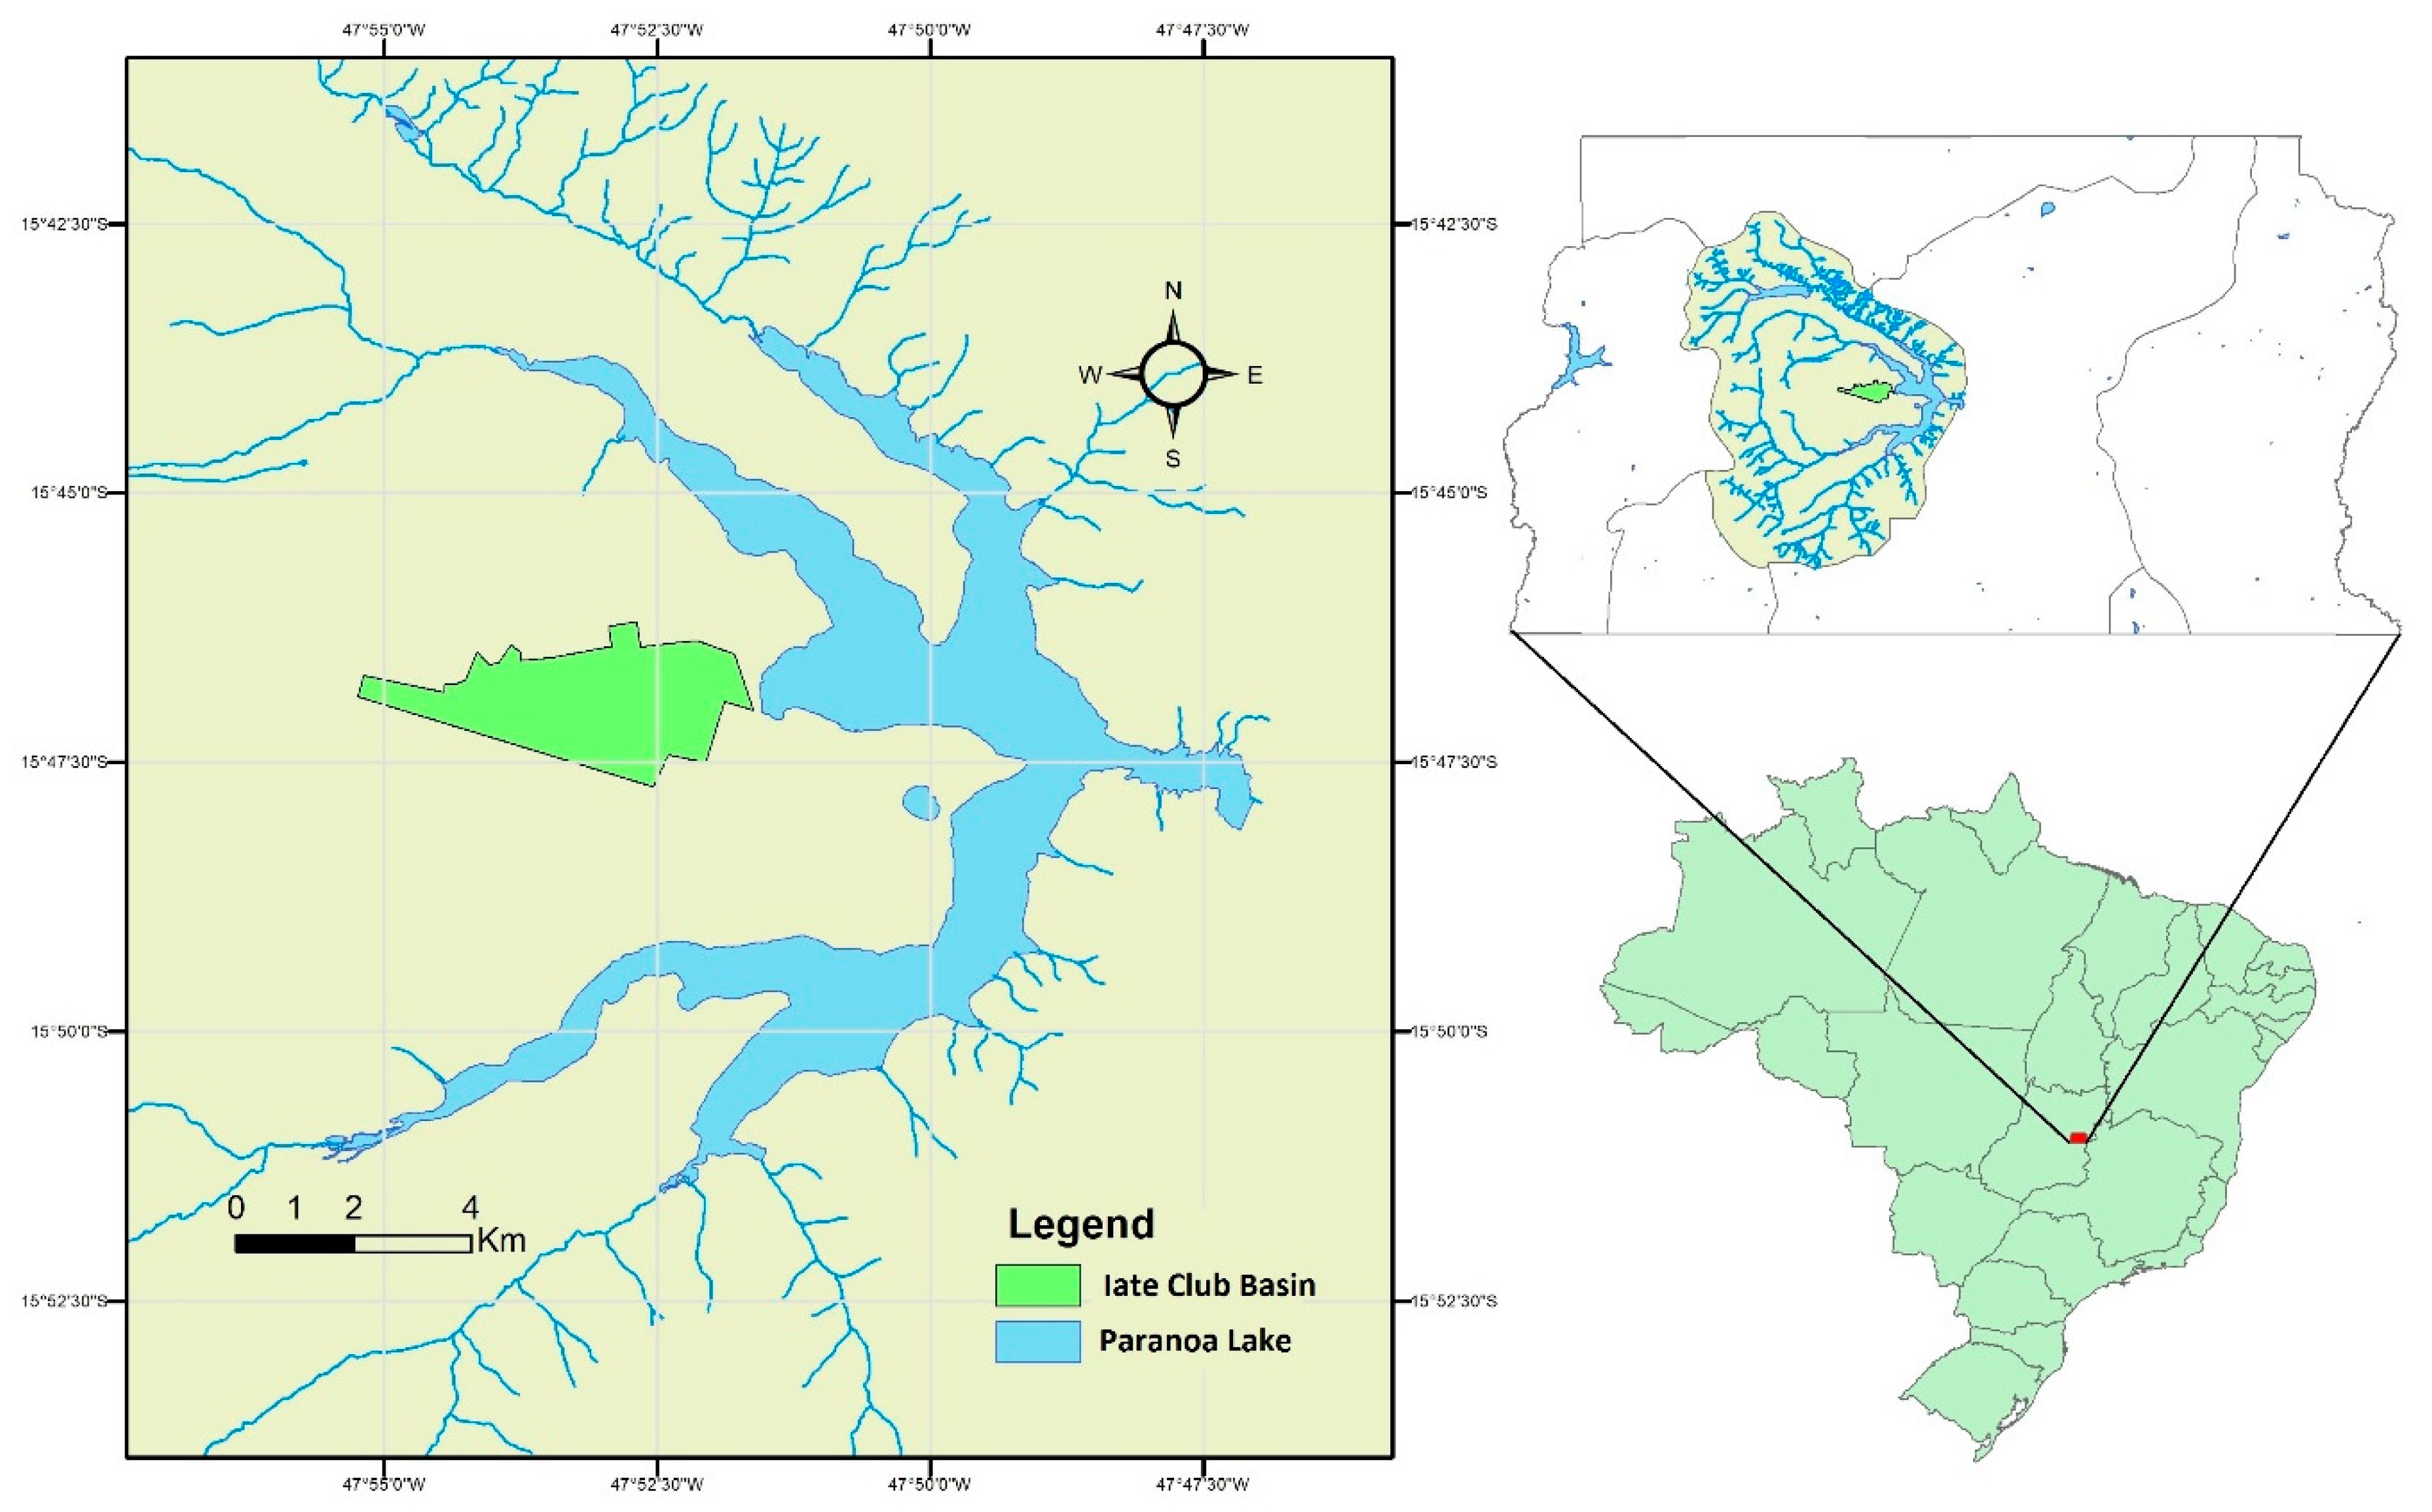
Paranoá Lake is an artificial reservoir that was created to be an urban lake and it is the final receptor of stormwaters, as well as treated and untreated wastewaters, while also being used for recreational activities. The Paranoá Lake watershed occupies an area of 1034 km
2 and the Lake began to be used for urban water supply in 2018. It is important to care about nutrients loads and sediments produced by the urban area discharged into this receiving water body due to the lake history on cyanobacteria blooms and the recreational activities. Furthermore, it is essential to propose alternatives to retaining the diffuse pollution. In this lake, algal blooms sporadically occur, especially at the beginning the rainy season, turning several spots unsuitable for swimming and potentially hampering the use of the lake’s water for human consumption [
20].
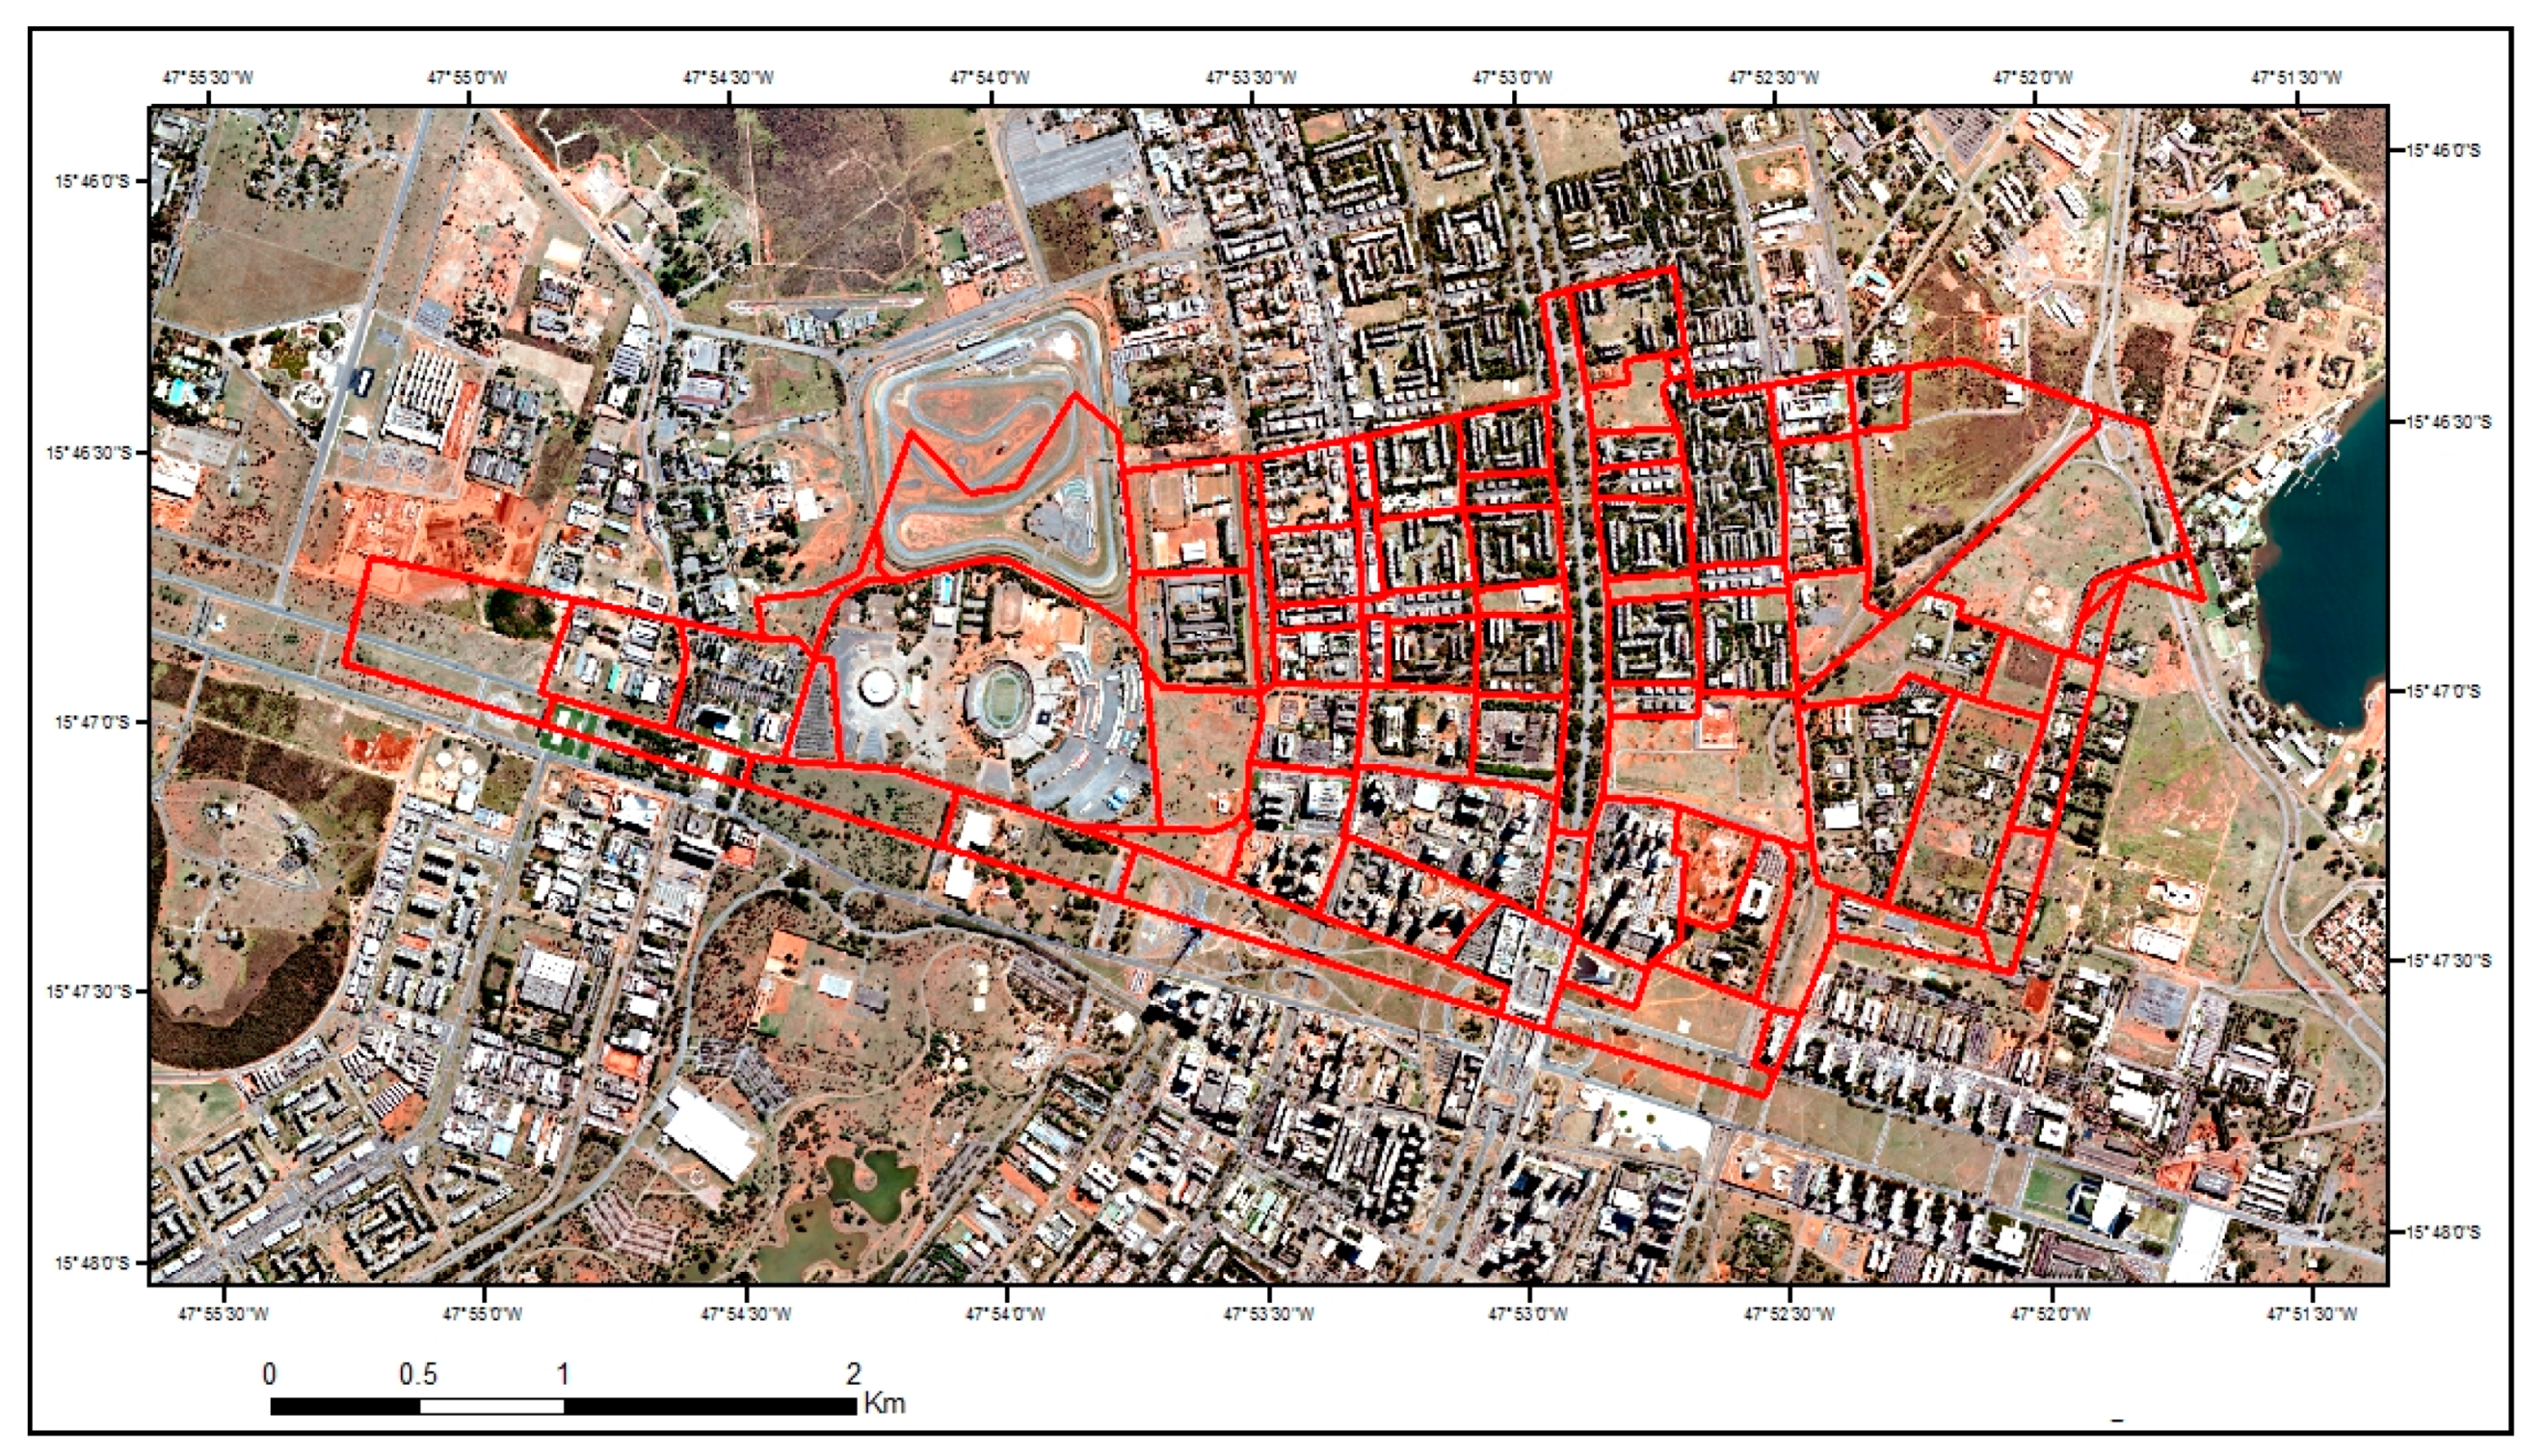
The study area is a sub−basin inserted in the central area of Brasilia that is occupied by avenues, business buildings, residential, and commercial areas (
Figure 1), called Iate Club Basin. In this work, drainage network, land use and occupation, soil pedology, climatological regime, and flow were characterized and monitored during two rainy periods.
This watershed is entirely located in the Federal District territory, corresponding to 20% of the total area. It is necessary to understand the hydrological process of the different cities around the lake to attempt to minimize the risks of degrading the lake water quality, due to diffuse pollutants that were carried by stormwater.
As for the geological aspect, the Paranoá Lake watershed is formed by the Paranoá Geological Group, which occupies about 65% of the DF area, which is characterized for subunits: slate, sandy metarithmite, metassiltites, and medium quartzites [
21,
22].
The regional climate, classification is the Savannah Climate (Aw), according to the Köppen−Geiger, with a dry season during winter (May–September), and a wet season during summer (October–April), with an annual average precipitation of 1600 to 1700 mm. The average annual air temperature for the study period was 21.9 °C, with little variation over the year [
23].
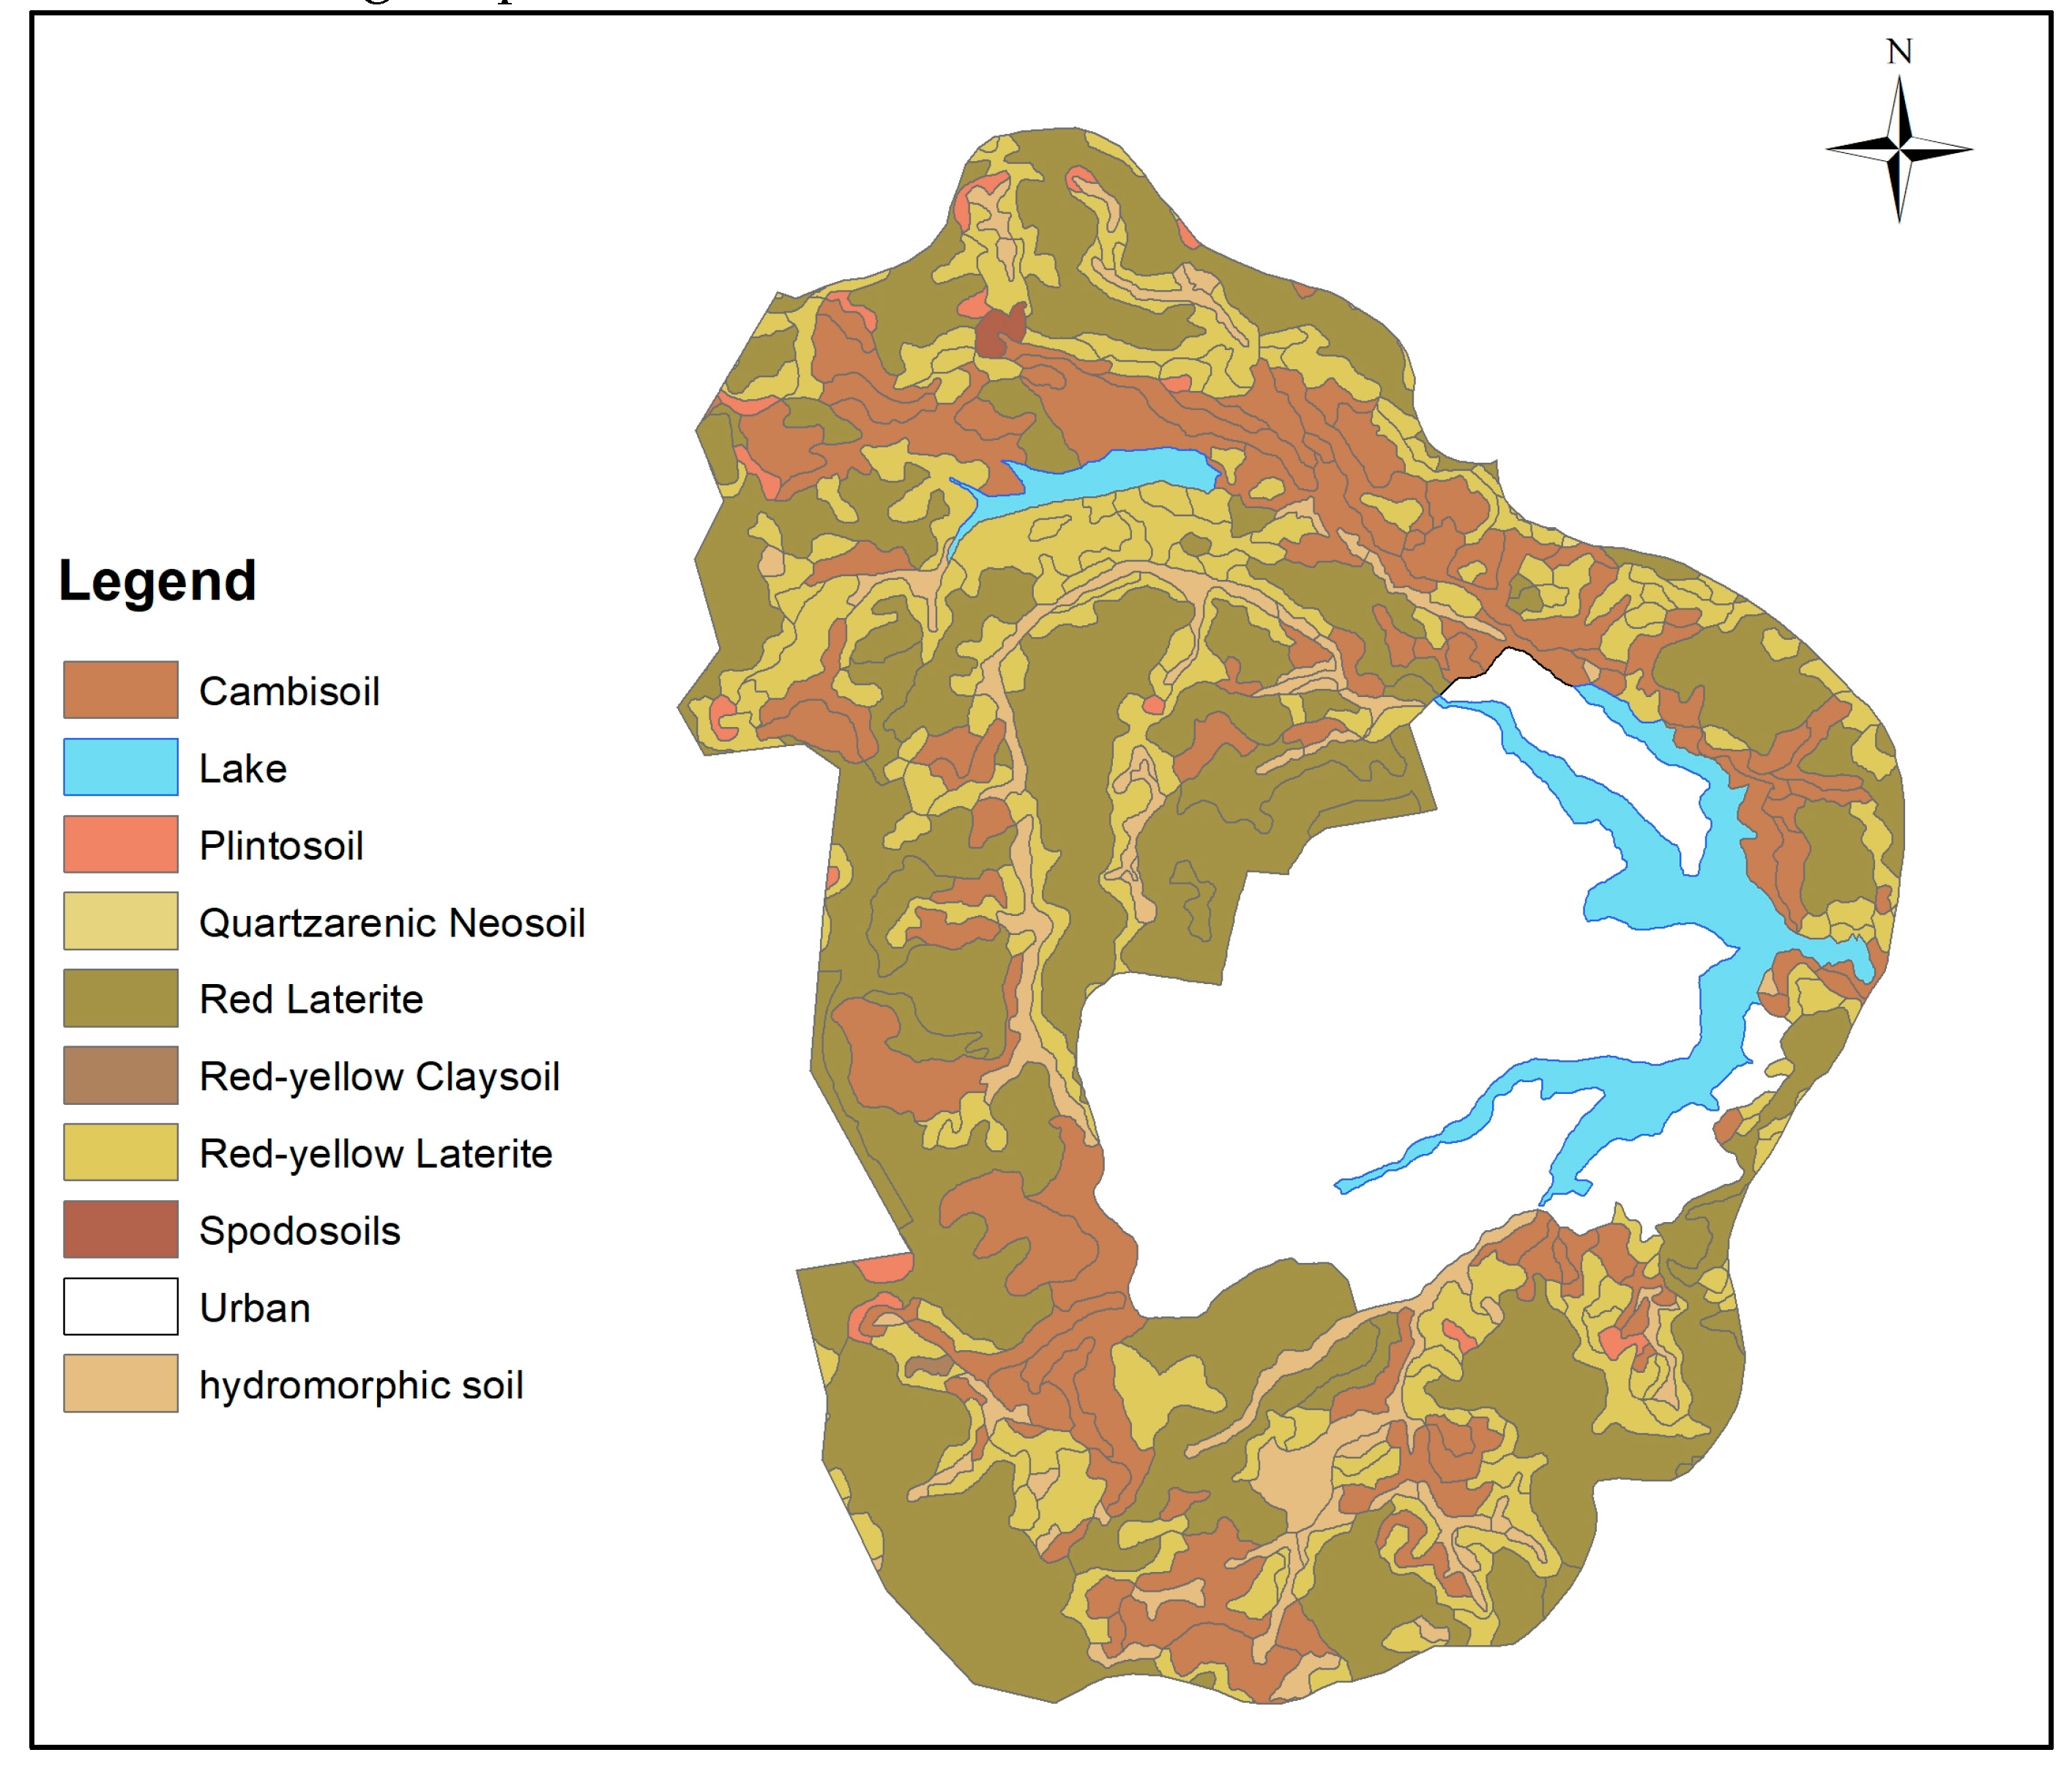
At the Paranoá watershed, the elevation varies between 1000 and 1200 m, and the predominant soils are Red−Dark Latosol (38.65%), Red−Yellow Latosol (15.83%), and Cambisol (31.02%) [
24]—at
Figure 2 The Lake Paranoá watershed has alterations of the initial layers of the soil in the urban regions, which are mainly due to urbanization that changes some soil characteristics, such as the degree of compaction and soil drainage aspects [
21].
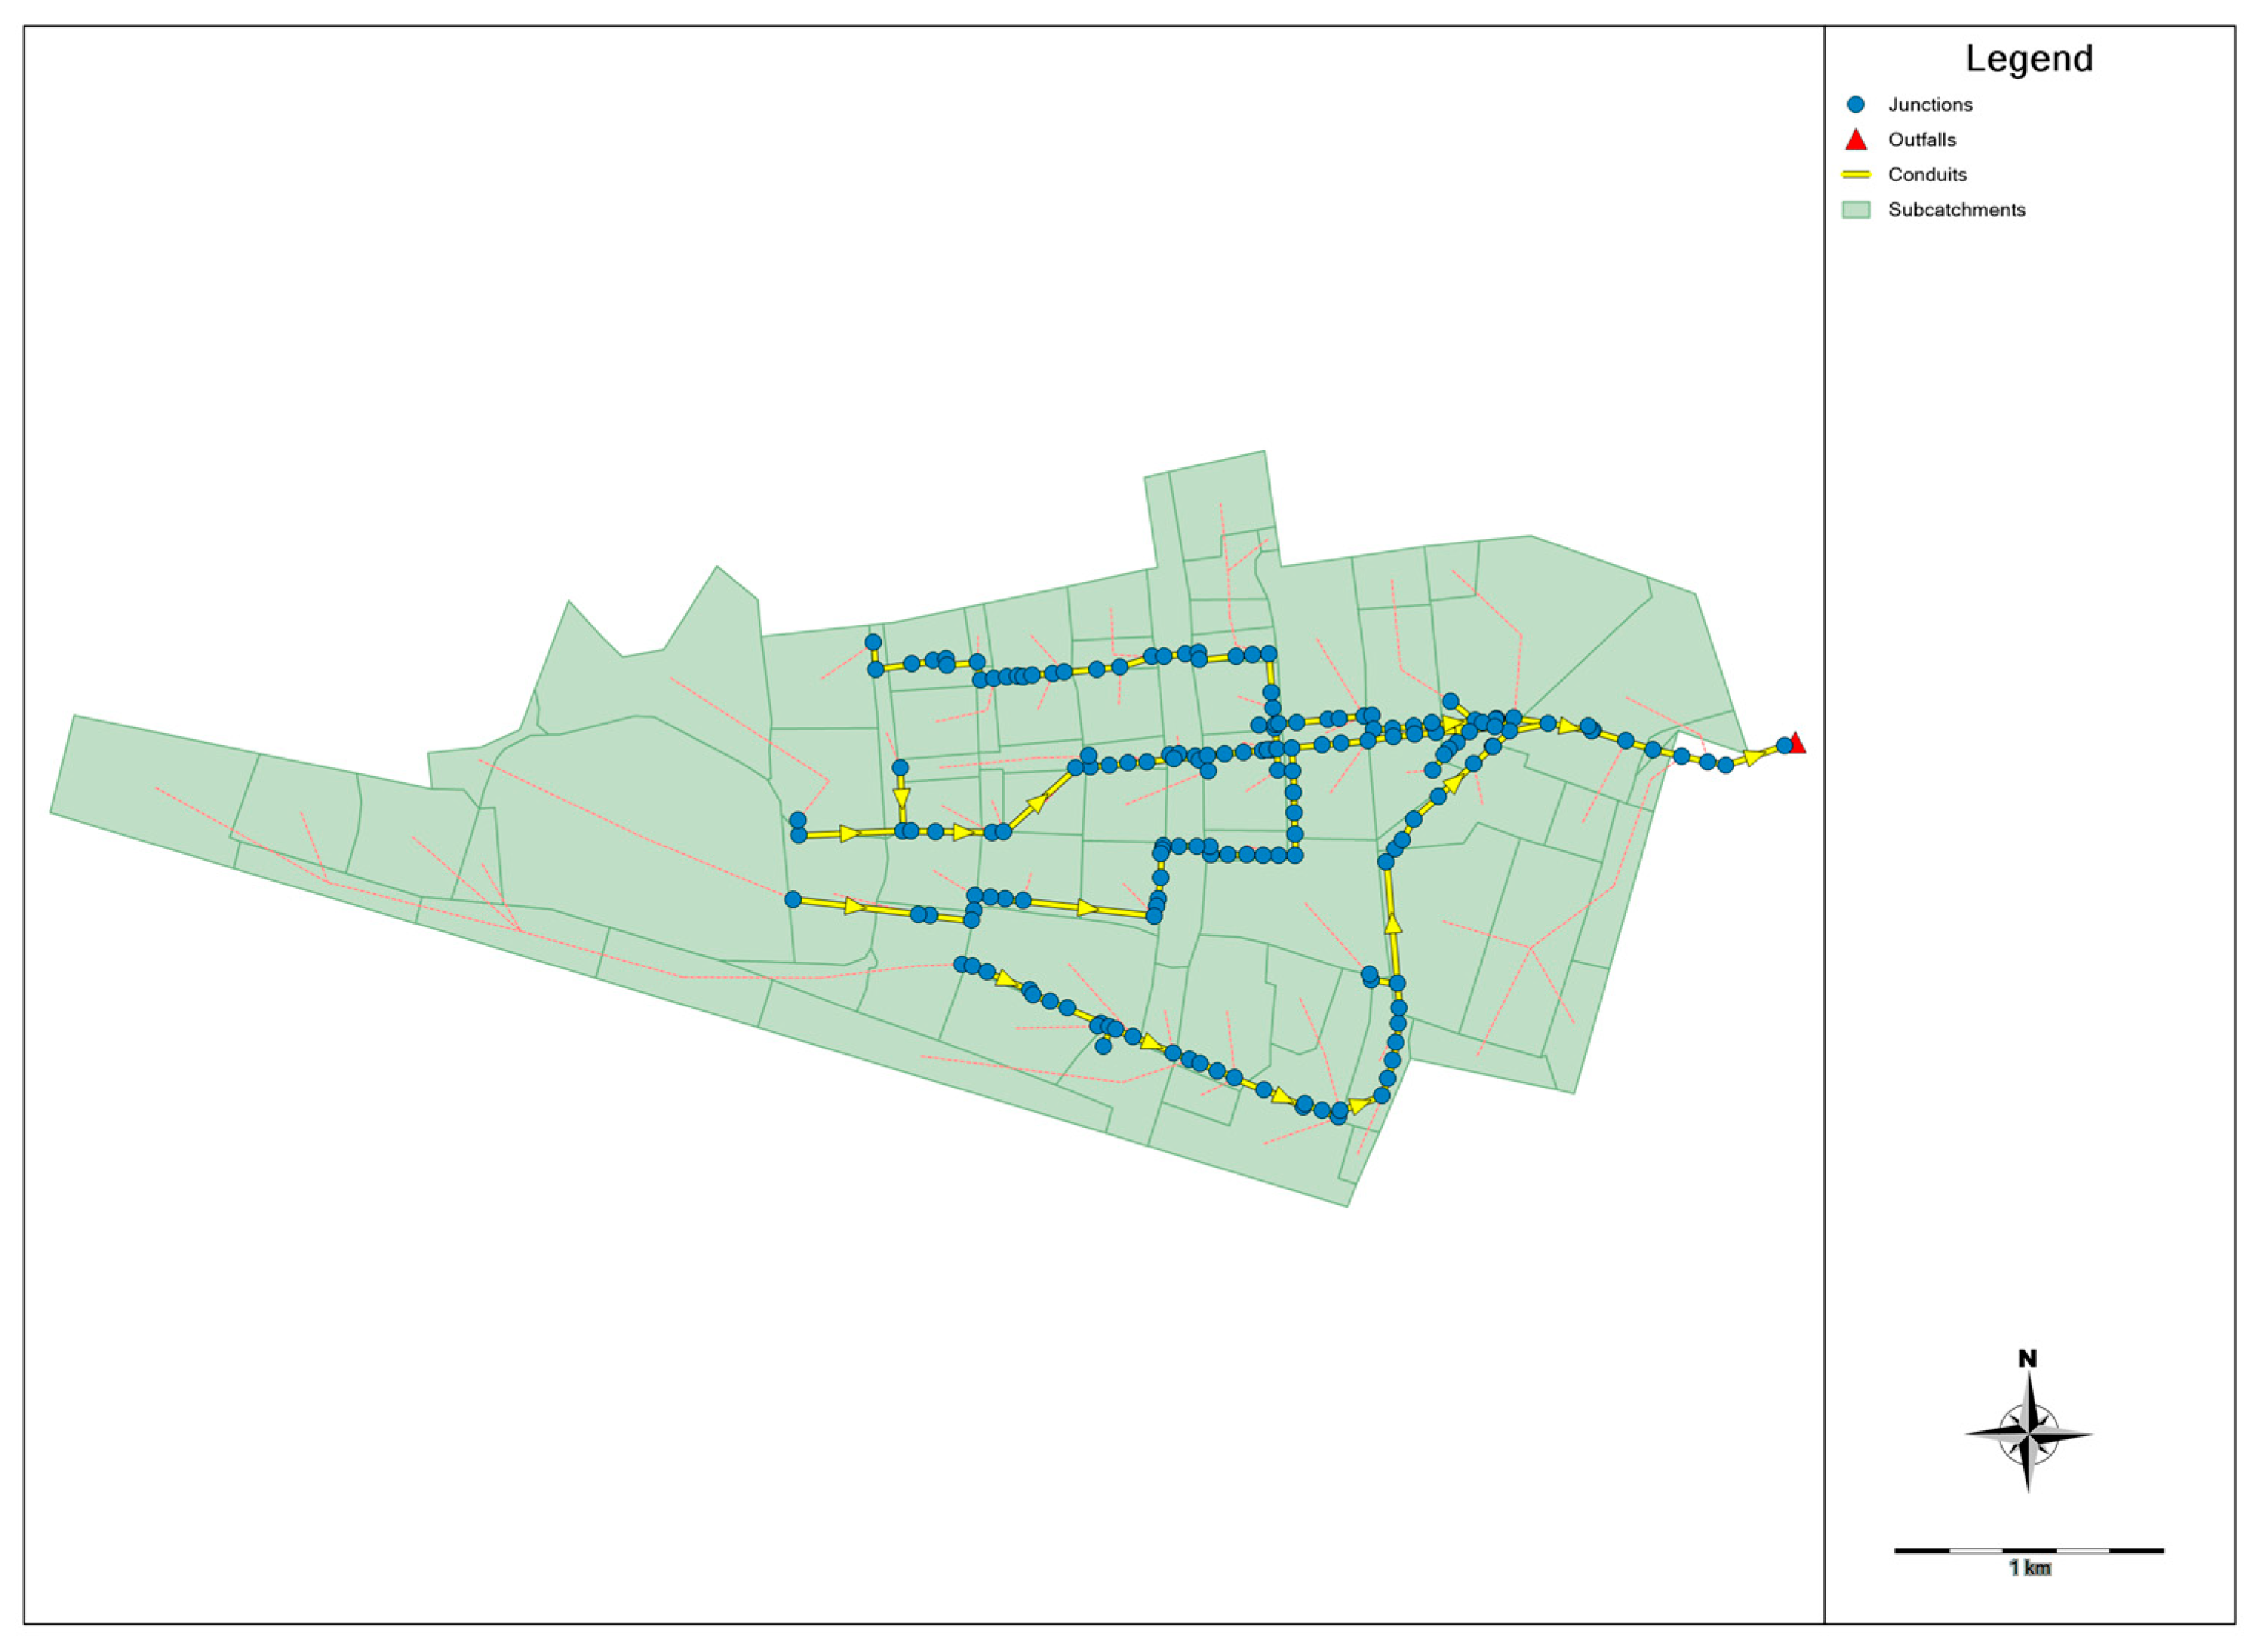
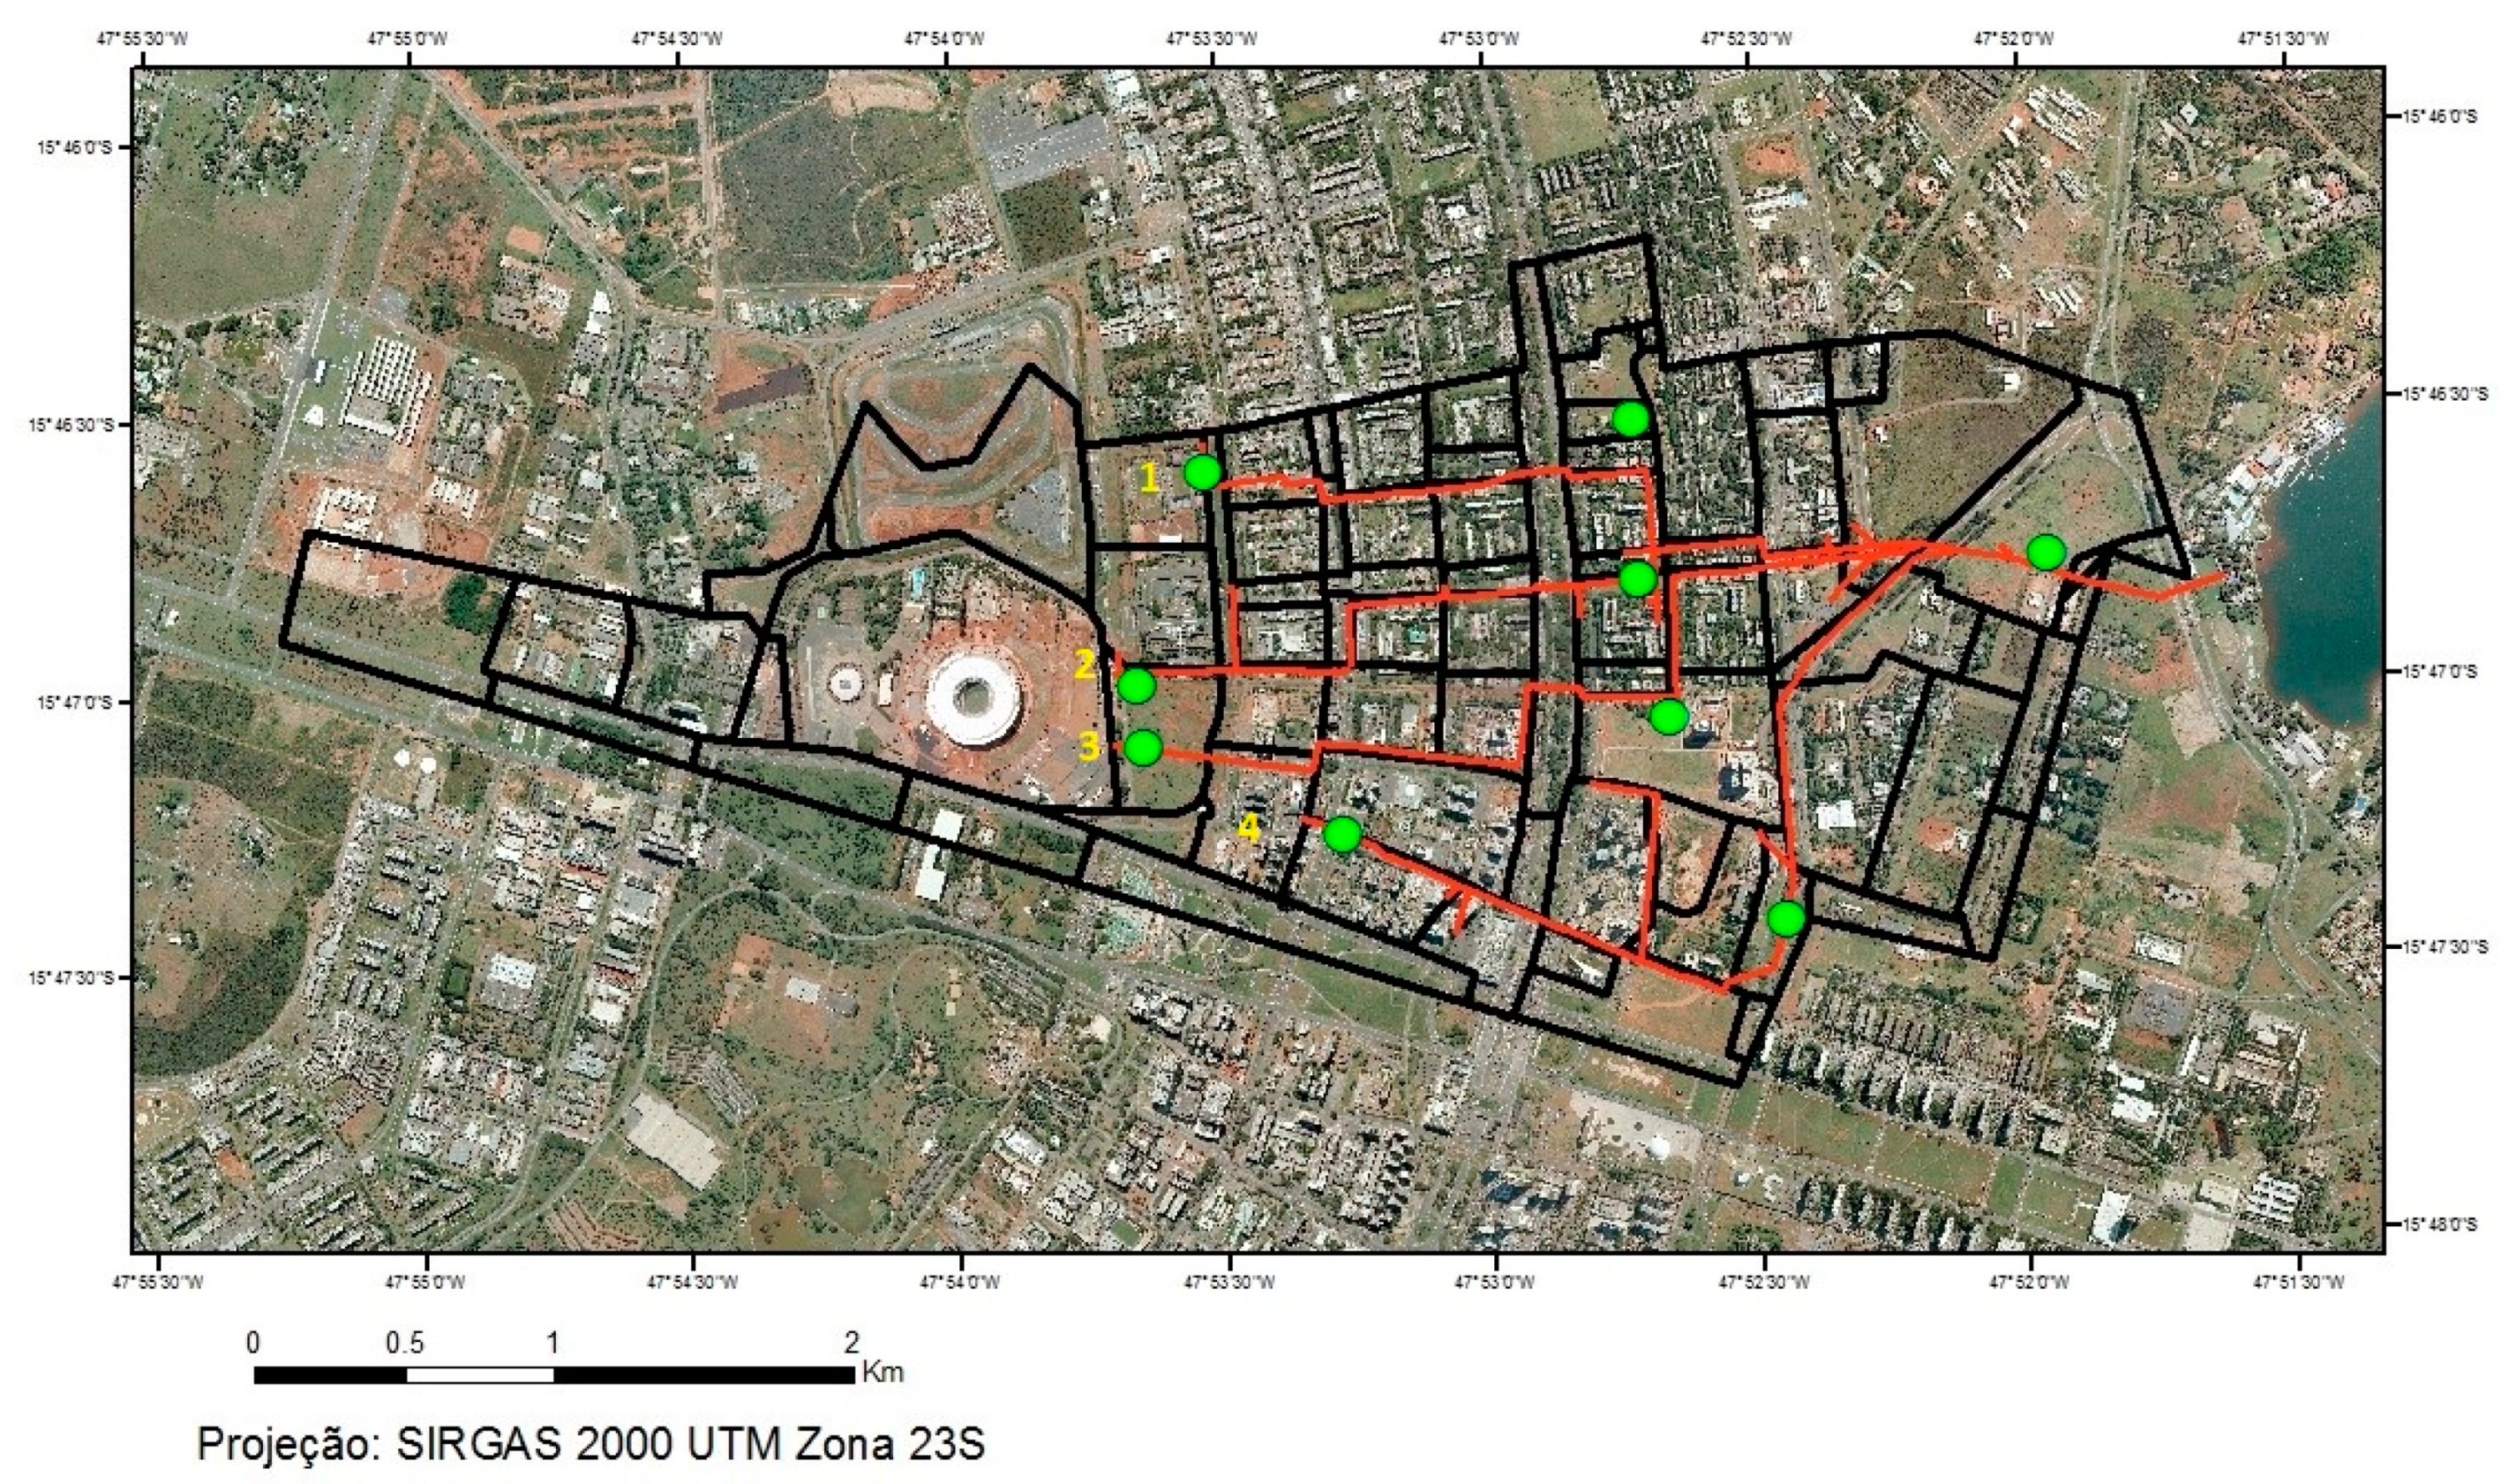
The current drainage system consists of four main axes: gallery 1 consisting of 3.97 km; gallery 2 of 3.77 km; gallery 3 of 2.68 km; and, gallery 4 of 4.75 km that converge to a main gallery (
Figure 3), with section 3.00 m × 3.00 m, which flows into Lake Paranoá. All of the conduits are made of concrete, with diameters ranging between 600 mm–1500 mm.
In the Iate basin, it monitored flow and water quality with the installation of level logger (OTT, model Thallimedes) and water sampling was carried out while using an ISCO 6712 autosampler at the gallery outfall and set up to collect data/sample each five minutes. The EMC—Event Mean Concentration—for each parameter was calculated based in the parameters of water quality measured, which were Total Dissolved Solids (TDS), Total Suspended Solids (TSS), Chemical Oxygen Demand (COD), nitrate, nitrite, total phosphorus, and reactive phosphorus. The maximum to COD equal 320 mg/L and 55 mg/L to Suspend Solids [
25]. These impacts can contribute to eutrophication and siltation to Paranoá Lake, which should be avoided.
2.2. Drainage System Model
The hydrological modelling was carried out while using PCSWMM program, as developed by CHIWATER—Computational Hydraulics International—to simulate surface runoff and to predict the impacts of land urbanization and the use of detention ponds. PCSWMM was used in the simulation of different regions of the Federal District, such as the Riacho Fundo basin [
26], the Vicente Pires Basin [
27], and the CO basin [
28].
The street flow routing is based on a finite−volume, shock−capturing scheme that fully solves the conservative Saint−Venant equations, and it can be used to simulate subcritical and supercritical flows.
The watershed infiltration and runoff volume are influenced by factors, such as the storm intensity, rainfall volume, land use, type of soil, and initial moisture conditions. The Curve Number—CN—method is widely used for urban watershed, rainfall runoff modelling [
29]. CN parameter vary according to soil type, land use, and soil moisture, and they also change in time due to antecent moisture changes.
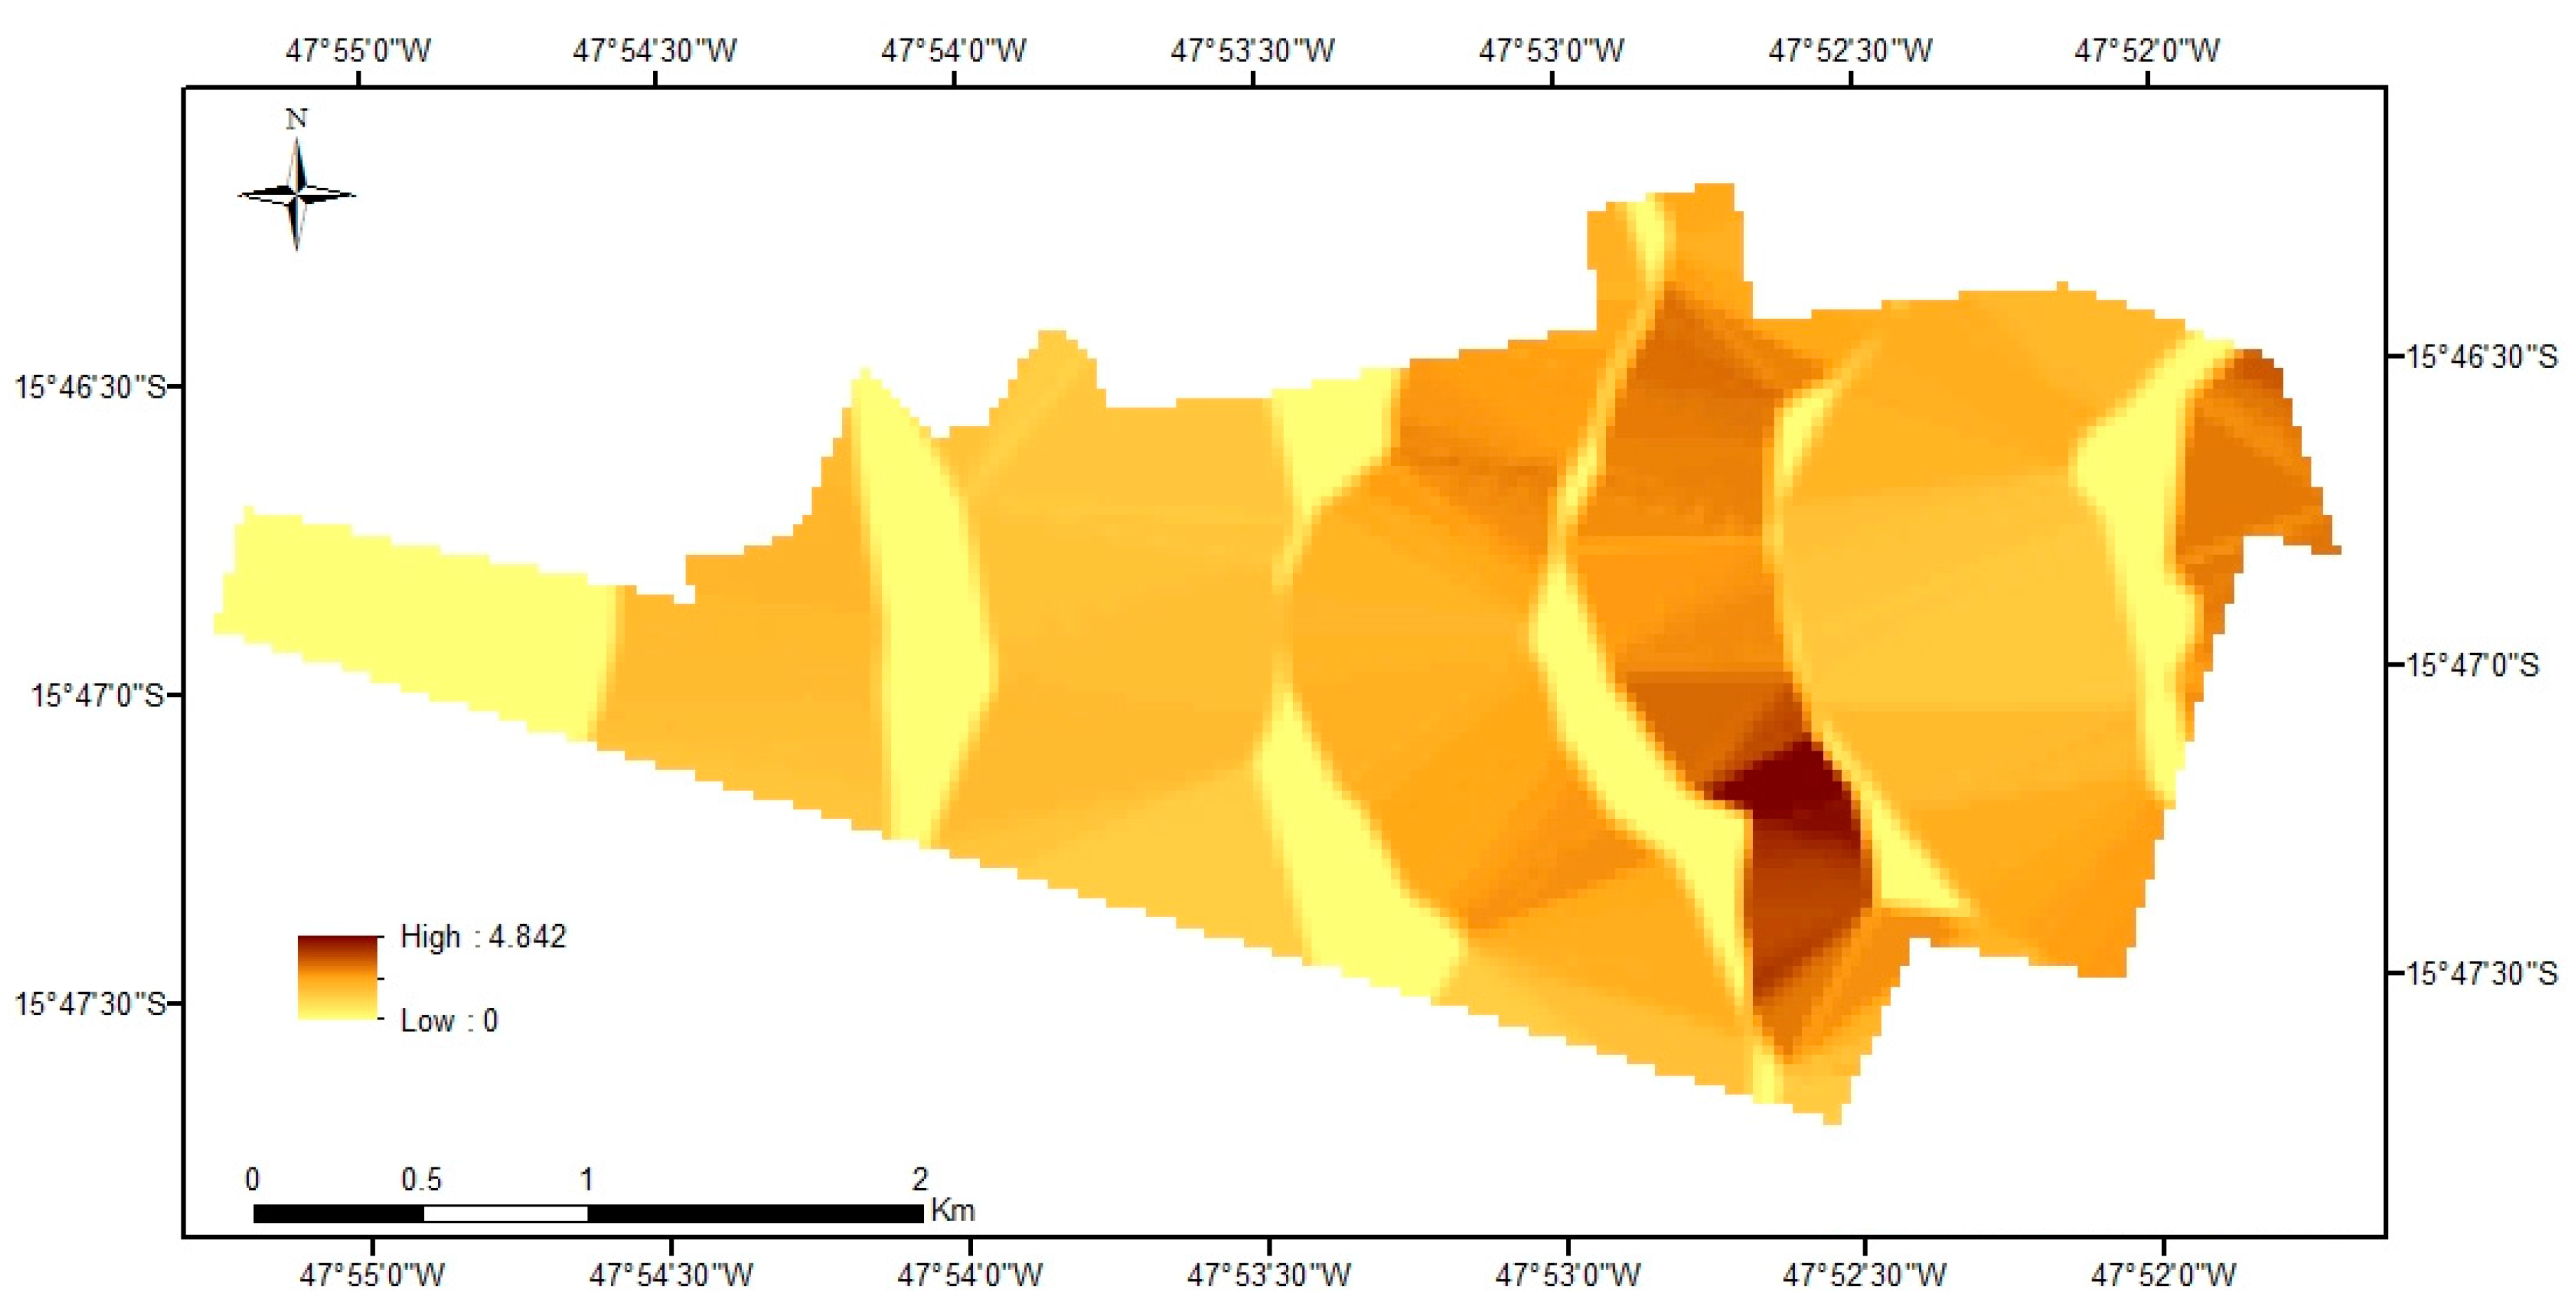
Figure 4 shows the soil slope distribution in the study area.
The CN estimated values for the area were calculated by the intersection of cross-checking information relating the land use and hydrological soil group characteristics. Testing soil characteristics is a determining factor in order to identify the hydrological soil group to which each local soil can be classified. Some studies have been carried out to classify Cerrados soils according to SCS hydrological soil groups as Lima et al. [
30].
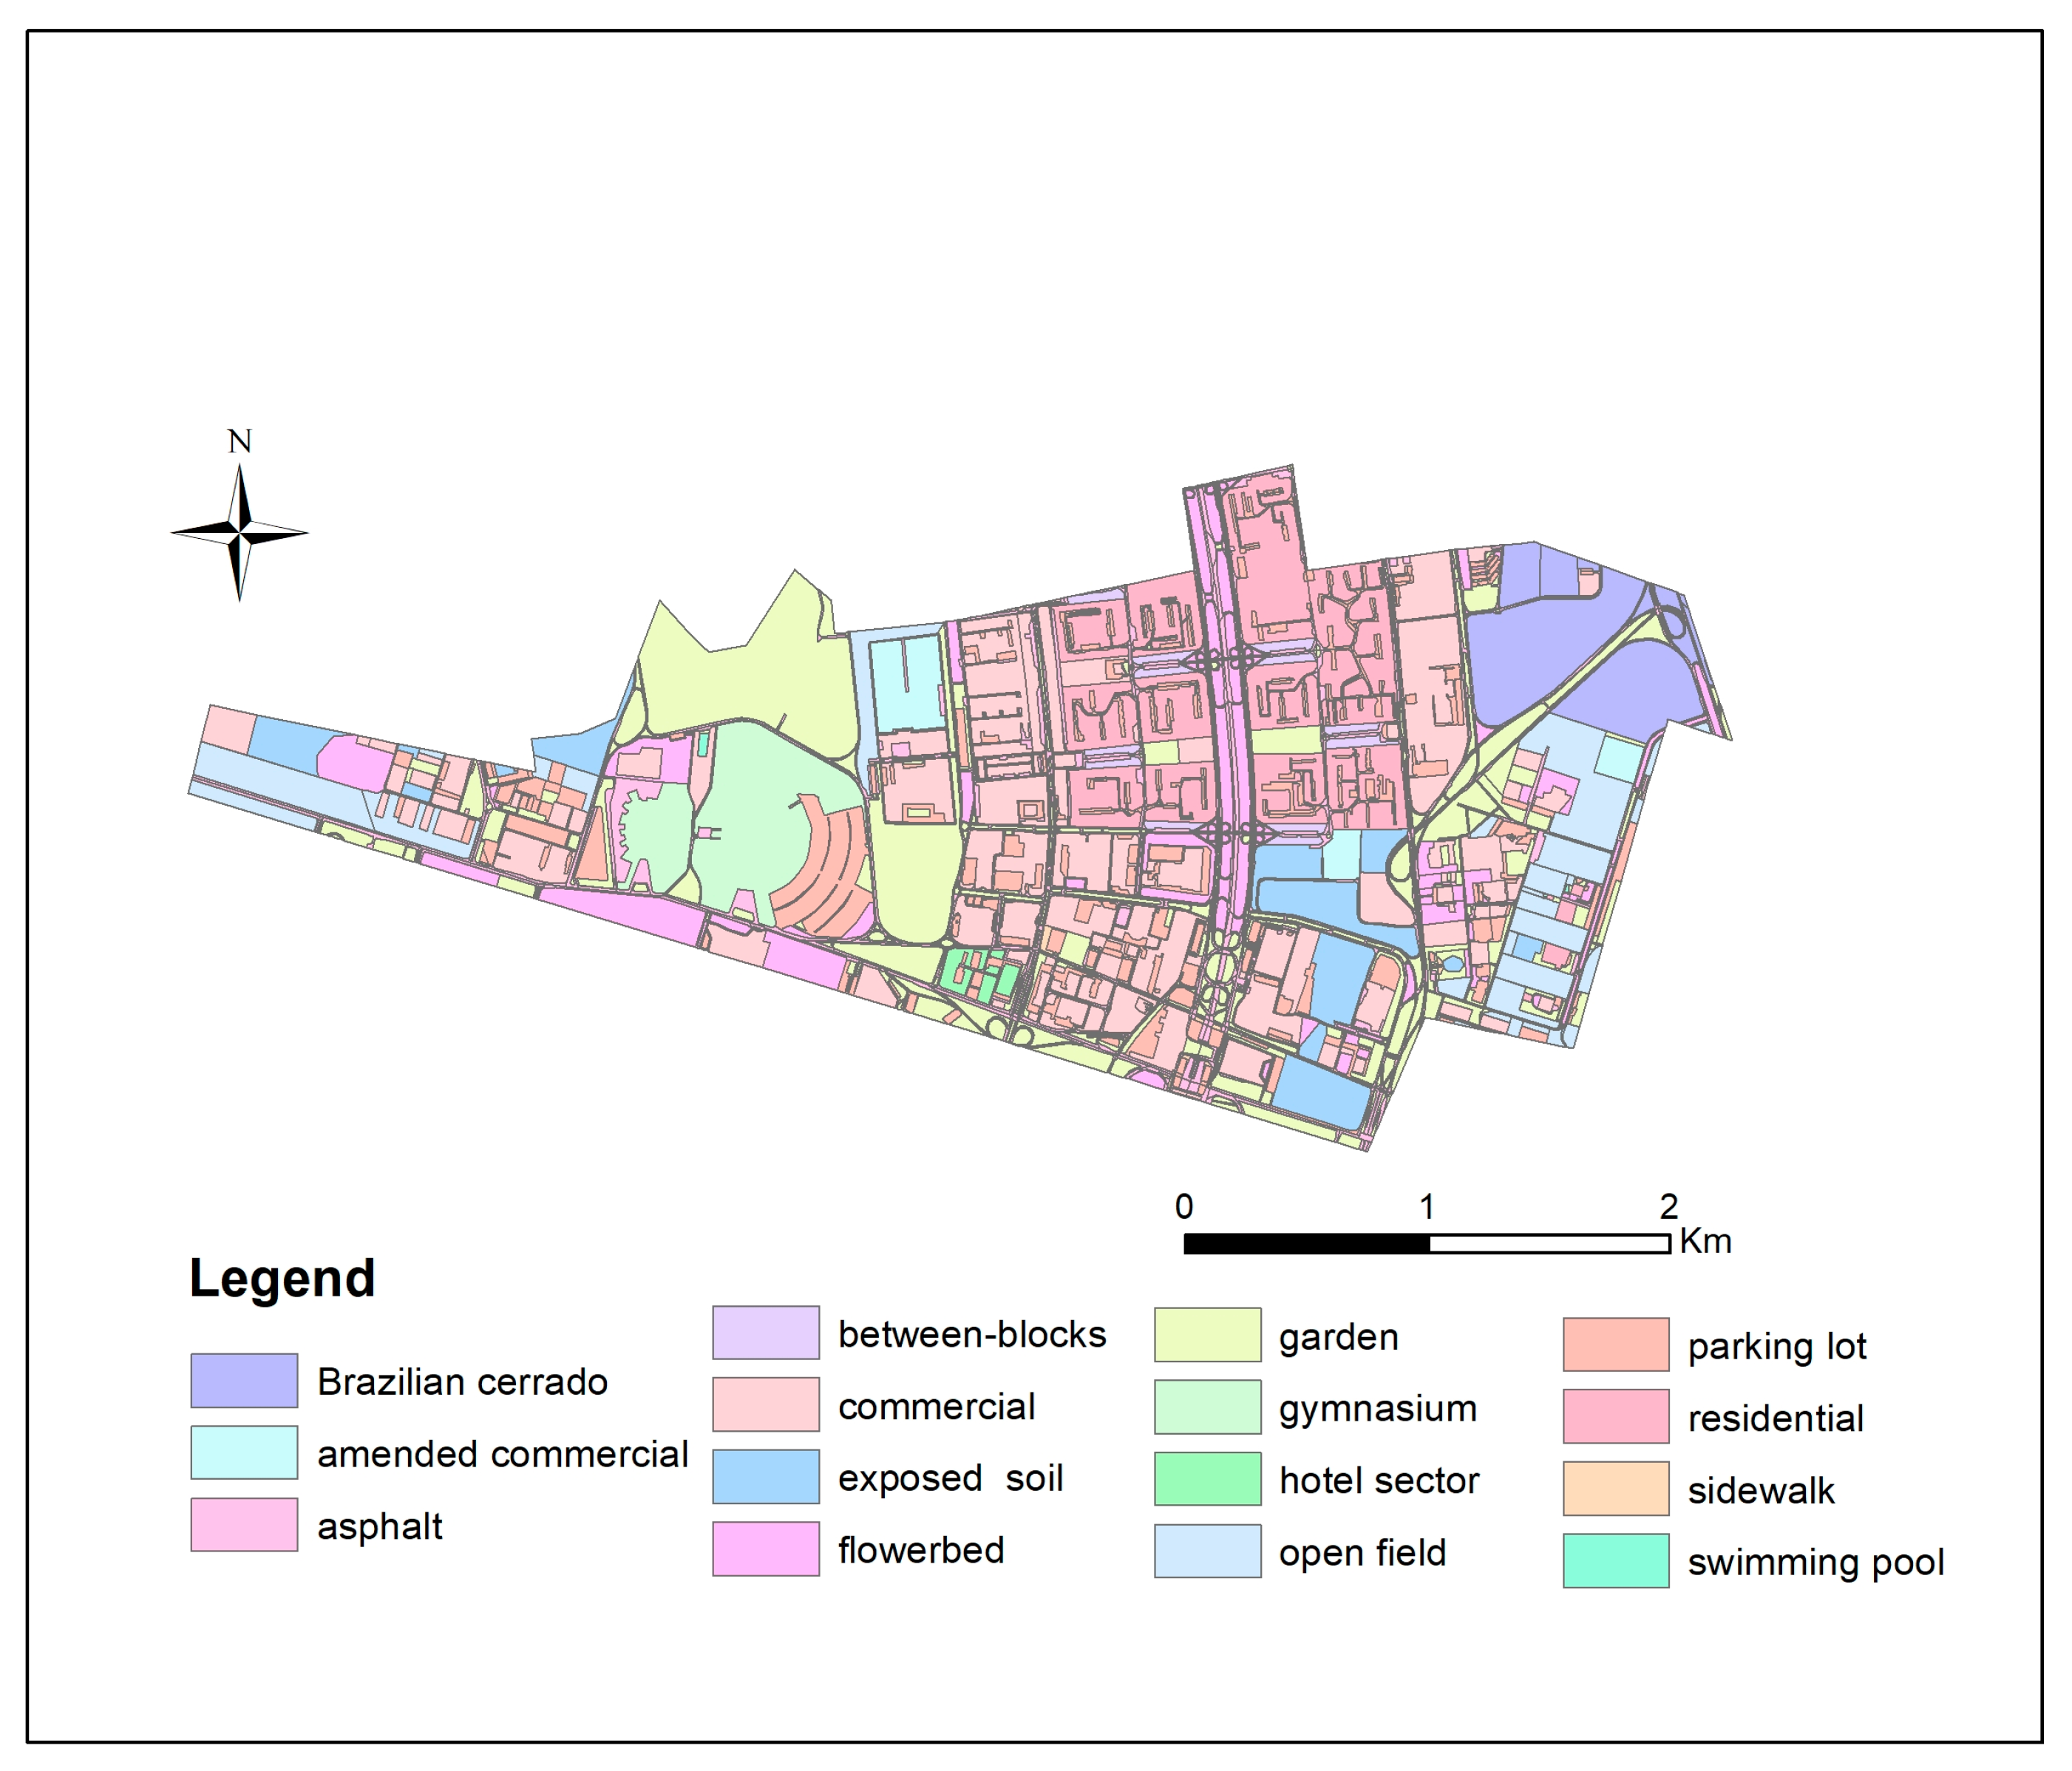
The land use information that is necessary for the simulations was obtained from satellite images that were later classified by the GIS—Geographic Information System—program (
Figure 5).
After the soil identification and characterization, the CN values were selected while using the hydrological soil group with land use and occupation. The CN values proposed by Tucci [
31] were adopted.
Subsequently determining the values of CN, in order to carry out the simulation, it was necessary to provide to the SWMM model input data referring to the components of the drainage system, such as: manhole locations, pipe characteristics (connection, section geometry, diameter, length, depth), and storage ponds characteristics (length, bottom, width, side slope, depth, surface cover material).
Hydrological models are usually estimated based on the topographical parameters and physical properties of soils, aquifers, and basin soil use. The reliability of the predictions of the model depends on the quality with which the model structure is defined and how it is parameterized. However, the estimation of these parameters is difficult, due to the uncertainties involved in determining their values. As a result, some cannot even be directly measured on the field. Therefore, a calibration is needed to improve the model’s performance [
32].
Even models that are based on physical parameters usually require adjustments due to differences between the measurement scale and the modelling scale. Besides, limitations and uncertainties of monitoring variables and processes may make modulation necessary [
33].
In this study, the model was calibrated using observed rainfall data, using three raingauges, and channel stage and flow data, measured at the downstream end of the gallery. The stages were registered while using a float operated level recorder and mean flow velocities measured using a H−ADCP equipment (model Channel Master Transducer—1200 kHz). A stage−discharge rating curve was constructed and used to estimate the outflows.
The Nash–Sutcliffe Efficiency coefficient (NSE) was used (Equation (1)) to evaluate the model. Thus, the coefficient describes the variances in relation to the data observed in the time scale as being more sensitive to the errors in the maximum flows than in the minimum flows. The determination coefficient (R
2—Equation (2)), which represents the linear association between the observed and calculated data, was also calculated.
The performance of the model is generally better during the calibration period than in the verification period, which is a phenomenon called divergence [
34]. The modeler must review nonconformities, examine the structure of the model, and the calibration process in order to analyze whether the hypotheses are valid or inadequate, depending on the characteristic of the objective function when the degree of divergence is considered to be unacceptable.
Simulation and calibration of flow and water quality were performed, while considering the determination coefficient R
2 and NSE, to verify the effectiveness of the model. The parameters considered for flow analysis, as indicated by sensitivity analysis, are described in
Table 1. An equal analysis was done for quality parameters, such as the percentage referring to each use and occupation of the basin, the coefficients of accumulation considered.
An evaluation of the response of the configuration for 13 different ponds was carried out while considering changes in precipitation on the studied area. Seven different rainfall events with constant intensity were tested. Events 1, 2, and 3 are 20−year return period events with different durations, estimated while using the IDF (Intensity−Duration−Frequency) curves that were estimated for the region (Equation (3)) by [
35].
where:
i = intensity of precipitation (mm/h)
TR = return period (years)
D = duration of rainfall (min)
For Rainfall 4 and Rainfall 5, the constant intensity of Rainfall 2 was adopted, varying the duration, and for Rainfall 6 and Rainfall 7, the volume of Rainfall 2 was maintained with different durations.
Table 2 shows the design of rainfalls characteristics.
The detention pond proposed by the local government was considered as reference, with 79,079.52 m3 volume in order to simulate the detention ponds.
The detention ponds are connected to macro−gallery by a single circular pipe with 1.20 m diameter and 0.5% slope that conveys the water flow from the bottom discharge hole to the macro−gallery.
2.3. Scenarios
The evaluation of the occupied area and different control strategies by the detention ponds in the urban drainage system was carried out while using the EPA SWMM 5.0, under PCSWMM program.
Different scenarios were simulated in order to compare the area drainage process with the designed drainage system that was implemented and the changes caused by anthropic occupation. The alternative scenarios (1–8) estimated the impact of one detention ponds in each gallery. The insertion of two ponds with volumes corresponding to half of the reference pond were simulated in Alternatives 9, 10, and 11, and for alternative 12, three ponds were adopted, with 1/3 of the reference pond volume each. Finally, in Alternative 13, the detention pond was placed at the end of the macro−gallery. All of the alternatives are described in
Table 3 and the ponds locations are shown in
Figure 6.
The whole project that was developed in this area was divided into stages, which include: (1) the qualitative and quantitative water monitoring; (2) data processing; (3) modelling basin and sub−basins characterization; (4) the simulations of flow rates, water quality and detention basins using SWMM; (5) deployment site evaluation; and, (6) qualitative and quantitative impacts.
The slope map and the land use map were used to generate the map of the contribution of sub−basins, through the common characteristics that were identified. The micro drainage survey was carried out in loco, with the identification of each manhole, to insert in the GIS program.
More than 50 events were monitored in the study basin, of which 20 allowed to perform the calibration and verification of the gallery flow and water quality in PCSWMM.
3. Results and Discussion
The contribution of sub−basins as determined by the slope map and the land use map was used in what they identified as common characteristics to generate the map of the contribution sub−basins, as in
Figure 7. It is also possible to notice the characteristics of the use and occupation of the soil in the region, where there are several buildings, constructed and in the process of construction, as well as areas of exposed soil and vegetation spots.
The calibration of the model was performed with three observed rainfall classes being separated by their characteristics (duration and intensity), as well as the extension of dry period preceding the event. This separation by classes of rain was necessary for improving the perception of the model in relation to the characteristics of the project. It was noticed in the model calibration and validation the difficulty of adjustment when the precipitation volume was very low.
Initially, the sensitivity analysis of the parameters described in
Table 1 showed that the model was more sensitive to the Manning coefficients than to the CN and width parameters. The last two cited parameters were the ones that had greater influence on the model simulations. The width is the parameter that indicates the characteristics of the flow, that is, the travel path and, as already discussed, the CN parameter characterizes the soil type and land use.
After the parameter sensitivity analysis, the model calibration step was carried for these three rain classes, in which it was sought to aggregate those events with previous days of rainfall, intensity, and volume (
Table 4). Finally, the validation was carried out for other rainfall events that were observed in the basin, respecting the classified characteristics of each event.
Therefore, the model that was used for evaluation of alternatives was calibrated with efficiency coefficients greater than 0.9 (R
2) and 0.94 (NSE) in calibration phase and are least of 0.6 (R
2) and 0.5 (NSE) in the verification process. The parameter values were calibrated to increase the reliability of simulation results. The coefficient of NSE and R
2 were used in order to measure this optimization process, as in
Table 5. For the calibration of daily data, NSE results greater than 0.4 and R
2 greater than 0.5 can be considered to be acceptable according to Green and Griesven (2008), Santhi et al., (2001), and Van Liewet et al. (2003) [
36,
37,
38].
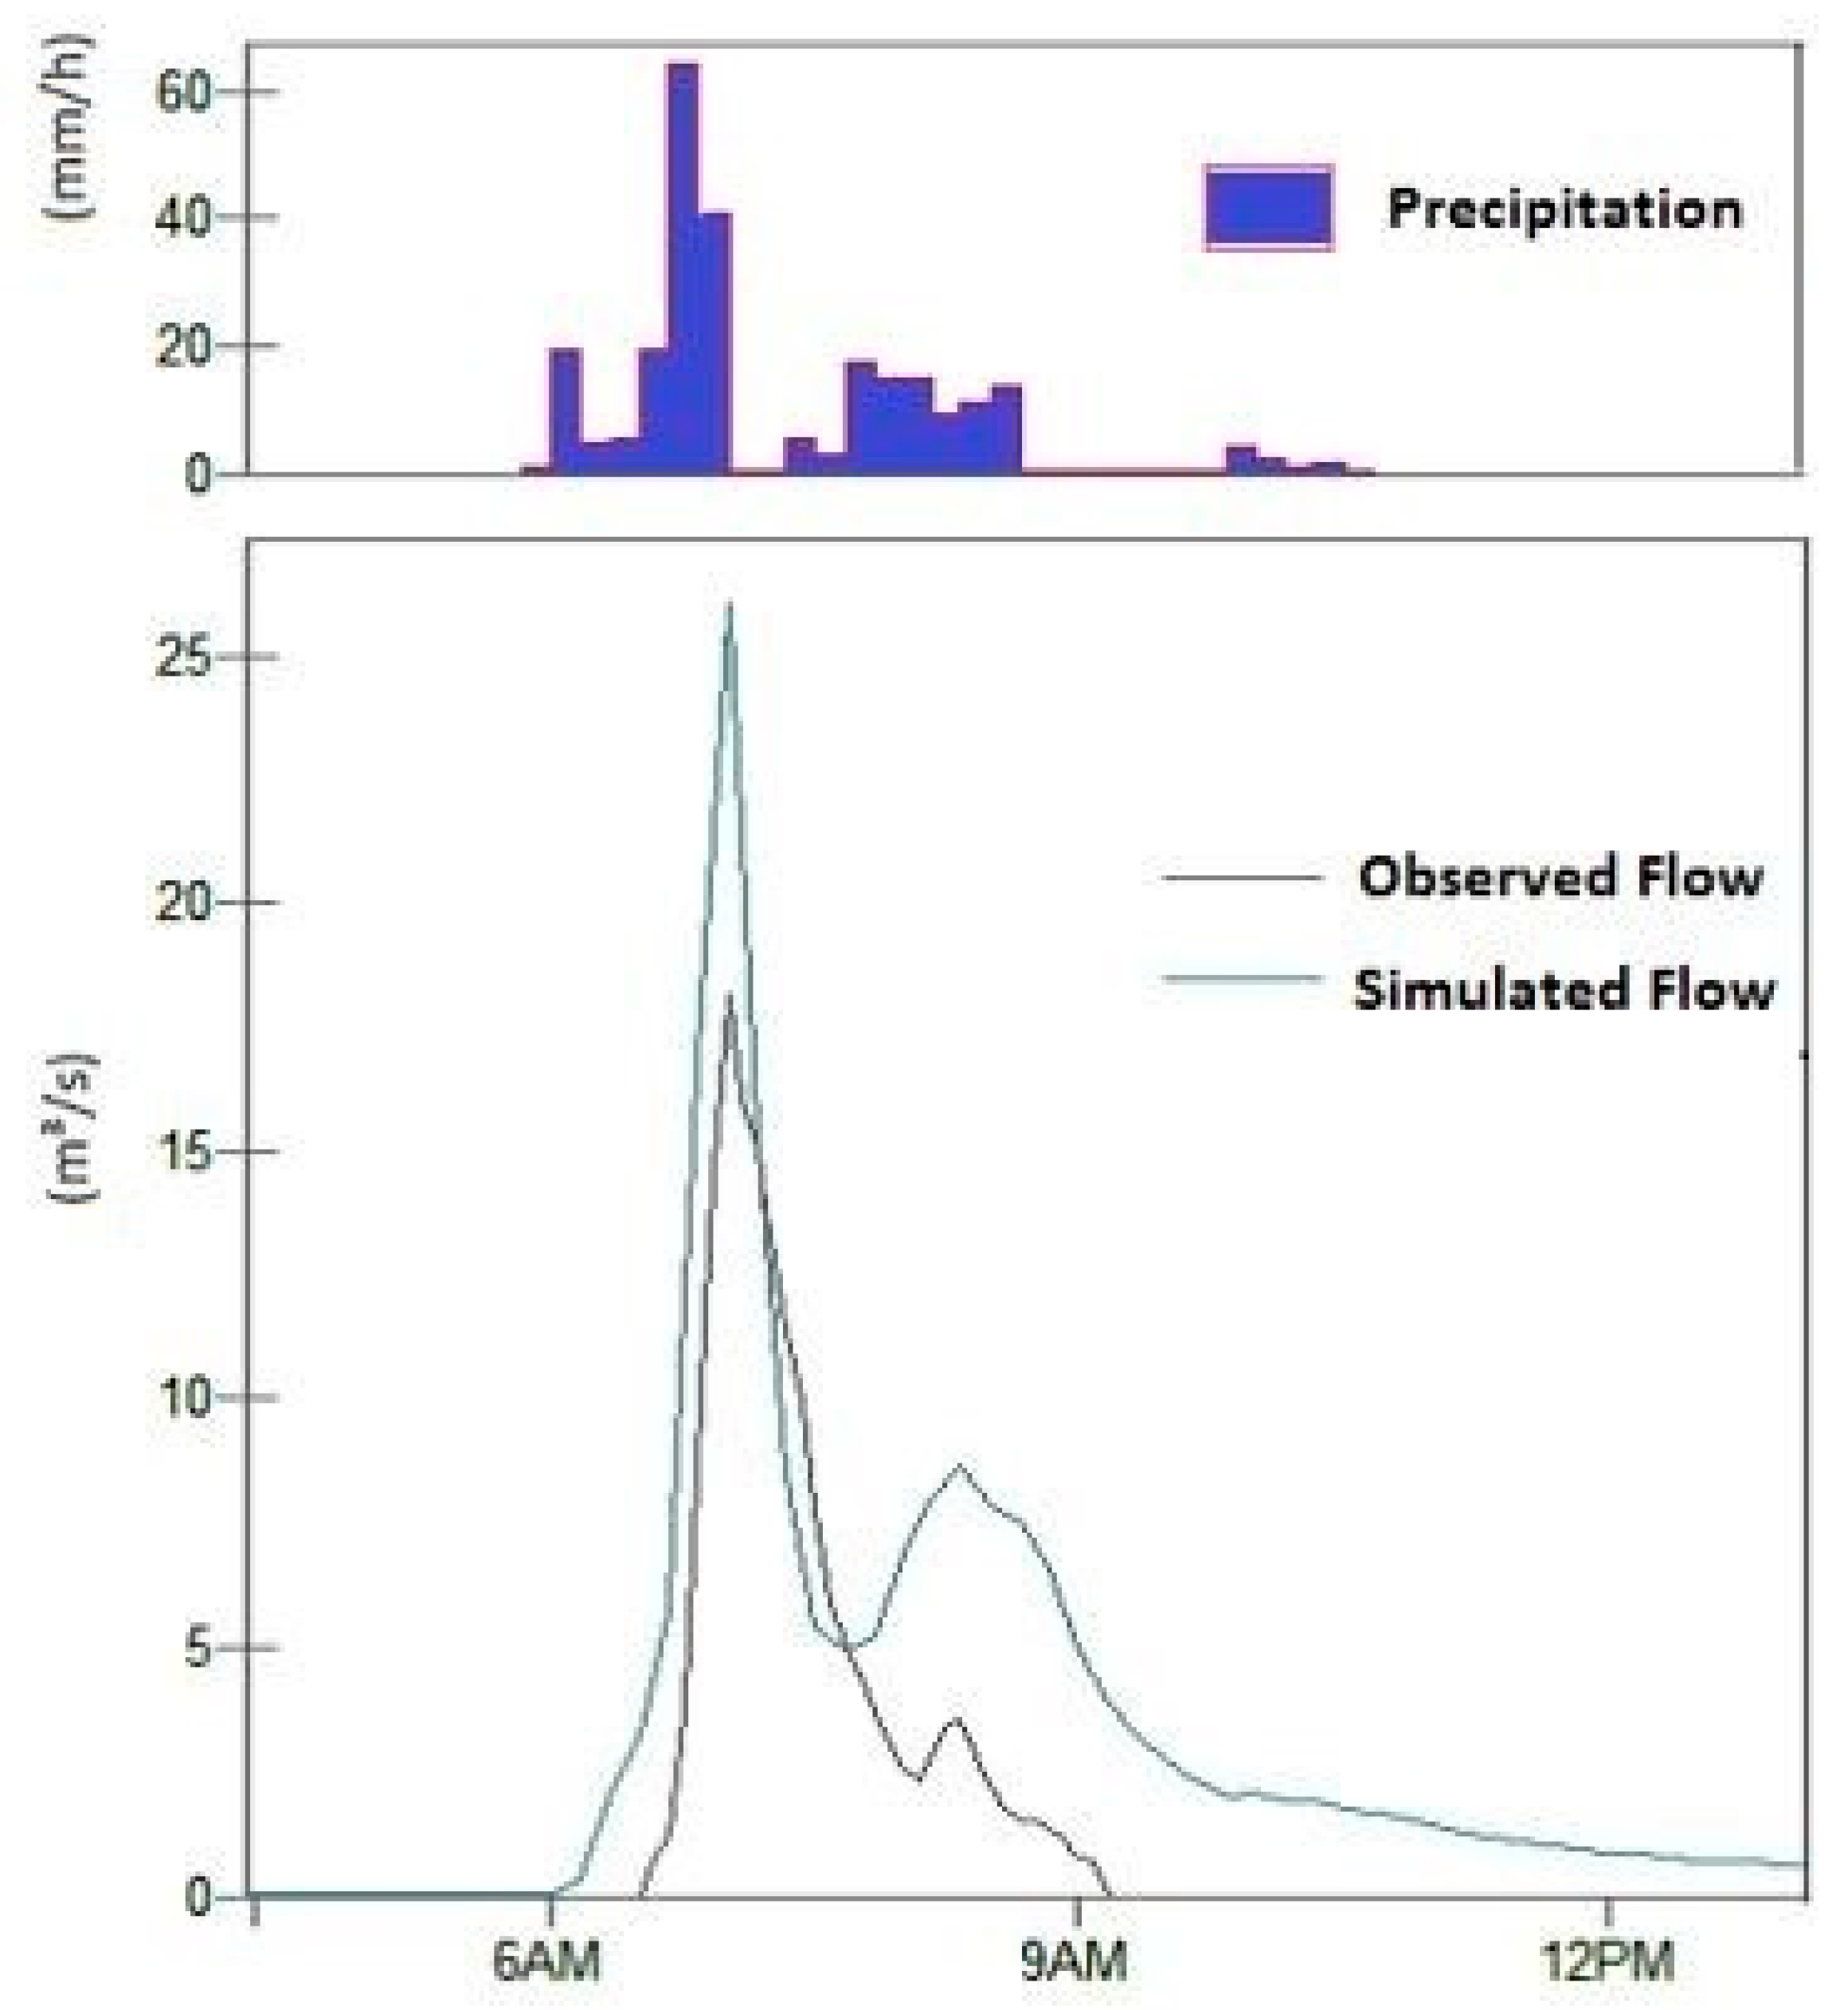
Figure 8 shows the hydrograph and the modelling flow diagram for November 12th event, with the observed and simulated flow rates for model verification. For this simulation, a R
2 of 0.8 and NSE of 0.6 was obtained, as described in
Table 3, where it is shown that the verification performed to the other events presented results that were very similar in terms of efficiency. The results that are presented in
Table 5 are satisfactory based on R
2 and NSE values in all classes, and acceptable results were not achieved for only one event (3 December). The separation of the events into classes allowed for a better representation of the model. A verification of the calibrated event of 28 November was carried out for the entire period of November, in order to evaluate whether the model is efficient to carry out this representation, and a NSE value of 0.58 and R
2 of 0.8 were obtained, which indicated that simulation per period leads to good representation of the phenomenon.
The current drainage system has several overload points, especially in gallery 1, where the conduit junctions are overflooded, as in
Figure 9, which may reflect the existing imperviousness of the area, with a cluster of tall buildings with impervious parking lots, and an open area, which is probably very impervious while considering that it is used as parking area. Therefore, the location of detention ponds can improve the capacity of the drainage system.
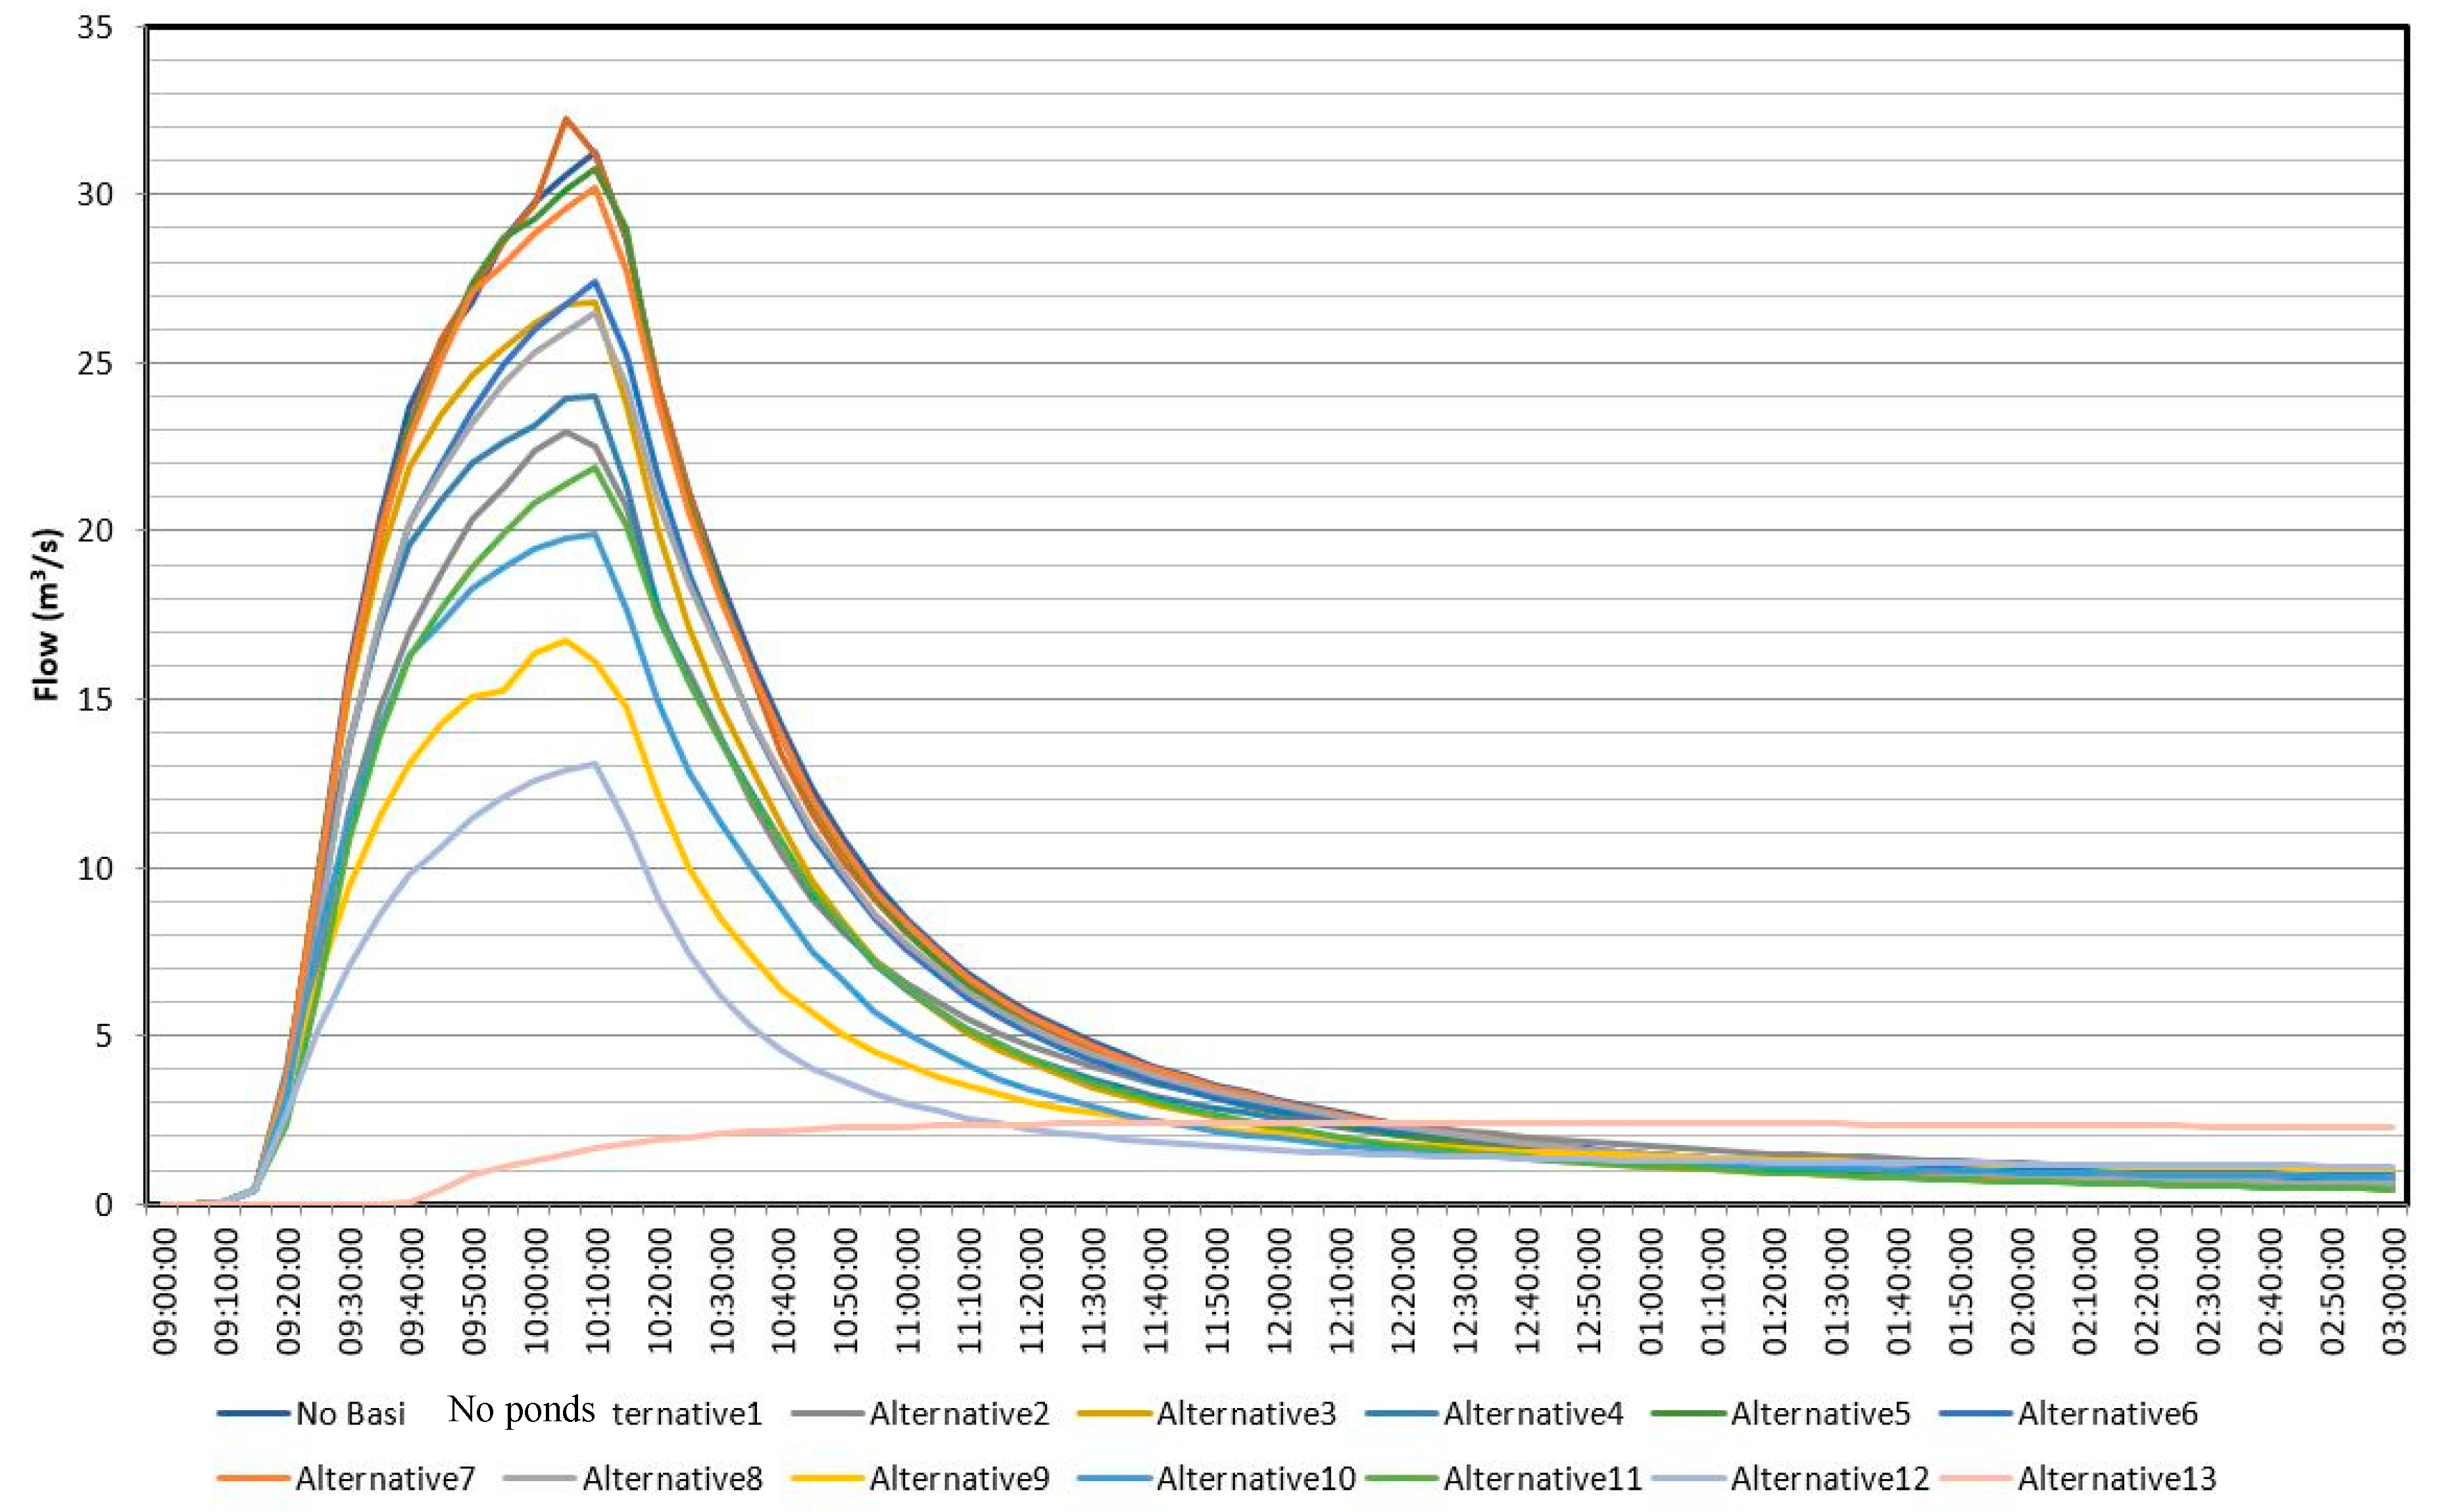
Analyzing the network performance and comparing it with an alternative without LID implementation, alternatives 9, 12, and 13 for each proposed event presented the best results in reducing the flow to the gallery outfall. The differences among the other alternatives are essentially based on the magnitude of the peak flows and, in other words, alternatives 1 to 8 and 11 only changed the peak flow values, as in
Table 6. Except for alternative 13, which led to the largest peak reduction, all of the other alternatives produced similar results, namely the alternatives that combine two or three ponds at the end of the galleries.
The peak flow reduction percentage for each rain was evaluated, and the results show the same trend for all the rainfall patterns. Rain 3 and 7 hydrograms showed the smallest peak reductions, which was probably due to the rain characteristics and the incapability of the system to react to a long−duration rain. Simulations with rain 1 and 6 led to the best results in peak flow reduction, even with the highest intensity rainfall.
Figure 10 presents the flow simulated for all the alternatives when considering the rain 2.
In addition to promoting the regularization of flows, the detention ponds can reduce pollutant loads and their effect were simulated. The removal efficiency of detention ponds is not associated, only with the size of the pond, but also with its characteristics, although larger detention ponds are more efficient in reducing peak flows and improving water quality due to larger detention times.
The combined ponds, which are alternatives 9, 10, 11, and 12, also promoted reductions of significant pollutants loads. In spite of their smaller size, there was no overflow, thus considering that all the flow went through the process of reduction of pollutant loads.
The combined ponds, which are alternatives 9, 10, 11, and 12, also promoted significant reductions of pollutant loads. Overflows did not occur in spite of their smaller size, thus all of the flow went through the process of pollutant load reduction.
Alternative 13 presented the highest flood peak due to the concentration of all the network flow that is directed to the basin at the end of the macro−gallery. This alternative also presented a full storage of the network generated flow.
However, while analyzing the percentage of removal of each pollutant for the different alternatives, it was observed that only alternative 13 reached the typical removal values for detention ponds reported by [
39] at
Table 7. This behavior may reflect the storage duration inside the ponds that allowed the removal.
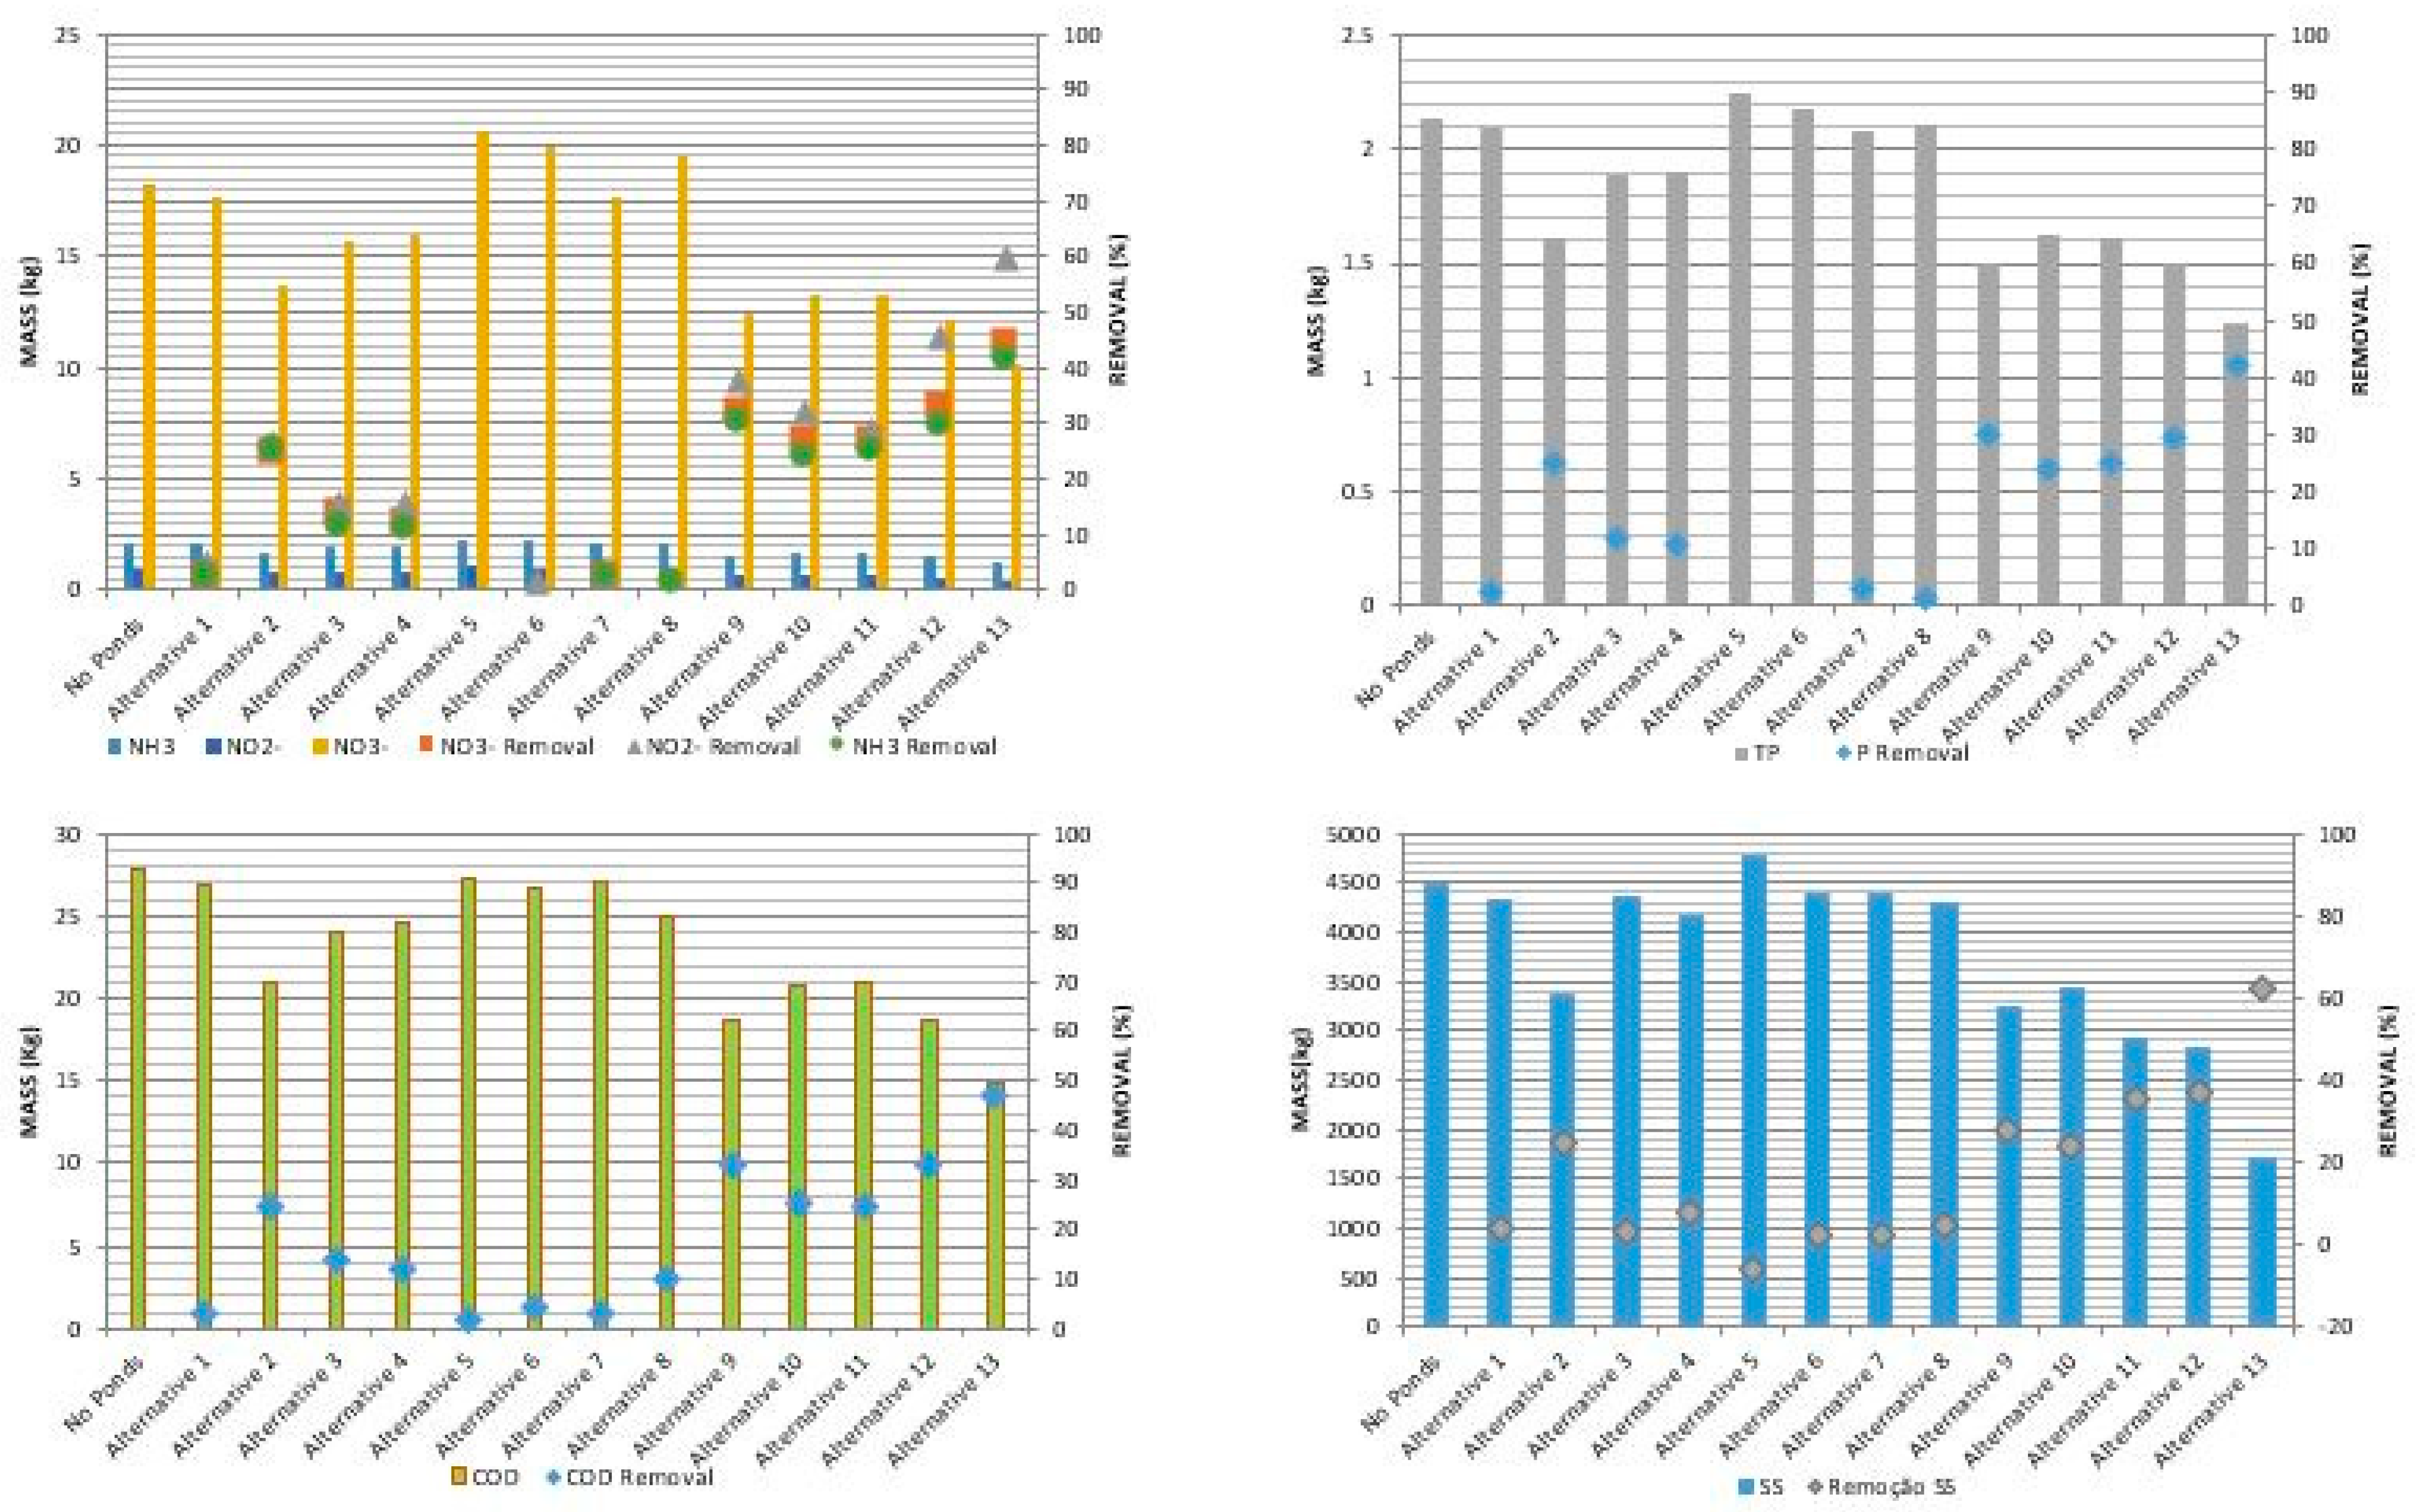
It can be noticed that the performance is similar to flow simulations. For the suspended solids, the best alternative reduced 62%, in nutrients between 40% and 60% and COD 46%, thus confirming the adequacy of the system to urban environments, with flow variables (
Figure 11).
Alternative 2, which considers the pond downstream gallery 1, presents similar reductions as alternatives 10 and 11, with combined ponds in galleries 2, 3, and 4, also as alternatives 9 and 12, confirming that gallery 1 is critical in the drainage system and it must be prioritized when implementing any management solution for the studied area.
When only considering the water quality issue, the pond with larger dimensions (alternative 13) led to the best result. The fact that it can hold the flow for around seven hours allows for a better improvement of effluent water quality. The combined ponds (alternatives 9, 10, 11, and 12) also promoted reductions in pollutants loads. In spite of the ponds smaller sizes, no overflow occurred, and all flow volumes went through the process of pollutant load reduction.
4. Conclusions
The present paper analyzed the effects of LID devices on urban flooding in a highly urbanized sub−basin in Brasília, Brazil, where a LID practice using detention ponds was modelled and compared with the conventional drainage solutions.
The modeled detention ponds, besides promoting flow regularization, can also reduce pollutant loads. The removal efficiency of this type of technique is not only associated with the pond size in relation to the basin area, but also with characteristics of the contributing area.
The SWMM model proved to be an effective and easy-to-use tool for the analysis of drainage systems that involve hydraulic infrastructure and LID installation, and are very important for decision-makers, because it makes it possible to test many alternatives and to evaluate the results.
The simulations demonstrated the efficiency and versatility of the calibrated model to evaluate the temporal distribution of varying contributions of runoffs in the basin and allowed for evaluating the drainage system. Measurements of the watershed water level were used to calibrate the hydrological model. Good values of NSE and R2 were obtained due to calibration.
After simulated 13 detention pond alternatives, with different sizes and location along the drainage system, it was observed that the detention ponds that were located at the center of the watershed had little effect on damping final flow, nevertheless they contributed to better drainage promoted by the pipe network by reducing the drainage system point overflows. It was also observed that the detention ponds would have the same flow damping efficiency if they were reduced to 70% in relation to the original size, because their storage capacity was oversized (according to the local technical report).
The actual drainage system is clearly undersized, with severe floodings every two to three years. Alternative projects that were proposed to the area include resizing the mains, extend the drainage network, and the construction of a detention pond at the downstream end. The proposed detention pond construction was ruled out by its impact on the lake scenario.
The detention pond that was located at the downstream part of the basin, in the simulations result in more significant damping of the system outflow. The simulated reductions achieved were 10–30% of the flow peak, and it was possible to reduce its dimensions by 20%, while considering that the detention ponds did not reach their maximum level for the critical design rainfall.
Implementing distributed detention ponds can be an alternative to resizing the drainage network that has several points operating at their capacity limit. The alternatives that considered the combination of detention pond implementation were the ones that presented the best reduction in the peak downstream of the basin, reaching values of 30–60% reduction.
The results show the large potential of integrated stormwater strategies to improve the urban environment and the quality of life. A control strategy for the outflow from these alternatives to the receiving water bodies is developed to ensure hydraulic sustainable discharge. The proposed control strategy will keep the maximum outflow at predevelopment levels and more efficiently use the capacity of the ponds.
For suspended solids, the simulation of the performance of the detention ponds showed a reduction of nutrient loads of 40–60% and COD 46%, thus indicating the adequacy of sustainable drainage devices in this existing system.
Therefore, structural changes, such as detention ponds along the drainage system, must be considered to improve the urban drainage system and should be adopted by government policies to solve the problems of flooding and water quality of stormwater in the studied and similar areas, where there are available public areas.
Strong demand for better stormwater management is expected when considering the likely worsening of extreme rainfall events and increase of soil sealing by constructions. Thus, cities, like Brasília, although fully planned and with less than a century, will need to be adapted to this scenario by implementing more sustainable solutions to ensure urban resilience, which are key roles for the uncertain future.
In future works for this area, it is important to evaluate the combined implementation of LIDs to increase the infiltration and flow reduction and reduce pollutant loads to the Paranoa Lake. It is also important to evaluate costs and avoid large−scale impacts within the area. The studied alternatives are not the only solution for the system flooding. It is obvious that the interventions need to be done before the flow gets into the drainage system. LIDs, such as swales and infiltration trenches, must be associated with the detention pond alternatives to enhance the infiltration rates.


