Fine Sediment Modeling During Storm-Based Events in the River Bandon, Ireland


Abstract
1. Introduction
2. Materials and Methods
2.1. Vansickle and Beschta (1983) Modified
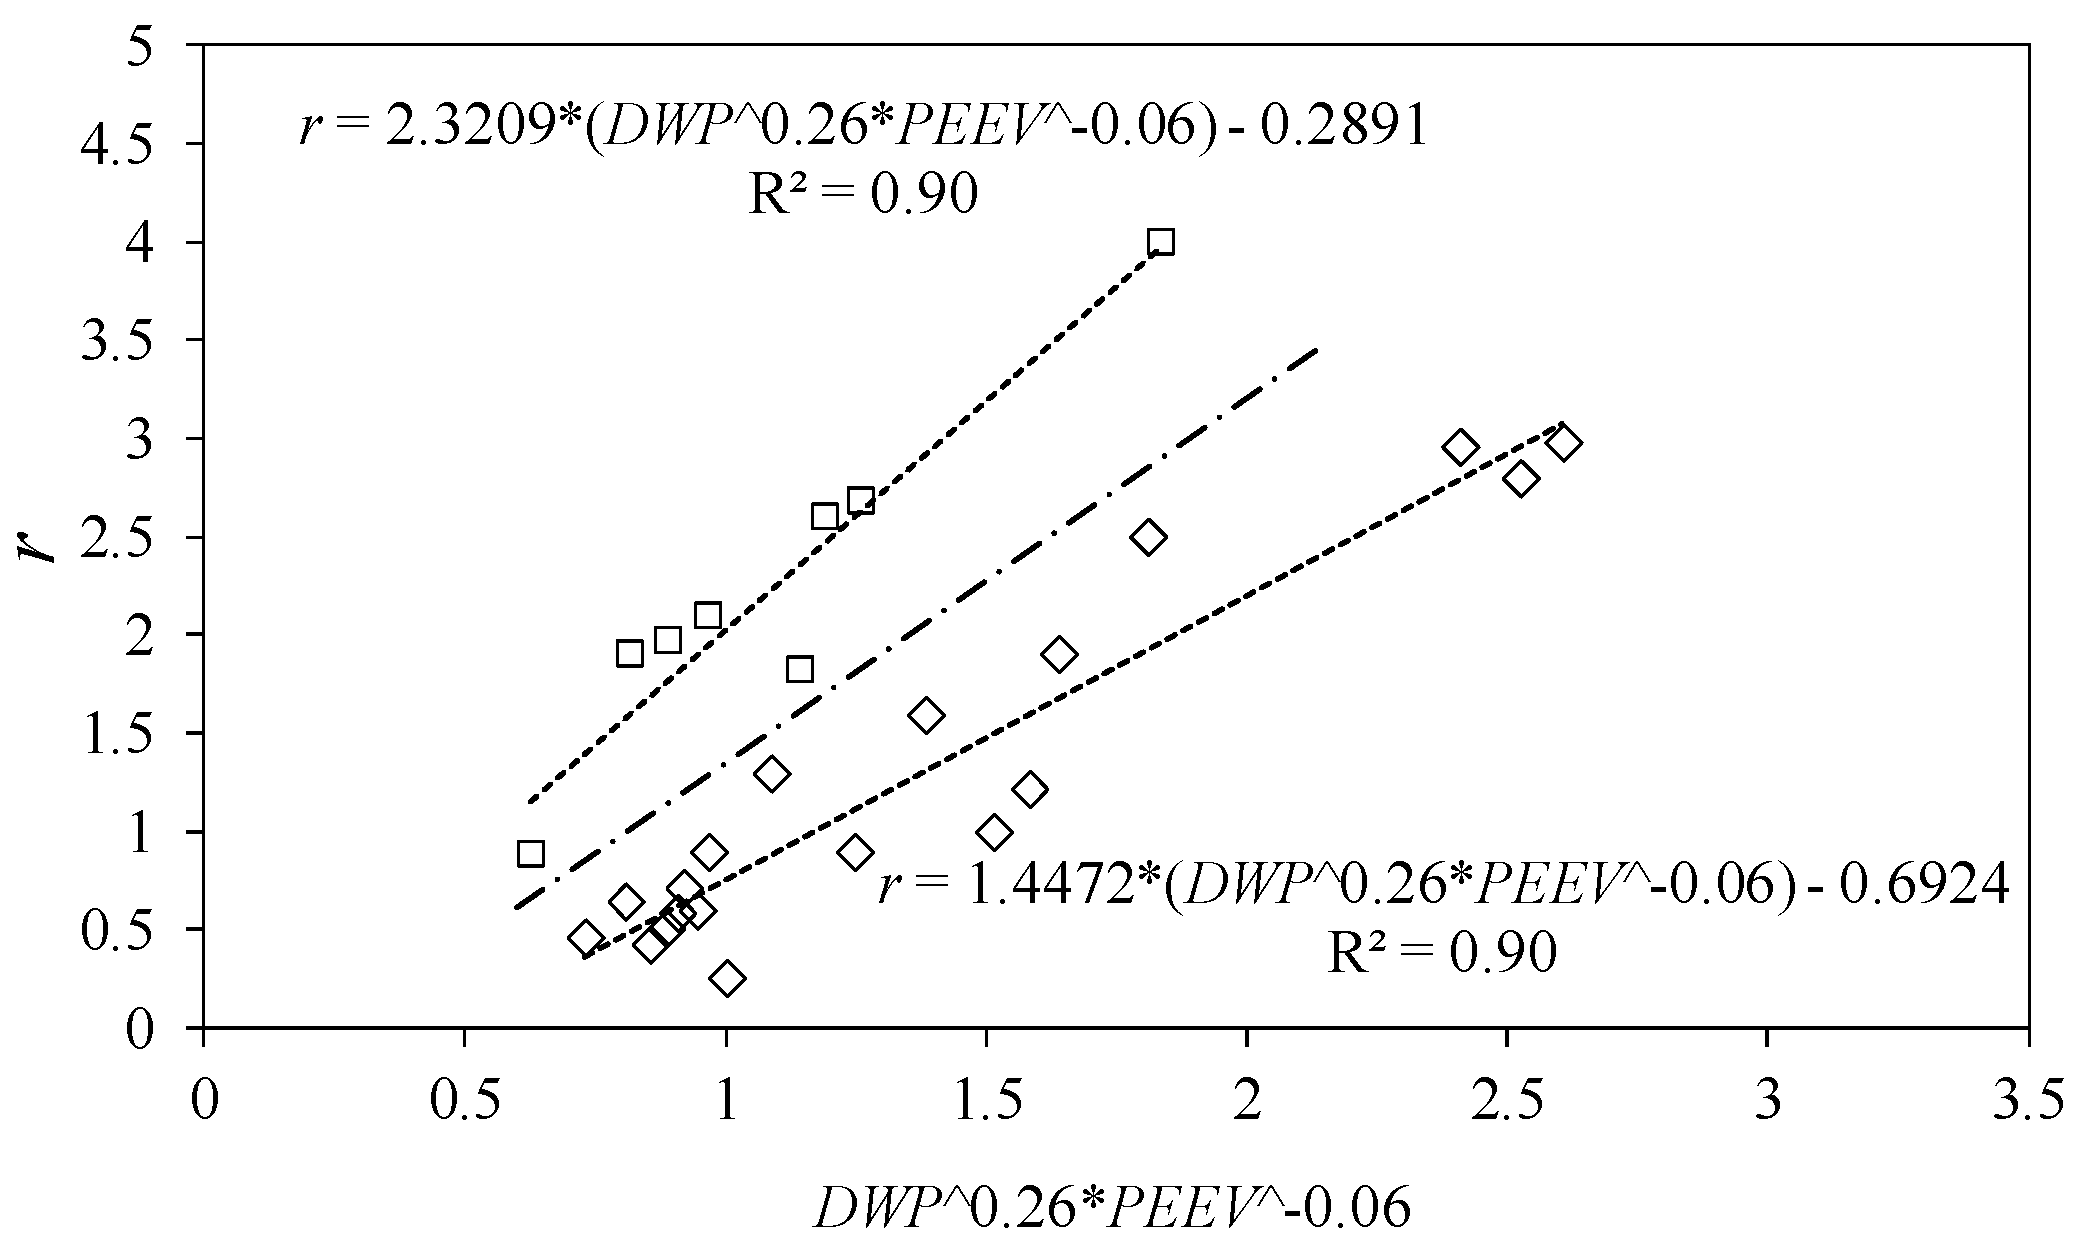
2.2. Garcia et al. (2017, 2018) Modified
2.3. Shear Stress Erosion-Based Formulation
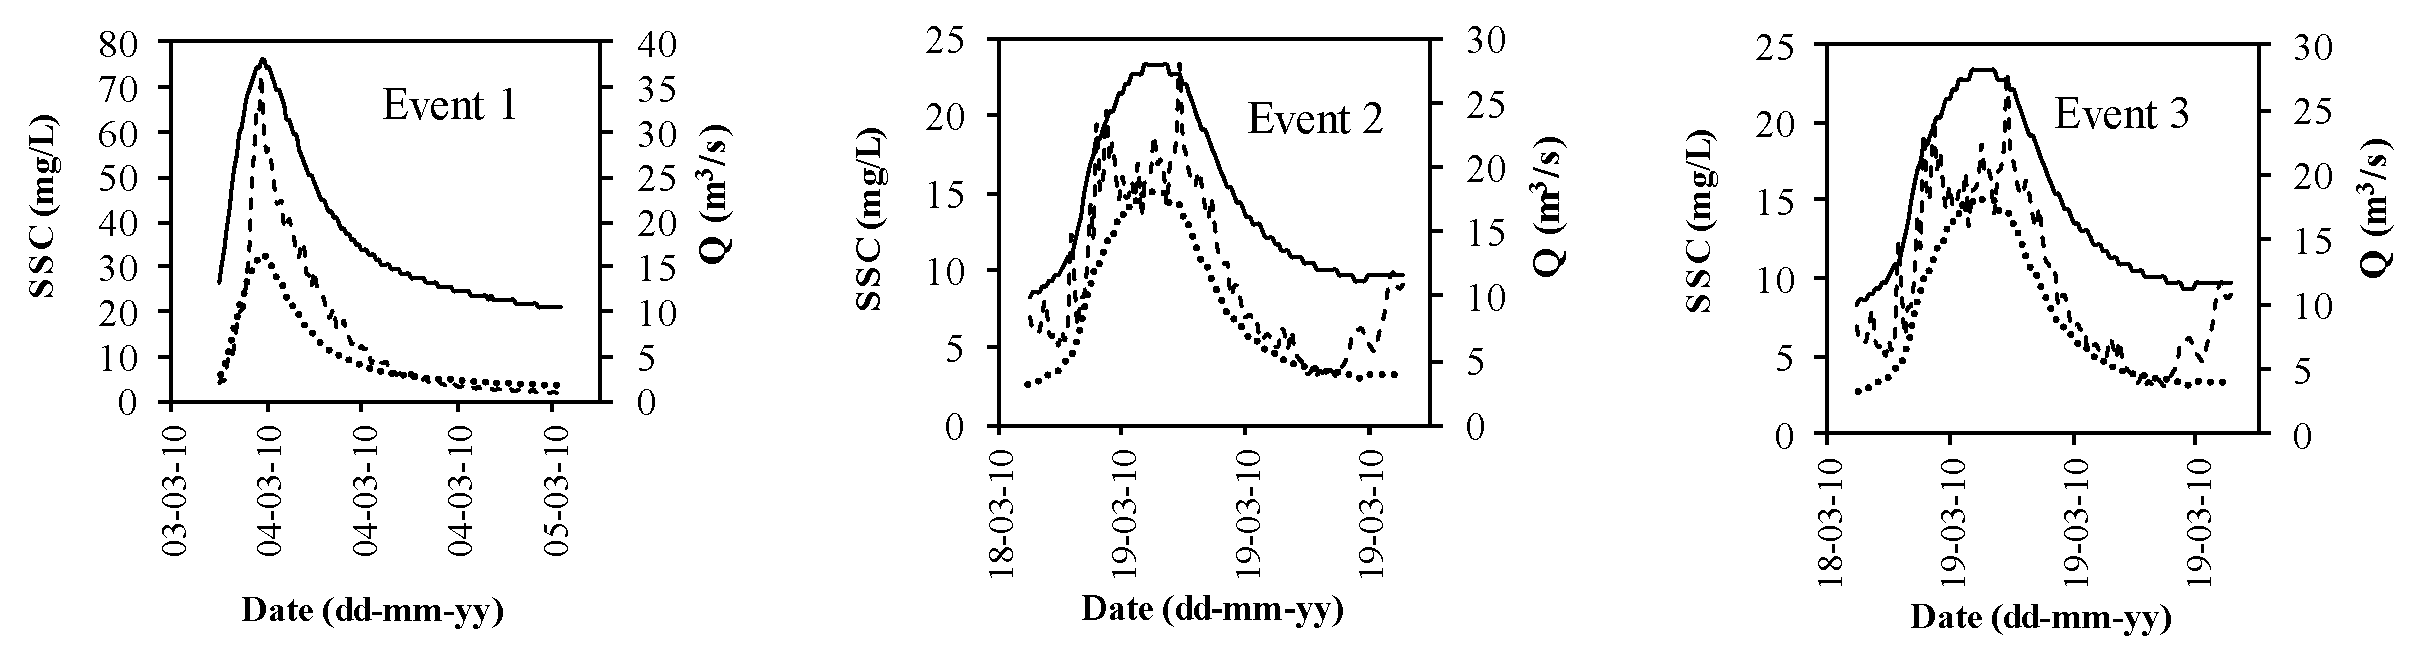
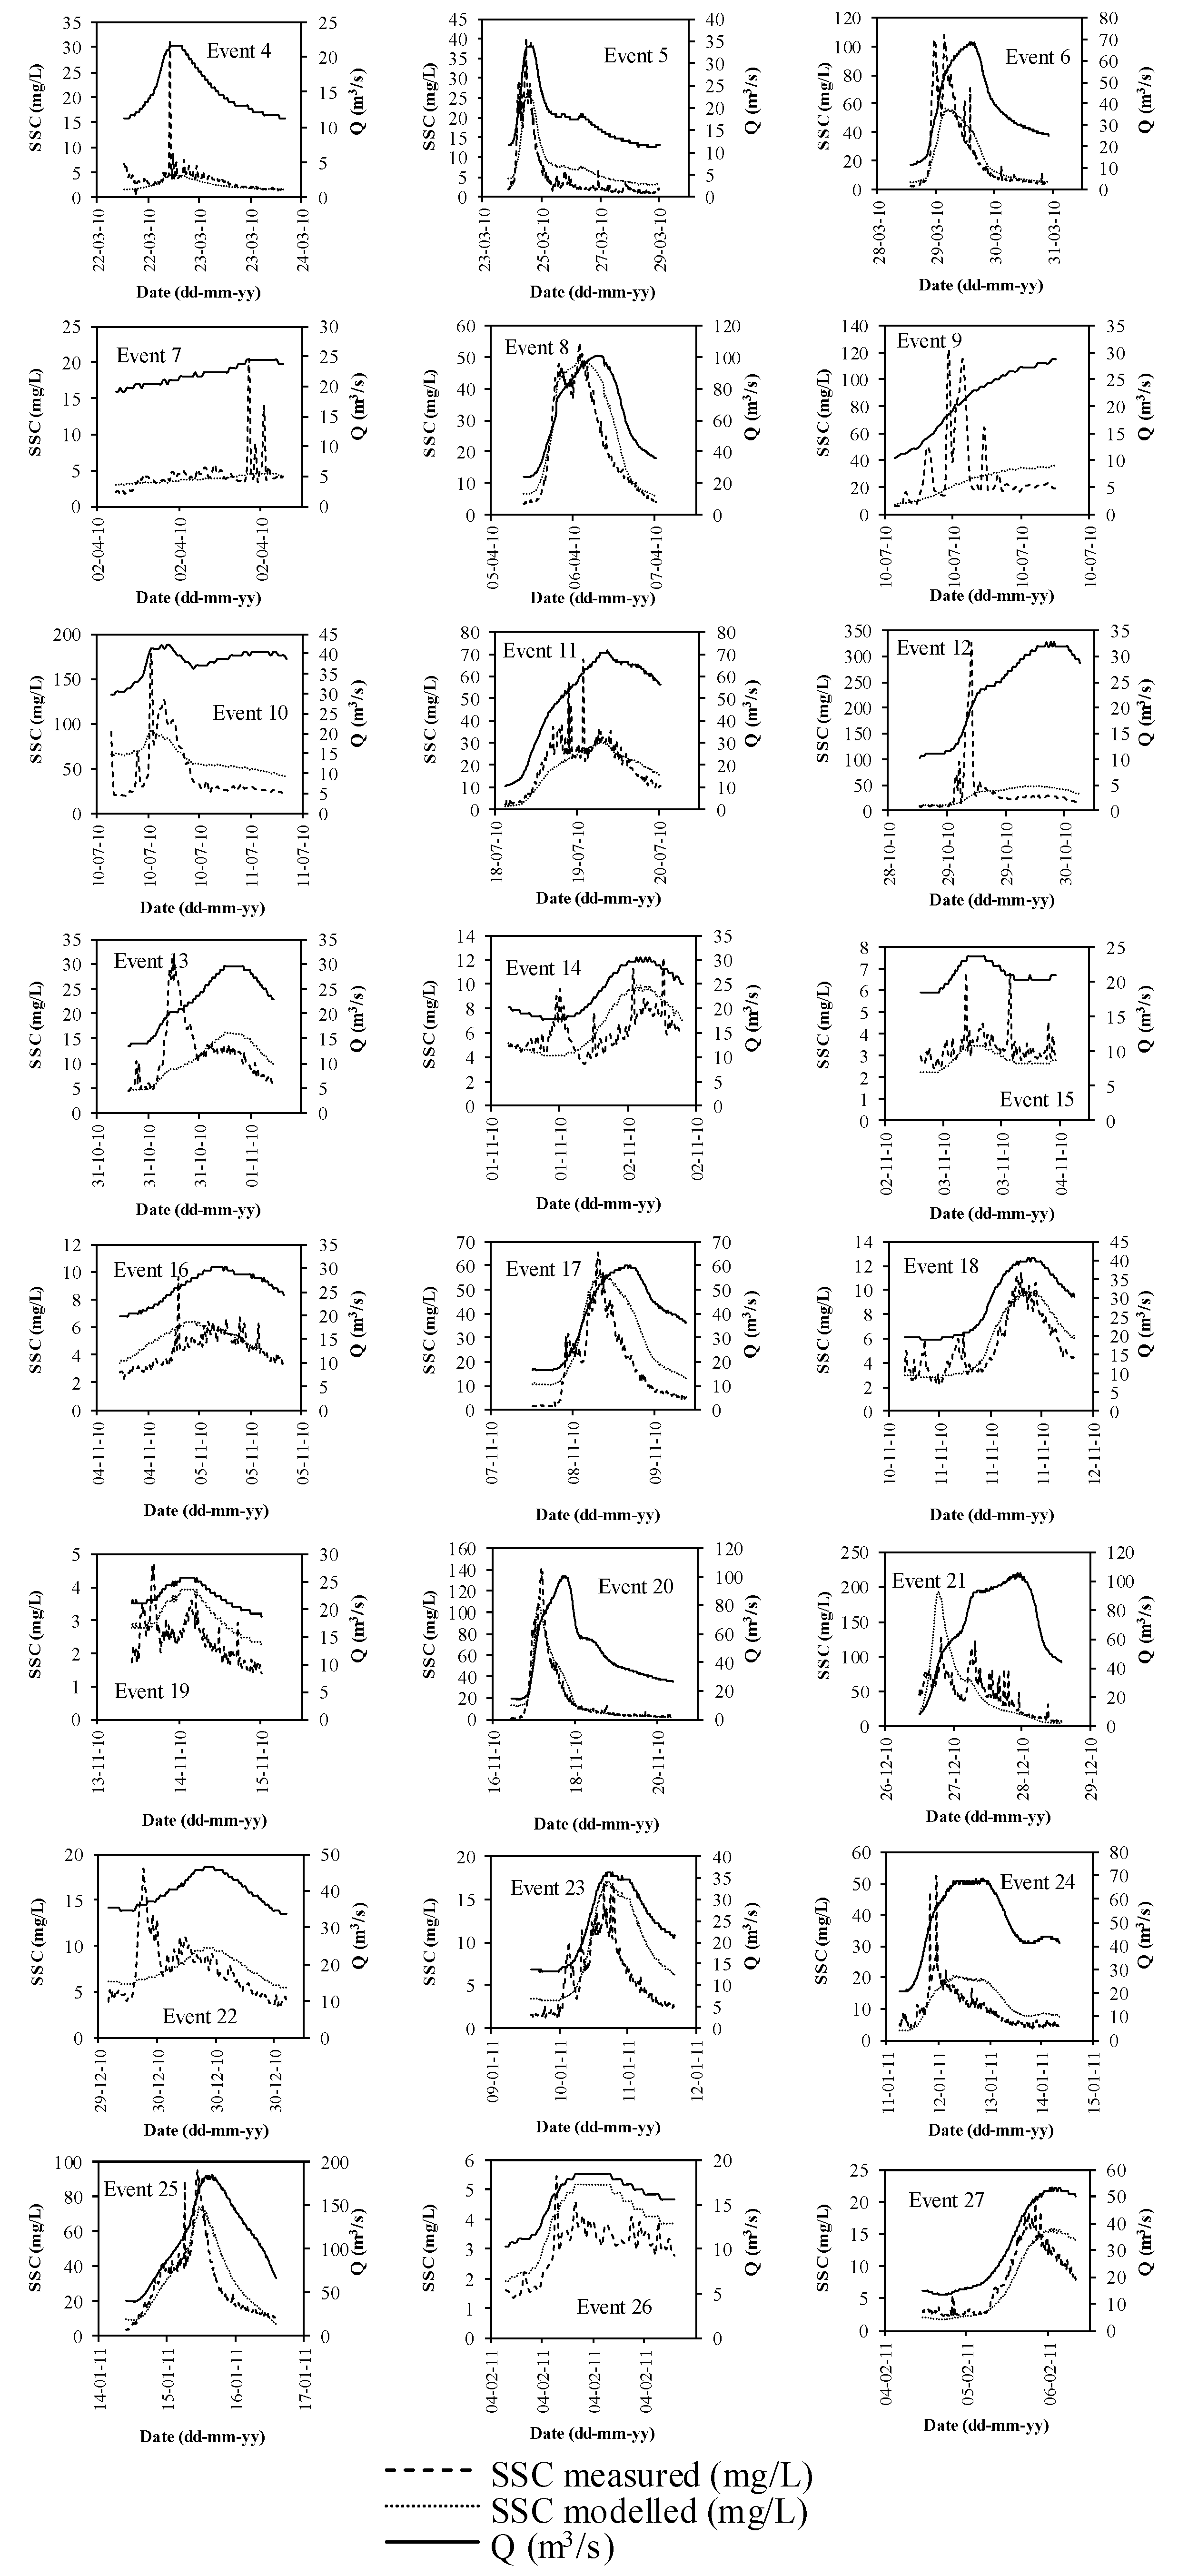
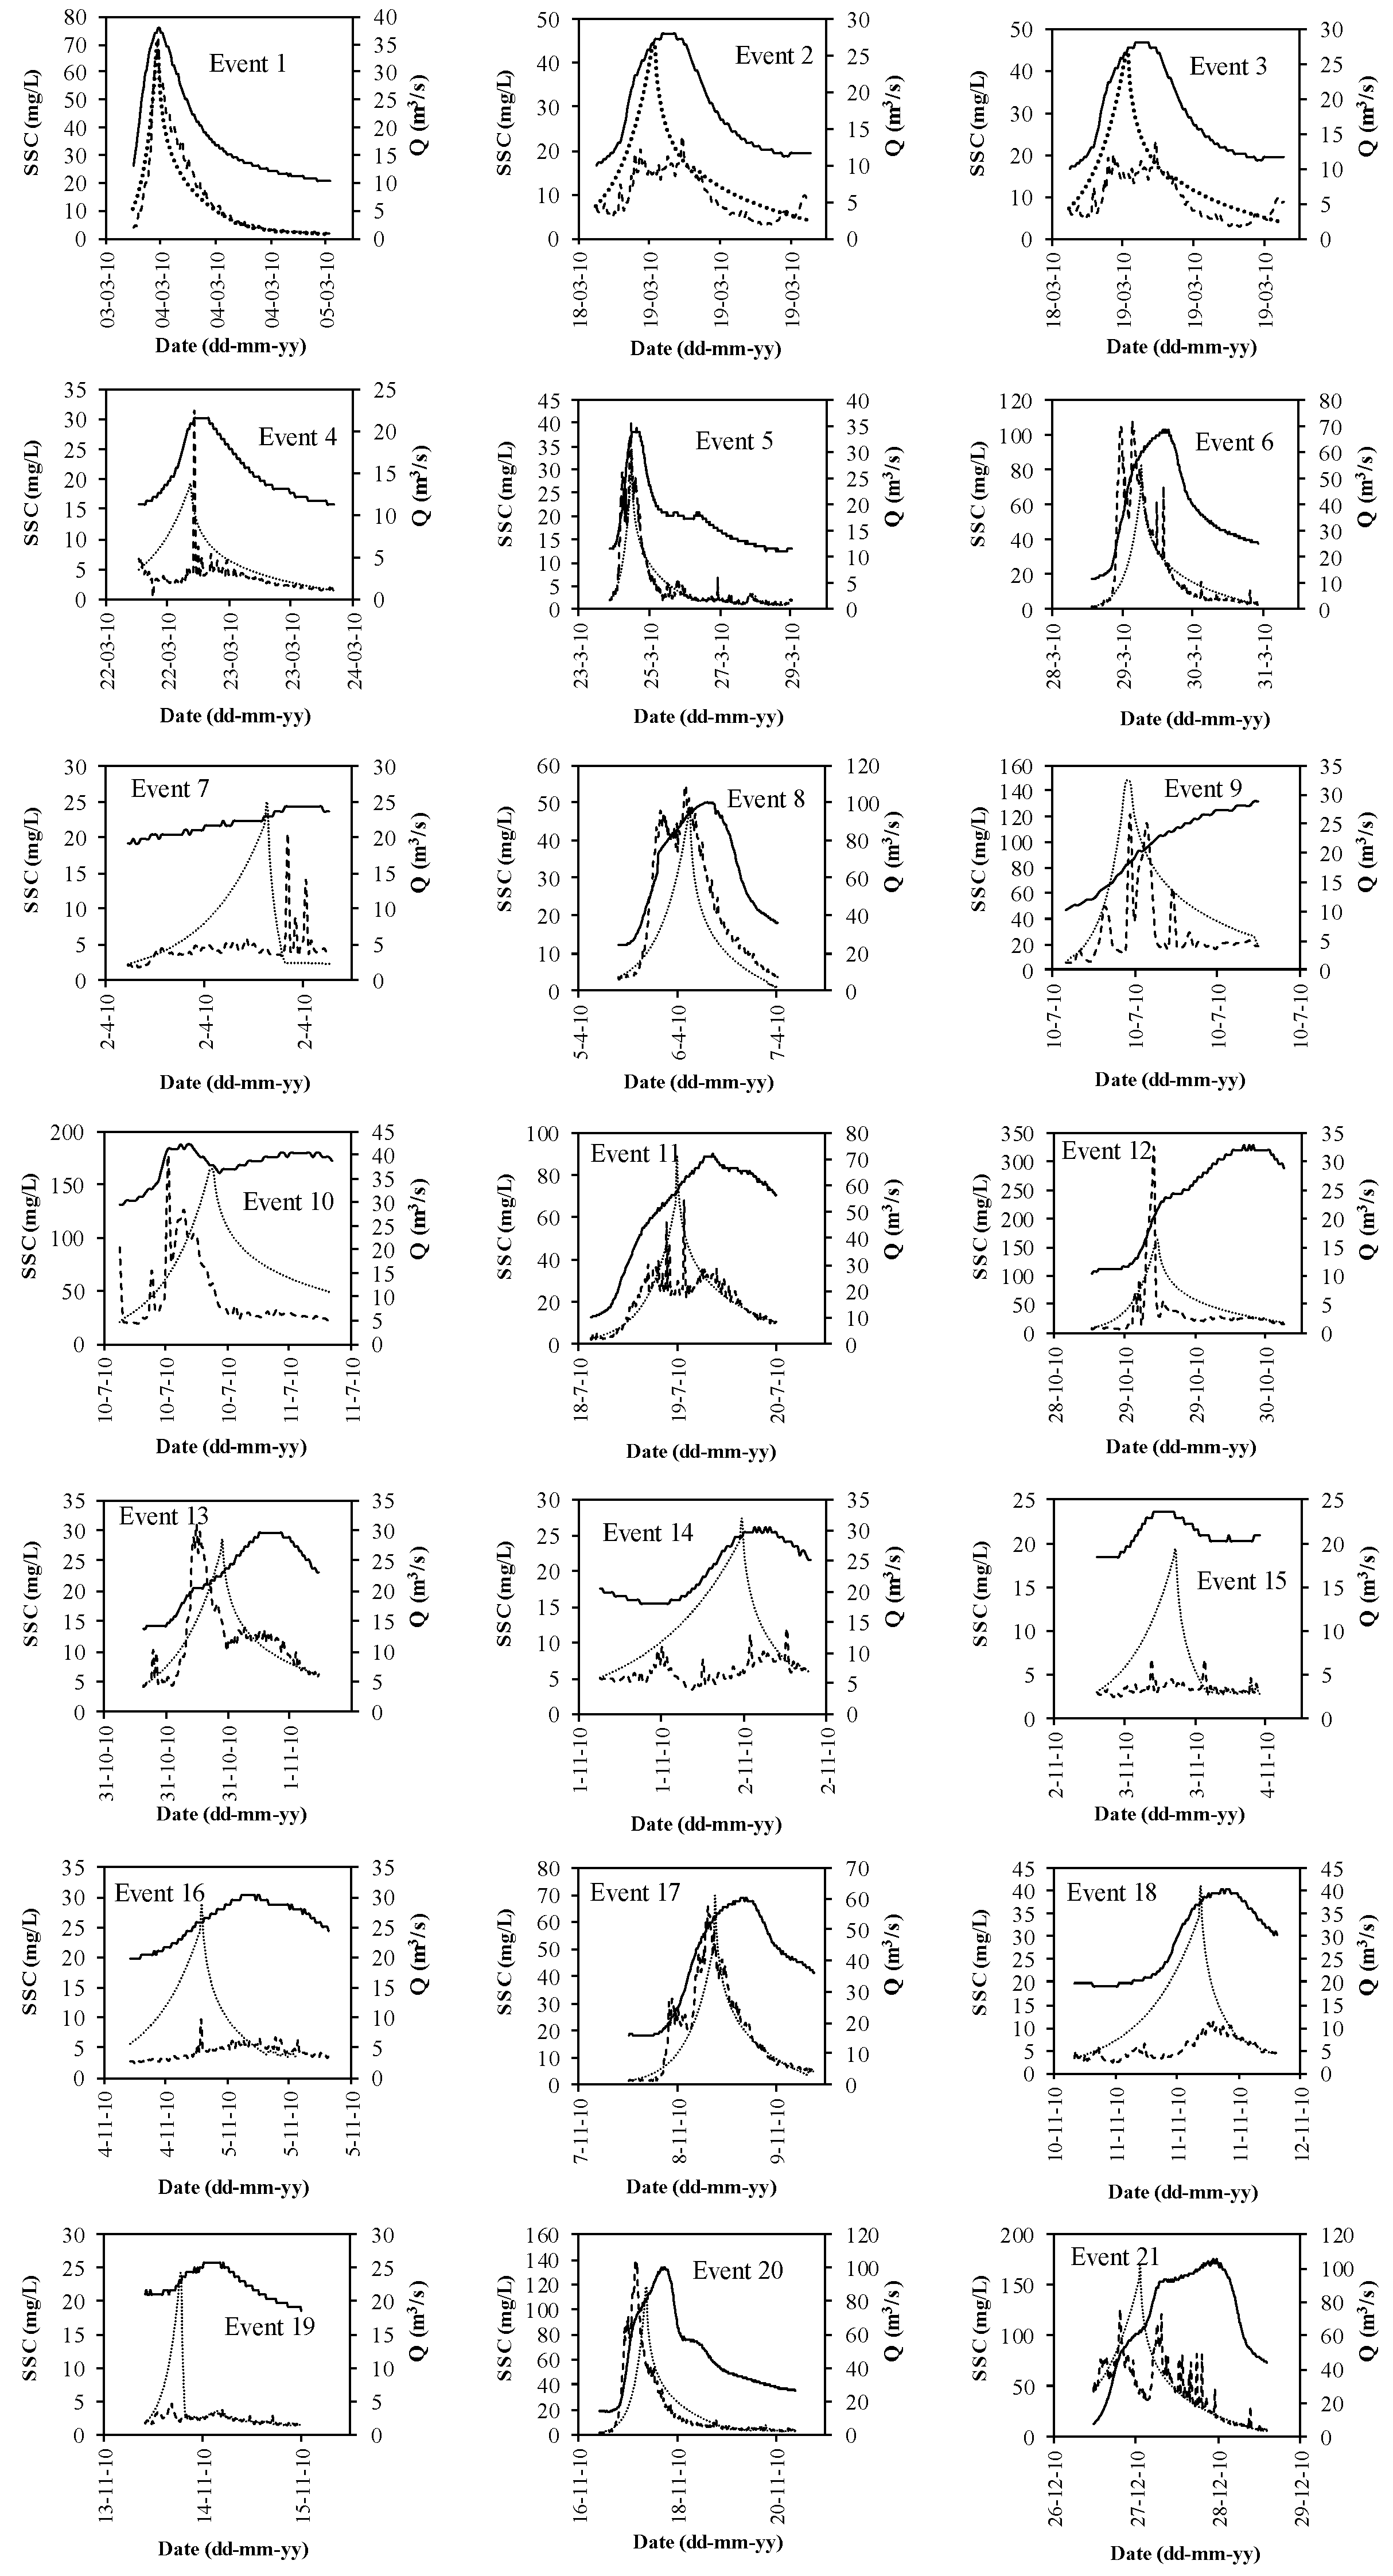
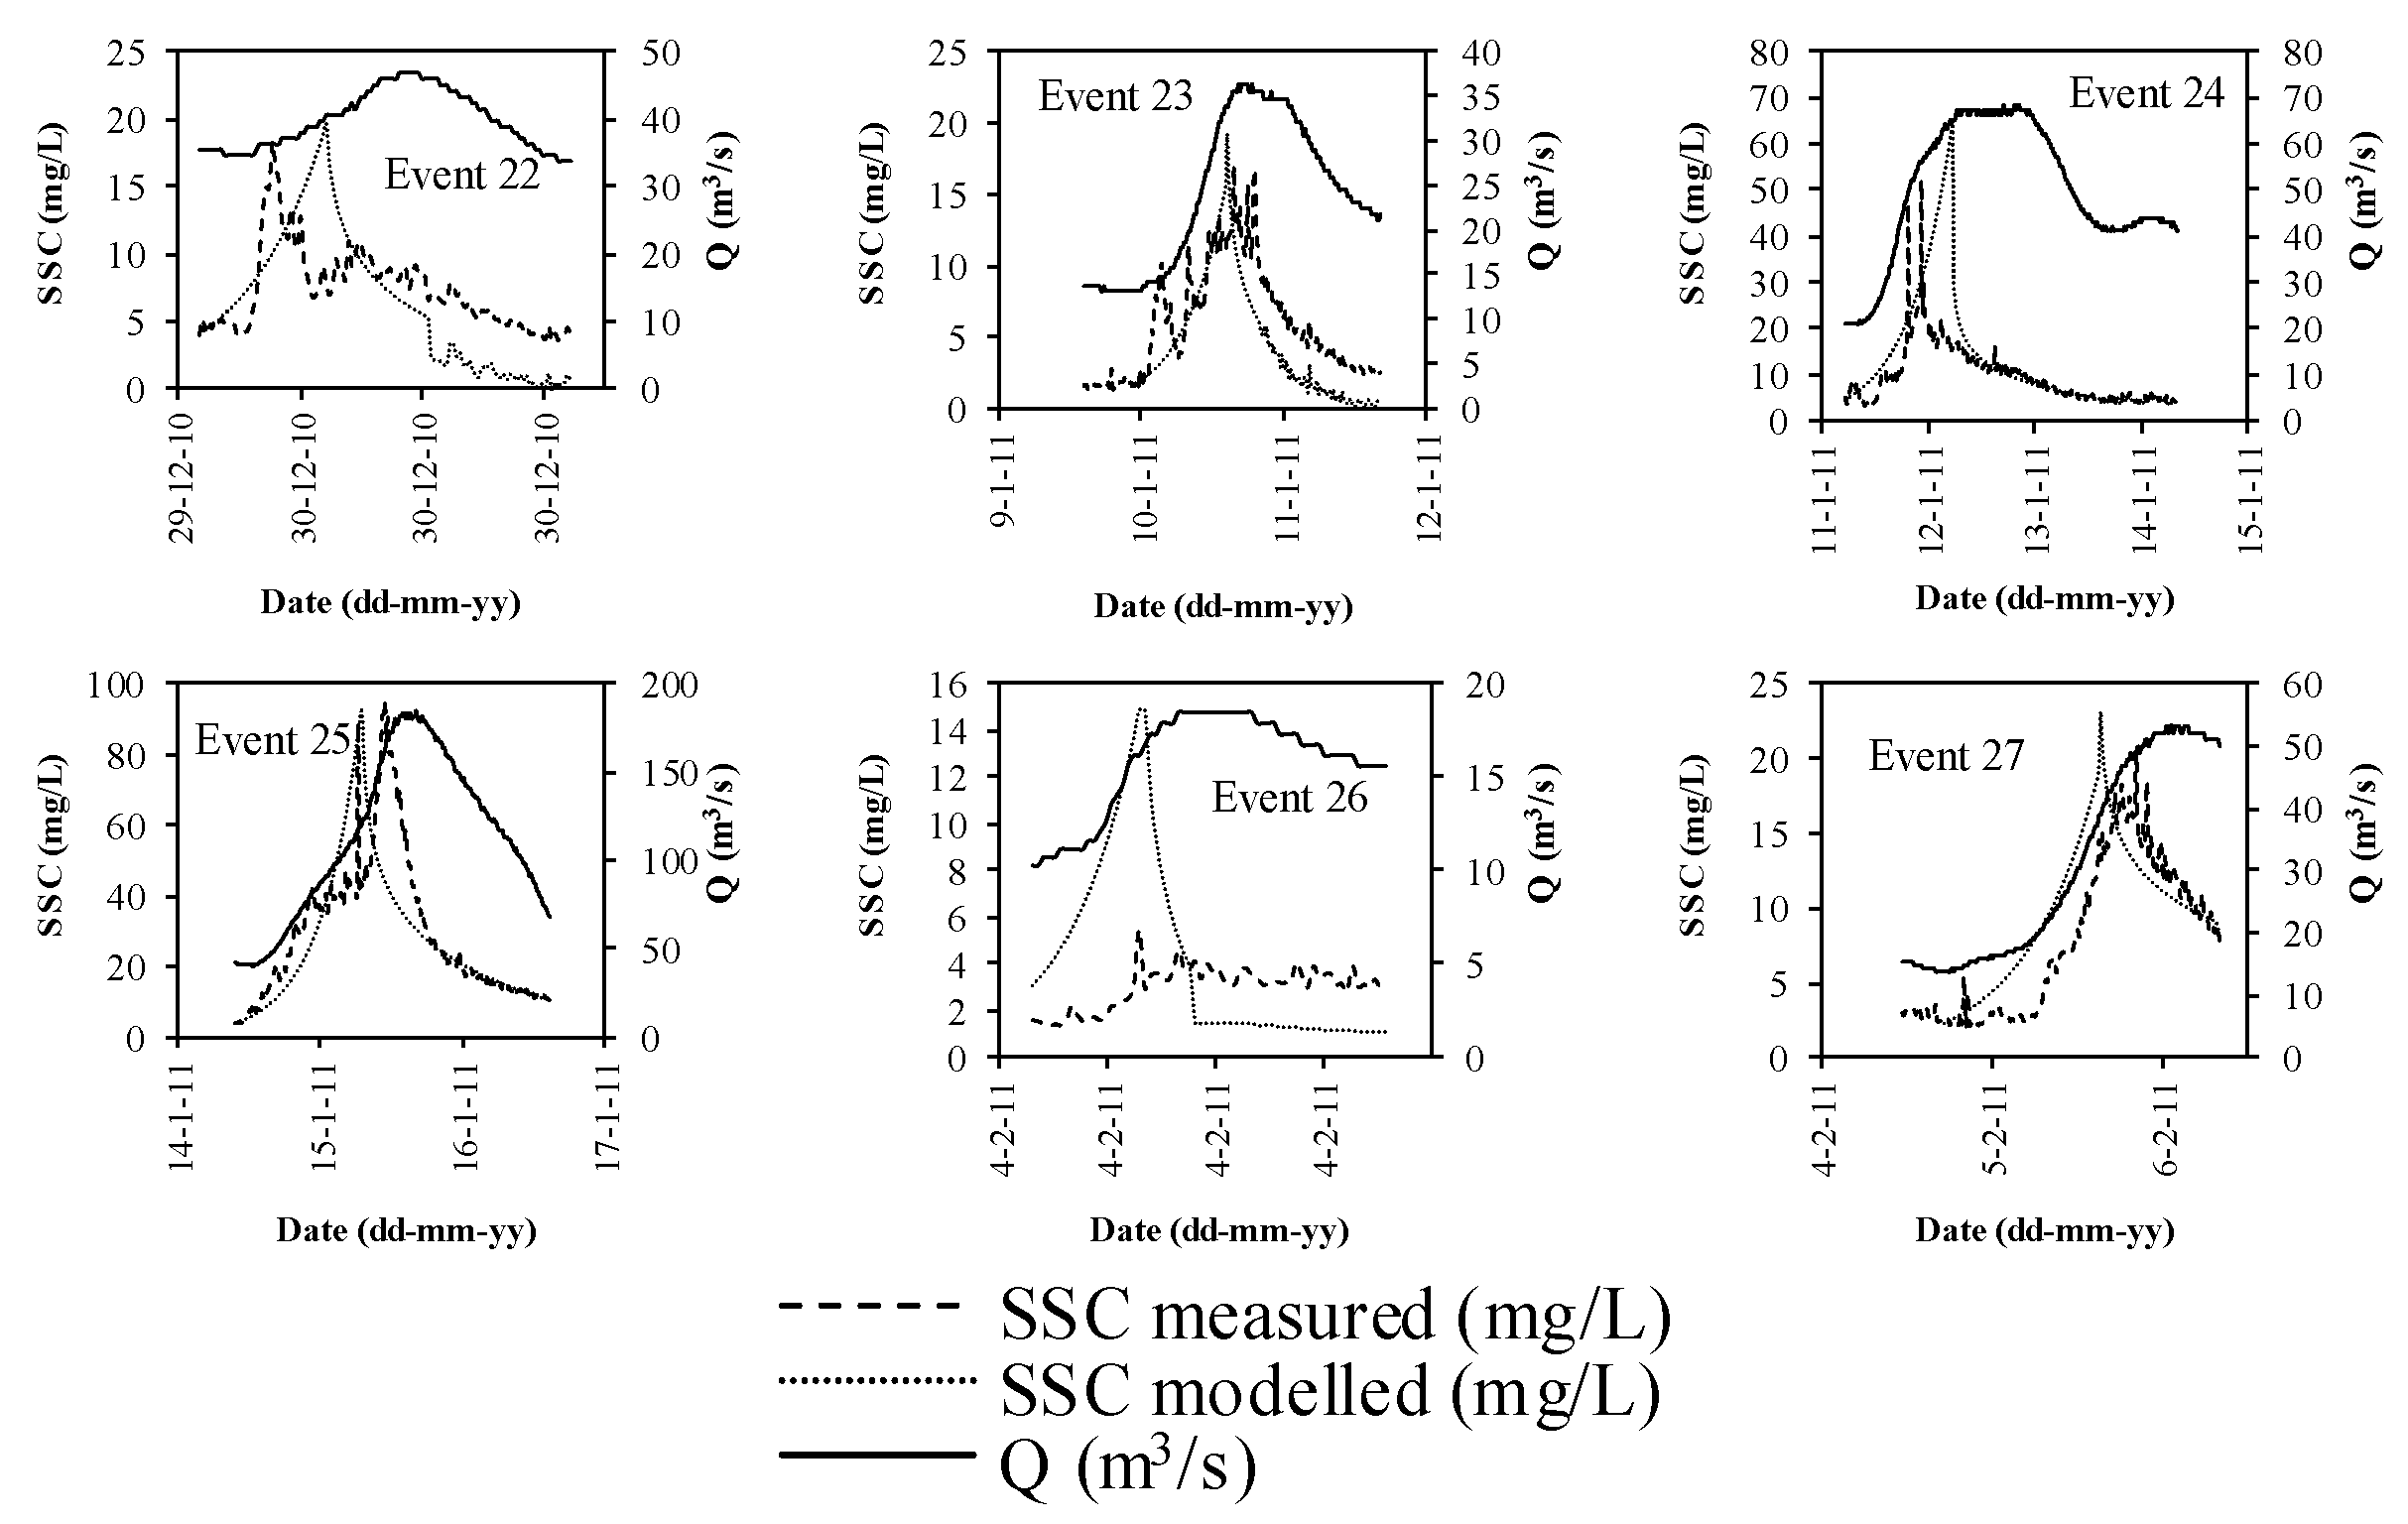
3. Results and Discussion
3.1. Vansickle and Beschta (1983) Modified
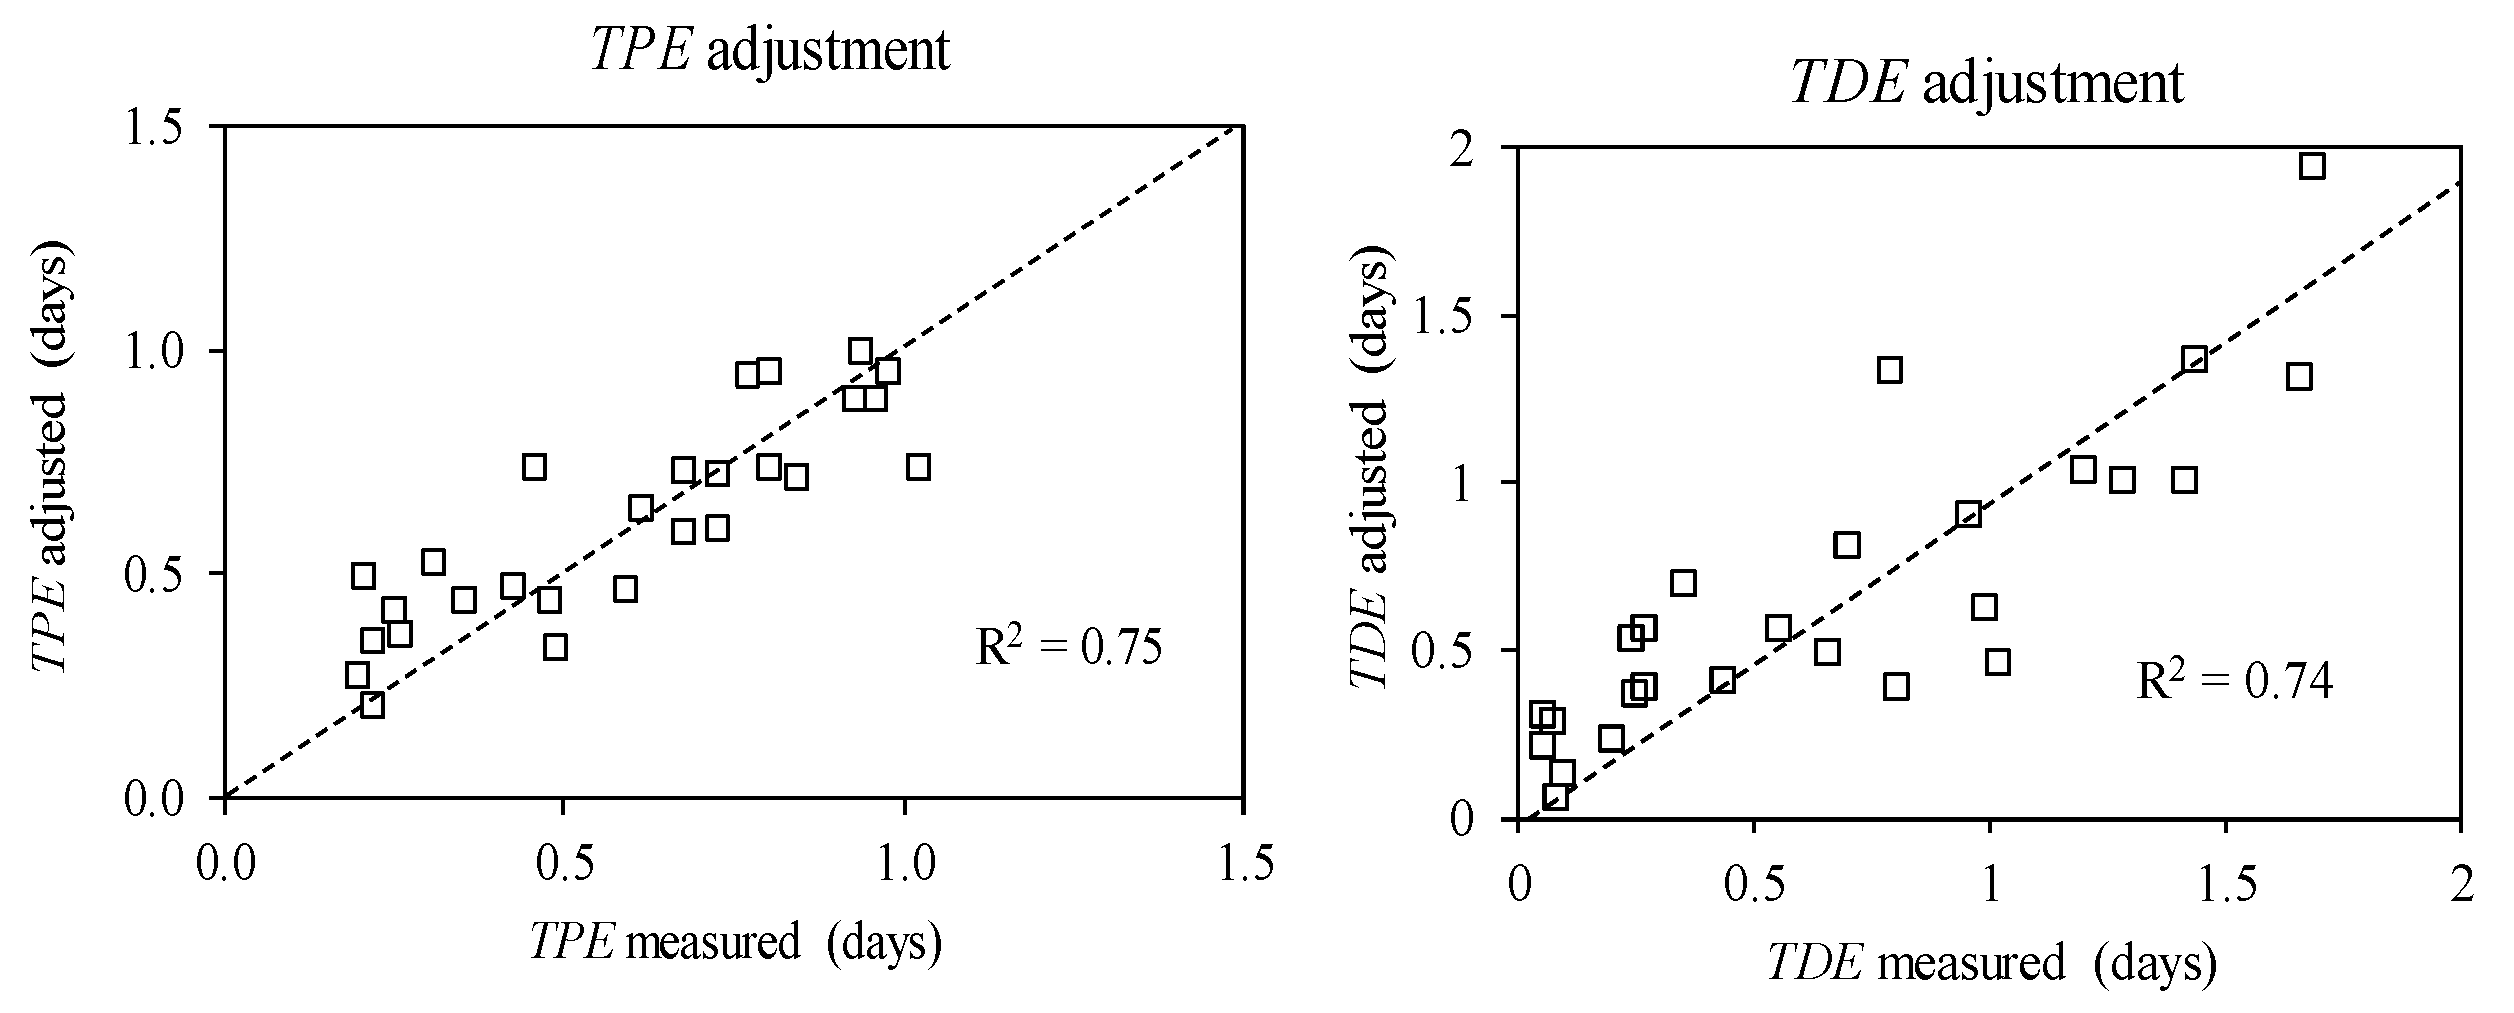
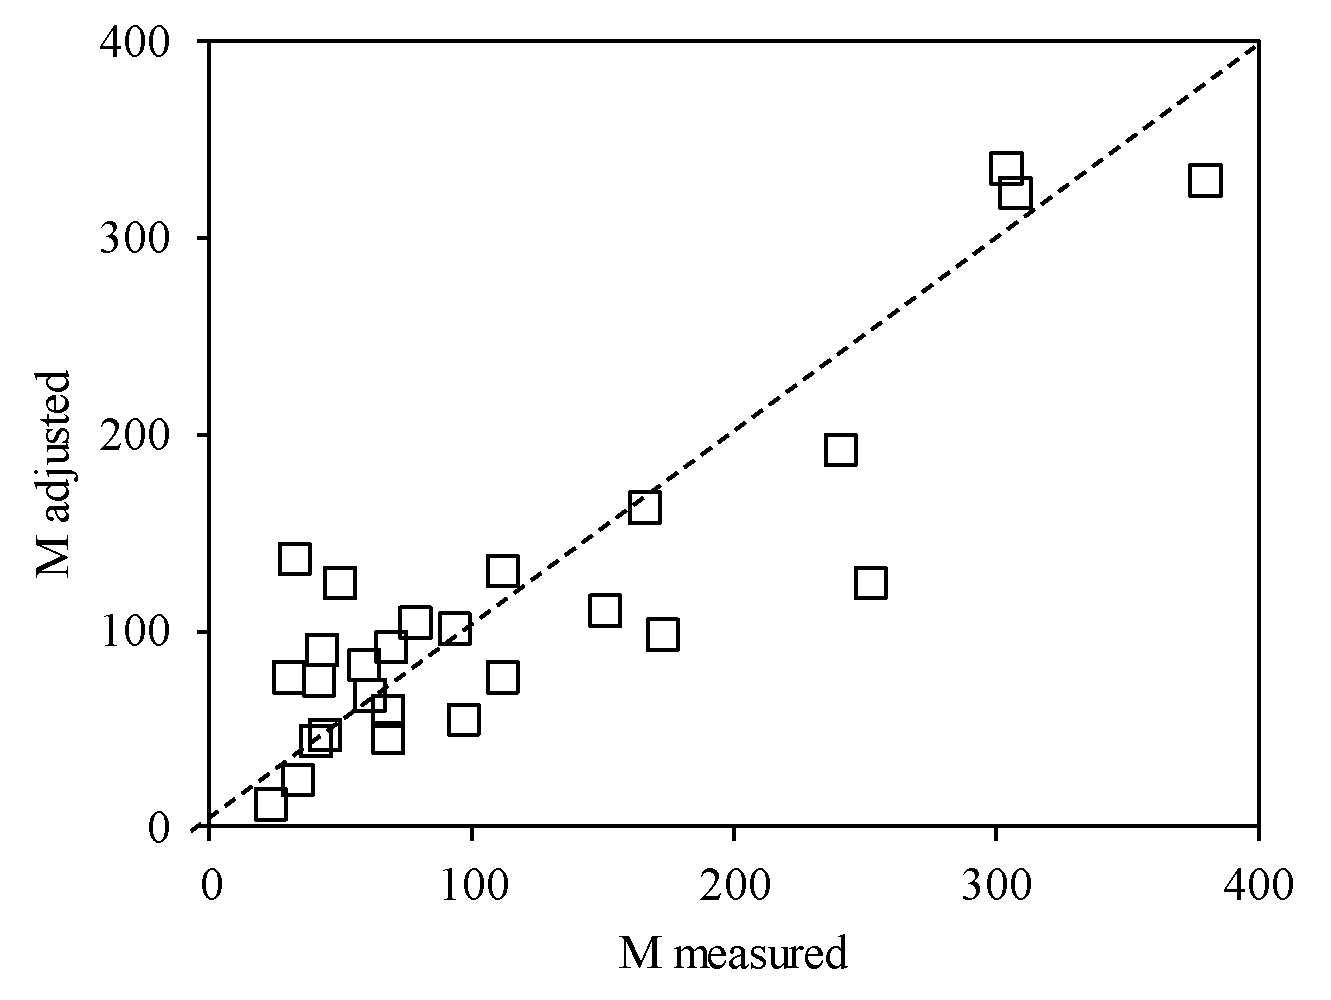
3.2. Garcia et al. (2017, 2018) Modified
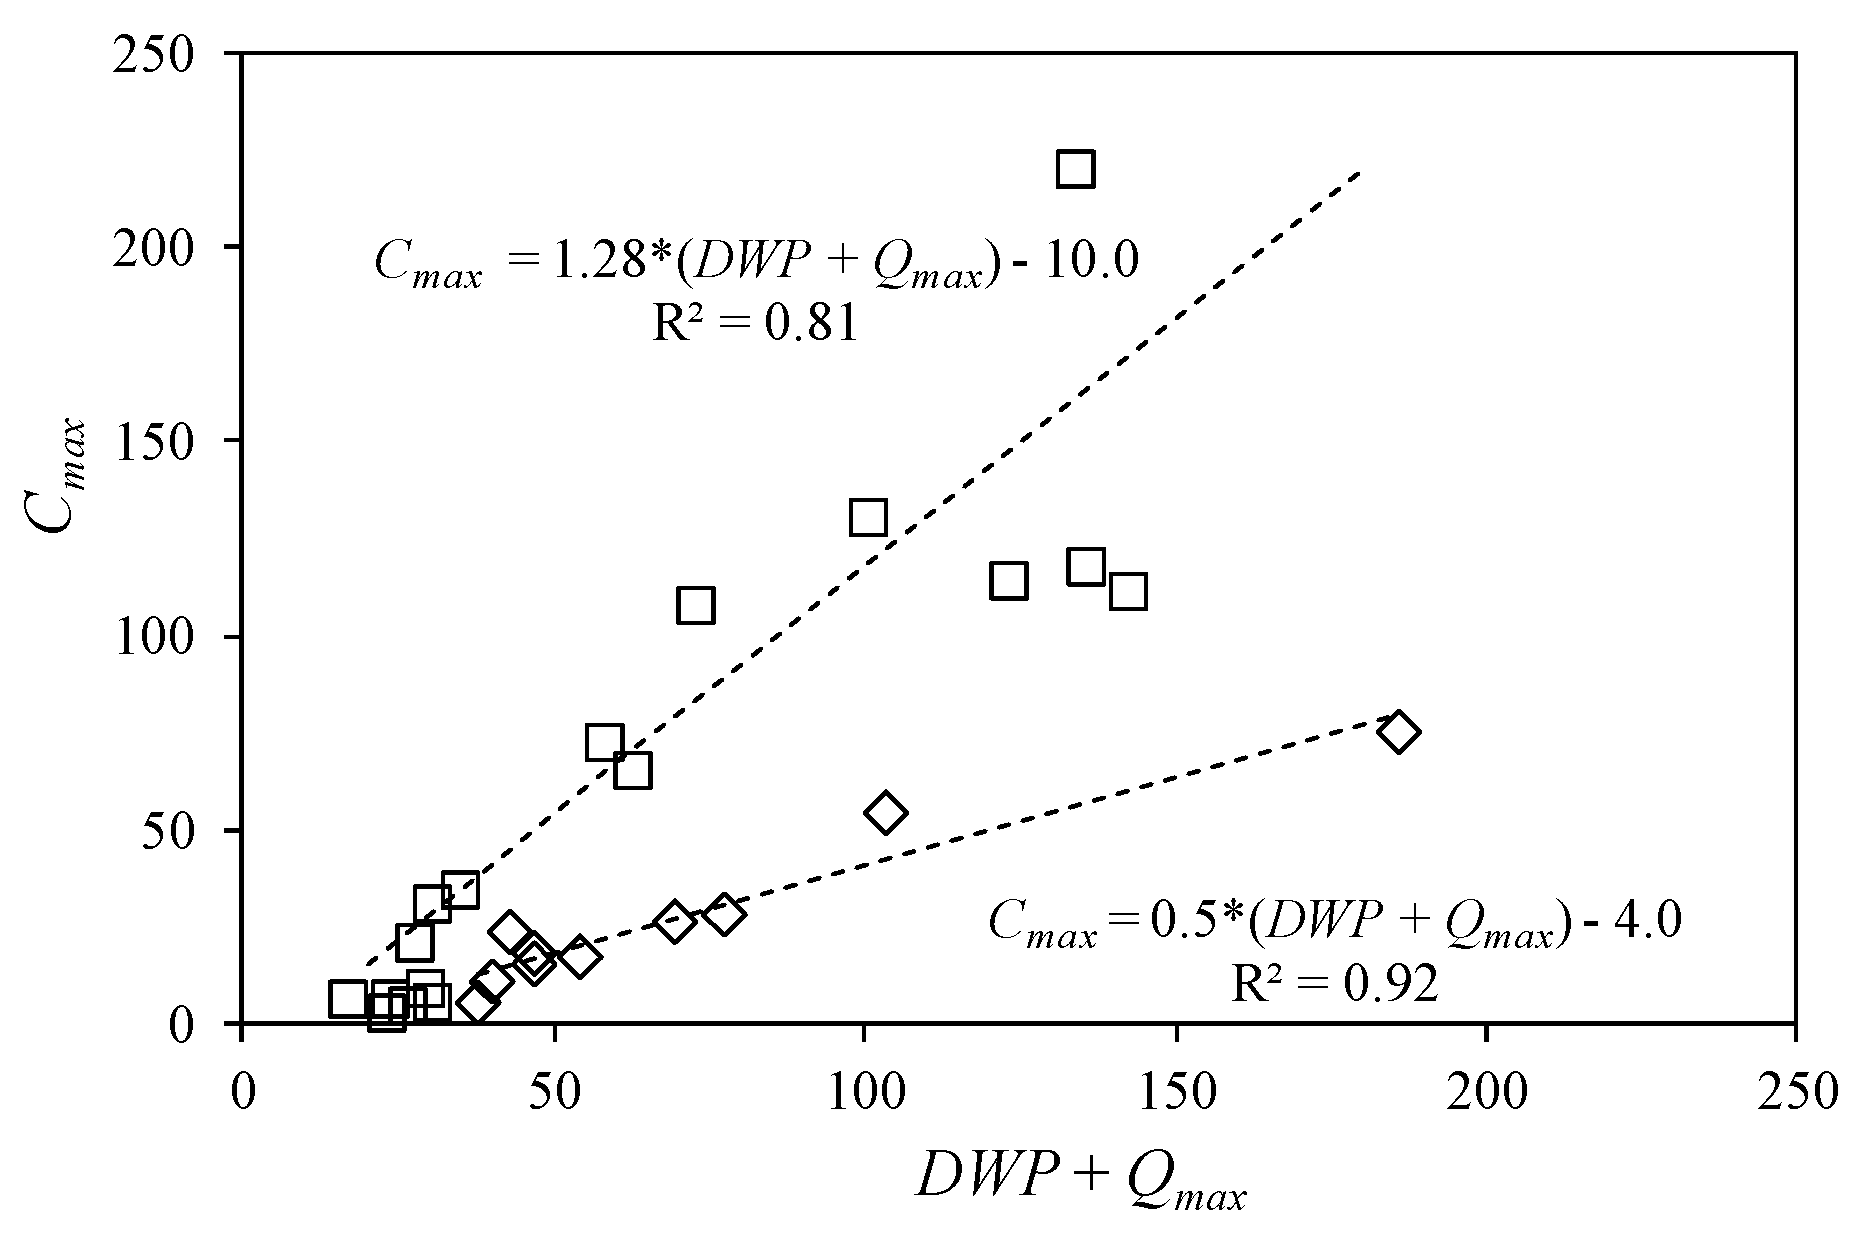
3.3. Shear Stress Erosion-Based Formulation
4. Conclusions
Author Contributions
Funding
Acknowledgments
Conflicts of Interest
References
- Park, J.; Hunt, J.R. Modeling fine particle dynamics in gravel-bedded streams: Storage and re-suspension of fine particles. Sci. Total Environ. 2018, 634, 1042–1053. [Google Scholar] [CrossRef] [PubMed]
- Vansickle, J.; Beschta, R.L. Supply-based models of suspended sediment transport in streams. Water Resour. Res. 1983, 19, 768–778. [Google Scholar] [CrossRef]
- García, J.T.; Espín-Leal, P.; Vigueras-Rodriguez, A.; Castillo, L.G.; Carrillo, J.M.; Martínez-Solano, P.D.; Nevado-Santos, S. Urban Runoff Characteristics in Combined Sewer Overflows (CSOs): Analysis of Storm Events in Southeastern Spain. Water 2017, 9, 303. [Google Scholar] [CrossRef]
- García, J.T.; Espín-Leal, P.; Vigueras-Rodríguez, A.; Carrillo, J.M.; Castillo, L.G. Synthetic Pollutograph by Prediction Indices: An Evaluation in Several Urban Sub-Catchments. Sustainability 2018, 10, 2634. [Google Scholar] [CrossRef]
- Harrington, J.R.; Harrington, S.T. Sediment and nutrient behaviour on the River Bandon, Ireland. River Basin Manag. 2012, 7, 215–226. [Google Scholar]
- Harrington, S.T.; Harrington, J.R. Dissolved and particulate nutrient transport dynamics of a small Irish catchment: The River Owenabue. Hydrol. Earth Syst. Sci. 2014, 18, 2191–2200. [Google Scholar] [CrossRef]
- Harrington, S.T.; Harrington, J.R. The influence of storm based events on the suspended sediment flux in a small scale river catchment in Ireland. In Monitoring, Simulation, Prevention and Remediation of Dense and Debris Flows IV; WITpress: Southampton, UK, 2012; Volume 4, p. 173. [Google Scholar]
- Harrington, S.T.; Harrington, J.R. An assessment of the suspended sediment rating curve approach for load estimation on the Rivers Bandon and Owenabue, Ireland. Geomorphology 2013, 185, 27–38. [Google Scholar] [CrossRef]
- Krone, R.B. Flume Studies of the Transport of Sediment in Estuarial Shoaling Processes, Final Report, Hydraul; Engineering Laboratory and Sanitary Engineering Research Laboratory, University of California: Berkeley, CA, USA, 1962. [Google Scholar]
- Partheniades, E. A Study of Erosion and Deposition of Cohesive Soils in Salt Water; University of California: Berkeley, CA, USA, 1965. [Google Scholar]
- Park, J. Coupling fine particle and bedload transport in gravel-bedded streams. UC Berkeley ProQuest ID: Park_berkeley_0028E_15142. Merritt ID: ark:/13030/m58w6hxd. Available online: https://escholarship.org/uc/item/1tc2x1g7 (accessed on 22 July 2019).
- Smith, B.P.G.; Naden, P.S.; Leeks, G.J.L.; Wass, P.D. The influence of storm events on fine sediment transport, erosion and deposition within a reach of the River Swale, Yorkshire, UK. Sci. Total Environ. 2003, 314, 451–474. [Google Scholar] [CrossRef]
- Mathers, K.L.; Rice, S.P.; Wood, P.J. Discharge and suspended sediment time series as controls on fine sediment ingress into gravel river beds. Catena 2019, 173, 253–263. [Google Scholar] [CrossRef]
- Mathers, K.L.; Wood, P.J. Fine sediment deposition and interstitial flow effects on macroinvertebrate community composition within riffle heads and tails. Hydrobiologia 2016, 776, 147–160. [Google Scholar] [CrossRef]
- Zabaleta, A.; Martínez, M.; Uriarte, J.A.; Antigüedad, I. Factors controlling suspended sediment yield during runoff events in small headwater catchments of the Basque Country. Catena 2007, 71, 179–190. [Google Scholar] [CrossRef]
- Merchán, D.; Luquin, E.; Hernández-García, I.; Campo-Bescós, M.A.; Giménez, R.; Casalí, J.; de Lersundi, J.D.V. Dissolved solids and suspended sediment dynamics from five small agricultural watersheds in Navarre, Spain: A 10-year study. Catena 2019, 173, 114–130. [Google Scholar] [CrossRef]
- Rymszewicz, A.; Bruen, M.; O’Sullivan, J.J.; Turner, J.N.; Lawler, D.M.; Harrington, J.R.; Conroy, E.; Kelly-Quinn, M. Modelling spatial and temporal variations of annual suspended sediment yields from small agricultural catchments. Sci. Total Environ. 2018, 619, 672–684. [Google Scholar] [CrossRef] [PubMed]
- Harrington, J.R.; Lomasney, L. Suspended and Bed Sediment Transport in the River Bandon, Ireland. In Proceedings of the Civil Engineering Research Association of Ireland Conference, CERI2018, Dublin, Ireland, 29–30 August 2018; pp. 488–493. [Google Scholar]
- Chow, V.T.; Maidment, D.R.; Mays, L.W. Applied Hydrology; McGraw-Hill: New York, NY, USA, 1988. [Google Scholar]
- Mei, Y.; Anagnostou, E.N. A hydrograph separation method based on information from rainfall and runoff records. J. Hydrol. 2015, 523, 636–649. [Google Scholar] [CrossRef]
- Khanal, P.C. Development of Regional Synthetic Unit Hydrograph for Texas Watersheds. Doctoral Dissertation, Lamar University-Beaumont, Beaumont, TX, USA, 2004. [Google Scholar]
- Gamble, J.; Harrington, J.R. Sediment Transport Modelling on the River Bandon. In Proceedings of the Civil Engineering Research Association of Ireland Conference, CERI2016, NUI Galway, Ireland, 29–30 August 2016; pp. 631–636. [Google Scholar]
- Einstein, H.A. The Bed-Load Function for Sediment Transportation in Open Channel Flows (No. 1488-2016-124615); United States Department of Agriculture: Washington, DC, USA, 1950.
- Pochai, N. Numerical treatment of a modified MacCormack scheme in a nondimensional form of the water quality models in a nonuniform flow stream. J. Appl. Mathemat. 2014, 2014. [Google Scholar] [CrossRef]
- Julien, P.Y. River Mechanics; Cambridge University Press: New York, NY, USA, 2018. [Google Scholar]
- Moriasi, D.N.; Arnold, J.G.; Van Liew, M.W.; Bingner, R.L.; Harmel, R.D.; Veith, T.L. Model evaluation guidelines for systematic quantification of accuracy in watershed simulations. Trans. ASABE 2007, 50, 885–900. [Google Scholar] [CrossRef]
- McCuen, R.H.; Knight, Z.; Cutter, A.G. Evaluation of the Nash–Sutcliffe efficiency index. J. Hydrol. Eng. 2006, 11, 597–602. [Google Scholar] [CrossRef]
- Krause, P.; Boyle, D.P.; Bäse, F. Comparison of different efficiency criteria for hydrological model assessment. Adv. Geosci. 2005, 5, 89–97. [Google Scholar] [CrossRef]


| Constant | Value |
|---|---|
| Smax | 430 |
| b | 1.7 |
| a | 0.5 |
| p | 0.02 |
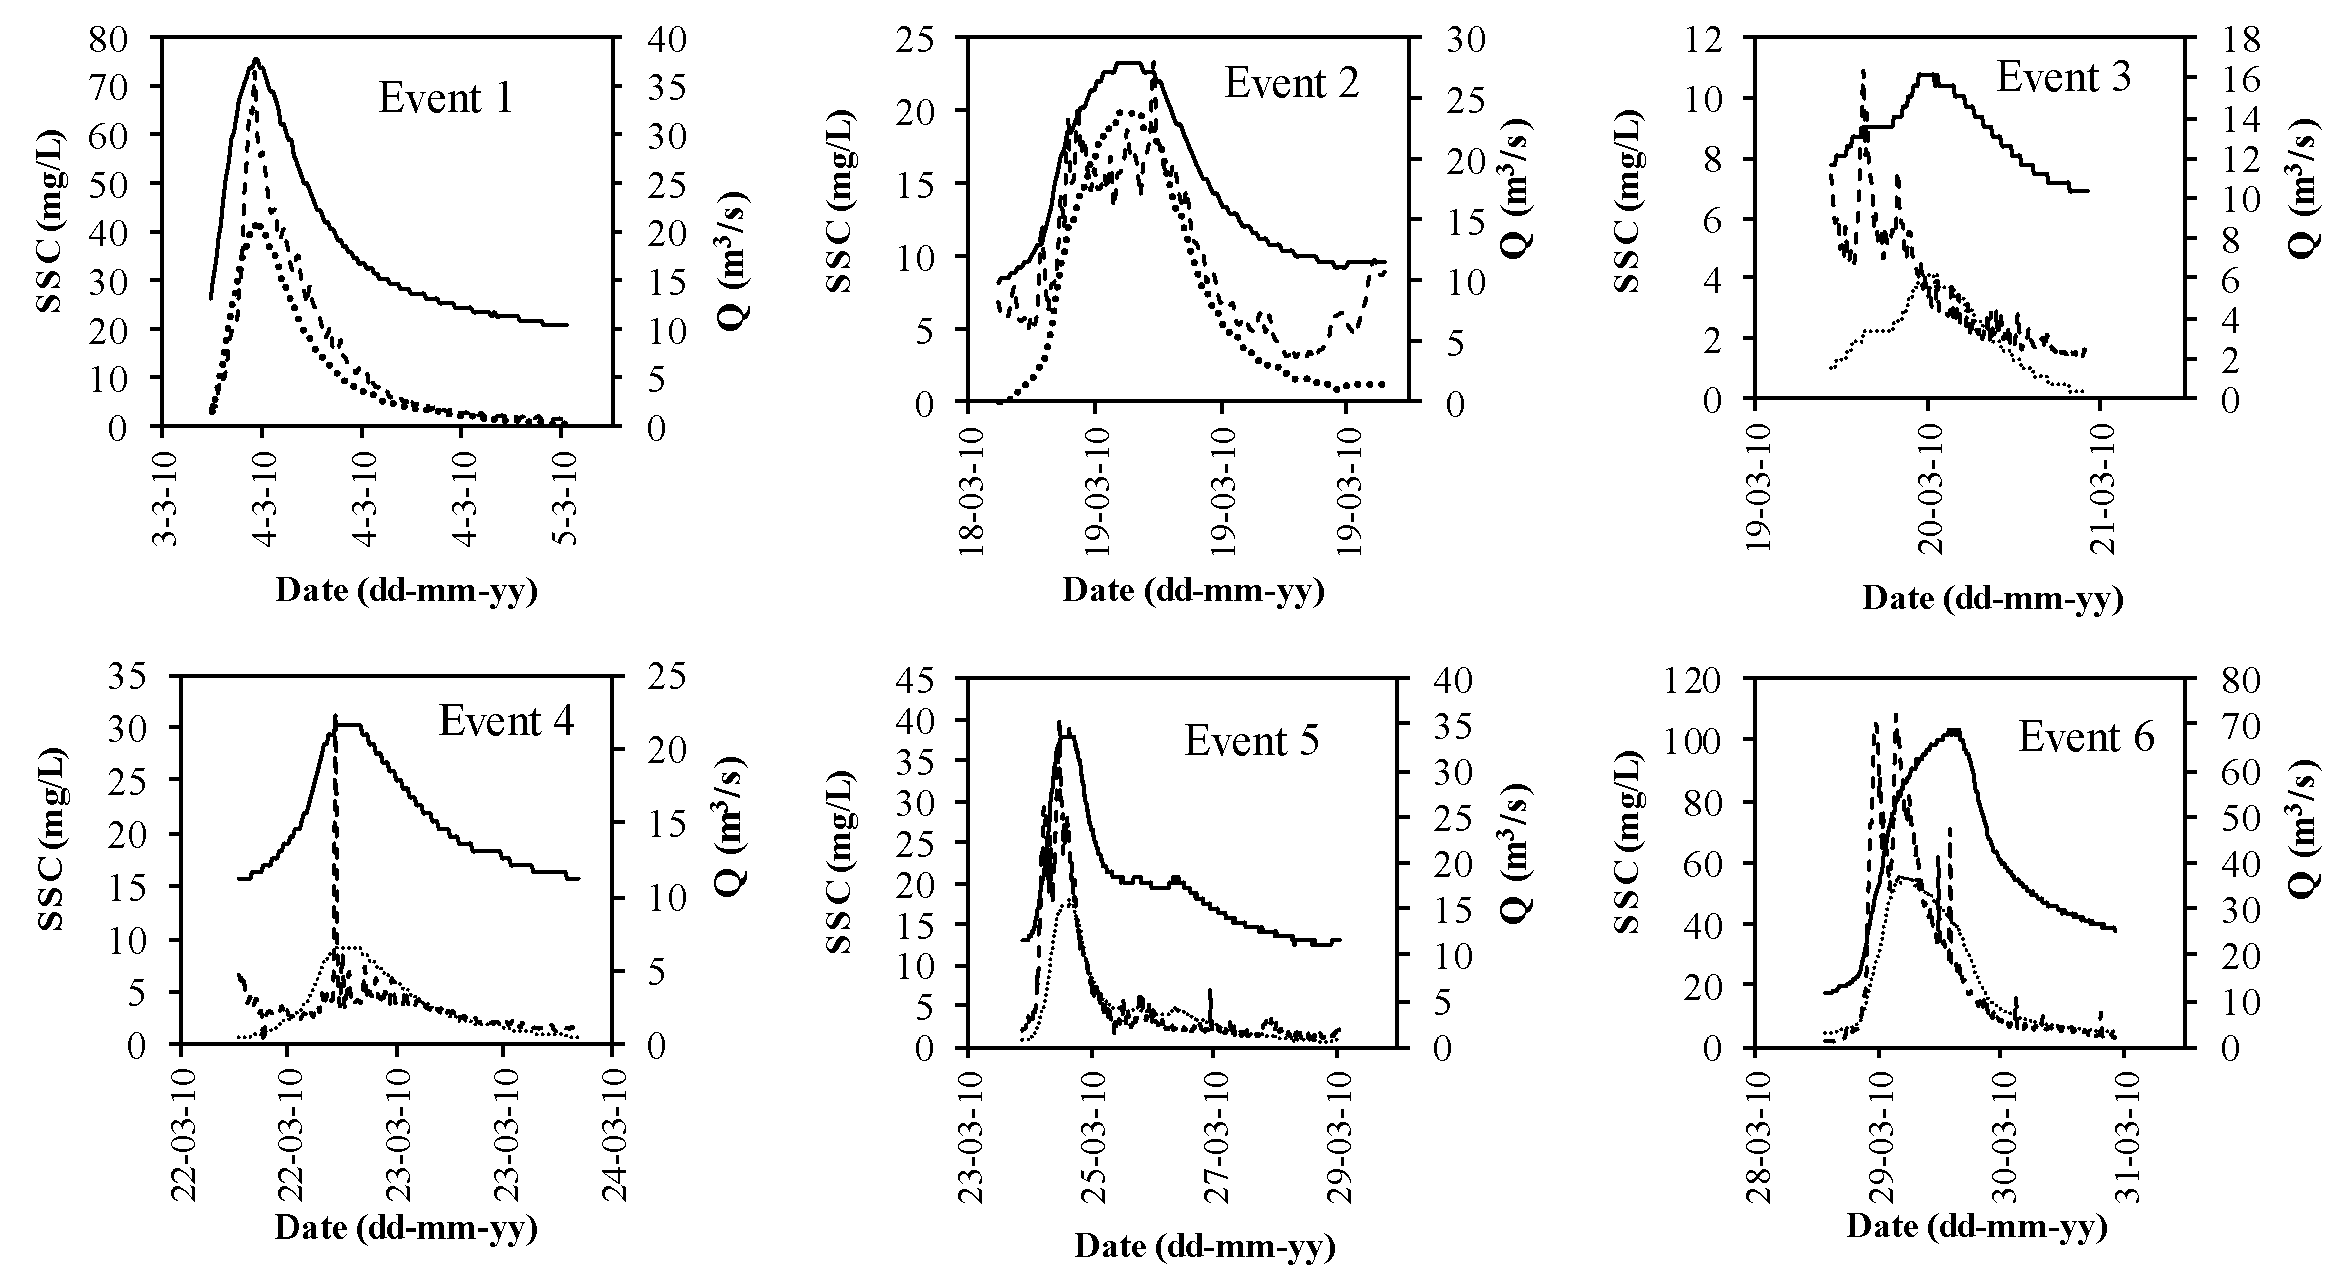
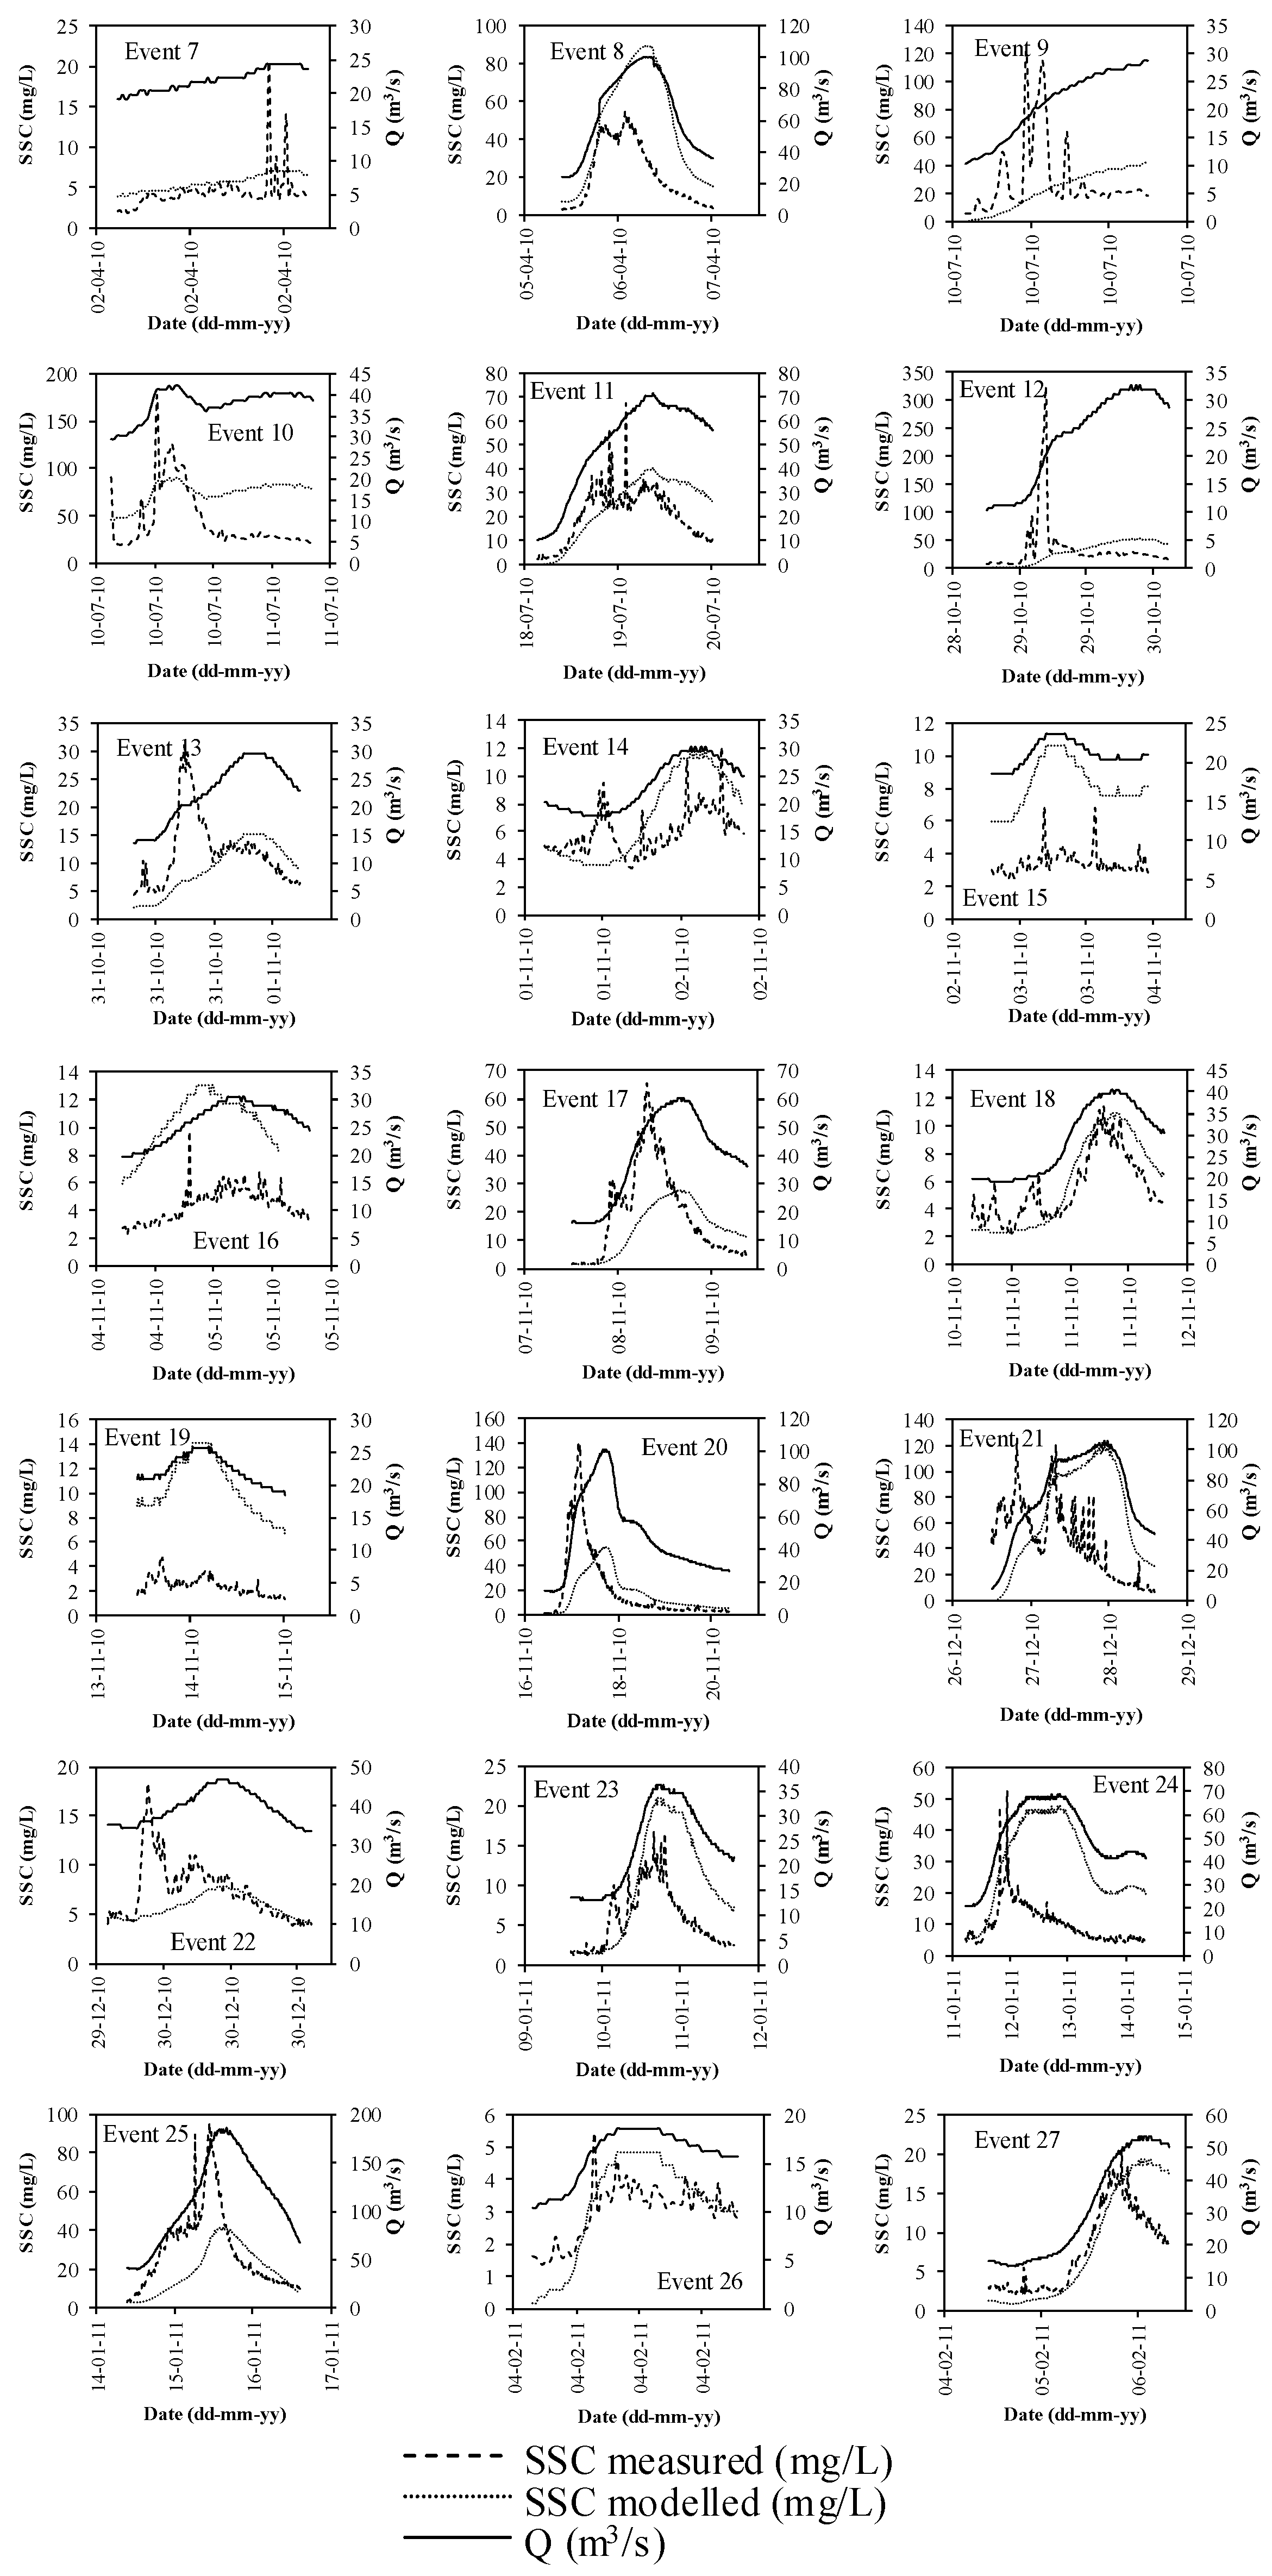
| Event Number | Peak Flow Date & Time | Qmax (m3/s) | Cmax (mg/L) | DWP (day) | PEEV (Tons) | TPH (day) | TPE (day) | TDE (day) |
|---|---|---|---|---|---|---|---|---|
| 1 | 3 March 2010 23:30 | 37.86 | 72.87 | 19.80 | 21.30 | 0.25 | 0.22 | 0.55 |
| 2 | 19 March 2010 2:45 | 28.03 | 23.29 | 14.69 | 30.92 | 0.41 | 0.49 | 0.25 |
| 3 | 20 March 2010 10:45 | 16.20 | 6.42 | 0.80 | 11.31 | 0.53 | 0.43 | 0.08 |
| 4 | 22 March 2010 16:30 | 21.64 | 6.41 | 1.81 | 3.30 | 0.50 | 0.48 | 0.05 |
| 5 | 24 March 2010 15:15 | 33.69 | 34.71 | 1.09 | 2.56 | 0.78 | 0.61 | 0.66 |
| 6 | 30 March 2010 2:45 | 68.50 | 107.61 | 4.42 | 34.63 | 0.92 | 0.46 | 1.28 |
| 7 | 2 April 2010 18:45 | 24.36 | 20.52 | 2.96 | 186.65 | 0.71 | 0.68 | 0.07 |
| 8 | 6 April 2010 19:15 | 100.12 | 54.51 | 3.13 | 3.60 | 0.90 | 0.68 | 0.79 |
| 9 | 10 July 2010 12:15 | 28.80 | 114.45 | 94.24 | 157.36 | 0.49 | 0.22 | 0.27 |
| 10 | 11 July 2010 3:30 | 41.31 | 117.39 | 94.24 | 42.09 | 0.69 | 0.21 | 0.99 |
| 11 | 19 July 2010 8:45 | 70.63 | 70.00 | 6.90 | 19.21 | 1.22 | 0.98 | 1.20 |
| 12 | 29 October 2010 22:15 | 32.01 | 220.09 | 101.66 | 98.43 | 0.91 | 0.35 | 1.02 |
| 13 | 8 November 2010 16:45 | 28.80 | 31.10 | 1.34 | 25.28 | 0.61 | 0.31 | 0.80 |
| 14 | 2 November 2010 6:30 | 28.80 | 8.77 | 0.32 | 19.67 | 0.90 | 0.80 | 0.27 |
| 15 | 3 November 2010 11:15 | 22.30 | 3.23 | 0.64 | 4.88 | 0.52 | 0.59 | 0.20 |
| 16 | 5 November 2010 4:00 | 29.59 | 5.59 | 0.83 | 1.14 | 0.88 | 0.84 | 0.44 |
| 17 | 8 November 2010 17:00 | 60.21 | 65.34 | 2.26 | 3.63 | 1.20 | 0.80 | 0.96 |
| 18 | 11 November 2010 20:00 | 37.86 | 11.43 | 2.00 | 99.53 | 1.11 | 0.93 | 0.27 |
| 19 | 14 November 2010 5:30 | 25.07 | 4.60 | 1.60 | 7.69 | 0.40 | 0.26 | 0.05 |
| 20 | 17 November 2010 19:45 | 98.15 | 130.68 | 2.19 | 0.62 | 1.19 | 0.77 | 1.66 |
| 21 | 28 December 2010 11:30 | 103.06 | 111.78 | 39.21 | 315.48 | 0.88 | 0.73 | 1.44 |
| 22 | 30 December 2010 10:00 | 45.78 | 18.35 | 1.19 | 408.84 | 0.47 | 0.25 | 0.35 |
| 23 | 10 January 2011 17:15 | 36.18 | 15.43 | 10.35 | 11.98 | 0.94 | 1.02 | 0.24 |
| 24 | 12 January 2011 22:45 | 68.50 | 25.95 | 0.99 | 13.13 | 0.89 | 0.73 | 1.42 |
| 25 | 16 January 2011 2:00 | 184.03 | 75.38 | 1.64 | 61.94 | 1.11 | 0.96 | 1.69 |
| 26 | 4 February 2011 14:45 | 18.51 | 5.46 | 19.19 | 361.17 | 0.34 | 0.20 | 0.09 |
| 27 | 6 February 2011 14:00 | 53.39 | 17.40 | 0.71 | 0.88 | 1.26 | 0.94 | 0.70 |
| Event Number | Event Suspended Sediment, ESS (Tons) | |||
|---|---|---|---|---|
| Measured | Vansickle [2] | Garcia [3,4] | Shear Stress | |
| 1 | 30.9 | 17.8 | 30.1 | 23.9 |
| 2 | 11.3 | 8.2 | 21.3 | 11.1 |
| 3 | 3.3 | 2.6 | 5.3 | 1.0 |
| 4 | 2.6 | 1.2 | 8.5 | 3.2 |
| 5 | 34.6 | 29.6 | 24.8 | 17.4 |
| 6 | 186.7 | 176.1 | 122.1 | 120.6 |
| 7 | 3.6 | 2.4 | 8.3 | 5.4 |
| 8 | 157.4 | 181.9 | 86.1 | 327.5 |
| 9 | 23.9 | 20.7 | 45.9 | 23.0 |
| 10 | 43.9 | 47.5 | 35.2 | 48.1 |
| 11 | 98.4 | 81.2 | 141.3 | 101.2 |
| 12 | 62.3 | 69.8 | 25.3 | 65.3 |
| 13 | 19.7 | 15.8 | 11.8 | 13.2 |
| 14 | 4.9 | 7.6 | 19.2 | 8.9 |
| 15 | 1.1 | 0.7 | 6.0 | 6.0 |
| 16 | 3.6 | 4.3 | 18.0 | 13.3 |
| 17 | 99.5 | 134.9 | 81.5 | 48.9 |
| 18 | 7.7 | 8.2 | 7.8 | 9.3 |
| 19 | 0.6 | 1.6 | 5.8 | 15.3 |
| 20 | 315.5 | 313.0 | 277.7 | 200.0 |
| 21 | 408.8 | 396.1 | 470.3 | 558.2 |
| 22 | 12.0 | 9.9 | 13.5 | 5.5 |
| 23 | 13.1 | 16.6 | 4.1 | 19.4 |
| 24 | 61.9 | 72.1 | 116.6 | 216.1 |
| 25 | 361.2 | 371.4 | 313.4 | 123.5 |
| 26 | 0.9 | 1.5 | 2.4 | 1.0 |
| 27 | 26.7 | 24.0 | 29.9 | 31.2 |
| Index | Model | Calculated Value |
|---|---|---|
| AI (%) all storm events | VanSickle and Beschta [2] modified | 14.2% |
| Garcia et al. [3,4] modified | 40.8% | |
| Shear stress erosion-based model | 101.7% | |
| AI (%) events representing 82% of total storm-suspended sediment transport | VanSickle and Beschta [2] modified | 11.3% |
| Garcia et al. [3,4] modified | 4.17% | |
| Shear stress erosion-based model | 29.6% | |
| Er (%) all storm events | VanSickle and Beschta [2] modified | 9.0% |
| Garcia et al. [3,4] modified | 28.1% | |
| Shear stress erosion-based model | 52.2% | |
| Er (%) Events that represent 82% of total storm-suspended sediment transport | VanSickle and Beschta [2] modified | 6.9% |
| Garcia et al. [3,4] modified | 21.1% | |
| Shear stress erosion-based model | 48.6% | |
| NSE all storm events | VanSickle and Beschta [2] modified | 99.37% |
| Garcia et al. [3,4] modified | 94.69% | |
| Shear stress erosion-based model | 71.29% | |
| NSE events representing 82% of total storm-suspended sediment transport | VanSickle and Beschta [2] modified | 98.33% |
| Garcia et al. [3,4] modified | 88.35% | |
| Shear stress erosion-based model | 42.22% |
© 2019 by the authors. Licensee MDPI, Basel, Switzerland. This article is an open access article distributed under the terms and conditions of the Creative Commons Attribution (CC BY) license (http://creativecommons.org/licenses/by/4.0/).
Share and Cite
García, J.T.; Harrington, J.R. Fine Sediment Modeling During Storm-Based Events in the River Bandon, Ireland. Water 2019, 11, 1523. https://doi.org/10.3390/w11071523
García JT, Harrington JR. Fine Sediment Modeling During Storm-Based Events in the River Bandon, Ireland. Water. 2019; 11(7):1523. https://doi.org/10.3390/w11071523
Chicago/Turabian StyleGarcía, Juan T., and Joseph R. Harrington. 2019. "Fine Sediment Modeling During Storm-Based Events in the River Bandon, Ireland" Water 11, no. 7: 1523. https://doi.org/10.3390/w11071523
APA StyleGarcía, J. T., & Harrington, J. R. (2019). Fine Sediment Modeling During Storm-Based Events in the River Bandon, Ireland. Water, 11(7), 1523. https://doi.org/10.3390/w11071523