1. Introduction
Mitigation of stormwater issues caused by urbanization continues to be a priority [
1] to protect the quality of our waters. Stormwater generated by impervious surfaces in cities has been known to cause flooding, pollute the receiving water bodies [
2,
3,
4], and overwhelm combined sewer in older cities [
5,
6]. To curb the effect of stormwater from the impervious surface, stormwater control measure (SCM) has been mandated by the National Pollutant Discharge Elimination System (NPDES) in the United States [
7] and built in many cities to reduce the impact of impervious surface in urbanized areas.
Since the introduction of the term “Best Management Practice”, many different stormwater control measures have been conceived and constructed. Our understanding of their system performance is still evolving [
8] due to the difficulty in monitoring, wide ranges of rainfall and temperature conditions, and variations in soil and design configurations. Some studies concluded that infiltration benefits were not significant during large extreme events for heavy clay soils in the Midwest, particularly outside the growing seasons [
9]. Other researchers in areas with different native soil types reported that infiltration can be significant even for large events [
10,
11]. Winston et al. [
12] reported that lateral water movement into the native soil played a significant role in runoff volume reduction with clay as the native soil, thus such systems (utilizing infiltration alone) can achieve satisfactory performance.
An underdrain system is a common feature accompanying SCM systems to facilitate the delivery of infiltrated water out of the system. Lucas and Sample [
13] found that a system with an underdrain pipe exhibited lower overflow volume compared to a gray stormwater infrastructure when not considering underdrain outflow. In the same study, a system with a controlled (e.g., raising the outlet, installing orifice, etc.) underdrain pipe outlet also showed better runoff reduction performance compared to systems with a free-draining underdrain pipe. Supporting the importance of reducing underdrain flow, another study [
14] found that systems without underdrain pipes can significantly decrease total runoff compared to systems with them. The native soil properties have been proposed as an important criterion for inclusion of an underdrain system [
15]. Because underdrain systems can be a major part of the building cost [
16,
17], the inclusion of an underdrain system should be carefully decided in designs.
The proper sizing of individual SCM and placement of SCM units are the topic that many researchers have different opinions. Some researchers support the idea of having larger individual SCM units (thus larger drainage area for each SCM) simply for easier construction and maintenance because fewer SCM units need to be taken care of (personal communications). Some researchers support bigger SCM units for reasons of the higher willingness of cost sharing [
18] and better support of urban ecosystems for the case of green infrastructure [
19]. However, other researchers oppose this idea based on hydraulic and hydrological findings. Elliot et al. [
20] found that larger SCM units increase the peak runoff rate compared to that of distributed and hydraulically linked smaller SCM units. Endreny and Collins [
21] also found that larger SCM units can result in higher groundwater mounding, which can be detrimental to subsurface infrastructure.
Many of the literature studies [
13,
15,
20,
21] considered SCM systems as perfect models, i.e., SCM systems with the same design will always work the same way in the field. However, this is hardly true in the field as unexpected construction error, unknown material randomness, unknown complexity of the native soil, and required maintenance to sustain SCM performance must be considered. Using data from a green infrastructure (GI) system in Philadelphia, the current study provides an analysis that shows, using a hydraulically linked design and focusing on the surface infiltration (i.e., excluding underdrain systems) is the preferred approach to have a low-cost and robust SCM system that is more likely to sustain the designed performance in the field.
3. Data Analysis
Instrumentation was mostly completed in July 2017. From July 2017 to July 2018, there were 38 storms recorded, which all had rainfall depth higher than 6.4 mm (0.25 inches) and were without snow or snow accumulation. A summary of all recorded events was provided in
Table 1 with values presented in the form of “mean (minimum, maximum)”.
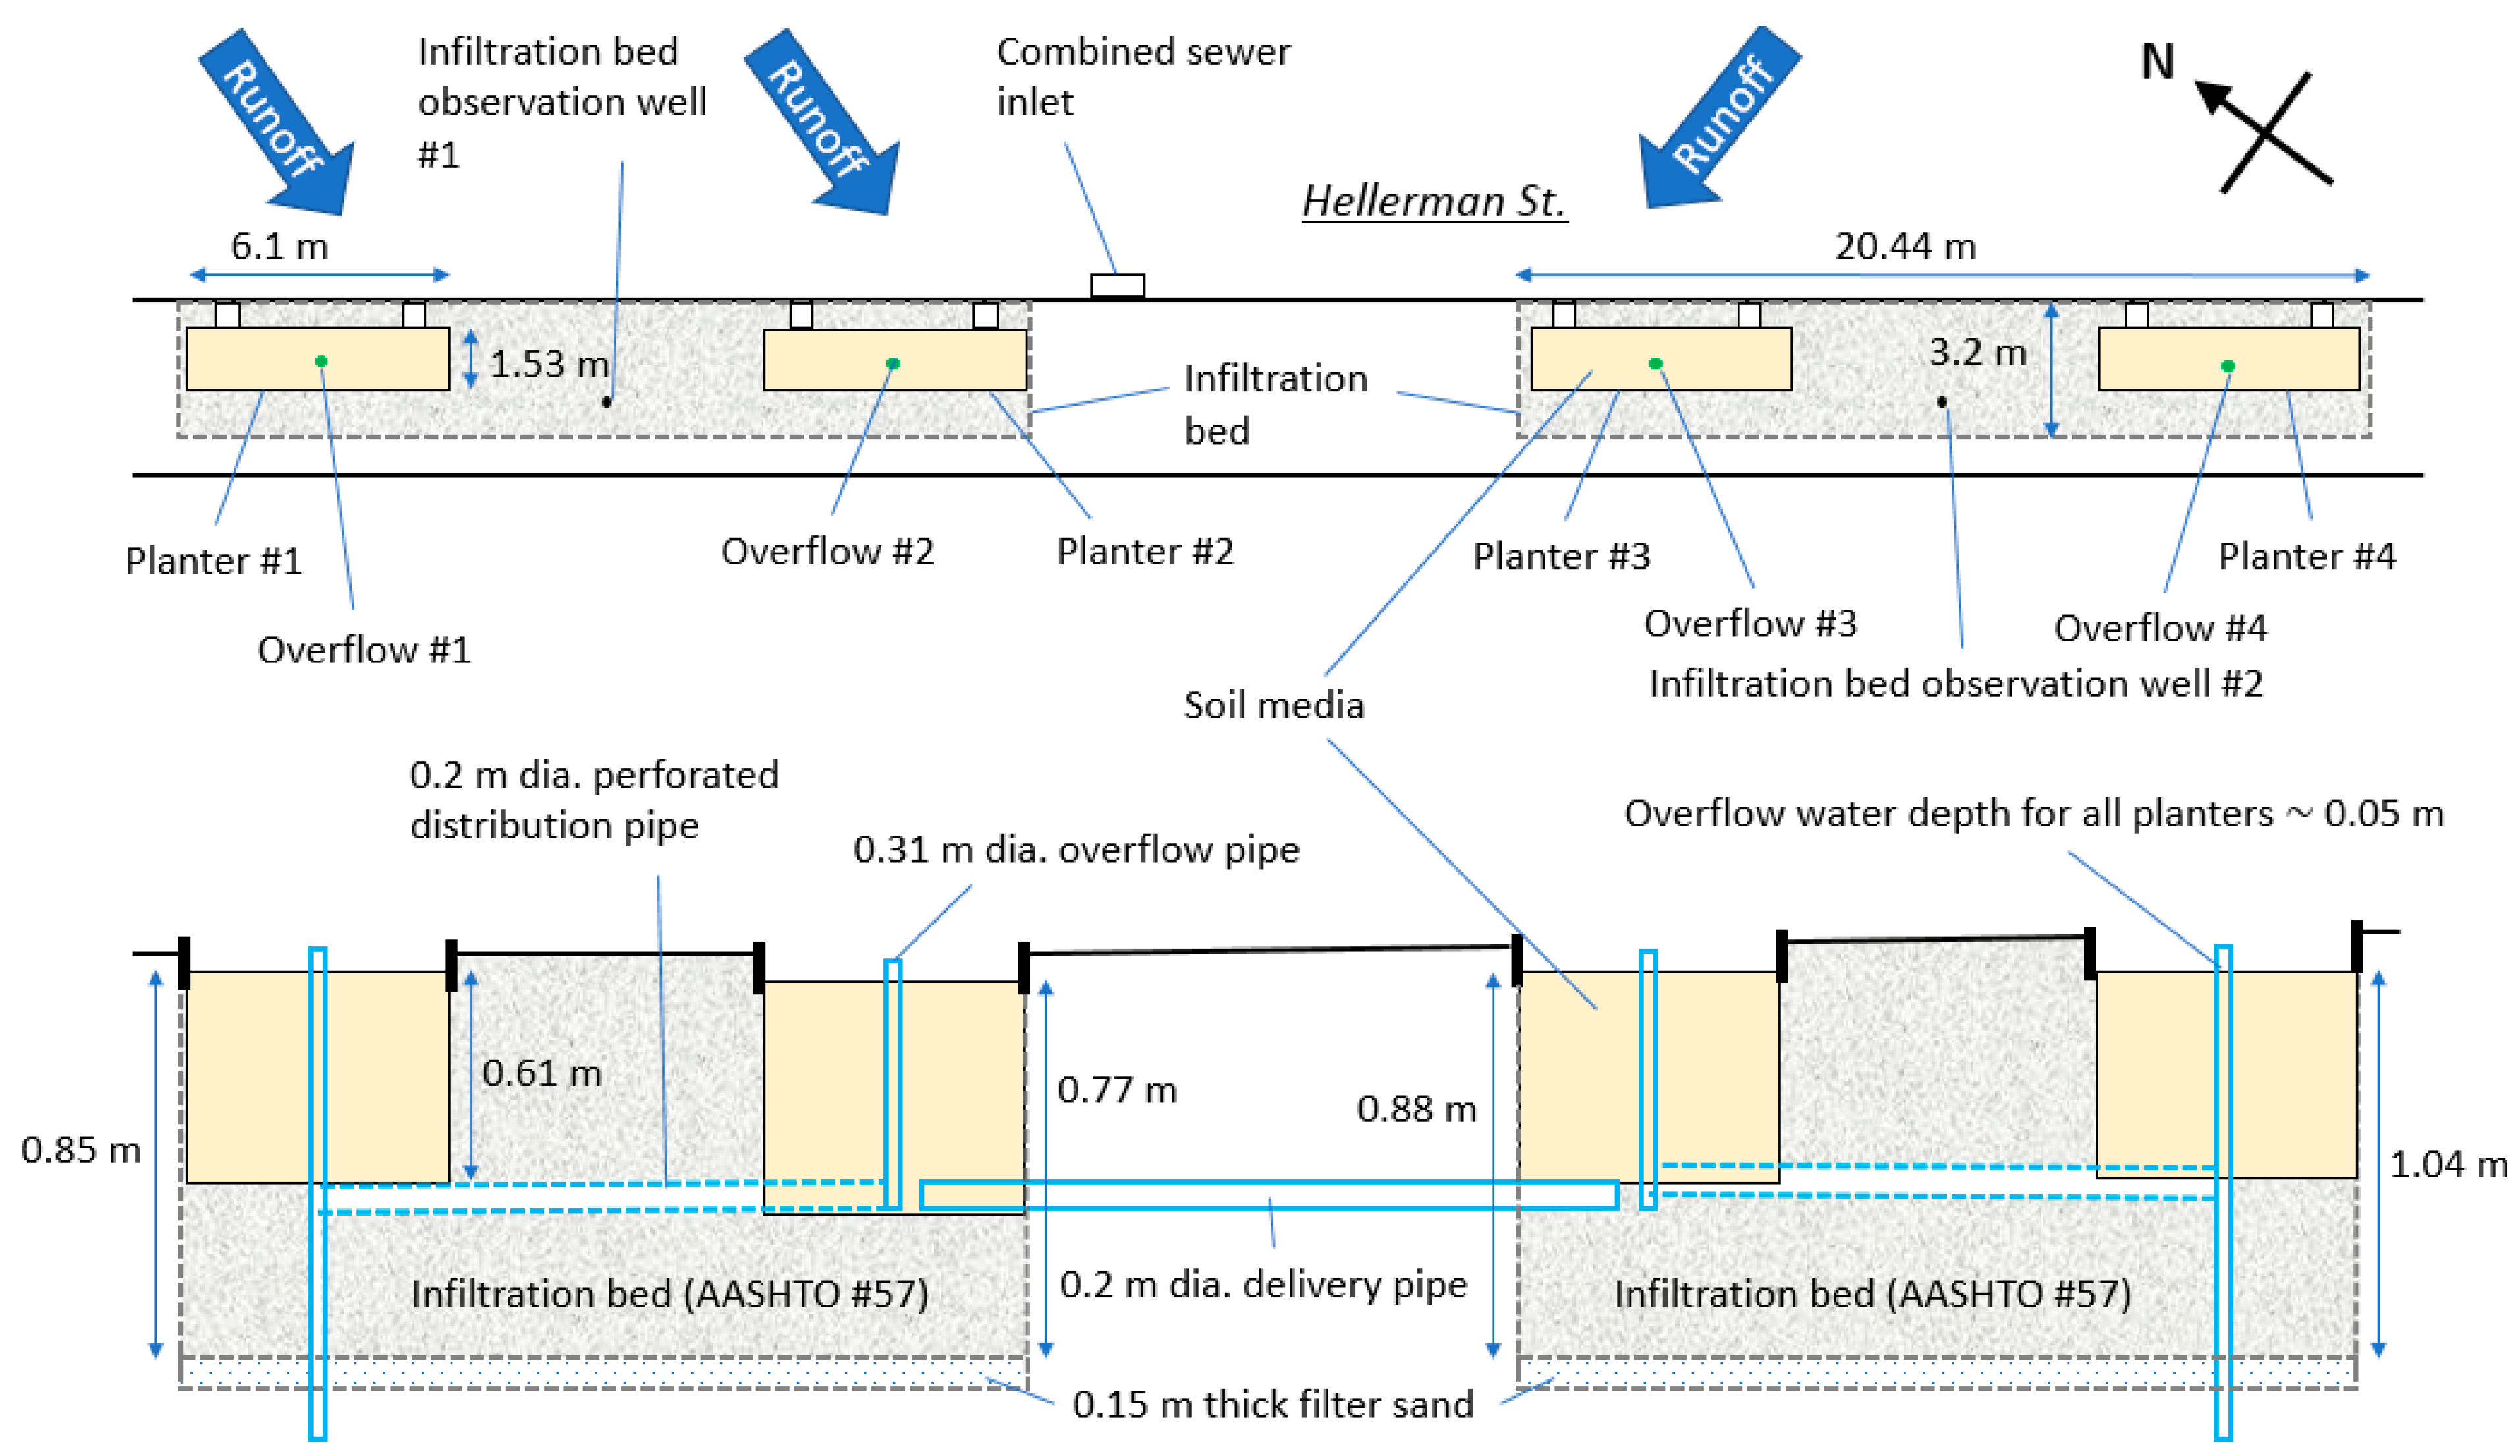
To evaluate the surface runoff capture by the planters, a simulated runoff test (SRT), which utilized a street hydrant to provide controlled runoff to the GI, was performed at this site by PWD on 2 November 2017. Runoff from a street hydrant was throttled and monitored by a flow meter so the runoff rate was known. SRT was performed for each planter individually to learn the surface flow rate above which runoff directly bypasses the surface inlet (i.e., before the planter is “full”). It was found that the maximum flow rate that the inlets of a planter can handle was higher than the calculated maximum runoff rates generated by all storms, so such direct bypass did not happen. Details on the SRT were described by Tu and Traver [
22]. Note that such direct bypass (generated by limits of planter inlet hydraulic capability) is different from the “surface bypass” (generated by combined limits of planter infiltration capability and overflow system capability) discussed below.
The system exhibited excellent performance in preventing runoff from entering the combined sewer inlet during the period of observation (July 2017 to July 2018), with no runoff bypassing the GI and entering the combined sewer inlet. It was also found that no event completely filled the rock infiltration beds (with a maximum depth varying from 0.77 to 1.04 m because the sidewalk surface is not level), with the highest water depth in bed #1 as approximately 0.2 m (with a mean of 0.04 m) and that in bed #2 as approximately 0.4 m (with a mean of 0.12 m).
In
Table 2, a summary of the incoming runoff (runoff generated by associated drainage area plus bypassed runoff from an upstream planter, if any) volume of each planter, the riser overflow volume of each planter, the surface bypass volume of each planter, and the infiltration volume through each planter were provided. “Riser overflow” means the overflow entering the riser overflow pipe located in the center of each planter, “surface bypass” means surface (on the pavement) runoff bypassing the planter, and “infiltration” means water infiltrated through the planter media to the infiltration bed.
Table 2 shows that no “surface bypass” from either planter #2 or #3, which enters the combined sewer inlet, was generated, and that bypass from planter #4 entered planter #3.
In
Table 2, “riser overflow” was measured by the orifice insert, “incoming runoff” was calculated based on the rainfall depth and the size of drainage area (plus runoff bypass from an upstream planter, if any), and “surface bypass” and the infiltration (i.e., water infiltration by planter soil) are the two terms that were not directly measured. Equation (1) delineates the mass balance relationship between these terms, where
is the surface bypass,
is the overflow runoff from an upstream planter if available,
is the runoff generated by rainfall for the drainage area,
is the measured riser overflow, and
is the infiltration volume through the media soil. A SWMM (Storm Water Management Model [
23]) model (version 5.1) utilizing plan dimensions and an impervious surface Manning’s n of 0.01 were built to estimate
.
Two scenarios were possible in utilizing Equation (1), one with surface bypass
not present, and the other with surface bypass
existing. When surface bypass
does not exist (i.e., water level in the planter below the elevation of associated curb inlets), infiltration is calculated as simply the difference between the incoming runoff (
) and riser overflow
. When surface bypass
is present (i.e., water level in the planter above the elevation of associated curb inlets), infiltration
is calculated by multiplying the field measured saturated hydraulic conductivity K
s of the planter soil (
Table 3) measured by SATURO infiltrometer (METER, Pullman, WA, USA) by the duration that ponding in planter supports surface bypass, and surface bypass
is further calculated by Equation (1) since all right-hand terms in the equation are known. Note that K
s is the minimum infiltration rate; therefore, the estimate of
is conservative. At least two measurements were performed for each planter and
Table 3 presents the mean values for each planter. To make the comparison representative, all infiltration tests were performed at approximately the same locations at each planter, away from plants as far as possible.
For the first scenario (i.e., no surface bypass
), the calculated infiltration volume was occasionally negative possibly due to measurement or modeling error, and 23 data entries containing negative infiltration volume were excluded from
Table 2. These errors represented storms where the infiltration was insignificant when compared to the riser overflow. In addition, the orifice inserts for measuring riser overflow for planters #1 and #4 were not installed until October 2017, rendering nine storm entries excluded for planters #1 and #4 in
Table 2. Removing these values,
Table 2 summarizes 111 data entries.
The SRT of 2 November 2017 indicated that the curb inlets have a capacity limit, and incoming runoff rates higher than that limit will result in the direct bypass of runoff even though the water elevation in planters is still lower than the elevation of curb inlets. The SWMM model showed that such direct bypass can happen when the rainfall intensity is higher than approximately 8–9 mm in 5 min (equivalent to 96–108 mm/h). Although possible, the occurrence was rare and happened only once (1 August 2017) in the period of observation at planter #1 with a direct bypass of only 0.29 m
3. As this was prior to overflow measurement for the planter, data related to that event was not included in
Table 2.
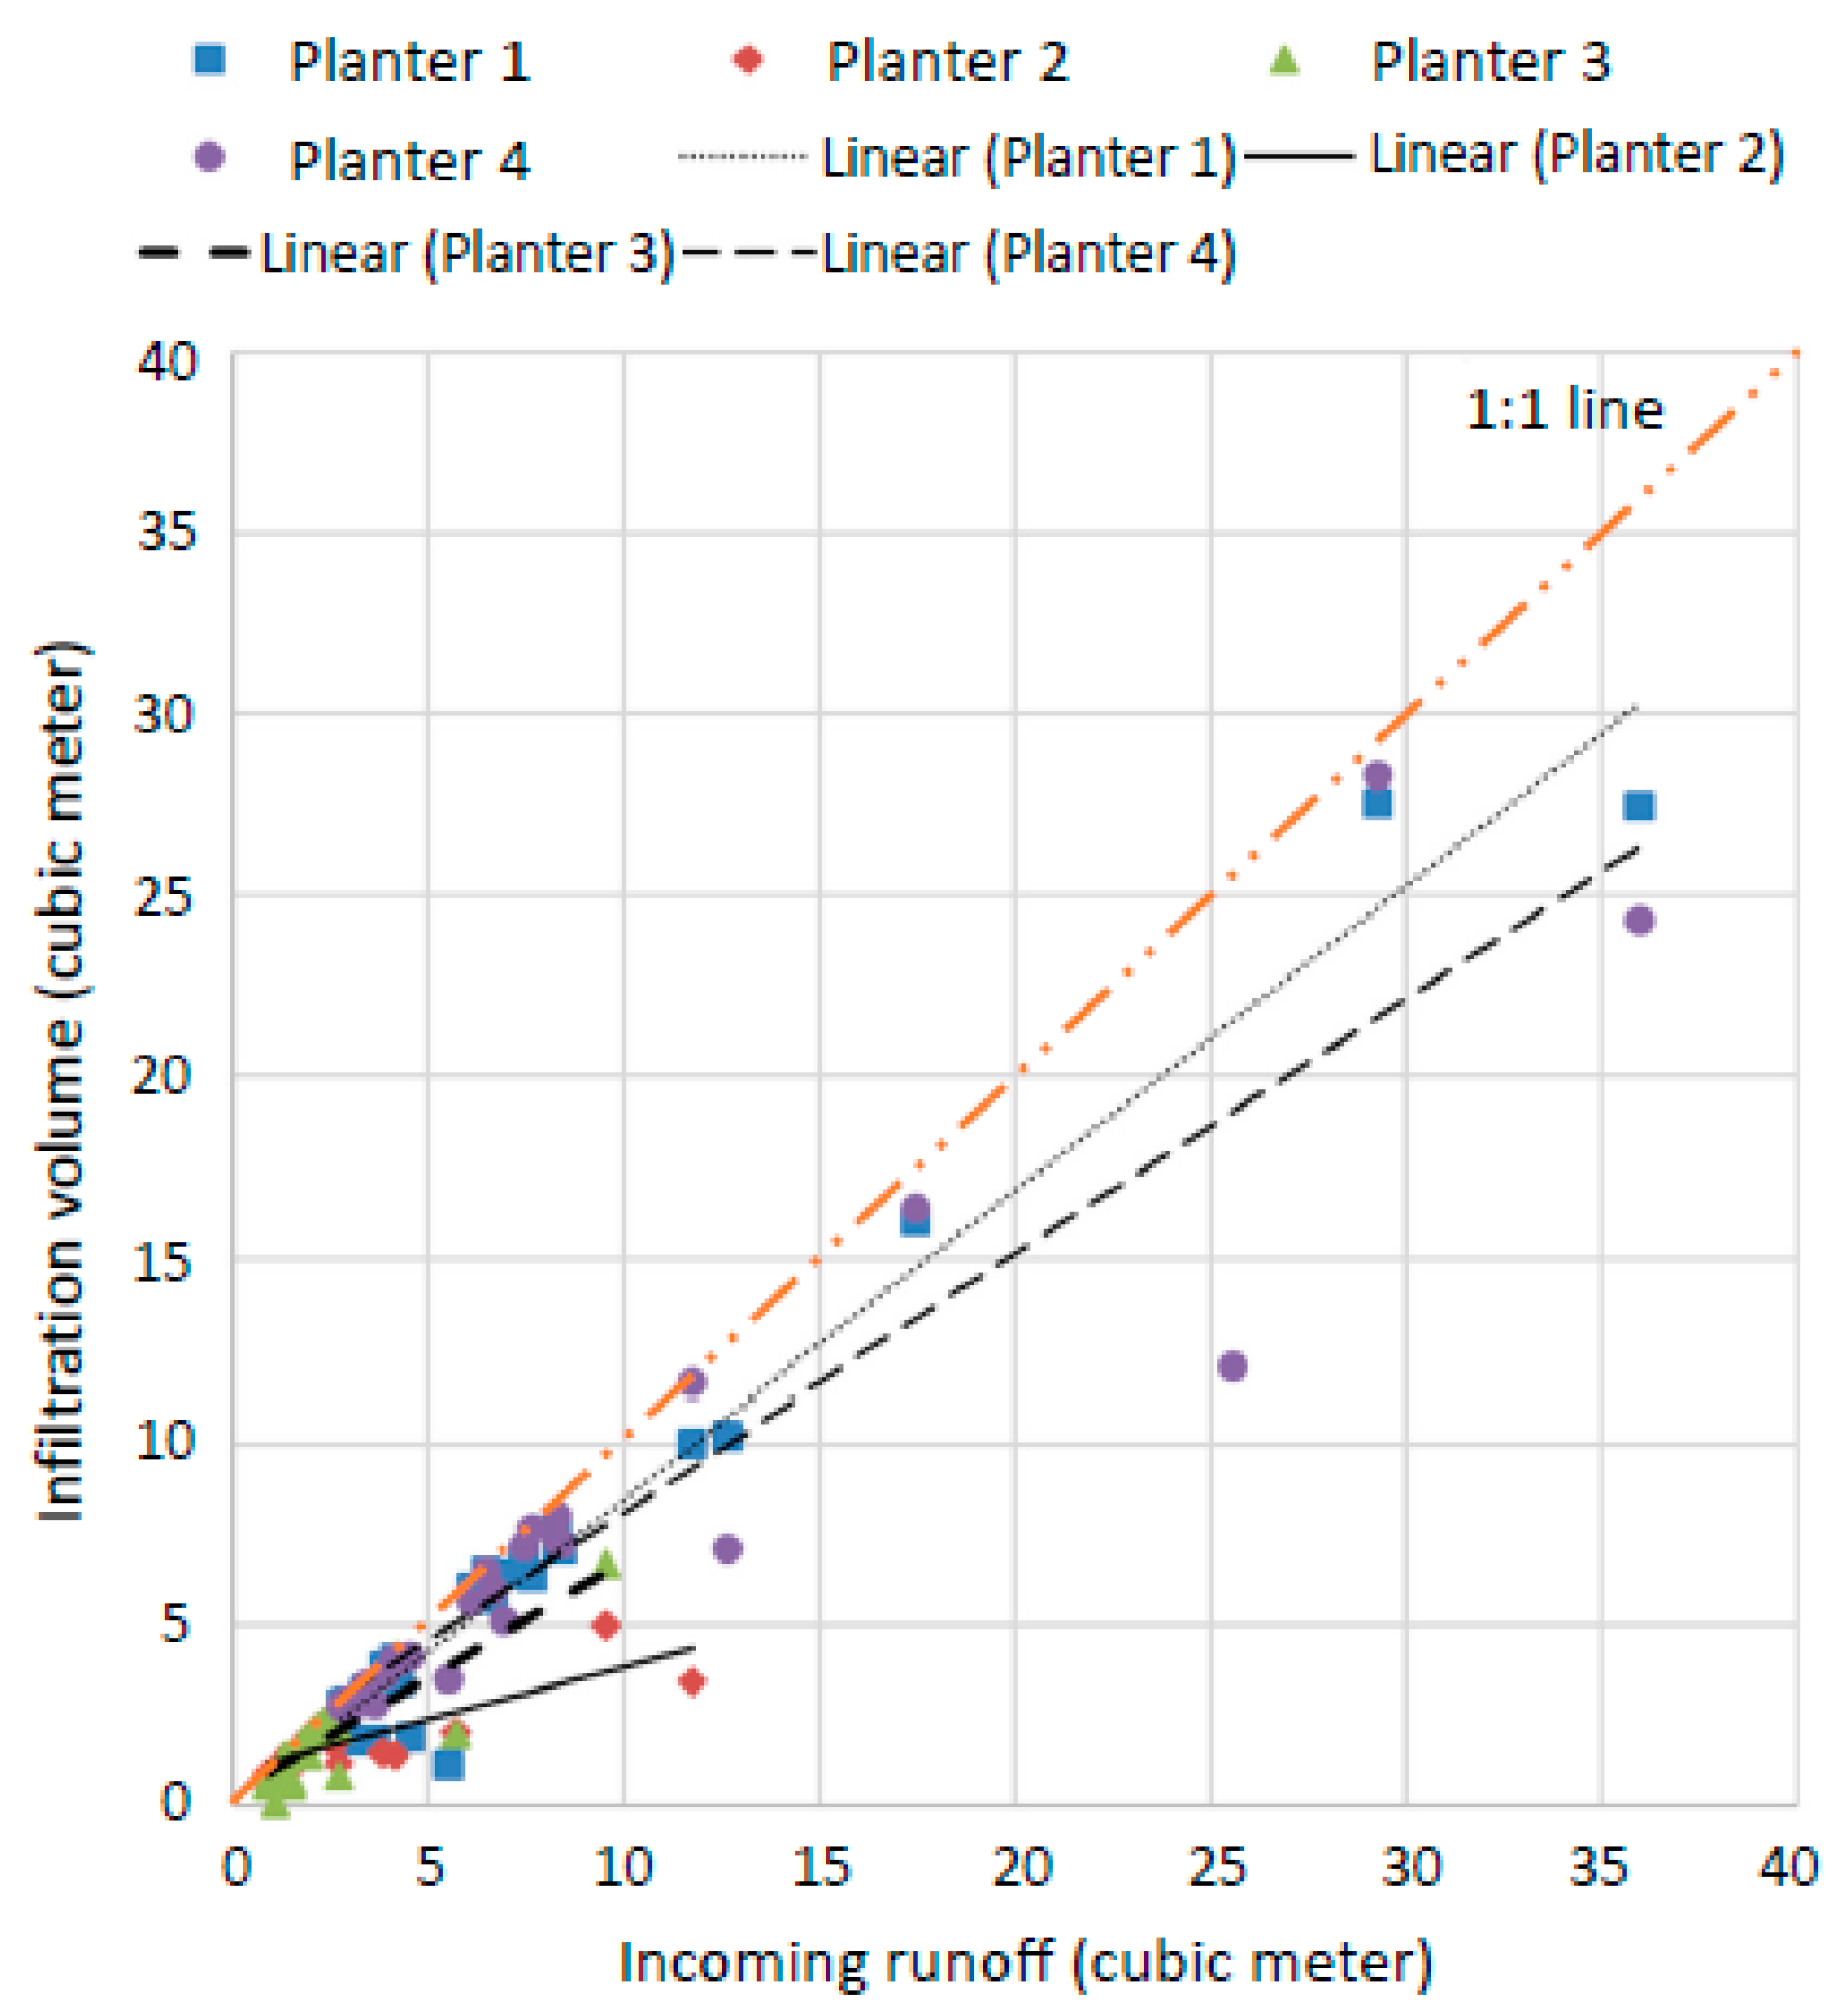
Figure 4 shows the relation between incoming runoff and infiltration volumes for events summarized in
Table 2. The 1:1 line was drawn to indicate 100% absorption and removal of incoming runoff by infiltration, and linear regression lines for each planter were also added.
Figure 4 shows that infiltration appears to handle the great majority of the incoming runoff, which was also confirmed by
Table 2.
A more detailed inspection on
Figure 4 revealed two intriguing points. First, planter #2 has a much lower slope in
Figure 4, indicating more riser overflow than the other planters. Second, the range of incoming runoff is smaller for planters #2 and #3 which reflects the smaller contributing drain areas. There is no significant difference in slopes (i.e., the ratio of infiltration vs. incoming runoff) in
Figure 4 among these three planters. This was quite different from what was observed at planter #2.
The observations from
Figure 4 can be explained by the fact that overflow occurs when the incoming runoff rate (directly proportional to rainfall intensity) exceeds the infiltration rate provided by the planter soil, and planter #2 has a much lower K
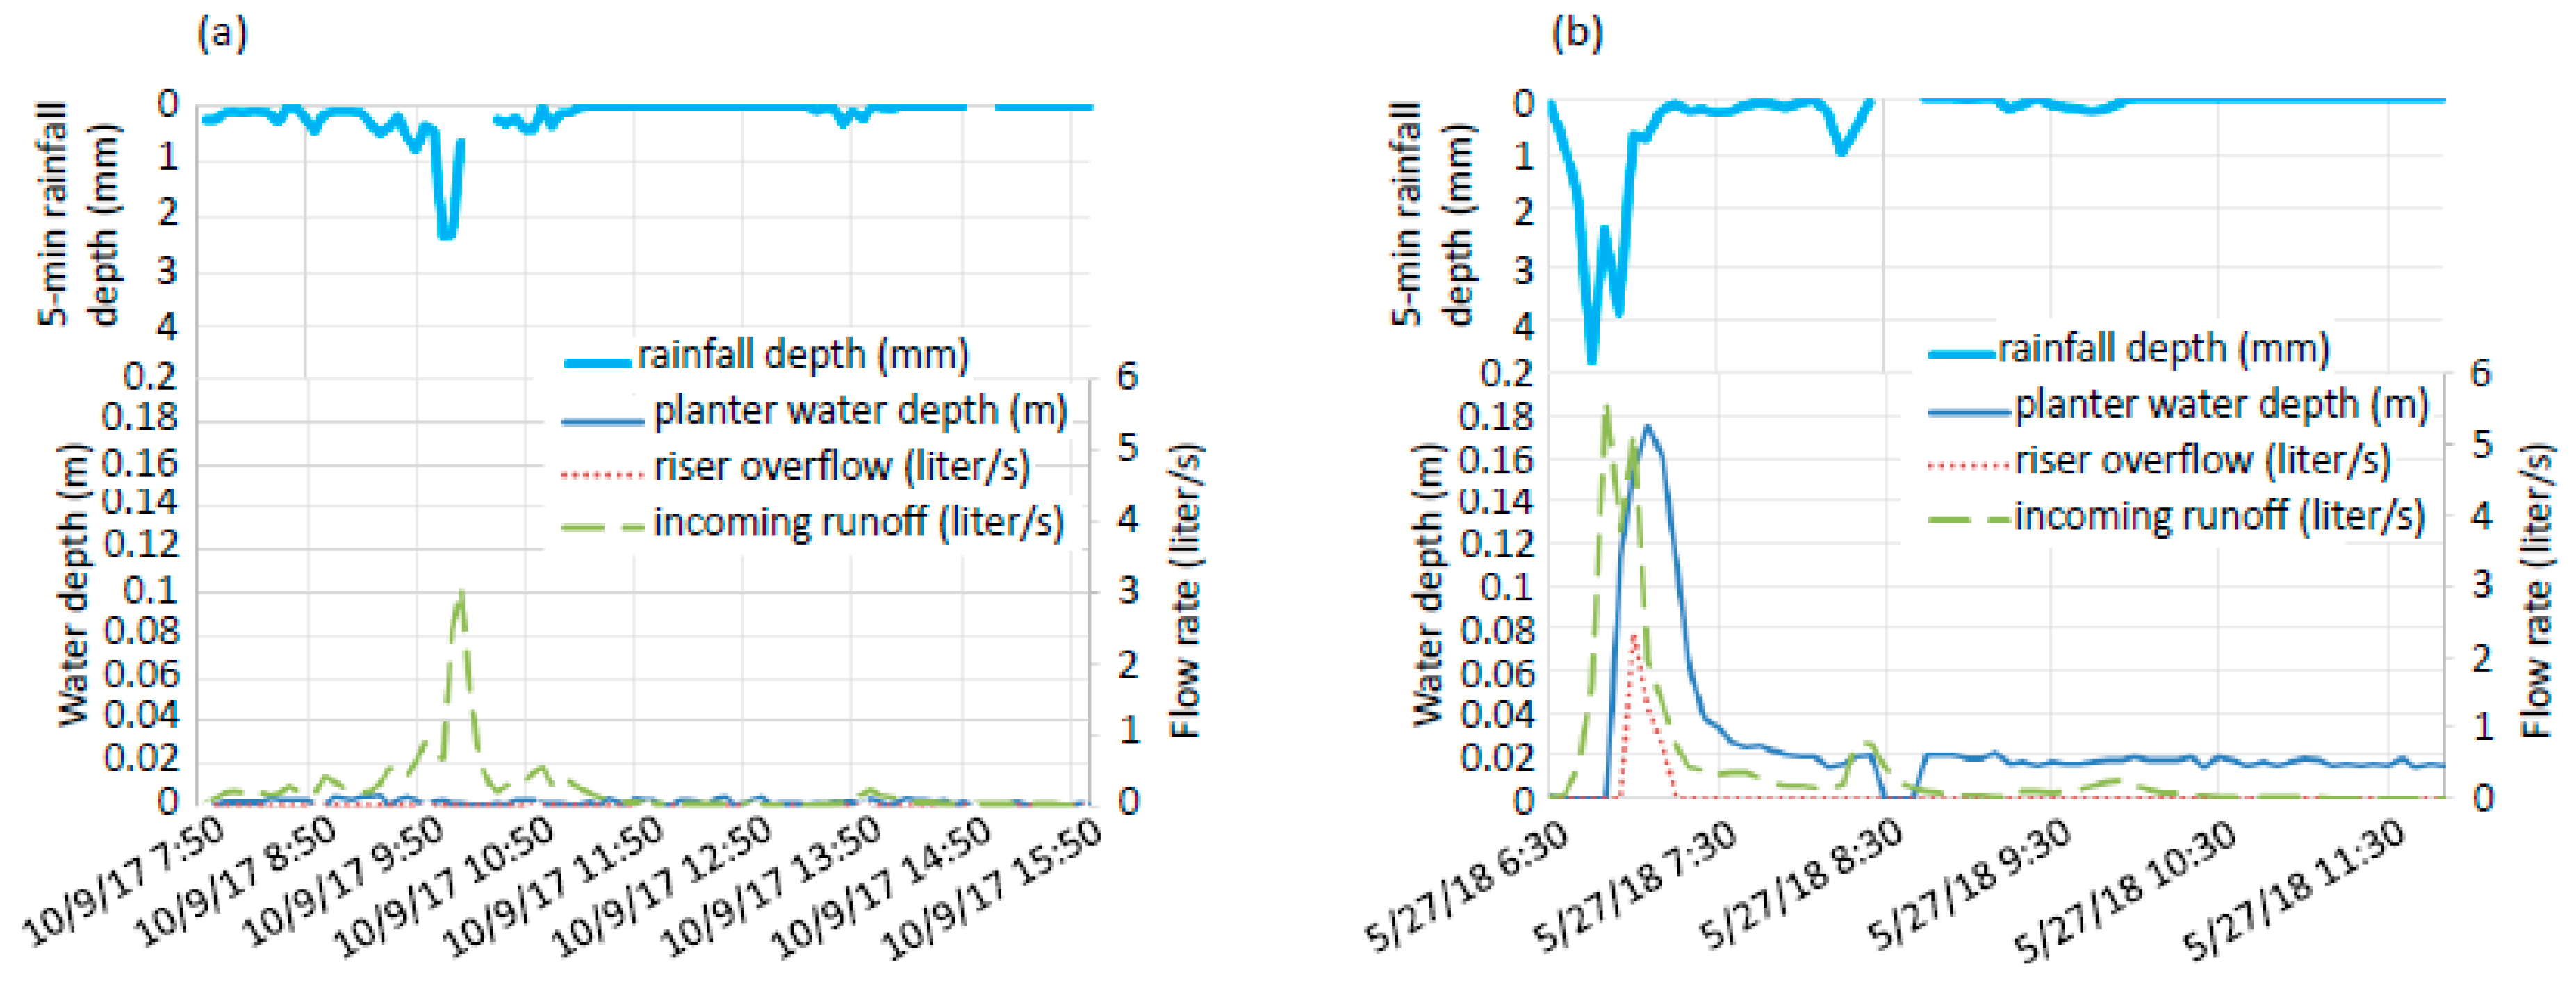
s than the other planters. During low-intensity storms, the incoming runoff rate is comparable to the infiltration capacity, so infiltration is the primary mechanism. Conversely, during high-intensity storms which generated riser overflow, the infiltration process cannot by itself manage the incoming flow. To show these two different mechanisms, hydraulic responses of planter #1 from a low-intensity storm (9 October 2017) and a high-intensity storm (27 May 2018) were provided in
Figure 5. The incoming runoff rate in
Figure 5 was estimated by the SWMM model mentioned before. These two storms were chosen because they have similar rainfall depth and length, but different peak rainfall intensities. The rainfall depth of the 9 October 2017 and 27 May 2018 storms are 15.2 mm and 19.8 mm, respectively. The peak rainfall intensity of the former is 2.4 mm/5 min, and 4.7 mm/5 min for the latter.
Figure 5a showed that the water depth in planter #1 from the low-intensity storm had no riser overflow. The peak incoming runoff rate of 3.1 L/s is only slightly higher than what the K
s of the planter soil can handle, and the available above-ground planter storage combined with infiltration managed this event. For
Figure 5b, the peak incoming runoff rate is much higher than that in
Figure 5a and was sustained for a longer time, so the difference between the rate of incoming runoff and the soil infiltration rate raised the water level in the planter and generated riser overflow. Runoff that exceeds the soil infiltration rate is defined as infiltration excessive. Qualitative explanations to
Figure 4 can be given after understanding the infiltration and riser overflow behaviors discussed above. First, planter #2 has the lowest saturated hydraulic conductivity rate (5.78 × 10
−3 cm/s), thus generating infiltration-excessive runoff causing frequent riser overflow. Second, soil in planters #1, #3, and #4 all have higher infiltration rates (ranging from 1.07 × 10
−2 cm/s to 4.8 × 10
−2 cm/s), making generation of infiltration-excessive water (thus riser overflow) rare.
The water level in the rock infiltration beds only minimally reacted to storms that did not generate riser pipe overflow. It can be postulated that water entered the infiltration bed with a rate lower than the infiltration bed drawdown rate or water remained in the planter bed as soil moisture.
The efficiency of the two rock infiltration beds was found to be quite different. The relations of post-storm event recession rate vs. infiltration bed water depth for the two infiltration beds were found to be both highly non-linear, which are not compatible to observations from a similar system in Philadelphia [
24].
Figure 6 shows the relation between water depth and water level recession rate for the two infiltration beds. Data points from both natural storms (one point per storm at the time that the water level of infiltration bed was nearly peaked while no rainfall was measured) and the SRT of 1 November 2017 (one data point approximately every half hour) were included. The invert (0.15 m from the bottom of infiltration beds) of the horizontal pipe connecting the two infiltration beds was added as the thick vertical dash line.
Figure 6b enlarges the details inside the rectangle of green dash line rectangle in
Figure 6a. Note that no riser overflow occurred for all these data points.
Figure 6 shows highly nonlinear relations between water depth and recession rate for both infiltration beds. For infiltration bed #1, the water level recession rate significantly accelerated when water depth was higher than approximately 0.04–0.05 m. A similar phenomenon was observed for infiltration bed #2, but the deflection point was much higher at a depth of approximately 0.2 m. Such phenomenon did not appear to have a significant impact on system performance, as portions of runoff handled by infiltration bed #1 and infiltration bed #2 are similar. From
Table 2, 20.5% of runoff entered the riser pipes in planters #1 and #2 (thus handled by infiltration bed #1), and 16.2% of runoff entered the riser pipes in planters #3 and #4 (thus handled by infiltration bed #2).
Even though the horizontal connection pipe might have occasionally influenced such relation when water depth in either infiltration bed is above 0.15 m,
Figure 6 suggests that the horizontal pipe is not the main reason for the phenomenon, because initialization of such non-linearity behavior for both infiltration beds started to occur prior to the invert elevation of the horizontal pipe (0.15 m). Note that the infiltration beds were tested one at a time during the SRT, so the SRT data points with water depth below 0.15 m were free from the influence of the horizontal pipe because only the infiltration bed under examination had water. Sediment accumulation in the bottom of the infiltration bed is unlikely to be the reason that provided the short operation history of this GI (built in 2014). The only possible explanation is the unknown heterogeneity of native soil and/or significant preferential flow pathways.
4. Discussion
The paired GI planters contain engineered soil with very good infiltration properties. K
s ranges from 5.8 × 10
−3 to 4.8 × 10
−2 cm/s, which is generally (except for planters #2 and #4) higher than 1.4 × 10
−2 cm/s for K
s of sand/coarse sand [
25]. Soil with such high hydraulic conductivity was proven to be able to transfer most of the low-intensity storms, with the overflow riser taking in the infiltration-excessive runoff from high-intensity storms. This GI system had much more infiltration-excessive runoff (handled by the overflow pipe) compared to that of literature studies [
10,
26], which was nearly zero. This was probably caused by different rainfall patterns, lower ponding depths, and the larger ratio of drainage-to-footprint area for this GI System.
This implies that there are other effective ways to handle infiltration-excessive runoff, such as increasing the above-ground storage of planters to eliminate or reduce the dependence on underground infiltration beds. The design goal of this system is to absorb and infiltrate 38.1 mm (1.5 inches) of rainfall. Assuming 38.1 mm of runoff was to be stored by the soil and above-ground storage of the four planters (without utilizing overflow pipes and soil infiltration during the event), the above-ground storage space of each planter needs to be at least 7.81 m
3, which equals to a planter height of 0.42 m and a planter footprint area of 18.67 m
2. This footprint area is twice the current footprint area (9.33 m
2) in order to maintain the planter height. However, if a dynamic sizing approach (i.e., considering infiltration during storms but still excluding overflow pipes) is adopted, the footprint area can be significantly reduced [
27]. For projects that are constrained by budgets, having larger above-ground storage space and utilizing flood-tolerant plants is a possible alternative from building an overflow riser system. Relying solely on infiltration can also provide additional water quality benefits due to the longer water retention time and longer contact time with vegetation [
28].
Due to the uncertain performance, higher building cost, and possibly higher maintenance cost of infiltration beds, a coupled overflow riser system (including a riser pipe and an infiltration bed) might not be a good choice for all designs. The two infiltration beds have different and nonlinear relations between water recession rate and infiltration bed water depth, while the two infiltration beds are only approximately 10 m away from each other. A possible explanation, as described before, is the heterogeneity of native soil and/or significant preferential flow routes at this site. Such uncertainty makes correct sizing of infiltration beds unlikely, resulting in under- or overdesigns of infiltration beds, which delivers GI systems with the unsatisfactory performance or unnecessarily high building cost, respectively. Although this has not yet been observed at other GI systems in the same area, this observation signifies the importance to perform detailed subsurface survey and to adopt custom designs for each site accordingly. This is contrary to the current mainstream direction of using a standard design specification to minimize implementation costs [
29]. Such surveys and custom design further elevate the cost to have an overflow riser system, while such overflow riser systems can only handle approximately 18% runoff in this case, or even far less in literature. The underground overflow riser system can be potentially maintenance intensive as well [
30].
Even though the planter soil generally has good infiltration properties, the infiltration rates still show a lot of variation among the four planters in this study. Such variation possibly made planter #2 less efficient because it generated a larger portion of infiltration-excessive water (
Table 2). This GI system was fortunate to have one planter with the soil of high hydraulic conductivity paired with another planter with the soil of lower hydraulic conductivity in either side (#1/#2 or #3/#4), which balanced out the disadvantage of the soil with lower infiltration rates. If planters of the same side both had soil with lower infiltration rates, it was possible to see surface bypass to the combined sewer inlet. Therefore, it is important to pay special attention to soil infiltration rates by regular infiltration tests, regular SRT tests, and/or regularly computation of surface ponding drawdown rates by field data.
Among the four planters, soil in planter #3 has the highest K
s which is four times the mean of the other planters. Coincidentally, planter #3 has the deepest soil layer (approximately 40 cm) almost double that of the other planters (approximately 23 cm) as the planters were not constructed to plan specification. Thinner soil has less soil volume, thus the compression stress and potential for compaction is higher. It is recommended to have deeper soil in planters and to limit human activities on the soil media [
31].
5. Conclusions
According to data collected from July 2017 to July 2018, the GI system under examination showed excellent performance that no runoff reached the combined sewer inlet, thus meeting the design intent. This GI system has a mirrored design, which hydraulically links two physically decoupled planters in either side to process runoff before surface bypass can reach the combined sewer inlet, if any. Bypass flow from the upper planter was captured by the next in line at least once.
This study implied that hydraulically linking physically decoupled SCM units can keep the designed performance from being affected by unexpected performance variations of system components. The saturated hydraulic conductivity Ks of planter soil showed great variations from planter to planter in this study. The source of such variation could be inaccurate construction of soil depth in planters and/or differentiated compaction by trampling of the maintenance crew, which might compact the top layer of the soil media. The compacted topmost layer might have more influence on overall Ks if the soil column is shallow. Planters with lower Ks were found to generate surface runoff when the incoming runoff rate is higher than the combination of the soil infiltration rate and the overflow pipe flow rate. Hydraulic linked design of the current study has shown that such lower performance of one planter can be ameliorated by another planter downstream, so the overall performance was acceptable. Regardless of the reason of such performance swing of individual planters, such hydraulically linked design ensures that the system exhibits performance close to the design, and random deviation in performance cannot affect the performance in general.
Dividing the effective planter area into multiple hydraulically linked smaller areas can have additional benefits. Although not the case in this study, direct bypass (i.e., surface runoff with high flow rate directly bypasses the planter inlet as the maximum allowed flow rate of the inlet is lower than the runoff flow rate) can happen. Regular maintenance is required to keep the inlets clean from trash accumulation so that the designed flow rate of inlets can be maintained. With such hydraulically linked design, the required hydraulic capacity of each planter inlet is decreased, thus requiring less frequent maintenance which can exhibit higher long-term saving on maintenance.
The overflow riser system (including the overflow riser pipe and the associated underground infiltration bed) was shown to handle infiltration-excessive runoff during high-intensity storms. The overflow riser might play a more important role in the future when storms might become more intense in certain areas [
32]. Such overflow riser system could be a good design feature if extreme, high-intensity storms are the main concern. However, the majority (63%–85% with a volumetric mean of 82% in this study) of runoff can be handled by infiltration via planter soil alone, thus the need for the overflow riser pipe and the associated infiltration bed can be rethought.
This study further found that the performance of such overflow riser system can be highly uncertain. The most probable cause is the subsurface heterogeneity at this particular site. To eliminate this issue, the cost of required additional pre-construction subsurface surveys, cost of custom designs associated to local native soil properties, and possible higher maintenance costs associated with subsurface facilities must all be considered as part of the cost of the overflow riser system. The research team proposed to use larger planter area combined with deeper planter storage depth tailored to the volume of the design storm as an economic alternative to the overflow riser system. By focusing on the surface infiltration capacity of SCM systems, extensive subsurface surveys are not needed, a standard design can be used, and lower building and maintenance cost can be achieved.
The lessons learned from this study implied that a hydraulically linked design of physically decoupled SCM systems and a focus on the above-ground infiltration capacity (which can include either limited use or complete removal of the overflow pipe system) are recommended for lower building/maintenance cost and higher reliability. For future research directions, an alternative design that moves the infiltration bed of the current design to a location that is not directly coupled to and beneath planters can be investigated. If the infiltration bed of the current design is clogged due to sediment or unexpected subsurface issues, downward water movement from the planters will be blocked. By moving the infiltration bed to a location not physically contacting the planter, the absorption and infiltration functions of planters will not be affected even if the subsurface infiltration bed loses its function completely, and a larger total infiltration area is achieved.
It is also recommended to further expand the SWMM model built in this study to investigate the usefulness of an overflow pipe system, as well as optimal specifications for this system to achieve design goals with minimal construction and maintenance costs. SRT can be a useful tool to verify SWMM results in this regard. The optimal design can also be scaled up to different sizes of drainage areas. By summarizing optimal designs across the spectrum of drainage area sizes, attributes of optimal designs can be linked to sizes of drainage area.


