Abstract
Scour is the main cause of failure for spur dike. The accurate prediction of scour around spur dike is essential to design a spur dike. The present study focuses on the maximum scour depth in equilibrium condition and parameters, which influence it in a sand–gravel mixture bed. Outcomes of the present experimental study showed that the non-dimensional maximum equilibrium scour depth increases with critical velocity ratio (U/Uca), water depth-armour particle ratio (h/da), Froude number for sediment mixture (Frsm), water depth-spur dike length ratio (h/l), and decreases with increase in armour particle-spur dike length ratio (da/l). The maximum scour depth is proportional to dimensionless parameters of U/Uca, h/da, Frsm, h/l, but the scour depth is inverse proportional to da/l. Scour around spur dike in a sand–gravel mixture is mainly influenced by the property of the sediment mixture. The scour increases with decrease in non-uniformity of the sediment mixture. A non-linear empirical equation is proposed to estimate the maximum scour depth at an upstream nose of rectangular spur dike with a maximum error of 15%. The sensitivity analysis indicates that the maximum non-dimensional equilibrium scour depth depends on Frsm, followed by the secondary sensible parameters da/l, h/l, and h/da.
1. Introduction
Spur dike is a manmade hydraulic structure, which is also known as groin and spur. A spur dike protects the stream banks by reducing the flow velocity against the fluvial hydraulic processes. The construction cost of spur dikes in an alluvial stream is as cheap as an easily adaptable hydraulic structure. Spur dikes are fixed in vertical/perpendicular, declined or inclined positions to the longitudinal direction of the stream. The designing criteria of vertical spur dikes are more economic and convenient compared to the angled spur dikes [1]. The present study only focuses on the rectangular vertical spur dikes, which are fixed perpendicular to the flow. Spur dikes are identified as an effective hydraulic structure to reduce the flow velocity for river bank protection [1,2,3]. After fixing a spur dike, the flow processes in the stream are different to disturb the flow characteristics. This process around the spur dike is complex with a local scour phenomenon around the spur dikes. The scour study around the spur dikes is important for river engineering to provide practical guidelines [4].
Local scour is a well-defined term in river engineering and is described as the removal of sediment particles from the alluvial streams. It is recognized as the main reason for the failure of hydraulic structures [5,6,7,8]. Figure 1 shows an actual picture of the failure of a vertical spur dike in the river Gaula near Haldwani, Uttrakhand in India.
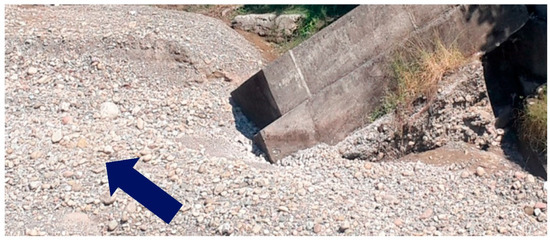
Figure 1.
Failure of spur dike at the river Gaula near Haldwani, Uttrakhand in India.
Maximum scour depth around spur dikes in uniform sediment beds are studied extensively compared to the sediment mixtures [9,10,11,12,13,14]. However, rivers in upper reaches or in hilly streams are mainly composed of different sediment mixtures or non-uniform sediments. Uniform sediment is defined as when the value of the geometric standard deviation is greater than 1.4 [14], where d84 and d16 are particle sizes at 84% and 16% finer, respectively. In non-uniform sediment mixtures, finer particles are being removed first, followed by the coarser particles trying to act as a protective layer near the bridge elements due to the complex sediment transport processes [5]. This protective layer of coarser particles is known as armour layer. The median diameter (da) of the armour layer is usually larger than the parent median diameter (d) of the streambed [15]. After the formation of an armour layer around a spur dike, further removal of sediment particles under the same hydraulic condition is very difficult. Kothyari et al. [6] stated that the armour layers of concern to calculate the scour depths around the bridge elements, are those where the bridge element is fixed in a streambed of relatively fine sediment covered by a coarser sediment layer (armour layer), developed due to the sorting of non-uniform sediments. The scour phenomenon at equilibrium scour stage is analysed by the approach flow parameters, the characteristics of armour particles along with parent bed material [16]. Most of the previous studies are limited to uniform sediment and therefore, in this research, the effect of non-uniformity of sediment on maximum scour depth was studied by performing 32 experiments.
Several investigators stated that the condition of incipient motion develops in the riverbed when shear velocity is greater than the critical shear velocity of riverbed materials [17,18]. After incipient condition, the additional shear stresses start the scour process around the spur dikes, piers, and abutments [17,18]. Melville [19] indicated that the scour around bridge abutment occurs when the approach shear velocity is nearly half of the critical shear velocity. Kothyari and Ranga Raju [6], and Melville [19] stated that spur dikes have an analogous scour process of abutments. It has been specified by Kothyari and Ranga Raju [6] that any reference ended to vertical wall abutment hereafter also holds good references for vertical spur dike. Melville [19] identified that the scour hole around abutment forms a primary vortex that sinks into the scour hole and prime agent for continuous scour progress. The scour process ends in a sand–gravel mixture by developing a stable layer armour layer. Once a scour hole reaches an equilibrium condition, the armour layer does not allow further change in the scour hole. Generally, an armour layer has uniform sediment properties with less geometric standard deviation than coarser sediments [15]. An armour layer depends on the quantity and strength of coarser particles in a sediment mixture. Sui et al. [16] stated that the stability and strength of the scour hole depend on the properties of coarser particles in a sediment mixture.
Previous investigators stated that the gravel particles are steadier inside the scour hole due to its larger mass. Larger mass particles require more energy to remove from the scour hole [6,16]. At the same time, some sand particles are covered by the gravel particles and, gradually, this process results in the development of clusters of gravel particles. For a limited spread, this cluster illustrates similar characteristics. It has been stated by Kothyari et al. [5] that the development of an armour layer might be observed as a continuous process of collapses and the creation of clusters.
The parameters influencing the maximum equilibrium scour depth around a rectangular spur dike consist of the geometry of spur dikes, the sediment properties, and the flow parameters. Maximum equilibrium scour depth (dsa) around a rectangular spur dike in a sediment mixture can be written as,
In Equation (1), dsa is the maximum scour depth at equilibrium condition; are sediment parameters; U, h are flow parameters, and l is the spur dike geometry parameters. Where ds is a median diameter of sand, da is a median diameter of armour or gravel particles, d is an effective median diameter of sediment mixture, is a standard deviation of sediment mixture, Ucs and Uca are critical velocities of sand and armour particles, respectively. Frd = U/{(S−1)gd}0.5 is densimetric particle Froude number and is densimetric Froude number of the sediment mixture [15]. U is time-averaged approach velocity, S is relative density, is the density of water, g is gravitational acceleration, l is transverse length of spur dike.
2. Experimental Setup and Procedure
In the current study, 32 experiments were completed in a hydraulics laboratory, in the civil engineering department, at I.I.T. Roorkee, India, by using a rectangular flume of 24.0 m length and 1.0 m width, and a sediment depth of up to 0.25 m, as shown in Figure 2a. A working-section of the flume, 4.0 m × 1.0 m × 0.25 m, which begins at a distance of 12.0 m from the flume entrance. All tests were completed under clear water scour condition. Four different rectangular spur dikes were used in this study, which were made of 5 mm thick cast iron plates. All experiments were completed under different flow conditions and sediment properties at different time average velocities (U), approach flow depths (h), transverse length of spur dike (l), and median diameter of parent streambed particles (d).

Figure 2.
Experiments. (a) Photometric view. (b) Scour depth variations with time at upstream nose and wall-junction of the spur dike.
Working-section of flume was fully filled with two different sediment mixtures, (i) 50% sand (ds = 0.27 mm and σ = 1.22) and 50% gravel (da = 2.7 mm and σ = 1.21), and (ii) 50% sand (ds = 0.27 mm and σ = 1.22) and 50% gravel (da = 3.1 mm and σ = 1.18). These sediment mixtures were filled up to the longitudinal level of the flume bed. A 2-D profiler was used to level the working section. Four different rectangular spur dikes having transverse lengths (l) of 6.0 cm, 9.0 cm, 11.5 cm, and 14.0 cm were used for the experiments. The water supply into the flume was regulated by a valve, which was provided in the inlet pipe. An ultrasonic flow meter was provided at the flume entrance pipe to measure the flow rate. Approach flow depth was adjusted using the tailgate, which was located at the downstream end of the flume. A wave regulator was facilitated at flume entrance to produce a uniform or near-uniform flow condition in the experimental flume. The maximum equilibrium scour depth was measured with a Vernier point gauge. The scour depth was measured at upstream nose of the spur dike and the upstream wall-junction of the spur dike with different time intervals. Figure 2b shows the variation of temporal scour depth (dst) at upstream spur dike’s nose and spur dike’s wall-junction. All experiments were completed for 20 h. However, experimentally, we saw that the equilibrium scour stage was reached within 10–14 h, as can be seen Figure 2b. After the equilibrium time of scour, the scour depth at upstream nose and wall-junction of the spur dike was the same at every 30 min interval. At the equilibrium scour condition, the maximum scour depth always occurred at the upstream nose of the spur dike. In the present study, the maximum equilibrium scour depth (dsa) at the nose of spur dike was only considered for analysis. Before the start of each experiment, the test-section of flume was perfectly levelled with respect to the flume bed and covered with a thin Perspex sheet. Once pre-set flow conditions were achieved, the Perspex sheet was separated very sensibly to avoid the undesirable scour around the pier. Table 1 illustrates the maximum scour depth along with flow and sediment properties.

Table 1.
Scour depth data at equilibrium condition.
In this experimental study, the time-averaged velocity was taken in place of approach shear velocity (u*) to study the maximum equilibrium scour depth. The critical shear velocity of flume bed particles and armour layer particles was calculated by Shield’s curve. The corresponding values of critical velocities (Uca) were calculated using Lauchlan and Melville [20] in Equation (2).
where ks is the height of roughness.
3. Results and Discussion
3.1. Maximum Scour Depth and Location
The scour progress ends in a sand–gravel mixture when a stable armour layer forms around the spur dike. This condition is also known as equilibrium scour condition. Maximum scour depth at this condition is well-known as maximum equilibrium scour depth or maximum scour depth (dsa). The equilibrium condition of scour strongly depends on the approach flow parameters, characteristics of the armour bed, and the dimension of the spur dike. The estimation of dsa around the spur dike is an important function for the safe and efficient design of the spur dikes.
Maximum depth of scour (dsa) at equilibrium condition is a key factor for a non-dimensional analysis. Experimentally, it was observed that dsa always occurs at the upstream nose of the spur dike. Distribution of high bed shear stresses in armour beds around the bridge elements is responsible for the maximum scour depth [16]. It was observed that the scour depth at spur dike nose in equilibrium stage was comparatively more as compared to the spur dike wall-junction, as shown in Figure 2b and Figure 3. Figure 3 illustrates the position of maximum depth of scour and scour depth variation in equilibrium condition.
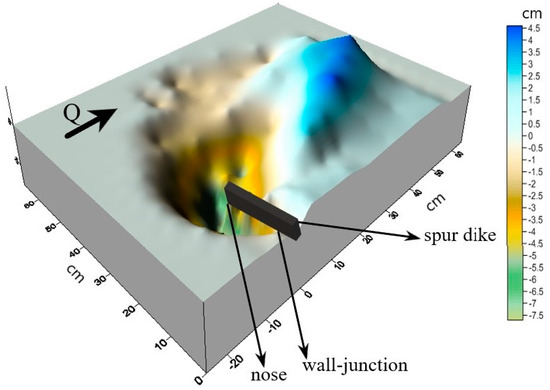
Figure 3.
Geometry of scour hole at equilibrium condition for R10.
3.2. Influence of Different Parameters on Maximum Scour
The stability of the armour layer around the spur dike is influenced by properties of armour particles, the sediment mixture, and approach flow properties. The maximum equilibrium scour depth (dsa) variations with time-averaged velocity (U) for different transverse lengths (l) of spur dike along with different sediment sizes are shown in Figure 4a. It can be seen that larger armour particles show less variation in scour depth with time-averaged velocity, while smaller armour particle beds with a larger transverse length of spur dike show higher scour depth variation. The maximum depth of scour (dsa) increases with the increase in time-averaged velocity for any sizes of armour particle, as referred in Figure 4a. Scour depth variation increases with an increase in U/Uca. For a particular range of U/Uca, dsa increases with increase in l, as shown in Figure 4b.

Figure 4.
Maximum scour depth of spur dike (a) Depth with time-averaged velocity, and (b) Depth with transverse lengths.
Figure 5a–d shows the variations of dsa/l vs. h/l, dsa/l vs. da/l, dsa/l vs. Frsm, and dsa/l vs. h/da. The organised variation between non-dimensional scour depth and flow shallowness ratio (h/l) clearly states that the variation of maximum scour depth in non-dimensional form increases with a decrease in l. For a particular spur dike, dsa/l increases with increase in the flow shallowness ratio, as can be seen in Figure 5a. The results indicate that the rate of maximum scour depth variation in the sand–gravel mixture is found to be at a maximum for the longest spur dike, as shown in Figure 5a.
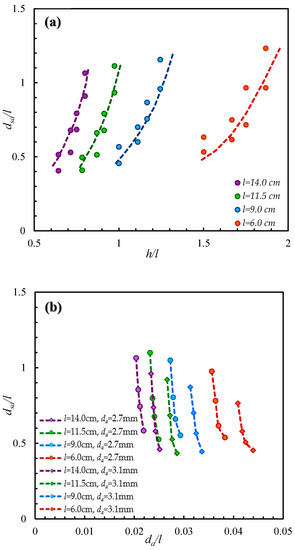
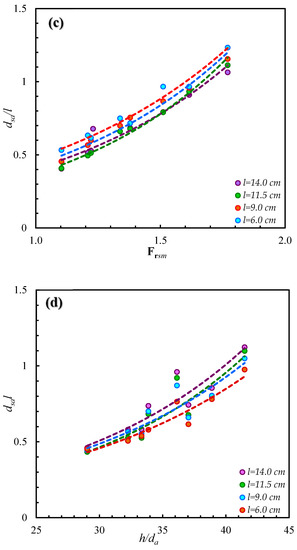
Figure 5.
Influence of parameters on maximum non-dimensional scour depth. (a) dsa/l vs. h/l. (b) dsa/l vs. da/l. (c) dsa/l vs. Frsm. (d) dsa/l vs. h/da.
Figure 5b illustrates the variation of da/l with respect to the non-dimensional scour depth (dsa/l). It is clearly visible from Figure 5b, the magnitude of dsa/l increases with a decrease in da/l. For a particular spur dike, the maximum scour depth variation increases with decrease in armour particle size (Figure 5b). For the constant value of armour particle, the maximum scour depth variation decreases with a decrease in transverse length of spur dike. This implies that the variation of maximum non-dimensional scour depth increases with a decrease in armour particle and an increase in the transverse length of spur dike.
The present study deals with the sand–gravel mixture and found that the variation of scour depth in different sediment mixtures is influenced by the non-uniformity of sediment. Hence, the authors analysed the influence of sediment mixture on maximum scour depth (dsa) in terms of sediment mixture Froude number (Frsm = σ−1/3Frd). Figure 5c illustrates the effect of Frsm on maximum scour depth. It was observed that the non-uniformity factor of sediment plays a significant role in scour processes for non-uniform sediment’s case. For a constant dimension of spur dike, the maximum scour depth in non-dimensional form increases with Frsm (Figure 5c). It means that the maximum scour depth increases with a decrease in non-uniformity of sediment. It was also observed that the development of armour layer in the scoured region results in the exposure of coarser gravel size due to washing out of the finer gravel particles.
Figure 5d shows the variation in the gradient of the trend lines dsa/l vs. h/da with different dimensions of spur dike. The pattern of trend lines indicates that the dsa/l increases with the increase in h/da, as can be seen in Figure 5d. The influence of h/da was more visible for a particular spur dike’s case. The rate of maximum scour depth variation increases with the length of spur dike.
3.3. Maximum Scour Depth
The maximum scour depth around a rectangular spur dike was briefly explained in the above sections. Equation (1) shows the dependent parameters of a maximum equilibrium scour depth relationship. In a sediment mixture, parent bed material and armour particles are the most important parameters [16]. By using Buckingham’s pi theorem, Equation (1) may be written in a non-dimensional form in Equation (3) as:
The influence of different parameters on maximum equilibrium scour depth is discussed in the previous section. An empirical Equation (4) was derived to compute the maximum equilibrium scour depth using these influencing parameters. This equation was derived by using a nonlinear regression method. Equation (4) calculates the maximum equilibrium scour depth around a rectangular spur dike at its upstream nose. Equation (4) was also verified with 30% verification datasets, as shown in Figure 6a,b. Figure 6c illustrates the variation between percentage error and total experimental data frequency. All datasets were found inside the ±15% error, as can be seen in Figure 6c.
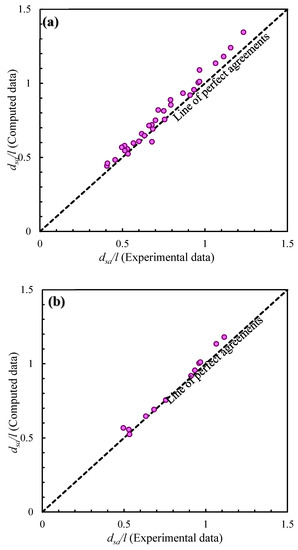
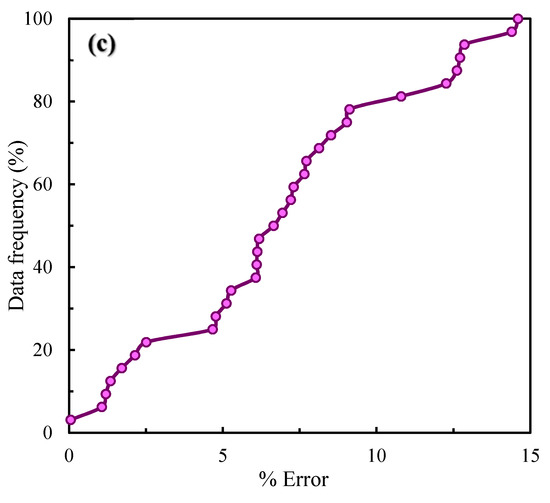
Figure 6.
Experimental vs. computed maximum non-dimensional scour depths. (a) 70% training datasets. (b) 30% validation datasets. (c) Comparison between percentage data frequency and percentage error.
3.4. Sensitivity Analysis
A sensitivity analysis was done to classify the most critical parameter, which affects the maximum equilibrium scour depth. The sensitivity analysis was done by taking the average value of all dependent and independent parameters. An assumption was taken during the sensitivity analysis, i.e., each input variable is an error independent variable. The average values of input parameters Frsm, da/l, h/l, and h/da for the datasets used in this analysis are 1.4, 0.032, 1.11, and 35.25, respectively.
If a percentage error ΔŶ in the output is known as the difference between values of output computed for inputs χ and χ + Δχ, then the percentage error might be estimated as the absolute sensitivity (α = ΔŶ/Δχ). Here, the output is χ = dsa/l and input χ = Frsm, da/l, h/l, and h/da. The error also can be expressed in a relative form β = ΔŶ/Ŷ. The error ΔŶ in output is fundamentally the deviation sensitivity with Δχ being the error. The relative sensitivity can be expressed ω = (χ.ΔŶ)/(Ŷ.Δχ) [21].
The sensitivity analysis is completed by changing each input parameter by ±10%. The outcomes of sensitivity analysis are shown in Table 2 and Table 3, which show that Frsm is the most sensitive parameter followed by da/l, h/l, and h/da. For 10% increase in χ, the relative sensitivity of Frsm is nearly 8.5, 2.7, and 2.8 times of da/l, h/l, and h/da, respectively. However, for a 10% decrease in χ, the relative sensitivity of Frsm is nearly 1.7, 70.4, and 30.2 times of da/l, h/l, and h/da, respectively. Hence, it must be said that the accuracy of Equation (4) significantly depends on Frsm, followed by da/l, h/l, and h/da.

Table 2.
Results of sensitivity analysis with 10% increment in Δχ.

Table 3.
Results of sensitivity analysis with 10% reduction in Δχ.
A performance index (discrepancy ratio) was also computed using the present experimental datasets. For a predictable estimation of the difference between calculated and experimental values of dsa/l, the discrepancy ratio is defined in Equation (5) as:
For DR = 0, the computed values of dsa/l are identical to the experimental values of dsa/l. For negative/positive values of discrepancy ratio, the calculated values of dsa/l is smaller/greater than the experimental values. Accuracy is described as the frequency of cases for which the discrepancy ratio is within a suitable range for the total number of data, as can be seen in Figure 7. Data frequency within DR = ±0.01 is 23 out of total 32 datasets. Discrepancy ratio analysis shows good agreements between calculated and experimental values of maximum scour depth, as can be seen in Figure 7.

Figure 7.
Variation of present data frequency with discrepancy ratio.
4. Conclusions
The maximum equilibrium scour depth around a rectangular spur dike was studied experimentally in a sand–gravel mixture bed. The influence of several parameters of flow parameters, length of spur dike, and sediment properties on maximum equilibrium scour depth was discussed. The comparison of time-dependent scour depths at upstream nose and wall-junction of the spur dike was also shown and the temporal scour depth vitiation was found, which was lesser at wall-junction compared to scour depth at the nose of spur dike. Experimentally, it was found that the maximum scour depth at equilibrium scour condition always occurred at the upstream nose of the spur dike. Detailed conclusions are:
- The influence of different parameters on maximum equilibrium scour depth was discussed in detail. The dimensionless variation of maximum equilibrium scour depth increases with increase in U/Uca, h/da, Frsm, h/l, and decreases with increase in da/l. The scour processes in sediment mixture are mainly influenced by the property of sediment mixture and maximum scour depth increases with increase in densimetric sediment mixture Froude number. Therefore, scour processes in sediment mixture increases with decrease in non-uniformity of sediment;
- For predicting the maximum equilibrium scour depth at upstream nose of the rectangular spur dike, the non-linear relationship in non-dimensional form was derived. This equation showed good agreements between computed and experimental values of scour depths, as shown in Figure 6a–c and Table 2 and Table 3;
- A sensitivity analysis was completed to compute the most sensible parameter for maximum equilibrium scour depth. Sensitivity analysis indicated that the maximum non-dimensional scour depth heavily depended on densimetric sediment mixture Froude number. Secondary sensible parameters were da/l, h/l, and h/da in Table 2 and Table 3.
Author Contributions
M.P. and U.K.S. conducted experiments; M.P., M.A. and U.K.S. analysed data, applied methodology and validated this experimental study; W.H.L., Y.C. and Z.A. revised and edited; funding acquisition by W.H.L.
Funding
This research was funded by the Natural Science Foundation of Tianjin City: 18JCYBJC21900 and Science Fund for Creative Research Groups of the National Natural Science Foundation of China (Grant no. 51621092). The APC was funded by the Natural Science Foundation of Tianjin City: 18JCYBJC21900.
Acknowledgments
The authors kindly acknowledge the staff of the hydraulics laboratory, I.I.T. Roorkee, and School of Civil Engineering, Tianjin University.
Conflicts of Interest
The authors declare no conflict of interest.
List of Notations
| d | Median diameter of sediment mixture |
| da | Median diameter of armour or gravel particle |
| ds | Median diameter of sand |
| d16 | Particle size at 16% finer |
| d84 | Particle size at 84% finer |
| dsa | Maximum equilibrium scour depth |
| dst | Scour depth at time t |
| Frd | Densimetric Froude number |
| Frsm | Froude number of sediment mixture |
| g | Acceleration due to gravitational |
| h | Flow depth |
| ks | Roughness height |
| l | Transverse length of spur dike |
| U | Time-average velocity |
| Uca | Critical velocity of armour particle |
| Ucs | Critical velocity of sand particle |
| u*c | Critical shear velocity |
| Density of water | |
| σ | Geometric standard deviation of particle size distribution |
| α | Absolute sensitivity |
| β | Relative error |
| ω | Relative sensitivity |
References
- Zhang, H.; Nakagawa, H.; Mizutani, H. Bed morphology and grain size characteristics around a spur dyke. Int. J. Sediment Res. 2012, 27, 141–157. [Google Scholar] [CrossRef]
- Zhang, L.; Wang, H.; Zhang, X.; Wang, B.; Chen, J. The 3-D morphology evolution of spur dike scour under clear-water scour conditions. Water 2018, 10, 1583. [Google Scholar] [CrossRef]
- Pandey, M.; Ahmad, Z.; Sharma, P.K. Estimation of maximum scour depth near a spur dike. Can. J. Civ. Eng. 2016, 43, 270–278. [Google Scholar] [CrossRef]
- Pandey, M.; Ahmad, Z.; Sharma, P.K. Scour around impermeable spur dikes: A review. ISH J. Hydraul. Eng. 2017, 24, 25–44. [Google Scholar] [CrossRef]
- Kothyari, U.C.; Hager, W.H.; Oliveto, G. Generalized approach for clear-water scour at bridge foundation elements. J. Hydraul. Eng. 2007, 133, 1229–1240. [Google Scholar] [CrossRef]
- Kothyari, U.C.; Ranga Raju, K.G. Scour around spur dikes and bridge abutments. J. Hydraul. Res. 2001, 39, 367–374. [Google Scholar] [CrossRef]
- Aamir, M.; Ahmad, Z. Review of literature on local scour under plane turbulent wall jets. Phys. Fluids 2016, 28, 105102. [Google Scholar] [CrossRef]
- Cui, Y.; Lam, W.H.; Zhang, T.; Sun, C.; Hamill, G. Scour Induced by Single and Twin Propeller Jets. Water 2019, 11, 1097. [Google Scholar] [CrossRef]
- Ghodsian, M.; Vaghefi, M. Experimental study on scour and flow field in a scour hole around a T-shape spur dike in a 90° bend. Int. J. Sediment Res. 2009, 24, 145–158. [Google Scholar] [CrossRef]
- Kuhnle, R.; Alonso, C. Flow near a model spur dike with a fixed scoured bed. Int. J. Sediment Res. 2013, 28, 349–357. [Google Scholar] [CrossRef]
- Koken, M.; Gogus, M. Effect of spur dike length on the horseshoe vortex system and the bed shear stress distribution. J. Hydraul. Res. 2015, 53, 196–206. [Google Scholar] [CrossRef]
- Mostafa, M.M.; Ahmed, H.S.; Ahmed, A.A.; Abdel-Raheem, G.A.; Ali, N.A. Experimental study of flow characteristics around floodplain single groyne. J. Hydro-Environ. Res. 2019, 22, 1–13. [Google Scholar] [CrossRef]
- Ezzeldin, R.M. Numerical and experimental investigation for the effect of permeability of spur dikes on local scour. J. Hydroinform. 2019, 21, 335–342. [Google Scholar] [CrossRef]
- Pandey, M.; Sharma, P.K.; Ahmad, Z.; Karna, N. Maximum scour depth around bridge pier in gravel bed streams. Nat. Hazards 2018, 91, 819–836. [Google Scholar] [CrossRef]
- Oliveto, G.; Hager, W.H. Temporal evolution of clear-water pier and abutment scour. J. Hydraul. Eng. 2002, 128, 811–820. [Google Scholar] [CrossRef]
- Sui, J.; Afzalimehr, H.; Samani, A.K.; Maherani, M. Clear-water scour around semi-elliptical abutments with armored beds. Int. J. Sediment Res. 2010, 25, 233–245. [Google Scholar] [CrossRef]
- Qi, M.; Li, J.; Chen, Q. Applicability analysis of pier-scour equations in the field: Error analysis by rationalizing measurement data. J. Hydraul. Eng. 2018, 144, 04018050. [Google Scholar] [CrossRef]
- Fazli, M.; Ghodsian, M.; Neyshabouri, S.A.A.S. Scour and flow field around a spur dike in a 90° bend. Int. J. Sediment Res. 2008, 23, 56–68. [Google Scholar] [CrossRef]
- Melville, B.W. Local scour at bridge abutments. J. Hydraul. Eng. 1992, 118, 615–631. [Google Scholar] [CrossRef]
- Lauchlan, C.S.; Melville, B.W. Riprap protection at bridge piers. J. Hydraul. Eng. 2001, 127, 412–418. [Google Scholar] [CrossRef]
- Ahmad, Z. Prediction of longitudinal dispersion coefficient using laboratory and field data: Relationship comparisons. Hydrol. Res. 2013, 44, 362–376. [Google Scholar] [CrossRef]
© 2019 by the authors. Licensee MDPI, Basel, Switzerland. This article is an open access article distributed under the terms and conditions of the Creative Commons Attribution (CC BY) license (http://creativecommons.org/licenses/by/4.0/).