Article

Energy Sorghum Production under Arid and Semi-Arid Environments of Texas

1
Department of Biological and Agricultural Engineering, Texas A&M AgriLife Research Center, 2415 E. Highway 83, Weslaco, TX 78596, USA
2
Department of Biological and Agricultural Engineering, Texas A&M University, Scoates Hall, 2117, College Station, TX 77843, USA
3
Department of Crop and Soil Sciences, Texas A&M AgriLife Research Center, 1380 A&M Circle, El Paso, TX 79929, USA
4
Department of Agricultural Economics, Texas A&M AgriLife Extension Service, 2401 E. Business 83, Weslaco, TX 78596, USA
*
Author to whom correspondence should be addressed.
Water 2019, 11(7), 1344; https://doi.org/10.3390/w11071344
Submission received: 22 May 2019 / Revised: 20 June 2019 / Accepted: 25 June 2019 / Published: 28 June 2019
(This article belongs to the Section Water Use and Scarcity)

Abstract

:
Water availability and supply are critical factors in the production of bioenergy. Dry biomass productivity and water use efficiency (WUE) of two biomass sorghum cultivars (Sorghum bicolor (L.) Moench) were studied in two different climatic locations during 2014 and 2015. The objective of this field study was to evaluate the dry biomass productivity and water use efficiency of two energy sorghum cultivars grown in two different climatic environments: one at Pecos located in the Chihuahuan Desert and a second one located at Weslaco in the Lower Rio Grande bordering Mexico and with a semiarid environment. There were significant differences between locations in dry biomass and WUE. Dry biomass productivity ranged from 22.4 to 31.9 Mg ha−1 in Weslaco, while in Pecos it ranged from 7.4 to 17.6 Mg ha−1. Even though it was possible to produce energy sorghum biomass in an arid environment with saline-sodic soils and saline irrigation, the energy sorghum dry biomass yield was reduced more than 50% in the arid environment compared to production in a semiarid environment with good soil and water quality, and it required approximately twice as much water. Harsh production conditions combined with low energy prices resulted in negative net returns for all treatments. However, a moderate increase in ethanol price could make the semiarid cropland of Texas an economically feasible feedstock production location.

1. Introduction

Every year a significant amount of surface of crop lands remain idle because of low return margins, high water pumping costs, and limited and saline water supplies. In recent years, there has been a great interest in the use of agricultural crops to produce biofuel. Among the most important reasons are to reduce our dependence on fossil fuels, to reduce air contamination and mitigate greenhouse gases, and to develop markets for existing and new crops. An important challenge to grow bioenergy crops is the water availability, which is one of the critical factors to produce biofuels or any agricultural crops. In the past several years some authors have suggested to produce biofuel using marginal water (saline water) and marginal lands to increase its sustainability, avoid competition with food crops, or even to produce these biofuels in arid environments. Most of the arid environments are affected with saline and sodic soils, which represent 23% and 37% of the cultivated lands, respectively. Main causes of soils with high salinity are the high temperatures, which tend to increase evaporation demand and bring up salts to the root zone, and scarce precipitation, which prevents removal of salts from the soil by leaching. Salt-affected and sodic soils as well as saline water supplies represent a major challenge for irrigated crop production in many parts of the world since they are a threat to sustain productivity in irrigated agriculture [1].
Sorghum is promising as a bioethanol crop because it efficiently uses water, and it is well-adapted to semiarid regions where soil salinity is too high to grow most common crops economically and where groundwater with high salinity is the most important water source [2]. Energy sorghum hybrids were genetically modified from forage sorghums to prolong their vegetative growth stage, and to produce more biomass, and they can reach up to six meters in height under optimal growth conditions [3]. Also, energy sorghum hybrids have demonstrated to produce high biomass yields in a lifecycle of 60 to 90 days [4]. They contain significant quantities of lignin, cellulose, and hemicellulose in their leaves, and their stems can be converted into ethanol [5]. Therefore, plant species such as the lignocellulosic species can produce more biomass, and, consequently, they can also produce more bioenergy. The challenge is to find plant feedstocks that produce more biomass with fewer inputs (mainly fertilizer and water). Concentrations of soluble salts in the soil root zone beyond the threshold levels can reduce crop growth and affect yield of most agricultural crops. According to Leland and Eugene [6], sorghum has a salt tolerance threshold of 6.8 dS m−1, and its yield is reduced approximately 16% per dS m−1 of soil salinity increase; therefore, sorghum is generally classified as a moderately tolerant crop. This threshold value and yield can vary depending on climate, soil conditions, sorghum varieties, and cultural practices [1]. There are several situations associated with crop production in relation to saline-sodic soils and saline water. For example, some locations may present both soil and water saline and/or sodic conditions, and other locations may present only saline water but have healthy soils.
Competition for land use between biofuel production and food/feed crops could be prevented if biofuel crops were grown on marginal lands (saline or sodic soils) and aquifers with limited water quality (high salinity). In arid and semiarid areas irrigated with groundwater with high salinity, sorghum could offer the advantage of being a biomass crop that can be used for bioenergy production. The objective of this field study was to evaluate the dry biomass productivity, water use efficiency, and expected net returns of two energy sorghum cultivars grown in two different climatic environments with different saline and sodic soils and different irrigation water quality. Results of this study will help producers to identify opportunities and make better decisions to improve their crop productions.

2. Materials and Methods

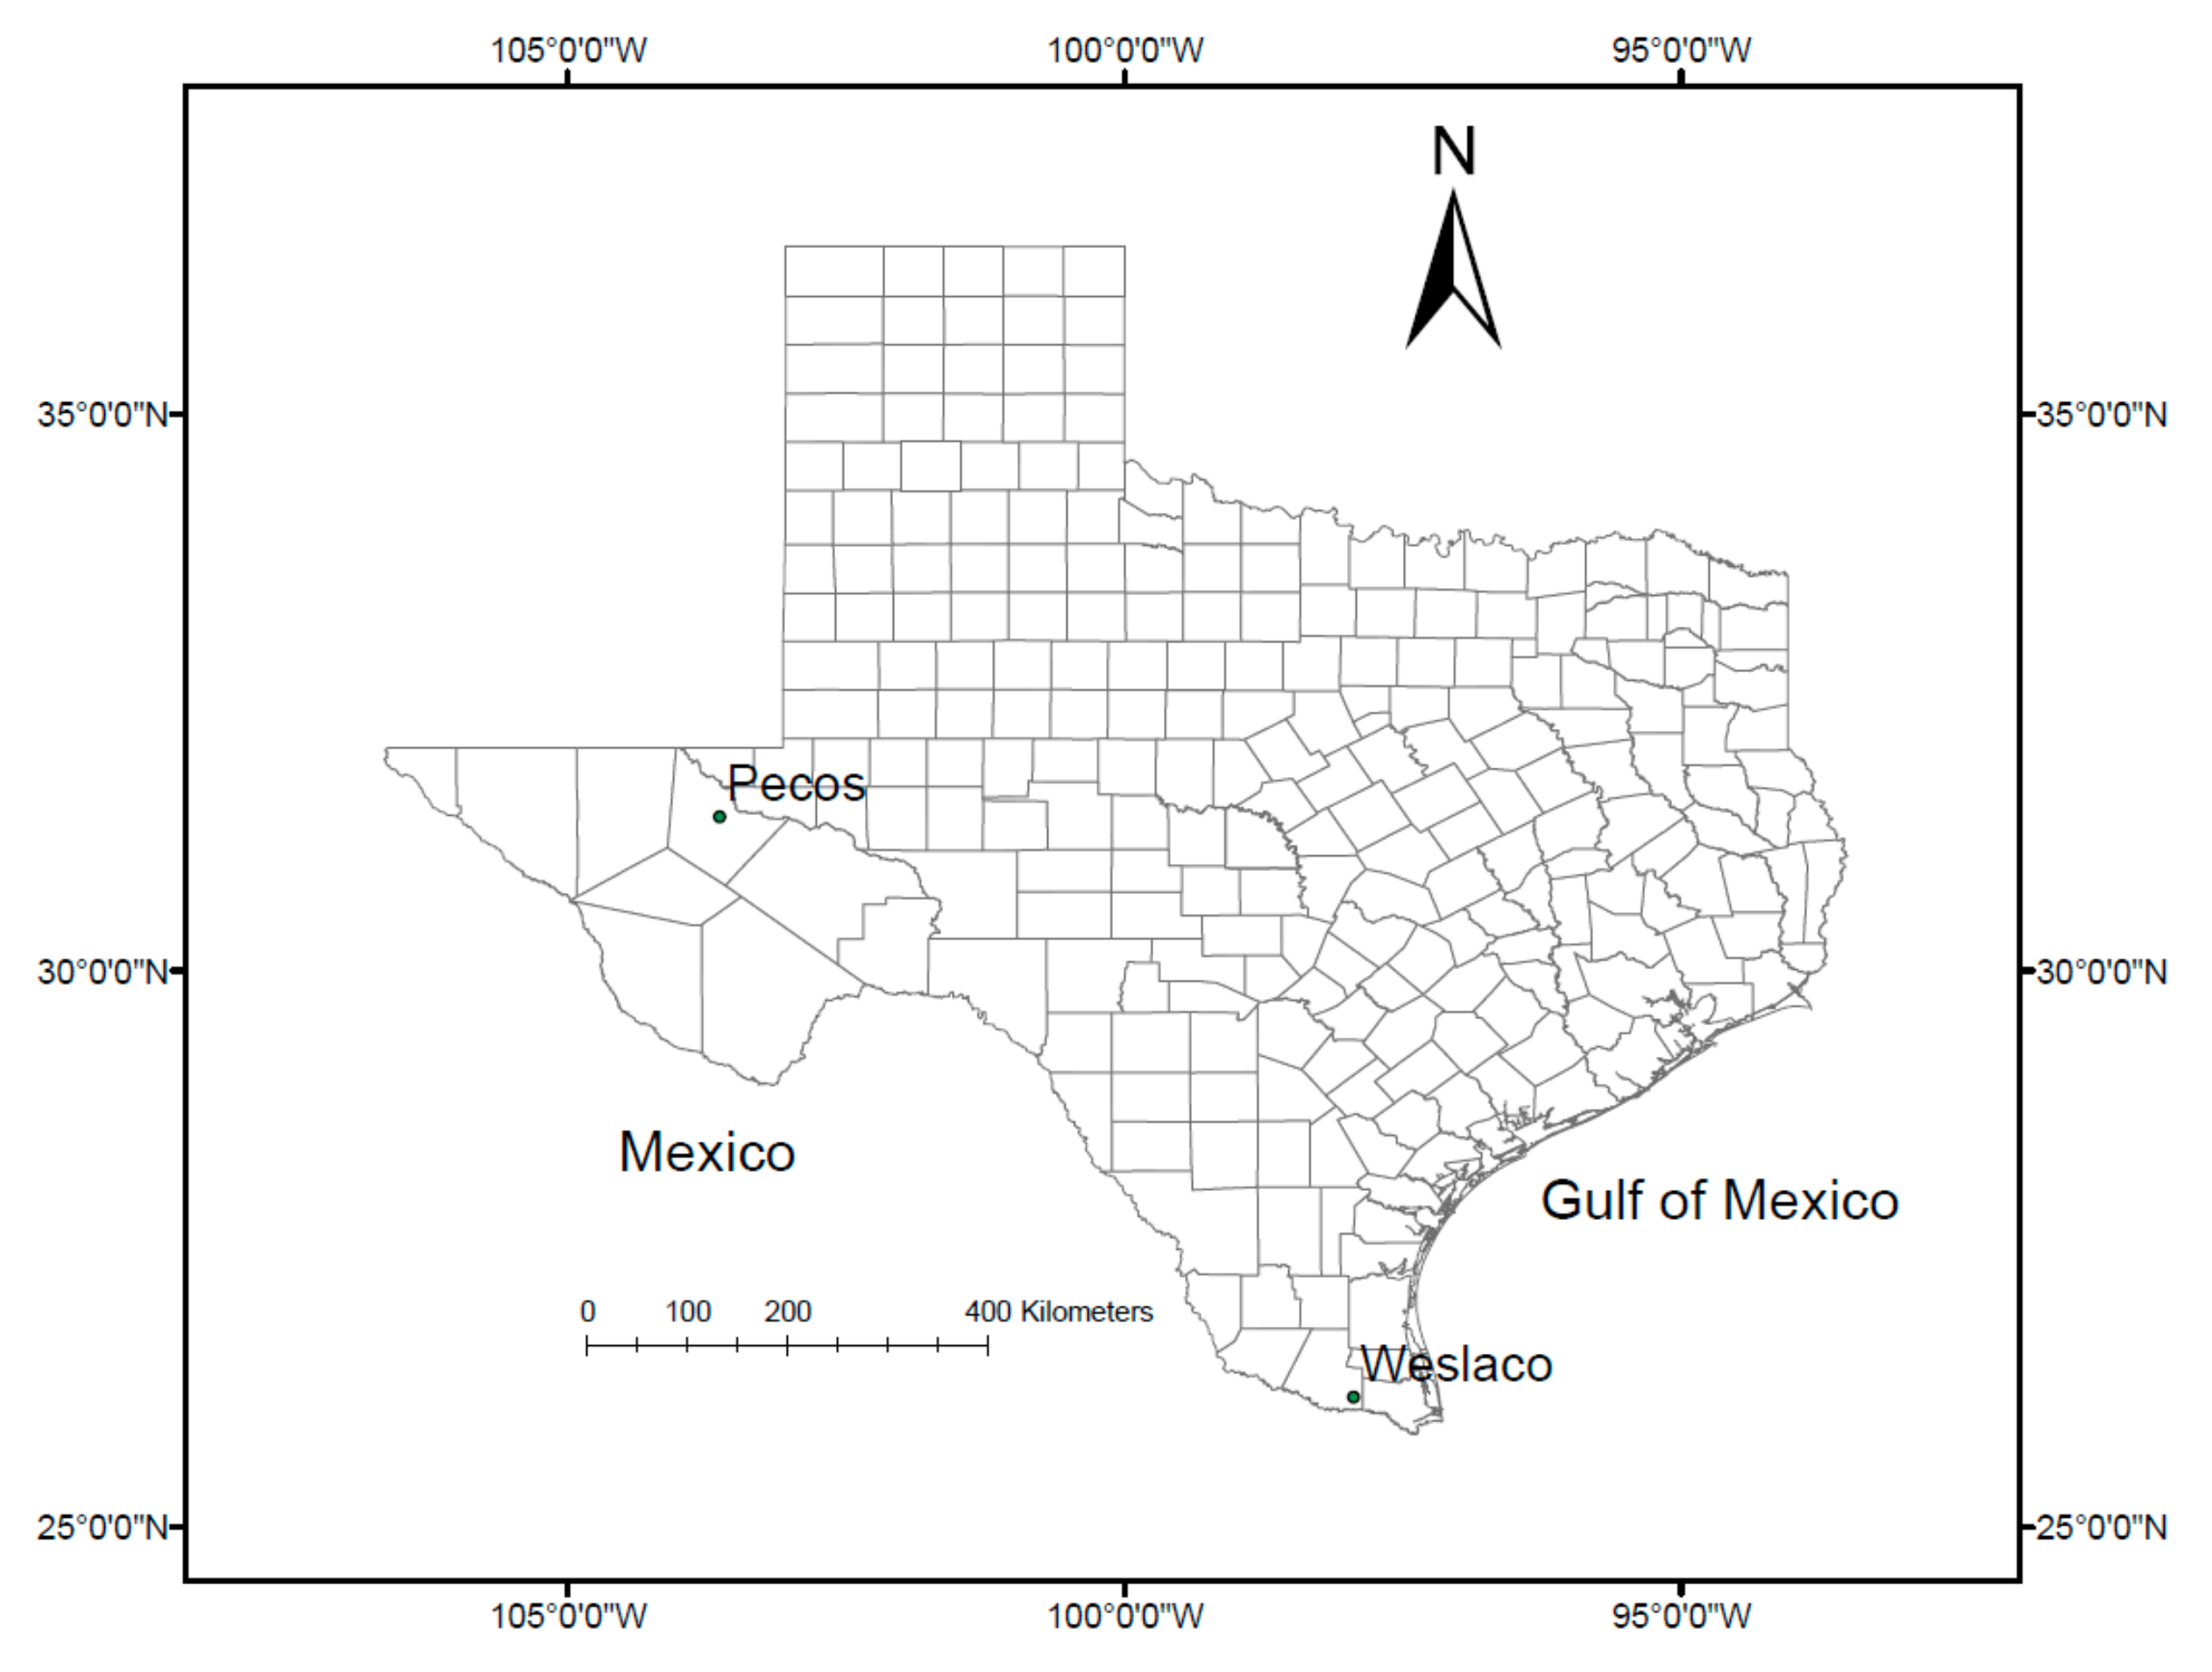
2.1. Field Experiments

Field studies were conducted at two locations: one at the Texas A&M AgriLife Research station located in Pecos, TX (31° 22′ 48″ N, 103° 37′ 42″ W; elevation 817 m above mean sea level) and a second located at the Weslaco Texas A&M AgriLife Research and Extension station (26° 10′ N, 97° 56′ W; elevation 25 m above mean sea level) (Figure 1) during 2014 and 2015 growing seasons. The Pecos Research Station lies in the Trans-Pecos area, which is part of the Chihuahuan Desert, and it is the largest desert in North America, with a sparsely populated area. The Weslaco research station is in the Lower Rio Grande Valley, which is in the south along the border between the United States and Mexico, and it has a semiarid climate. The soil at the experimental area at Pecos is a Hoban silt clay loam (0%–1% slopes), and at Weslaco it is a Hidalgo silt clay loam (0%–1% slopes). Table 1 lists each layer data for the 2 m sample depth for both location soil profiles. Soil properties were determined from the Soil Survey Geographic database [7]. Two environments were chosen so as to evaluate the performance of two energy sorghum cultivars at two different soil and irrigation water quality conditions. Previous reports indicated that sorghum cultivars are well adapted and yield well in diverse saline conditions.
Two energy sorghum cultivars from Blade® Energy Crops, Blade ES 5140 (photoperiod-insensitive hybrid) and Blade ES 5200 (photoperiod-sensitive hybrid) were selected for field experiments conducted at Pecos, TX and Weslaco, TX during the 2014 and 2015 growing seasons. These two cultivars are recognized to be highly efficient in water use, perform well on marginal lands and marginal conditions, have a high yield biomass in as few as 90 to 100 days in many areas, and grow higher plants that reach up to 6 m. In the case of photoperiod-sensitive hybrids, they produce high biomass through continued vegetative growth when the day length is more than the photoperiod trigger of about 12 h 20 min, while photoperiod-insensitive hybrids are thermal-time regulated and reach maturity following exposure to a specified accumulation of heat units. Cultivars and plant-to-maturity dates in each year are presented in Table 2. The field experiments consisted of evaluating the biomass yield responses of two energy sorghum hybrids (Blade ES 5200 and Blade ES 5140) grown at Pecos and Weslaco during the 2014 and 2015 growing seasons. The experimental design was a randomized complete block design (RCBD) with four replications. Each plot consisted of 8 raised beds 22.9 m long, to accommodate furrow irrigation, on rows 1.02 m (40 in.) wide. Rows were oriented north to south. There was an adjacent space of 3 rows between each plot. The previous planted crop in all locations was sorghum. A field cultivator was used to prepare the seedbed before sowing, and sorghum cultivars were sown using a small plot drill during the optimum planting dates of both locations. They were sowed in Pecos on 23 June 2014 and 7 June 2015, and in Weslaco on 23 April 2014 and 24 March 2015 (Table 2), at a plant density of 305,293 plants per ha. The parameters of irrigation water quality for Pecos and Weslaco are presented in Table 3. The water source used to irrigate the experiments in Pecos came from a water well. This water was considered as severely restricted for agricultural use because of its very high salinity and very high sodic hazard [8]. The Pecos experimental area was located 10 km away from the Pecos River. The water source used to irrigate the Weslaco experiments came from the Rio Grande and it was pumped from the river to a network of canals that supplied water to the agricultural fields. The Weslaco water was considered to have low to moderate salinity and low sodicity, and it could be used to irrigate crops tolerant to low salinity if the soil had not been salinized.
The weather inputs for Weslaco and Pecos (Figure 2) were obtained using an automatic weather station (model ET106, Campbell Scientific, Logan, Utah) located in each experimental site. These weather stations were equipped with a tipping bucket rain gage (model TE525, Texas Electronics, USA) for measuring rainfall, a temperature sensor (model CS500, Vaisala, Helsinki, Finland) for measuring maximum and minimum temperature and relative humidity, a pyranometer (model LI200X, LI-COR Biosciences, Lincoln, Nebraska) for measuring total irradiance (400–1100 nm light spectrum waveband), and a wind set (model 034A, Campbell Scientific, Utah) for measuring average wind speed, all recorded hourly using a CR10X data logger. The weather data were used for irrigation scheduling with the program posted online [9]. This program uses a water balance approach and estimates ETo with the Penman–Monteith equation, which is multiplied by the FAO-56 crop coefficient (Kc) to get crop evapotranspiration (ETc) [10]. The irrigation strategy was to meet the full water requirements by replacing crop water use as calculated using an internet weather-based program [11]. This irrigation program estimates the irrigation timing and amount needed using a predetermined allowed depletion level, which was 60% for the experimental site soil. The depletion level was determined considering a root depth of 1.2 m and following common practices in the area to obtain maximum yields in deep rooted annual crops.
Fertilization and irrigation management are shown in Table 2. The water quality parameters of the irrigation water of both locations are presented in Table 3. Higher salinity and sodicity were observed at the Pecos site. Additionally, in order to remove the salts around the root zone, a leaching fraction of 30% of water was applied in the Pecos experiments in both years. This was due to the high levels of salinity in the irrigation water observed in the records. All plots in both locations received nitrogen fertilizer at a rate of 100 kg N ha−1 (from urea ammonium nitrate; 32% mass fraction of N) applied in two equal split applications).

2.2. Plant Measurements

Bioenergy cultivars were only harvested at the end of each growing season in both locations (Table 2). The plant variables measured were fresh and dry weight, plant height, and stem diameter. Plant height was measured before each biomass harvest from the ground to the tip of the tallest leaf. An area of 4 m2 for each plot was randomly selected for manual harvesting at maturity for both cultivars at each experimental unit avoiding plot edges. Both sorghum cultivars experienced some lodging during the later stages. Blade ES 5140 was more susceptible to lodging than blade ES 5200 because of its thinner diameter stem. Dry biomass and percent of tissue moisture content were determined after drying all sampled plant materials using a forced-air oven at a temperature of 60 °C until the plants reached a constant weight.

2.3. Calculation and Statistical Analysis

Plant response to temperature was calculated on a daily basis. Accumulated growing degree days were calculated with a base temperature of 10 °C [12], and the values are presented in Table 2. It was comparable across the two-year growing seasons and across locations. Mean daily air temperature ( T m e a n ) was recorded and then converted to growing degree units (GDU, °D). GDUs were calculated using the following equation: G D U = T m e a n T b ; where T b = 10   ° C , which is the base temperature or lower temperature limit of sorghum development [12]. GDUs were then summed for the growth period for each year in each location.
The sum of the daily soil water depletion, irrigation water applied, and rainfall during the growing seasons were determined to compute cumulative crop water use (mm). Water use efficiency (WUE) was calculated for each cultivar in both locations and both years using the following equation: W U E = D B / T E T c ; where D B is the dry biomass (g m−2) at harvest, and T E T c is the total crop evapotranspiration (mm) during each growing season.
Analysis of variance for the two experimental sites were performed as well as a combined analysis of variance across years using the SAS PROC GLM [13] for dry biomass productivity, water use efficiency, and irrigation water use efficiency on sorghum cultivars. For the analysis, the treatment was set as a fixed effect, and years were set as random effects. If treatment effects were significant, mean comparisons were carried out using the least significant difference (LSD) at an alpha level of 0.05.

2.4. Economic Analysis

The economic model proposed by Enciso, Jifon [14] was used to estimate the expected net returns associated with producing ethanol from the two sorghum cultivars in question under arid and semiarid environments. Namely, the net return of the ith feedstock in the jth environment is given by:
N R i j = σ Y i j P e C e T C i j ,
where σ is the ethanol conversion rate, Y i j is the biomass yield, P e is the price of ethanol, C e is the unit cost of producing ethanol, and T C i j is the total feedstock production cost. A hydrolysis conversion process was assumed in the analysis, and the ethanol conversion rate and unit cost of production used were based on the values reported in Enciso and Jifon [14]. Additionally, the 2018 nominal ethanol wholesale price [15] was used to estimate the potential revenues. Lastly, the average yield and corresponding production costs observed during the 2014 and 2015 growing seasons were calculated for each treatment. Production input costs were adjusted to reflect 2018 input prices. The total feedstock production cost included all variable and fixed costs plus the return to producers, which was set as 10% over variable and fixed production costs. Ethanol price, feedstock production, and ethanol conversion parameters are presented in Table 4.

3. Results

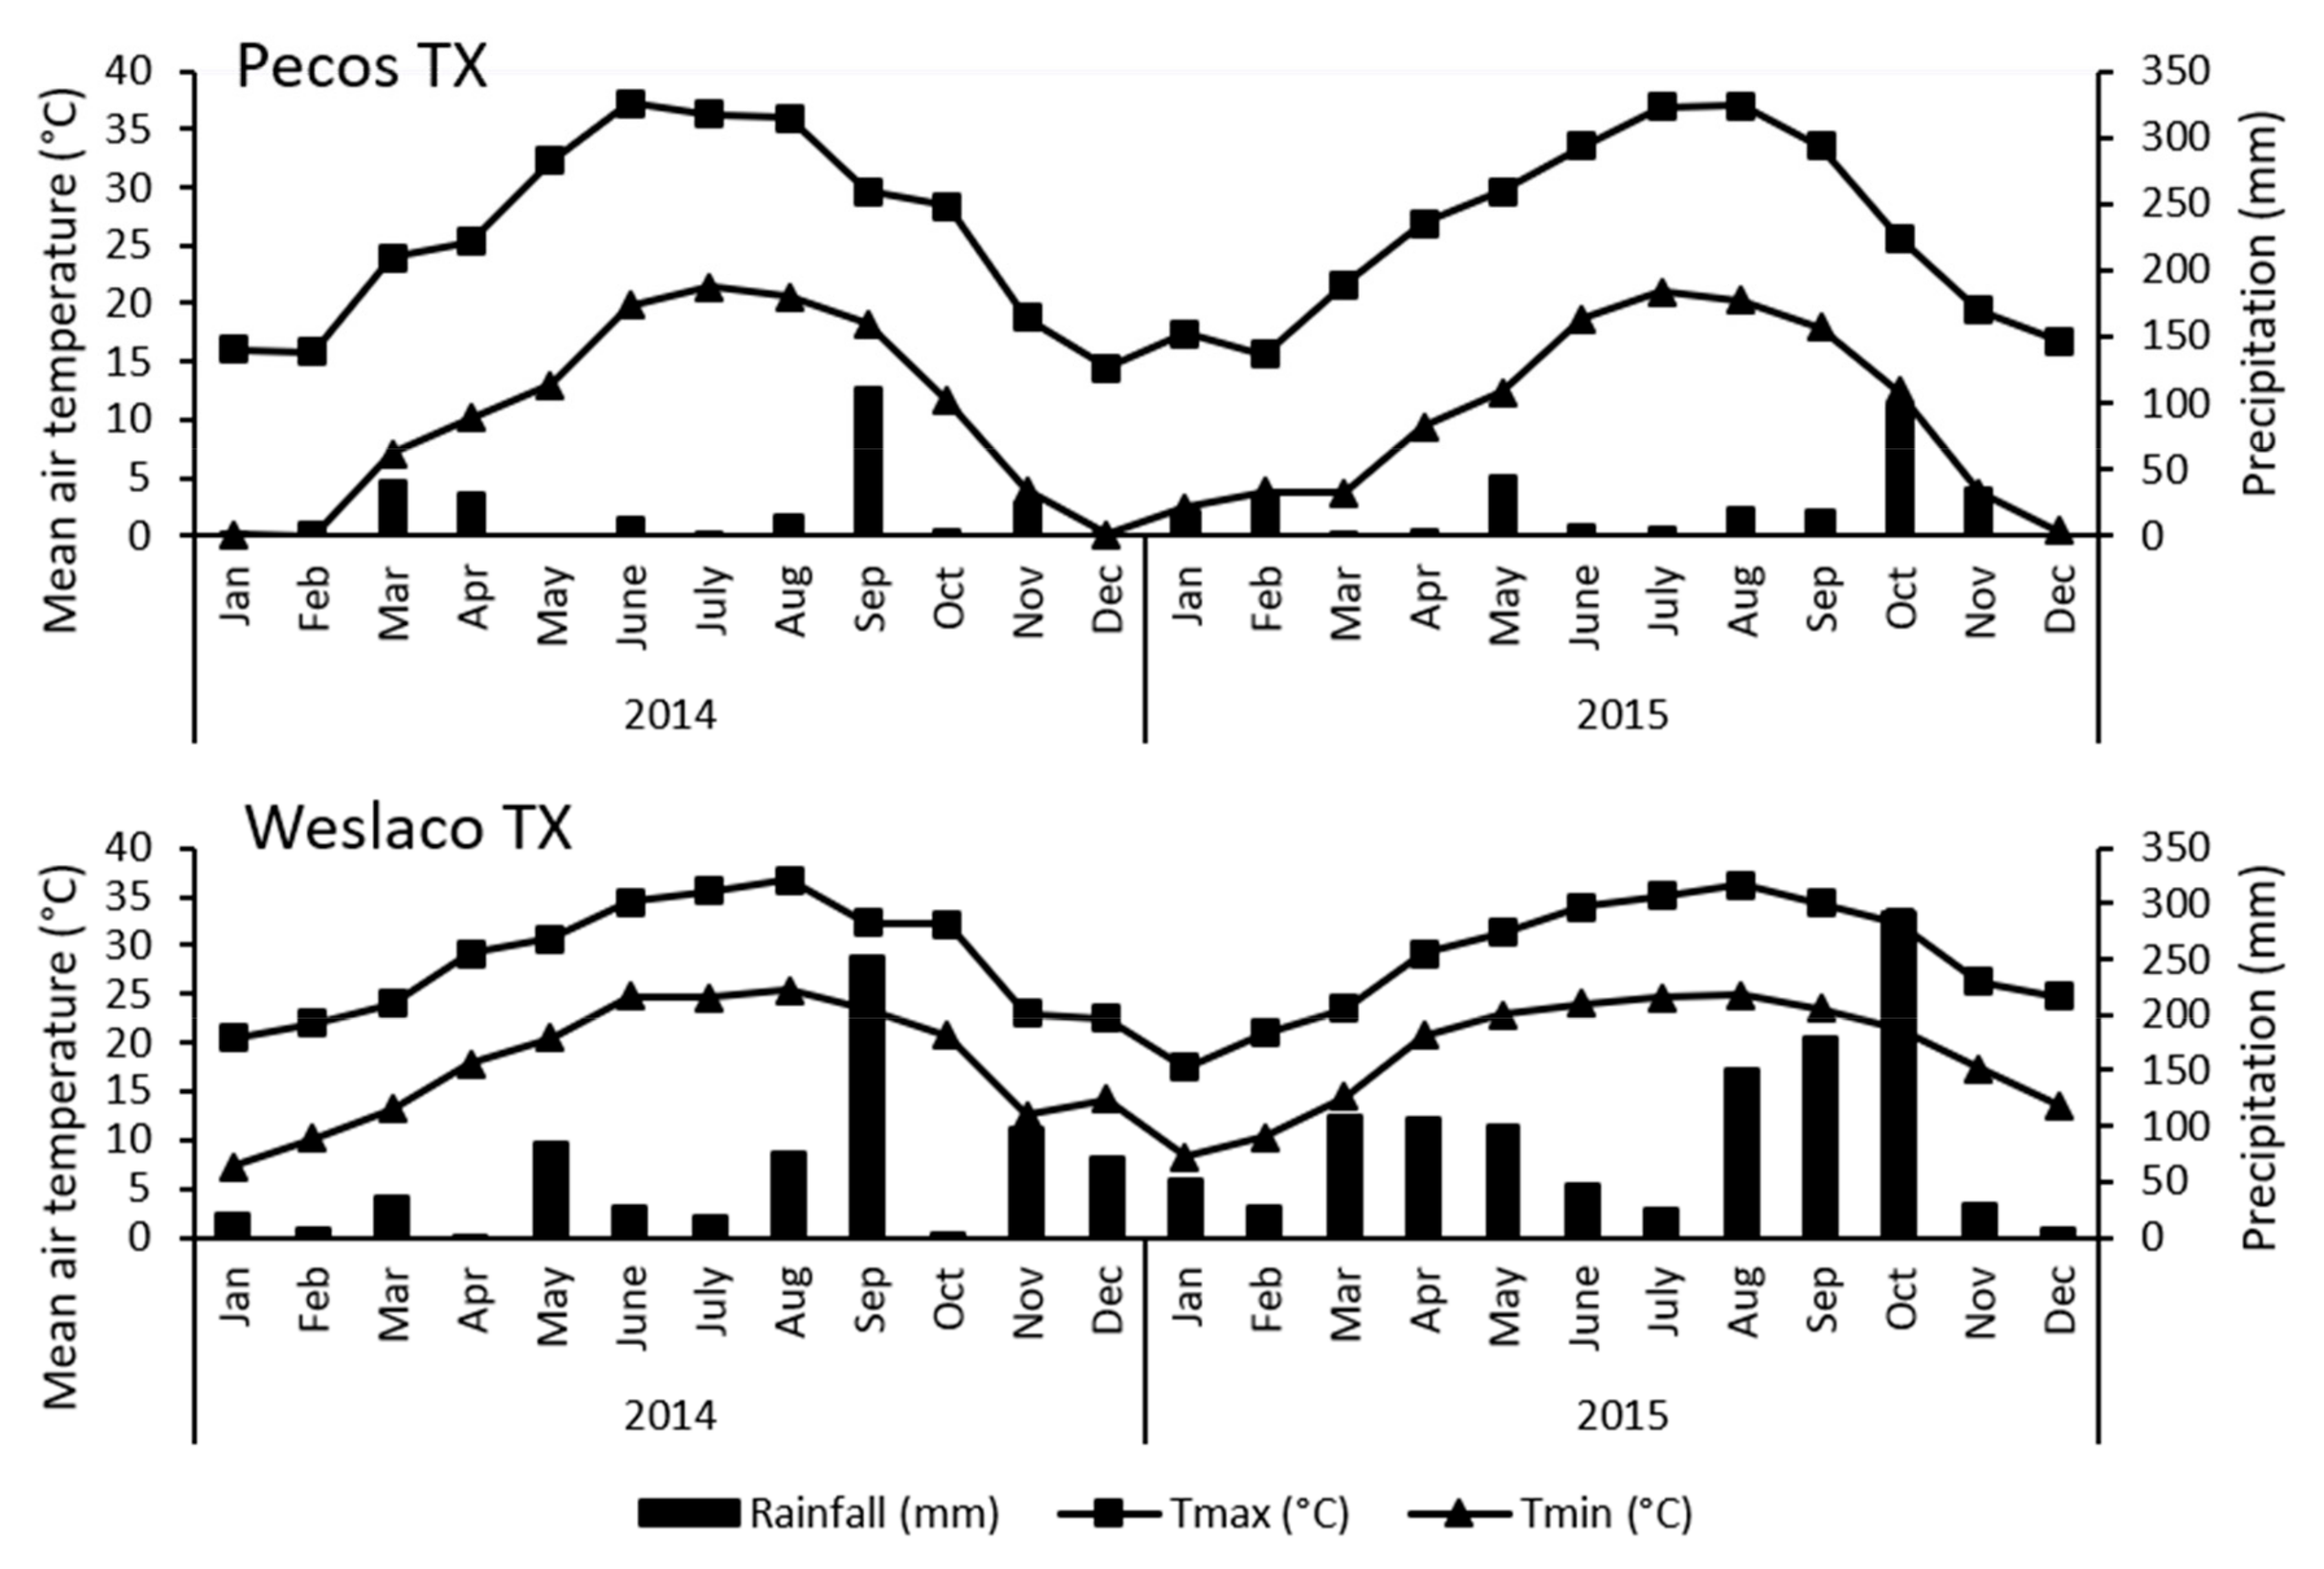
3.1. Environmental Conditions

The daily mean air temperature and total precipitation during the growing seasons in Pecos were 26.2 °C and 104 mm in 2014 and 27.9 °C and 46 mm in 2015. While in the experiments located in Weslaco, they were 27.7 °C and 148 mm in 2014 and 26.8 °C and 238 mm in 2015. The GDUs slightly varied through years and locations during the study period. In Pecos, the cumulative GDUs were 2063 °D and 1924 °D in 2014 and 2015, respectively, and in Weslaco they were 1897 °D and 1986 °D in 2014 and 2015, respectively. The lower daily mean air temperature and the low GDU observed in Weslaco in 2014 probably were due to the early sowing.

3.2. Sorghum Emergence
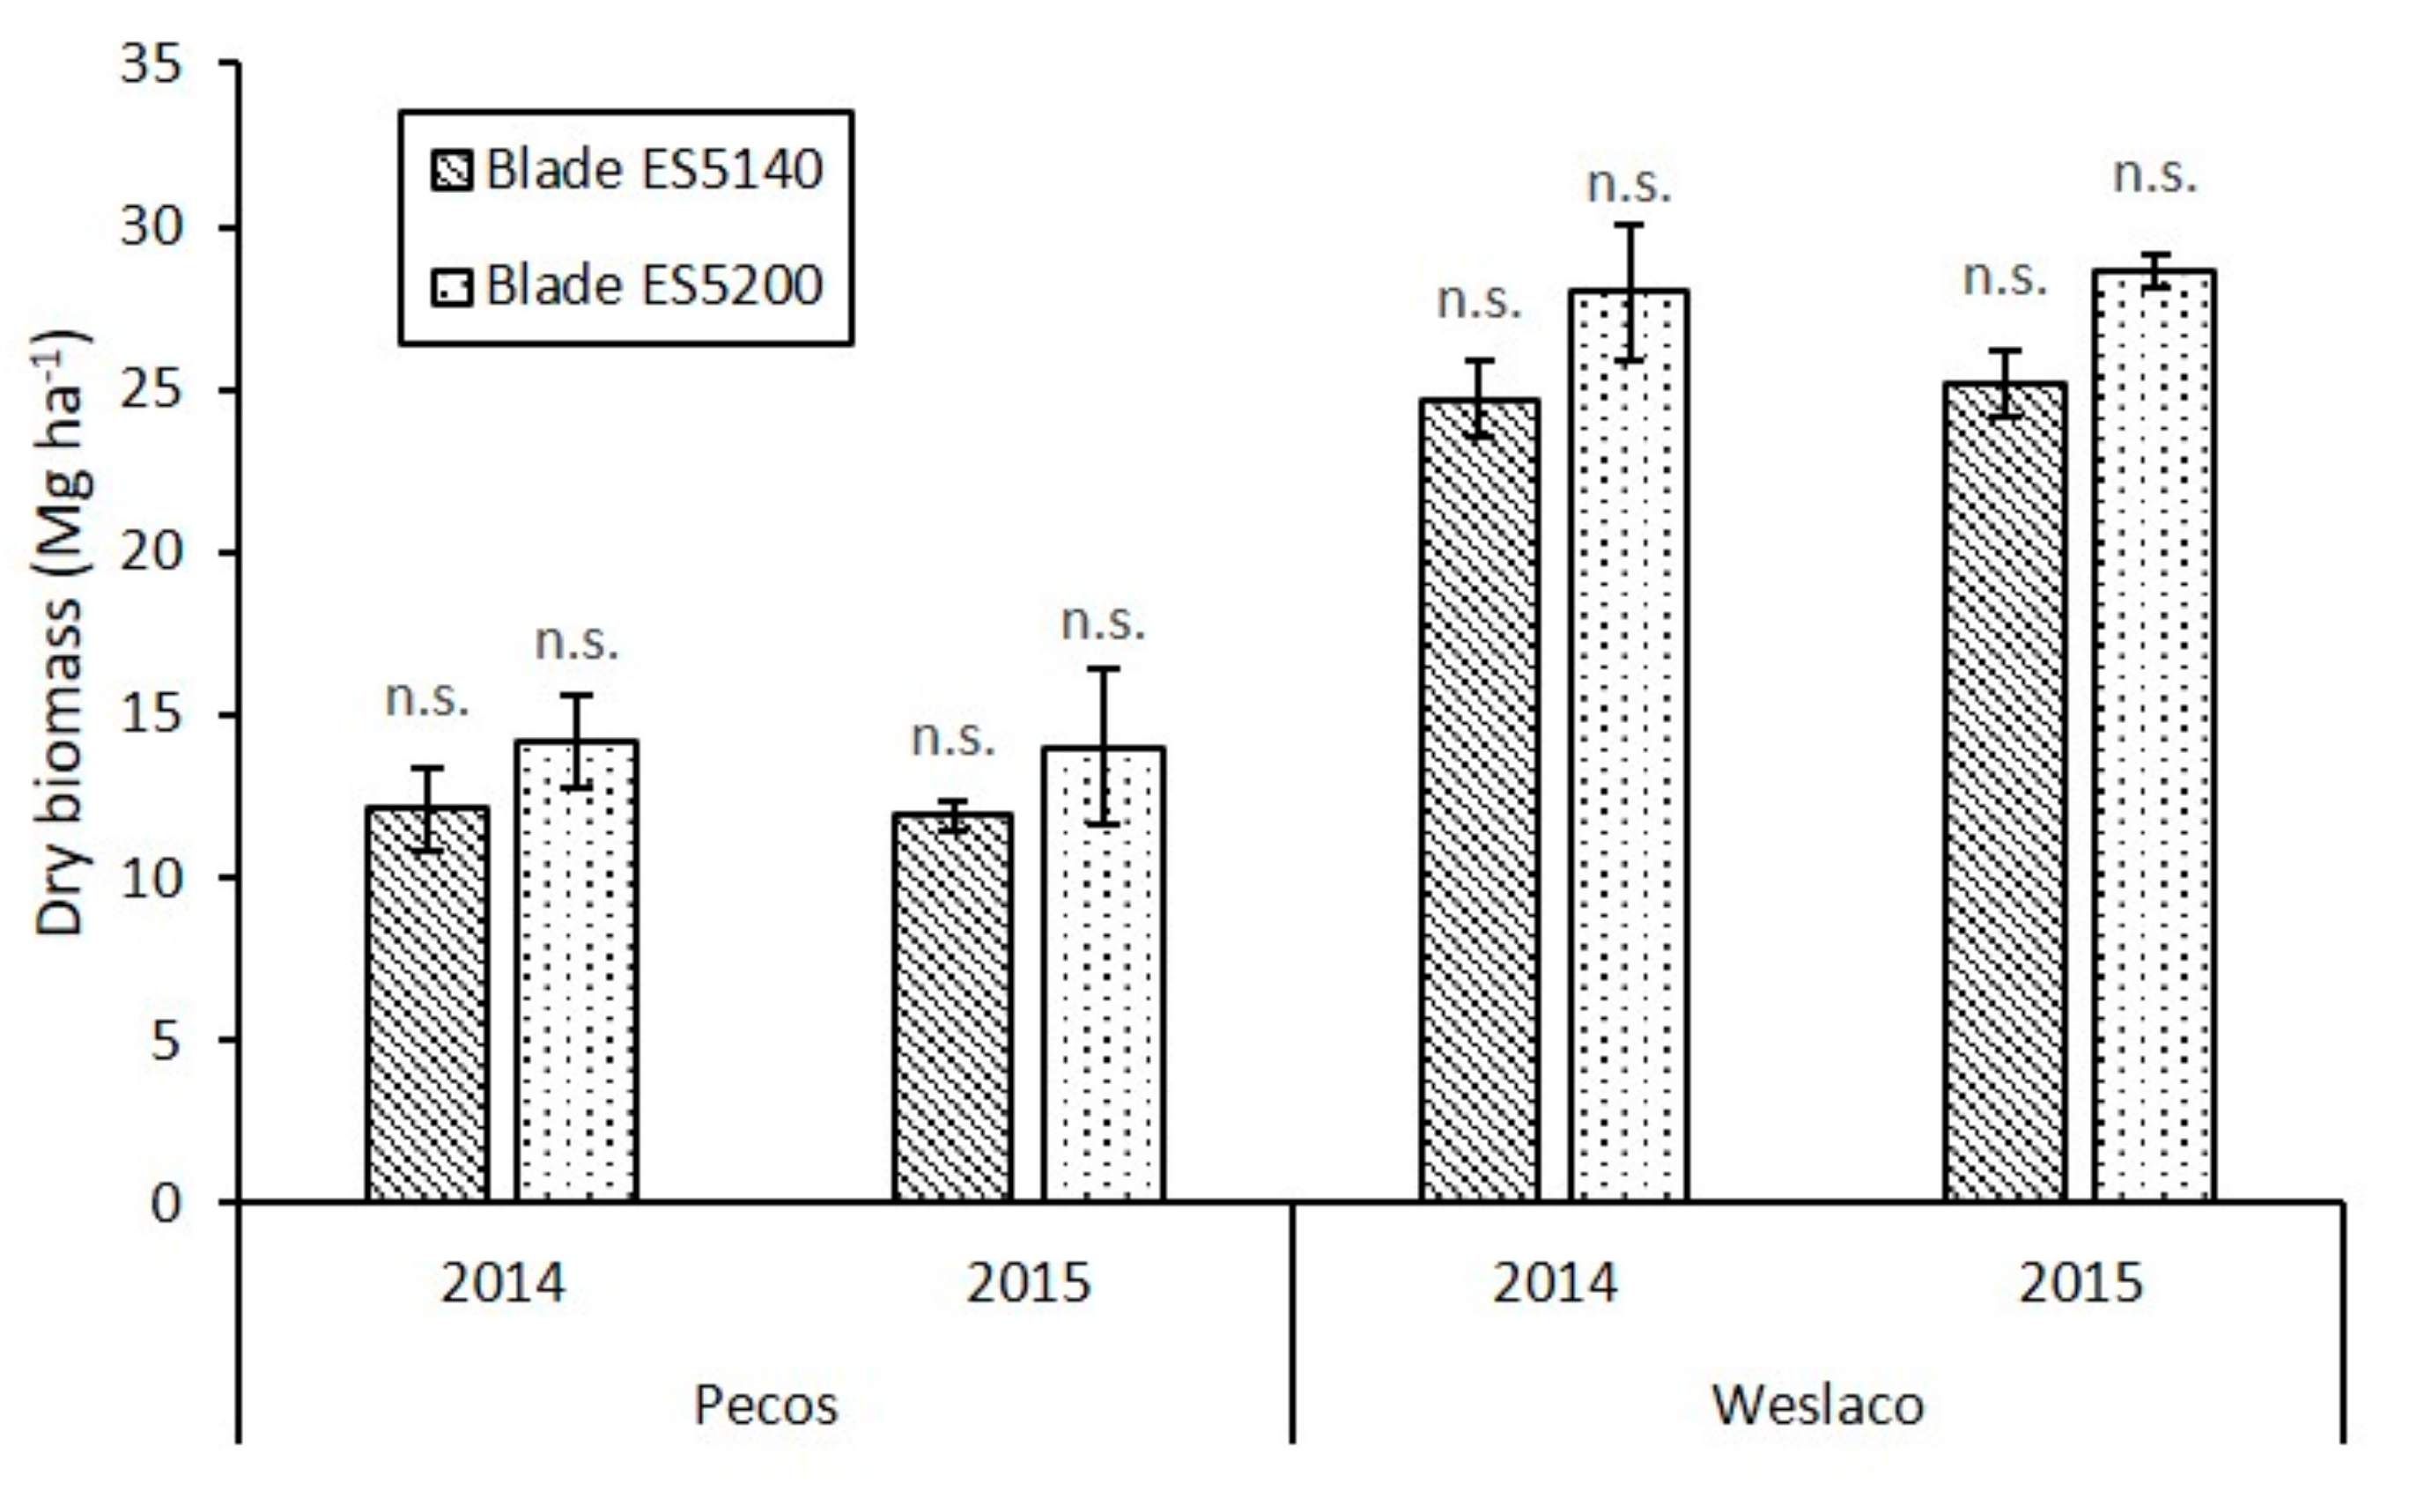
Sorghum emergence was affected by soil salinity in both cultivars. There was a numerical between locations in both years. However, there was not a significant difference between cultivars in each location. The average plant emergence in Pecos (irrigated with water of 6.4 dS m−1) was 41% lower than Weslaco (irrigated with water of 1.42 dS m−1). The overall plant emergences in Pecos were 63,906 and 65,006 plants ha−1 in 2014 and 2015, respectively, While the plant emergences in Weslaco were 108,516 and 110,765 plants ha−1 in 2014 and 2015, respectively.

3.3. Dry Biomass

The final dry biomass productivity at each growing season was obtained for each cultivar in both locations. Separate analysis of variance results for dry biomass productivity in Pecos and Weslaco showed no significant effect between cultivars (P > 0.05) in both growing seasons (Table 5). However, the combined analysis of variance showed that there was a significant difference in dry biomass between cultivars (P < 0.05), whereas the interactions between cultivar and year were not significantly different (P > 0.05). The averages of final dry biomass are reported in Figure 3. Dry biomass productivity response was statistically different between cultivars. Although, there was not an analysis of variance to compare both locations because the dry biomass values were numerically different.
The sorghum cultivars Blade ES 5140 and Blade ES 5200 reached maximum productivities of 25.2 and 28.7 Mg h−1, respectively. These final dry biomasses performed as expected and were comparable with yields obtained in similar conditions in previous studies [16].
The observed average dry biomass productivities in Weslaco for cultivar Blade ES 5140 were 24.7 and 25.2 Mg ha−1 in 2014 and 2015, respectively, whereas for cultivar Blade ES 5200 they were 28.0 and 28.7 Mg ha−1 in 2014 and 2015, respectively. Differences in dry biomass in each cultivar were not significantly different between years despite the limited rainfall observed in growing season 2014 (which was 40% less than that observed in the 2015 growing season), the fewer cumulative GDUs recorded in 2014, and the fewer days in the 2014 growing season with day lengths larger than 12:20 h. A faster accumulation of stem biomass over leaf biomass in both cultivars was observed during the study period. Thus, at the end of growing seasons, stem biomass comprised about 82% of the total biomass of the cultivar Blade ES 5140 and 84% of the cultivar Blade ES 5200. These results were similar to those reported by Olson and Ritter [17] that observed a stem biomass partition of 83%, whereas Meki and Ogoshi [18] reported a stem biomass partition of 73% of the total biomass. As expected for both cultivars, flowering was not observed in any of the growing seasons.
In contrast to the results obtained in Weslaco, average dry biomass productivity of both Blade ES 51400 and Blade ES 5200 were around 50% lower in Pecos, TX. In Pecos, the two cultivars did not perform as expected because of the saline environment. A higher salinity was observed in Pecos (4076 ppm of total dissolved salts) compared to those reported in Weslaco (913 ppm of total dissolved salts). Additionally, the SAR was also higher in Pecos (19.2) compared to that in Weslaco (3.6). The dry biomass variability observed (Figure 3) may be attributed to differences in soil properties and salinity among plots considering that we only sampled for dry biomass in area of 4 m2 at harvest. Cultivars Blade ES 5140 and Blade ES 5200 reached an average dry biomass productivity of 12.0 and 14.1 Mg ha−1, respectively.

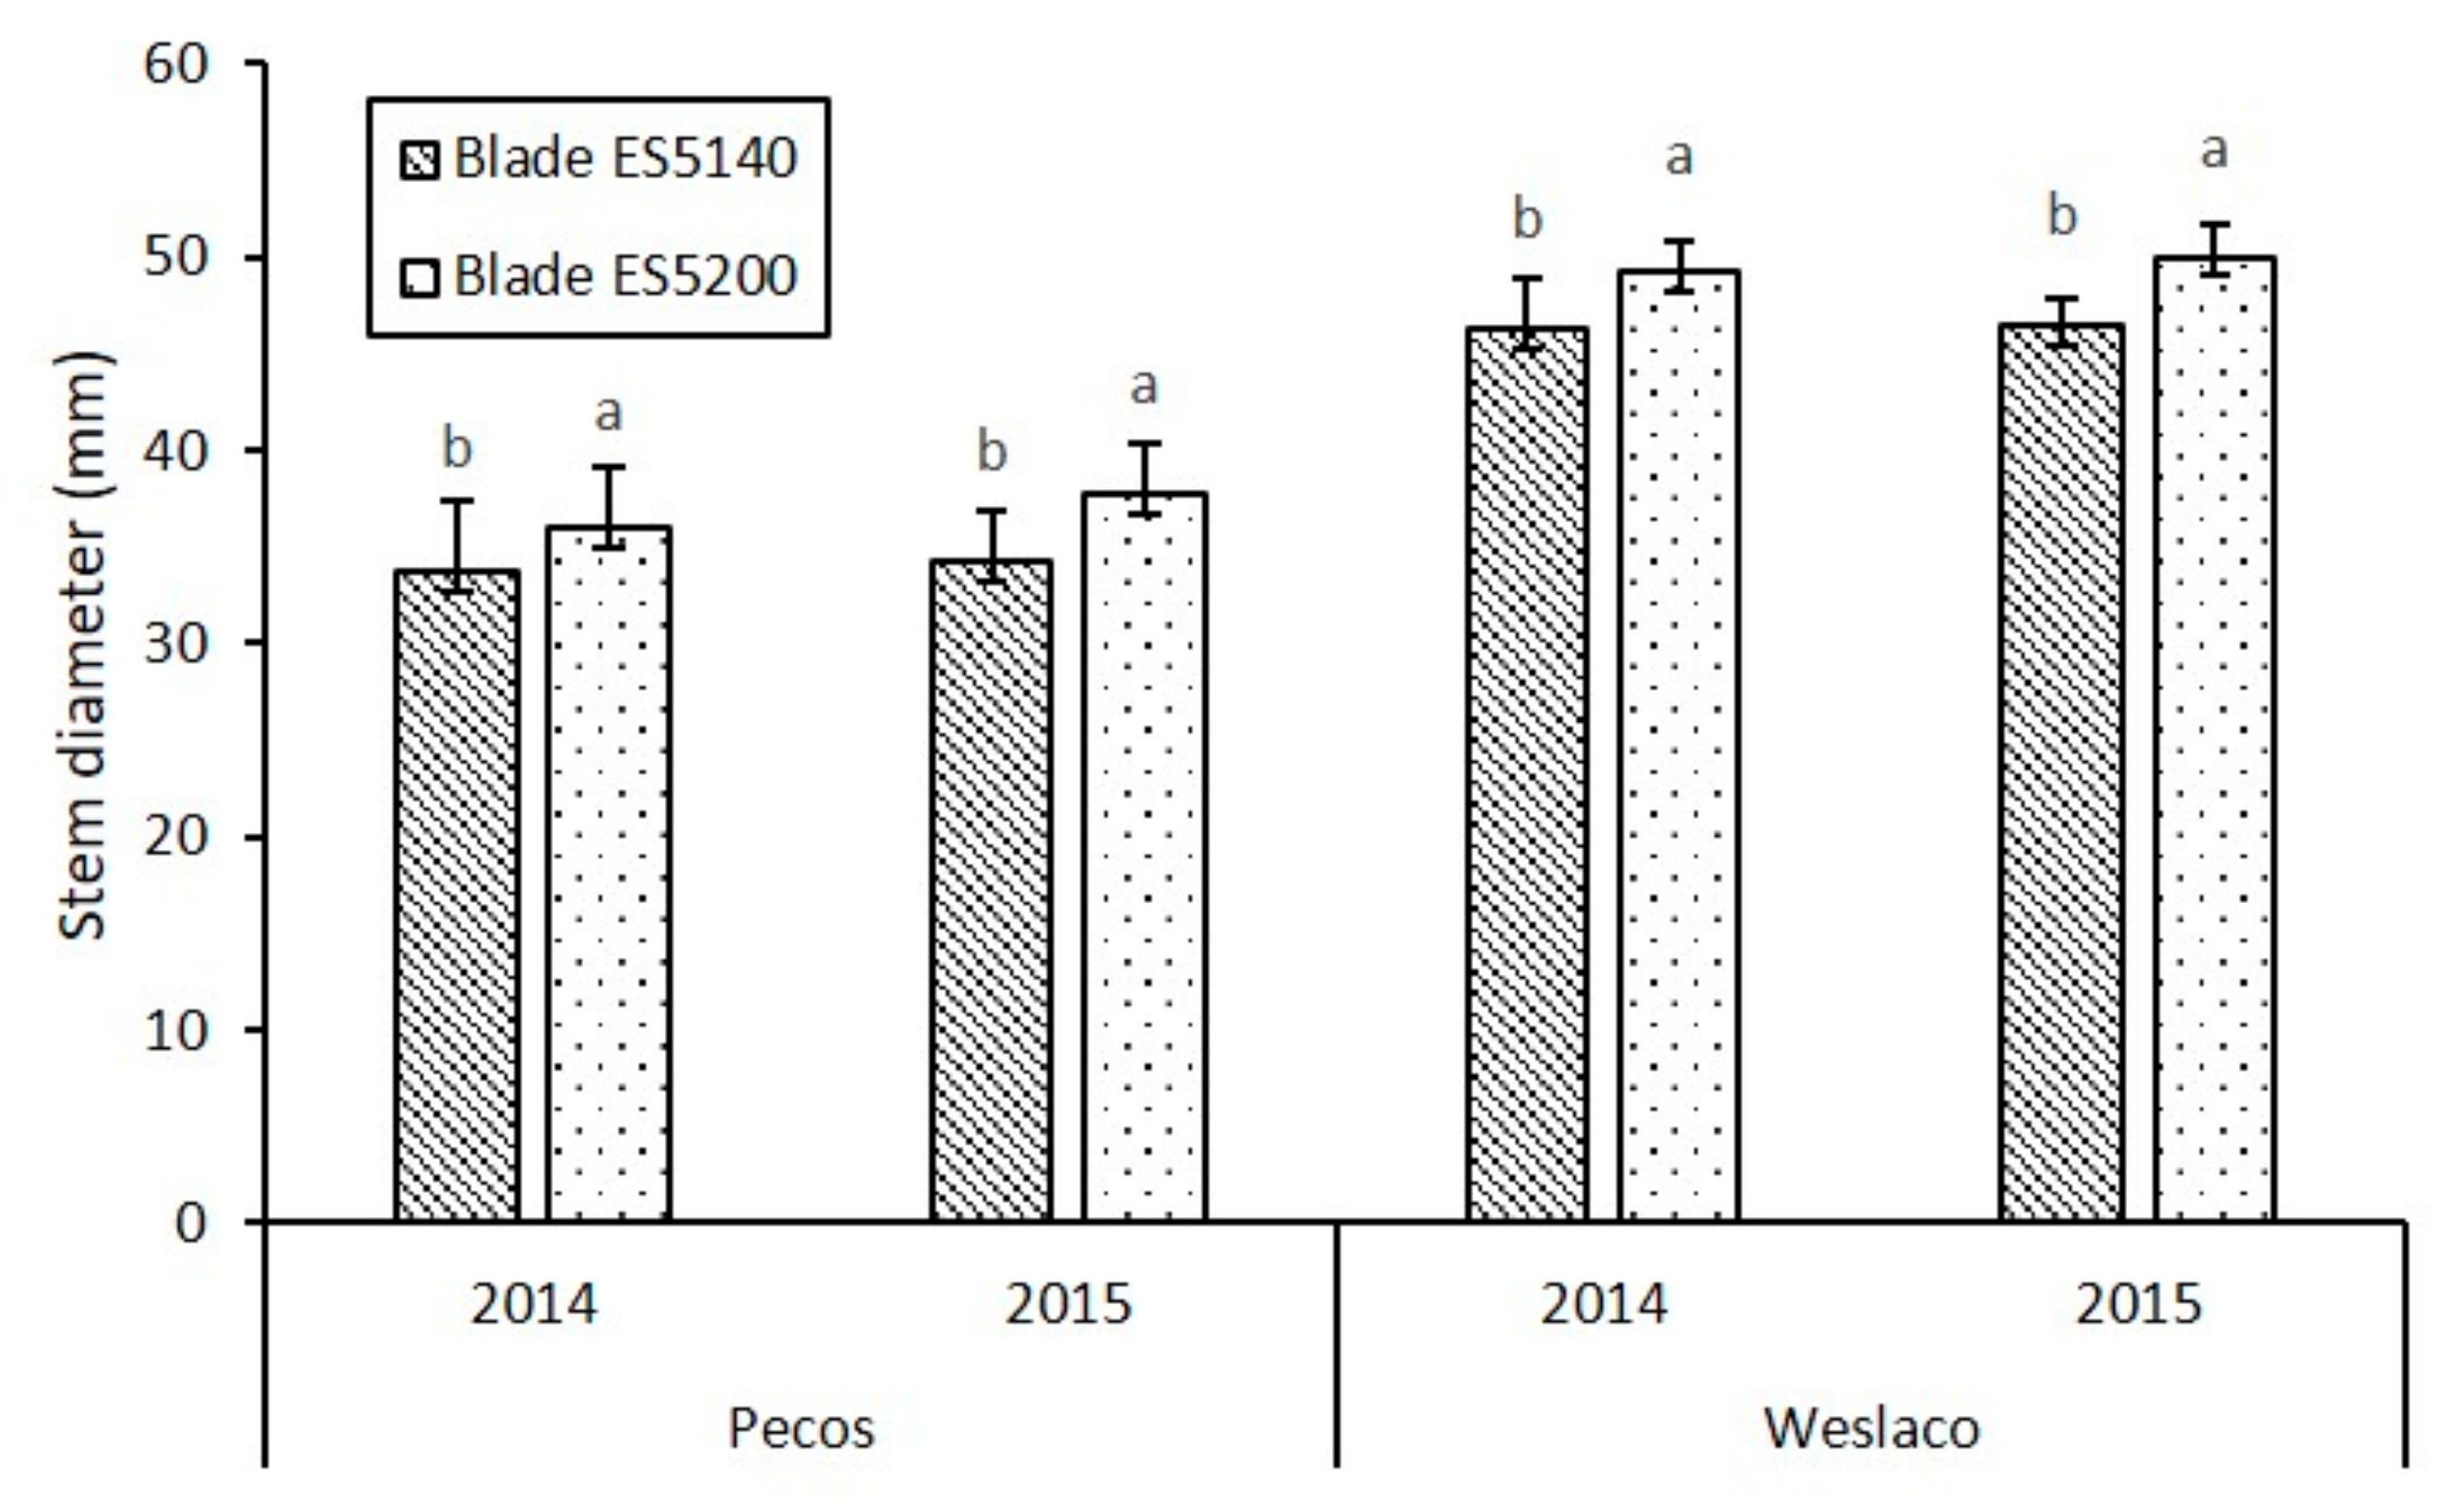
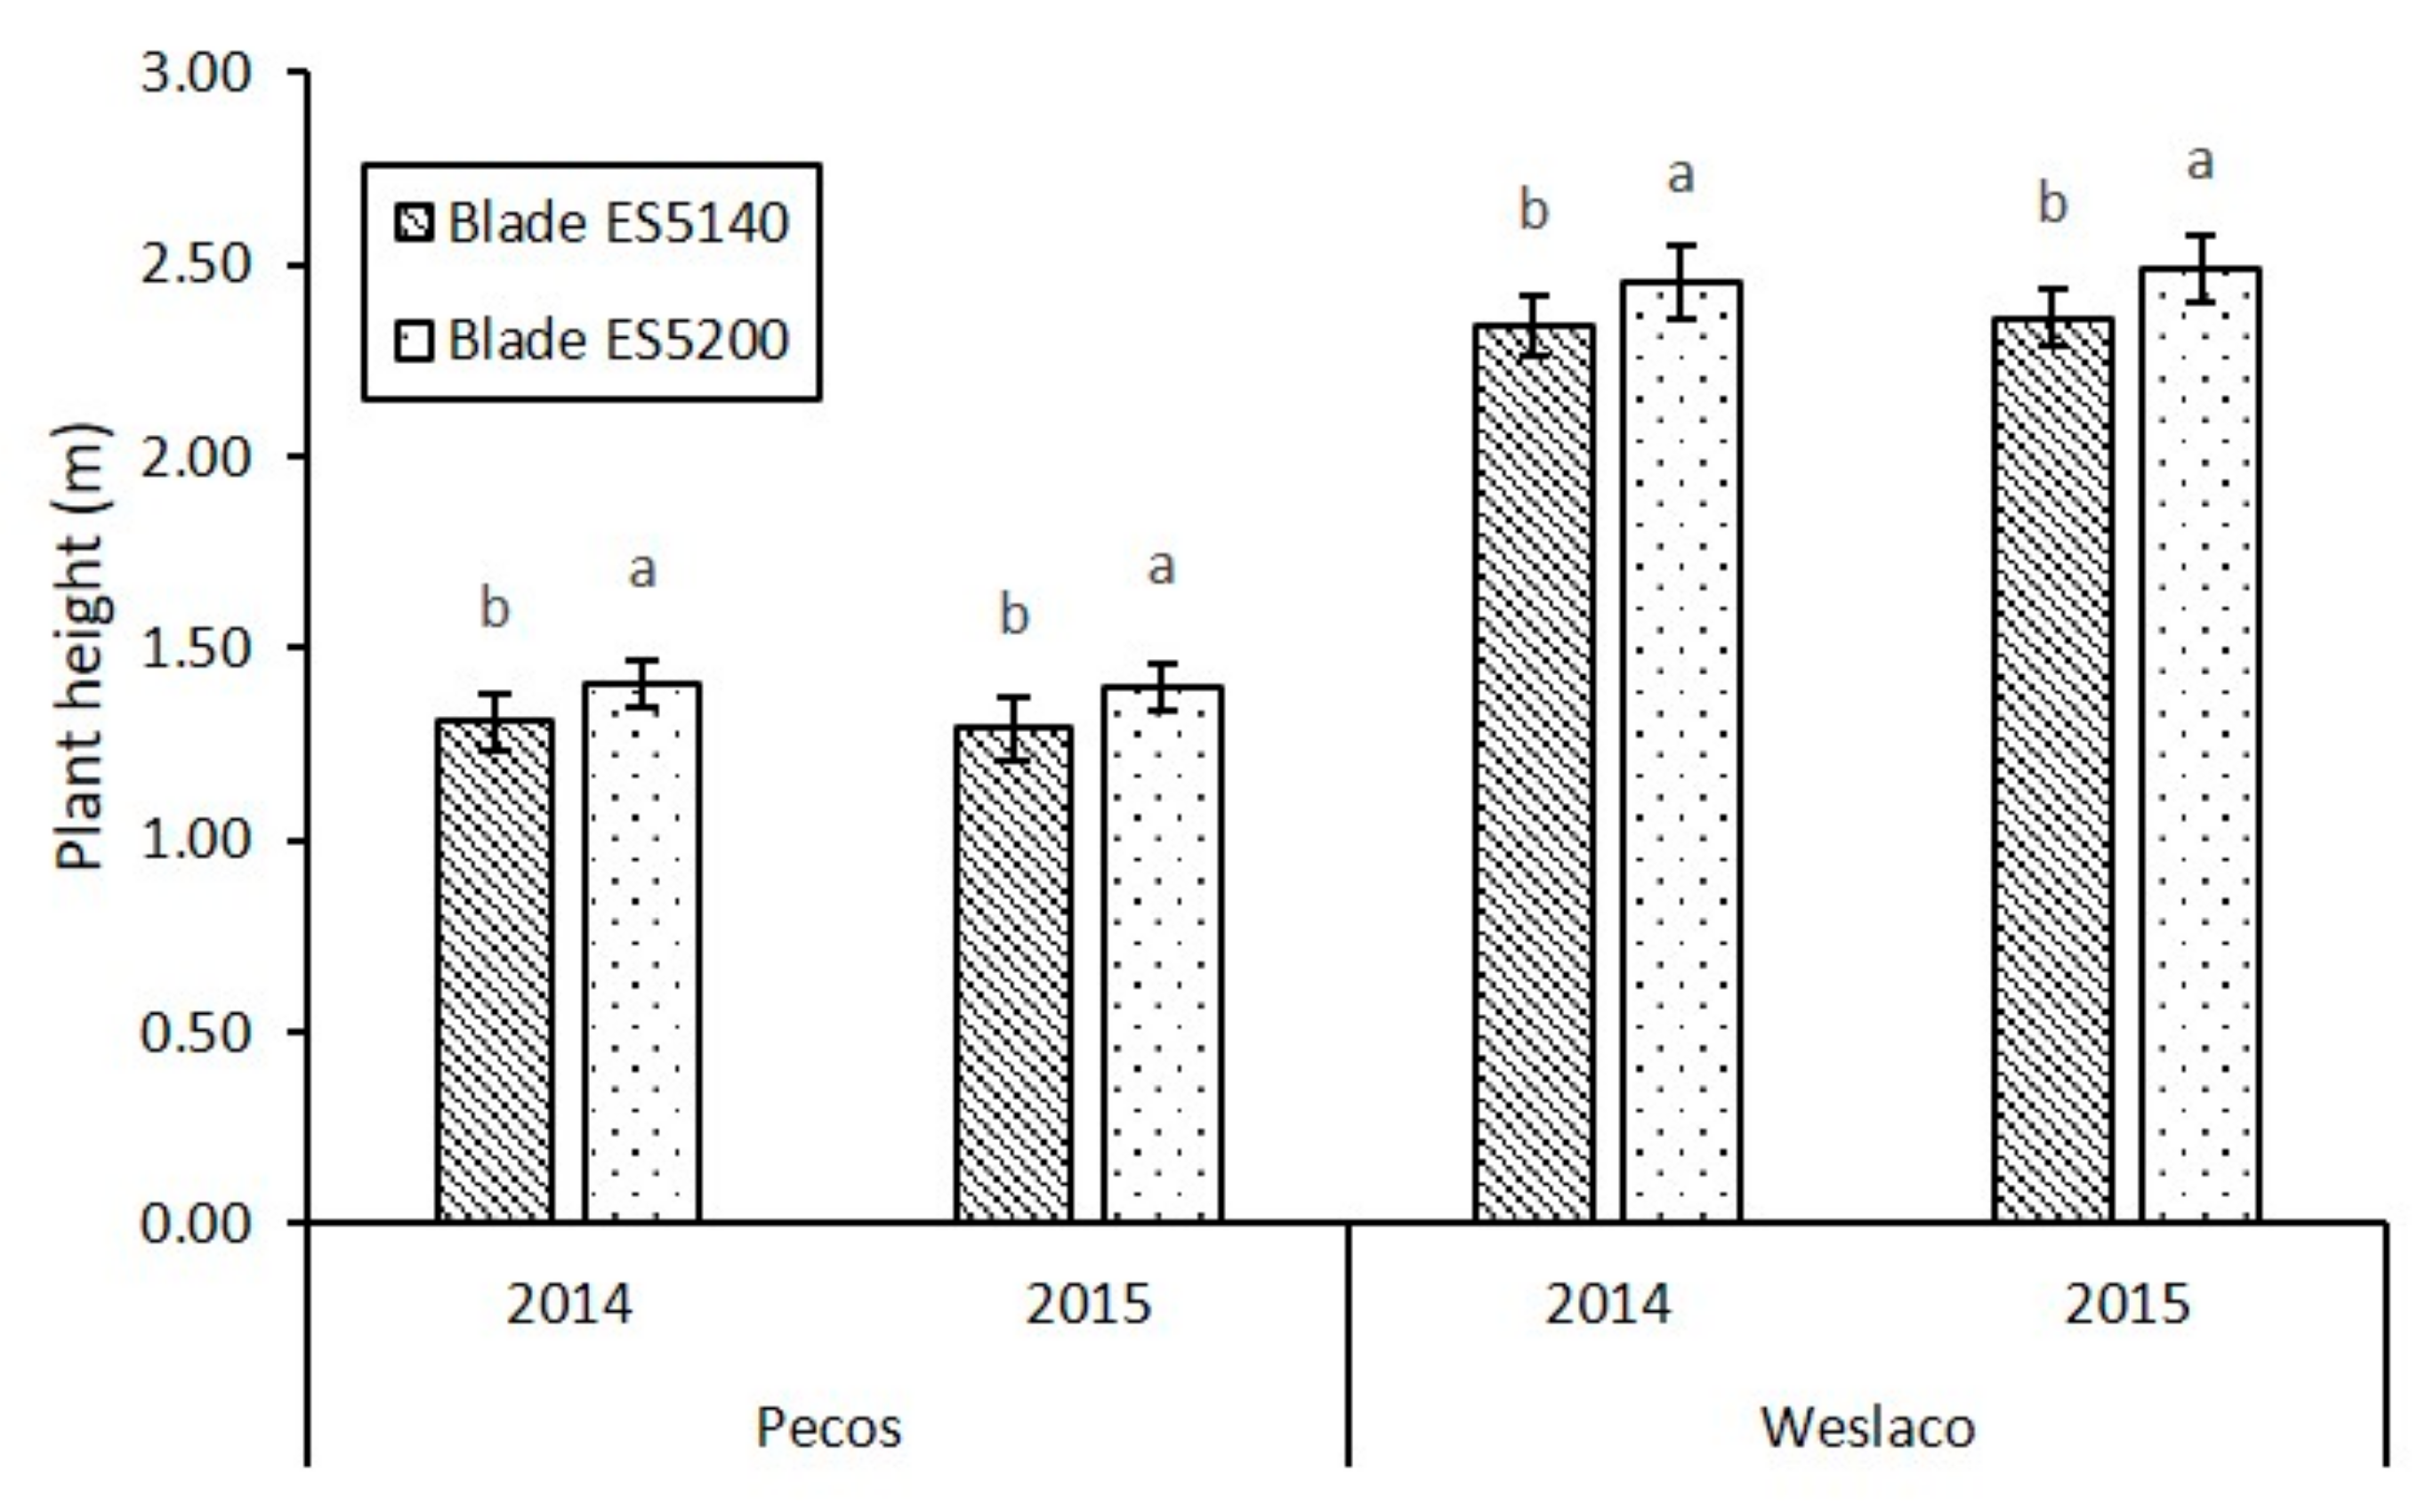
3.4. Stem Diameter and Height of the Plant

Averages in stem diameter and height at harvest time at both experimental sites are presented in Figure 4 and Figure 5. Significant differences (P < 0.05) were observed in both stem diameter and plant height between Blade ES 5140 and Blade ES 5200 across harvest dates in both growing seasons, 2014 and 2015 (Table 5), and in both locations.
At the Weslaco site, stem diameters ranged from 40 to 54 mm in both cultivars at harvest. The stem diameters were 46 mm for the Blade ES 5140 and 49 mm for the Blade ES 5200 in 2014. Similar diameter thicknesses were observed in 2015, with diameter thicknesses of 47 and 50 mm for the Blade ES 5140 and Blade ES 5200, respectively. In contrast to Weslaco, stem diameters observed in Pecos ranged from 26 to 45 mm in both cultivars at harvest. Average stem diameters were 34 mm for Blade ES 5140 and 36 mm for Blade ES 5200 in 2014, whereas in 2015 Blade ES 5140 was 34 mm and Blade ES 5200 was 38 mm.
Plant heights at the end of both growing seasons were influenced by both sowing date and soil conditions in both experimental locations. The average heights observed in Weslaco in 2014 were 2.34 m for the Blade ES 5140 and 2.45 m for Blade ES 5200, whereas in 2015 they were 2.36 m for Blade ES 5140 and 2.49 m for Blade ES 5200. On the other hand, Pecos presented lower plant heights than those observed at Weslaco. Blade ES 5140 showed average plant heights of 1.31 and 1.29 m in 2014 and 2015, respectively, whereas Blade ES 5200 showed 1.41 and 1.40 m in 2014 and 2015, respectively.

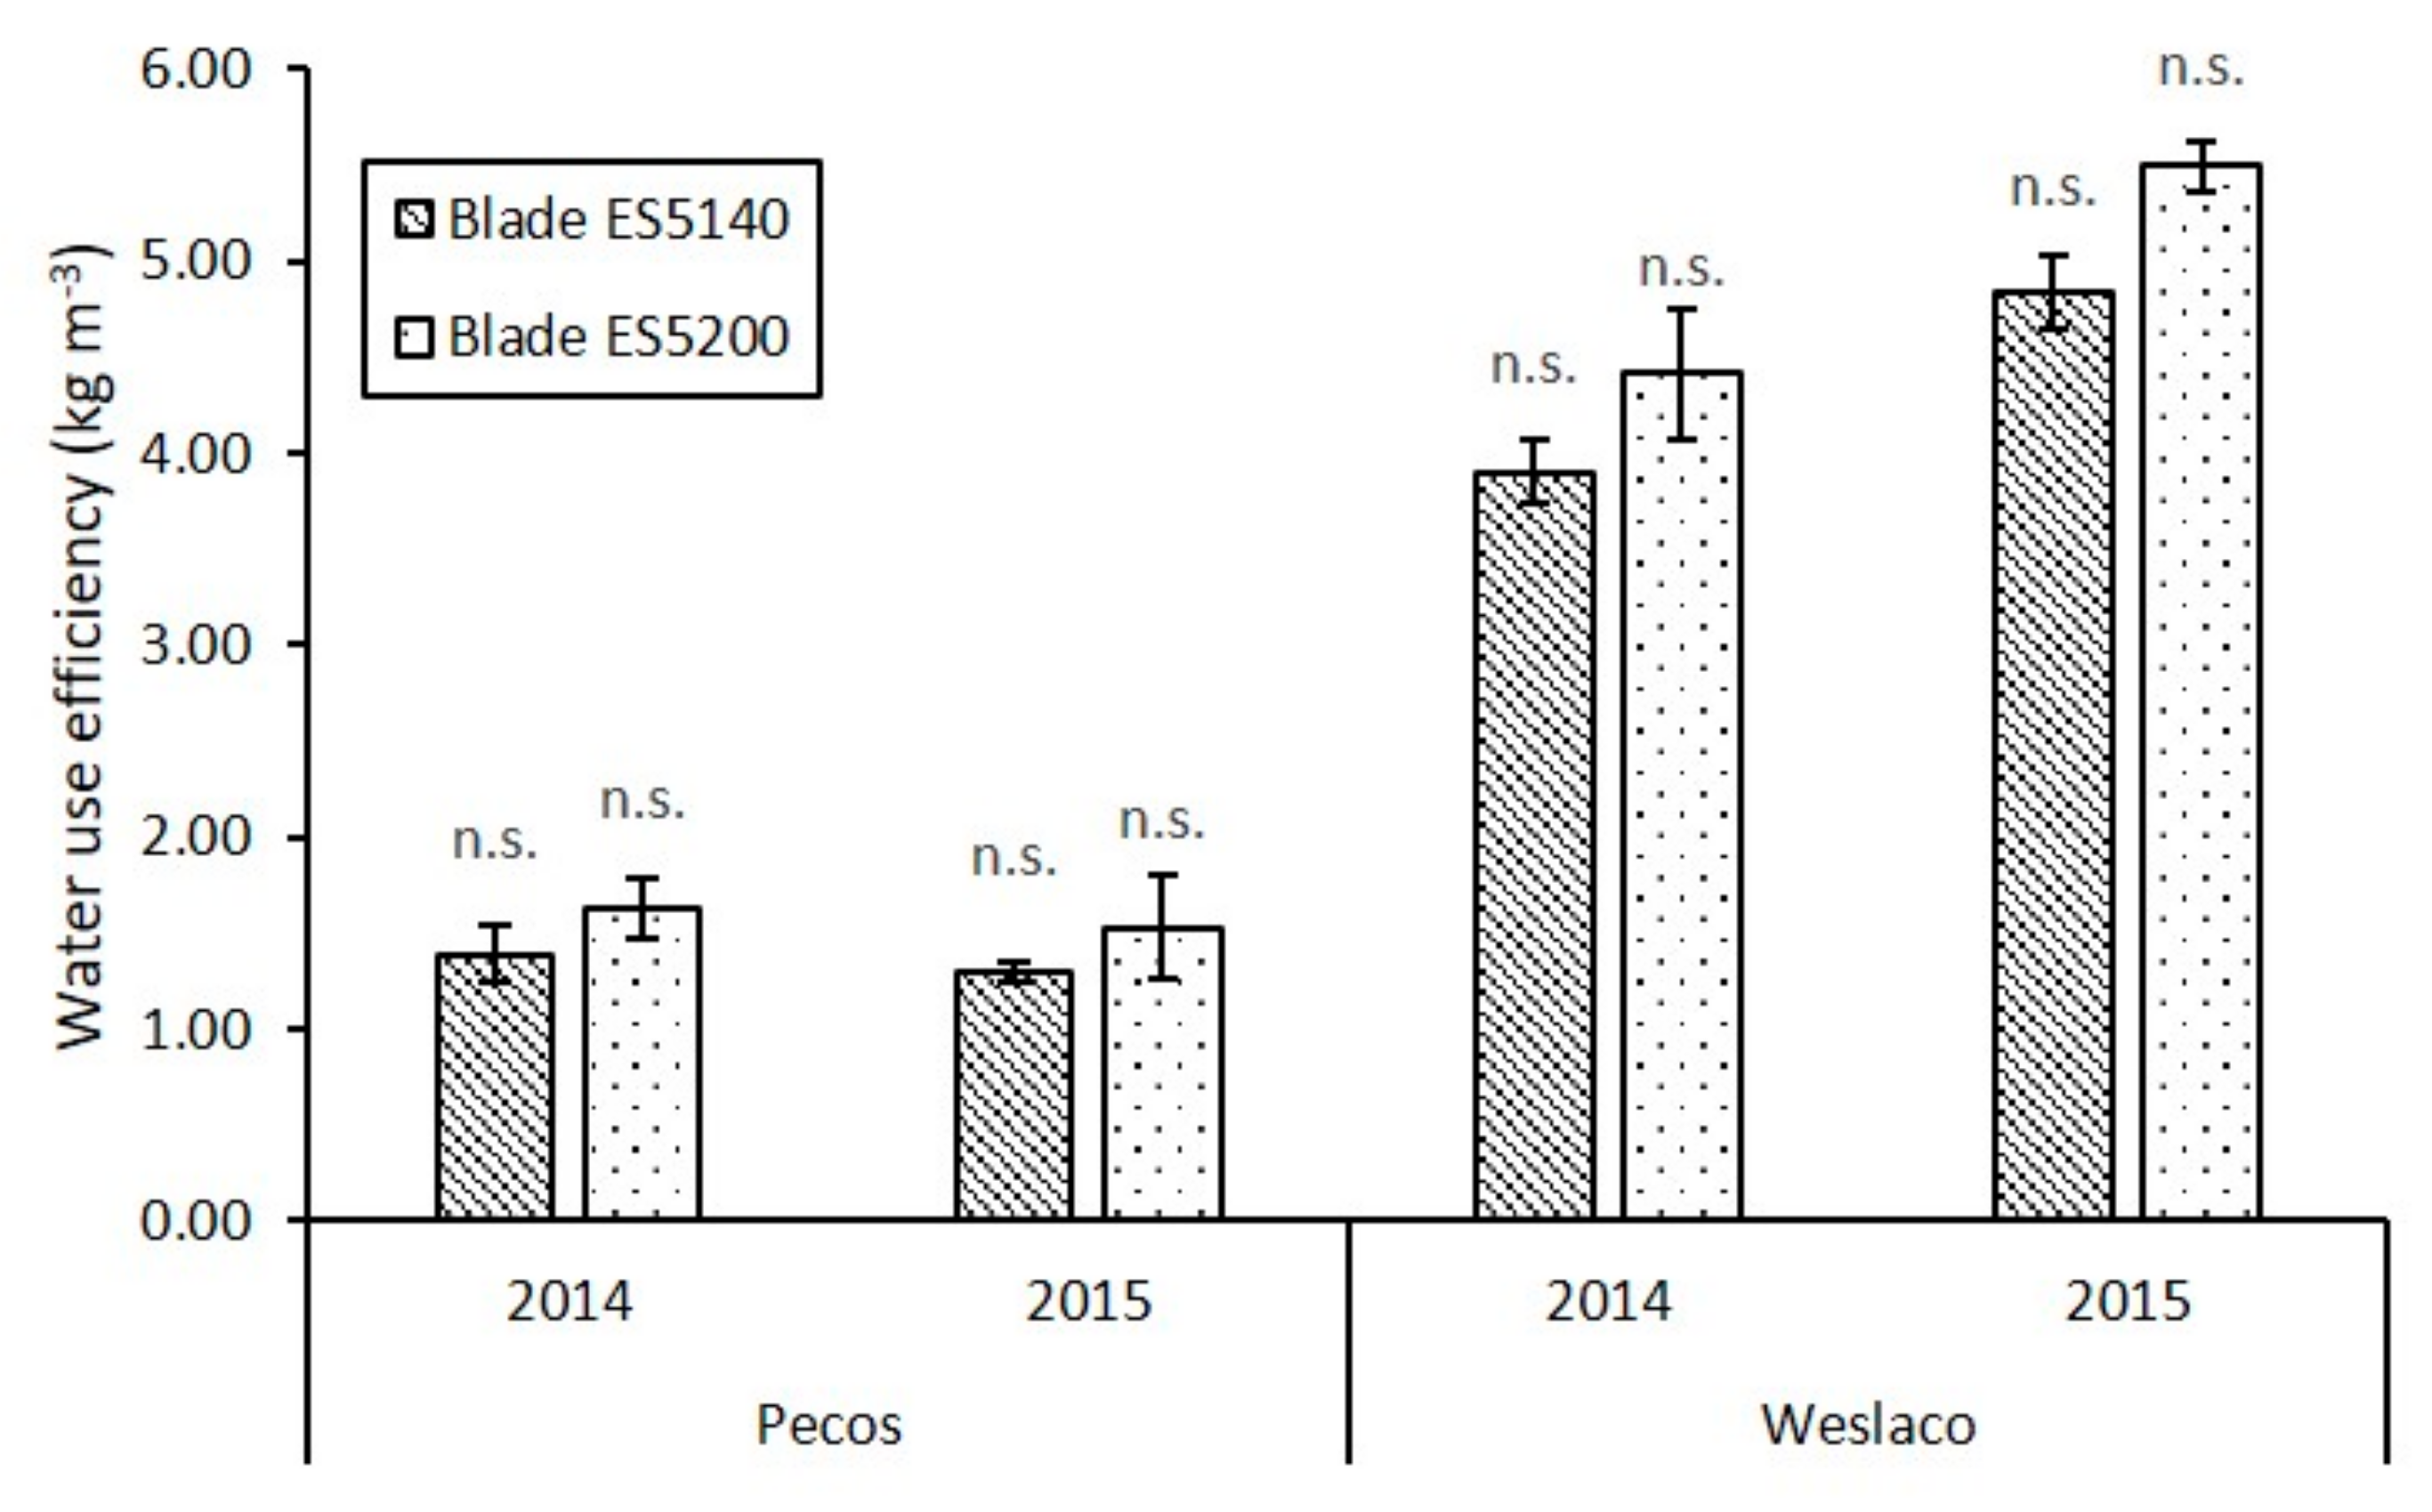
3.5. Water Use Efficiency

The dry biomass productivity at the end of each growing season and the sum of the daily crop evapotranspiration were used to determine the water use efficiency (WUE) for each cultivar in both locations. A separate analysis of variance for WUE showed no significant effect (P > 0.05) between cultivars, neither Pecos nor Weslaco, in both growing seasons (Table 5). However, a combined analysis of variance (cultivar × year) showed that there was a significant difference in WUE between cultivars (P = 0.014) in Pecos, and the interaction (cultivar × year) was not significant (P > 0.05), whereas in Weslaco the sources of variations were not significantly different (P > 0.05). The average WUE is reported in Figure 6. WUE response was statistically equal between cultivars but different between locations.
At the Weslaco site, WUE ranged from 3.49 to 5.87 kg m−3 in both cultivars (Figure 6). The cultivar Blade ES 5200 obtained the highest average WUE values, 4.42 and 5.50 kg m−3 in 2014 and 2015, respectively, whereas Blade ES 5140 obtained 3.90 and 4.83 kg m−3 in 2014 and 2015, respectively. In contrast to Weslaco, Pecos observed lower values of WUE. At Pecos, values of WUE ranged from 0.81 to 2.07 kg m−3 in both cultivars. The cultivar Blade ES 5200 obtained the highest average values of WUE, 1.63 and 1.53 kg m−3 in 2014 and 2015, respectively, whereas Blade ES 5140 obtained 1.39 and 1.30 kg m−3 in 2014 and 2015, respectively.

3.6. Soil and Water Chemistry

At the Weslaco site, the sorghum evapotranspiration (ETc) were 633 mm in 2014 and 545 mm in 2015, whereas at Pecos, the total ETs for the sorghum crop were 871 and 910 mm in 2014 and 2015, respectively. At Weslaco, a higher ET was observed in 2014 probably because the sorghum was grown eight days longer, resulting in more water use by the crop. Additionally, 2014 was a warmer year than 2015.
The total water applied for the Pecos Experiment was 1067 mm in seven irrigation applications. More irrigation water was applied at Pecos following local recommendations to leach salts and avoid crusting of the soil, which could impede germination. At the Weslaco Research station, the irrigation applied was 248 mm in 2014 and 304 mm in 2015 in three irrigations events. Less irrigation was applied in Weslaco because more precipitation was received during the growing season. Pecos has a dryer environment than Weslaco, and less rainfall was received.
The soil properties at the beginning and end of the experiment for both locations are presented in Table 6. The soil properties did not change in Weslaco. The soil presented very low salinity and sodicity in Weslaco. However, the Pecos station presented high salinity of the soil and sodicity at the beginning of the experiment. The salinity and sodicity were reduced probably because there were very heavy rains before planting in 2015. The heavy rains could have leached some salts, and this may be the reason for the lower salinity at the end of the experiment. The Pecos station also has a high calcium content, which may help to reduce some sodicity. Although, the sodicity in Pecos was high at the beginning and end of the experiments. Additionally, seven irrigation events were applied during the season to keep a lower balance of salts in the soil.

3.7. Economic Analysis Results

Empirical results suggest that, under arid and semiarid environments in South Texas and current ethanol prices, it is not economically feasible to produce ethanol from neither sorghum cultivar Blade ES 5140 nor Blade ES 5200. Expected net returns are shown in Table 7. Namely, average net returns of −1058 USD ha−1 for Blade ES 5140 and −1131 USD ha−1 for Blade ES 5200 were estimated under the arid conditions of Pecos. These compared to net returns of −1103 USD ha−1 and −1156 USD ha−1 for the Blade ES 5140 and Blade ES 5200 cultivars in the semiarid environment of Weslaco, respectively. In addition to yields, different cost structures were observed in both sites. Particularly, higher variable production costs were estimated in Weslaco mainly due to additional harvesting and hauling expenses compared to Pecos. On the other hand, higher irrigation costs were incurred in Pecos, where an average of seven irrigations were conducted compared to four irrigations executed in Weslaco. Moreover, in Pecos the irrigation cost was influenced by the pumping cost, which depended on the electricity cost (i.e., 0.094 USD kw-hr−1), and the pumping depth, which was approximately 85.3 m deep. Also, using ground water generated additional repair and maintenance costs, machinery depreciation, and equipment investment. In Weslaco, surface water was used, and the water price scheme consisted of an initial flat rate of 34.6 USD ha−1 and 29.6 USD ha−1 per irrigation.
A break-even analysis was conducted to identify the minimum ethanol price needed to cover all feedstock and production processes (Table 7). Under observed biomass productivity and considered biofuel production technologies, break-even results indicated that considerably higher ethanol prices were needed in Pecos compared to Weslaco. Specifically, ethanol prices ranging between 0.67 USD L1 and 0.70 USD L1 are required to generate non-negative net returns in the Pecos site compared to the counterpart prices of 0.53 USD L1 and 0.56 USD L1 needed in Weslaco. The break-even prices suggested for Pecos and Weslaco are higher and lower than the 2014 ethanol price reported by Enciso and Jifon [14], respectively. Thus, favorable energy market conditions have existed in the recent past that support the production of ethanol from energy sorghum under semiarid environments.

4. Discussion

The difference of dry biomass productivity between locations was the main cause for the combination of soil conditions and the quality of irrigation water in addition to the distribution of precipitation, which was more evenly distributed in Weslaco than Pecos. In Pecos, during 2014, most of the rainfall was received by the end of the growing season during the months of September and October, while in Weslaco the rainfall pattern allowed to supplement irrigation and relief crop water stress. Similarly, in 2015, most of the rainfall was received at the end of the season in Pecos, while in Weslaco almost twice as much rainfall was received, and it was also evenly distributed during the growing season.
The dry biomass productivities obtained at the Weslaco site are comparable to those reported by Chavez and Enciso [16], in which the energy sorghum was grown under similar conditions. They obtained productivities that ranged from 26.57 to 28.05 Mg ha−1, which is similar to the ones observed by Rocateli and Raper [19], who reported dry biomass yields of 26.0 to 31.6 Mg ha−1 in a study conducted in the southeastern US, and the dry biomass reported by Palumbo and Vonella [20], who reported 20.9 to 26.4 Mg ha−1 in a Mediterranean environment. However, the dry biomass productivities obtained at the Pecos location were lower than most of the productivities reported in literature. In a similar arid environment, Ganjegunte and Ulery [21] conducted a study to evaluate the dry biomass productivity of an energy sorghum cultivar irrigated with both urban wastewater with an electrical conductivity of the irrigation water (ECw) of 2.5 dS m−1 and fresh water with an ECw of 1.3 dS m−1. They reported productivities ranging from 18.24 to 33.19 Mg ha−1. They concluded that bioenergy sorghum is highly tolerant to elevated salinity. In a similar study, Almodares and Hadi [22] evaluated the stem biomass productivities of sweet sorghum under different levels of saline water. They observed yields of 54.07 Mg ha−1 (wet basis) at 2 dS m−1 and 50.65 Mg ha−1 at 12 dS m−1.
In Figure 3, it can be observed that the dry biomass productivity in Pecos was lower than the one in Weslaco. This point is explained by the adverse soil conditions and the high saline concentration of the irrigated water, since the salt in the soil solution reduces leaf growth and, to a lesser extent, root growth, and it decreases stomatal conductance and, thereby, photosynthesis [23]. The average yield in Pecos was 13.05 Mg ha−1 and in Weslaco 26.63 Mg ha−1 for the two cultivars during the two years of the study. The average dry biomass yield in Pecos was approximately 51% lower than the Weslaco biomass. Biomass accumulation varies among growing seasons and locations basically because of changes in weather conditions. The energy sorghum is very sensitive to the photoperiod, and it should be sown on dates with optimal temperatures and also that exceed the photoperiod trigger of 12 h 20 min, otherwise, energy sorghum cultivars behave like photoperiod-insensitive, short-day sorghums [18]. According to Ritchie and Singh [24], the rate of biomass accumulation is principally influenced by the amount of light intercepted by plants over an optimum temperature range.
Differences in water use efficiency among cultivars over seasons or years are caused, most of the time, because of the climatic conditions presented during the growing seasons, crop management, soil characteristics, and the capacity of crops to both extract water from the soil and produce biomass [25]. The WUE values of the Weslaco sorghum cultivars were higher than those observed in Pecos (Figure 6). Seasonal water use varied in both locations. More irrigation water was applied at the Pecos experiments to meet the water needs of the crop (Table 2) because of the higher water demand caused mainly by the higher temperatures and the low relative humidity recorded during the growing seasons.
The experimental results of WUE obtained in the Weslaco experiments were in agreement with those reported by Rooney and Blumenthal [4] who obtained WUE values that ranged from 3.0 to 4.7 kg m−3 in a study carried out in the High Plains of Texas. Narayanan and Aiken [26] reported that WUE values for sorghum ranged between 3.39 and 7.63 kg m−3. All of these results and the results from Weslaco are within the commonly reported range of 2.8 to 12.6 kg m−3 for sorghum [27,28]. However, the opposite case was observed in the results obtained in the Pecos experiments, which ranged from 0.81 to 2.07 kg m−3 and are considerably below the range previously mentioned.
The salinity at Pecos was higher, and the soils presented more sodic conditions. More water was necessary to apply the leaching fractions and maintain a water balance in the soil. The cultivars Blade ES 5140 and Blade ES 5200 reached an average dry biomass productivity of 12.0 and 14.1 Mg ha−1, respectively. These sorghum dry biomass productivities were similar to those reported for similar saline environments in Iran by Ranjbar and Ghadiri [29] who used irrigation with saline water of 6 dS m−1, and they obtained 10.15 Mg ha−1 of dry biomass. In another experiment conducted in Northern Greece, Vasilakoglou and Dhima [30] tested six different sorghum cultivars under a soil salinity of 6.9 dS m−1 and obtained dry biomass productivities ranging from 8.1 to 20.9 Mg ha−1.
The reduced biomass yield and higher water consumption, particularly observed in Pecos, combined with lower ethanol prices made economically not feasible the production of ethanol from energy sorghum under Texas arid and semiarid conditions. Substantial gains in productivity observed under semi-arid growing conditions in recent years [14] suggest that low energy prices are one the main limiting factors to cellulosic-based ethanol production.

5. Conclusions

The results obtained in this study demonstrated that dry biomass productivity, plant height, stem diameter, and WUE of energy sorghum decrease significantly when it is grown under severe saline and sodic conditions commonly encountered in arid environments. The dry biomass yields of Pecos (arid environment) were 50% lower, due to poor germination, than those observed in Weslaco (semi-arid environment).
The lower values of WUE for Pecos resulted because of the lower productivity produced by higher salinity and sodic conditions, and it was necessary to apply more water to leach salts and to meet the higher evaporative demand. Furthermore, economic analysis indicated that, under current energy prices, it is not economically viable to produce ethanol using energy sorghum in Pecos and Weslaco, respectively. However, a favorable ethanol price outlook could make the semiarid cropland of Texas a feasible feedstock production alternative.

Author Contributions

Conceptualization, J.E. and J.C.; methodology, J.E., G.G., and S.Z.; formal analysis, J.E., J.C., and S.Z.; investigation, J.E., J.C.; resources, J.E.; data curation, J.E., J.C., G.G., and S.Z.; writing—J.E., J.C.; writing—review and editing, J.E., S.Z.; visualization, J.E.; supervision, J.E.; project administration, J.E.; funding acquisition, J.E., G.G.

Funding

This research was funded in part by USDA-NIFA (Award No. M1400228) entitled: “A Water and Risk Management Tool for Sustainable Production of Bioenergy Feedstocks” and the Texas A and M AgriLife Research Bioenergy Initiative Program.

Acknowledgments

The authors thank Rafael Lopez and Uriel Cholula for their technical support.

Conflicts of Interest

The authors declare no conflict of interest.

References

  1. Hoffman, G.J.; Evans, R.G.; Jensen, M.E.; Martin, D.L.; Elliott, R.L. Design and Operation of Farm Irrigation Systems; American Society of Agricultural and Biological Engineers: St. Joseph, MI, USA, 2007. [Google Scholar]
  2. Sun, Y.; Niu, G.; Osuna, P.; Zhao, L.; Ganjegunte, G.; Peterson, G.; Peralta-Videa, J.R.; Gardea-Torresdey, J.L. Variability in Salt Tolerance of Sorghum bicolor L. Agric. Sci. 2014, 2, 9–21. [Google Scholar] [CrossRef]
  3. Meki, M.N.; Snider, J.L.; Kiniry, J.R.; Raper, R.L.; Rocateli, A.C. Energy sorghum biomass harvest thresholds and tillage effects on soil organic carbon and bulk density. Ind. Crops Prod. 2013, 43, 172–182. [Google Scholar] [CrossRef]
  4. Rooney, W.L.; Blumenthal, J.; Bean, B.; Mullet, J.E. Designing sorghum as a dedicated bioenergy feedstock. Biofuels Bioprod. Biorefin. 2007, 1, 147–157. [Google Scholar] [CrossRef]
  5. Sivakumar, G.; Vail, D.R.; Xu, J.; Burner, D.M.; Lay, J.O.; Ge, X.; Weathers, P.J. Bioethanol and biodiesel: Alternative liquid fuels for future generations. Eng. Life Sci. 2010, 10, 8–18. [Google Scholar] [CrossRef]
  6. Francois, L.E.; Maas, E.V. Crop Response and Management of Salt-Affected Soils; Handbook of Plant and Crop Stress. Marcel Dekker Inc.: New York, NY, USA, 1994; p. 169. [Google Scholar]
  7. United States Department of Agriculture. SSURGO Soil Survey Geographic Database; USDA Natural Resources Conservation Service: Washington, DC, USA, 2013.
  8. Richards, L.A. Diagnosis and Improvement of Saline and Alkali Soils; United States Department Of Agriculture: Washington, DC, USA, 1969.
  9. Enciso, J. South Texas Weather. 2014. Available online: http://southtexasweather.tamu.edu/ (accessed on 1 February 2019).
  10. Allen, R.G.; Pereira, L.S.; Raes, D.; Smith, M. Crop Evapotranspiration-Guidelines for Computing Crop Water Requirements-FAO Irrigation and Drainage Paper 56; FAO: Rome, Italy, 1998; Volume 300, p. D05109. [Google Scholar]
  11. Enciso, J.; Jifon, J.; Anciso, J.; Ribera, L. Productivity of onions using subsurface drip irrigation versus furrow irrigation systems with an internet based irrigation scheduling program. Int. J. Agron. 2015, 2015, 6. [Google Scholar] [CrossRef]
  12. Gerik, T.; Bean, B.W.; Vanderlip, R. Sorghum Growth and Development; Texas FARMER Collection; Texas A & M System: College Station, TX, USA, 2003; Available online: https://oaktrust.library.tamu.edu/bitstream/handle/1969.1/87184/pdf_1724.pdf?sequence=1 (accessed on 28 June 2019).
  13. SAS Institute. Base SAS 9.4 Procedures Guide; SAS Institute: Cary, NC, USA, 2014. [Google Scholar]
  14. Enciso, J.; Jifon, J.; Ribera, L.; Zapata, S.D.; Ganjegunte, G.K. Yield, water use efficiency and economic analysis of energy sorghum in South Texas. Biomass Bioenergy 2015, 81, 339–344. [Google Scholar] [CrossRef]
  15. U.S. Energy Information Administration. Annual Energy Outlook 2019, Petroleum and Other Liquids Prices. 2019. Available online: https://www.eia.gov/outlooks/aeo/data/browser/#/?id=12-AEO2019&sourcekey=0 (accessed on 18 June 2019).
  16. Chavez, J.C.; Enciso, J.; Meki, M.N.; Jeong, J.; Singh, V.P. Simulation of Energy Sorghum under Limited Irrigation Levels Using the EPIC Model. Trans. ASABE 2018, 61, 121–131. [Google Scholar] [CrossRef]
  17. Olson, S.N.; Ritter, K.; Rooney, W.; Kemanian, A.; McCarl, B.A.; Zhang, Y.; Hall, S.; Packer, D.; Mullet, J. High biomass yield energy sorghum: Developing a genetic model for C4 grass bioenergy crops. Biofuels Bioprod. Biorefin. 2012, 6, 640–655. [Google Scholar] [CrossRef]
  18. Meki, M.N.; Ogoshi, R.M.; Kiniry, J.R.; Crow, S.E.; Youkhana, A.H.; Nakahata, M.H.; Littlejohn, K. Performance evaluation of biomass sorghum in Hawaii and Texas. Ind. Crops Prod. 2017, 103, 257–266. [Google Scholar] [CrossRef] [Green Version]
  19. Rocateli, A.; Raper, R.L.; Balkcom, K.S.; Arriaga, F.J.; Bransby, D.I. Biomass sorghum production and components under different irrigation/tillage systems for the southeastern US. Ind. Crops Prod. 2012, 36, 589–598. [Google Scholar] [CrossRef]
  20. Palumbo, A.D.; Vonella, A.V.; Garofalo, P.; D’Andrea, L.; Rinaldi, M. Response of a two-year sugar beet-sweet sorghum rotation to an agronomic management approach diversified by soil tillage and nitrogen fertilisation. Ital. J. Agron. 2014, 9, 109–114. [Google Scholar] [CrossRef] [Green Version]
  21. Ganjegunte, G.; Ulery, A.; Niu, G.; Wu, Y. Treated urban wastewater irrigation effects on bioenergy sorghum biomass, quality, and soil salinity in an arid environment. Land Degrad. Dev. 2018, 29, 534–542. [Google Scholar] [CrossRef]
  22. Almodares, A.; Hadi, M.; Ahmadpour, H. Sorghum stem yield and soluble carbohydrates under different salinity levels. Afr. J. Biotechnol. 2008, 7, 4051–4055. [Google Scholar]
  23. Munns, R. Physiological processes limiting plant growth in saline soils: Some dogmas and hypotheses. Plant Cell Environ. 1993, 16, 15–24. [Google Scholar] [CrossRef]
  24. Ritchie, J.T.; Singh, U.; Godwin, D.C.; Bowen, W.T. Cereal Growth, Development and Yield, in Understanding Options for Agricultural Production; Springer: Dordrecht, The Netherlands, 1998; pp. 79–98. [Google Scholar]
  25. Chavez, J.C. Growth Response and Productivity of Sorghum for Bioenergy Production in South Texas. Trans. ASABE 2019. (under review). [Google Scholar]
  26. Narayanan, S.; Aiken, R.M.; Vara Prasad, P.V.; Xin, Z.; Yu, J. Water and radiation use efficiencies in sorghum. Agron. J. 2013, 105, 649–656. [Google Scholar] [CrossRef]
  27. Hammer, G.L.; Farquhar, G.D.; Broad, I.J. On the extent of genetic variation for transpiration efficiency in sorghum. Aust. J. Agric. Res. 1997, 48, 649–656. [Google Scholar] [CrossRef]
  28. Henderson, S.; Von Caemmerer, S.; Farquhar, G.D.; Wade, L.; Hammer, G. Correlation between carbon isotope discrimination and transpiration efficiency in lines of the C4 species Sorghum bicolor in the glasshouse and the field. Funct. Plant Biol. 1998, 25, 111–123. [Google Scholar] [CrossRef]
  29. Ranjbar, G.; Ghadiri, H.; Razzaghi, F.; Sepaskhah, A.R.; Edalat, M. Evaluation of the SALTMED model for sorghum under saline conditions in an arid region. Int. J. Plant Prod. 2015, 9, 373–392. [Google Scholar]
  30. Vasilakoglou, I.; Dhima, K.; Karagiannidis, N.; Gatsis, T. Sweet sorghum productivity for biofuels under increased soil salinity and reduced irrigation. Field Crops Res. 2011, 120, 38–46. [Google Scholar] [CrossRef]
Figure 1. Map of the locations where energy sorghum responses were evaluated.
Water 11 01344 g001
Figure 2. Mean monthly maximum and minimum air temperature as well as total precipitation in 2014 and 2015 in Pecos, TX and Weslaco, TX during the growing seasons.
Water 11 01344 g002
Figure 3. Dry biomass productivity at the end of each growing season for the two energy sorghum cultivars; n.s. = not significant.
Water 11 01344 g003
Figure 4. Stem diameter of the two energy sorghum cultivars at harvest in the two growing seasons.
Water 11 01344 g004
Figure 5. Plant height of the two energy sorghum cultivars at harvest in the two growing seasons.
Water 11 01344 g005
Figure 6. Water use efficiency of the two energy sorghum cultivars at harvest time.
Water 11 01344 g006
Table 1. Initial soil conditions of the fields where experiments took place. Weslaco, Hidalgo silt clay loam (0%–1%); Pecos, Hoban silt clay loam (0%–1%).
Parameter [a]Hidalgo Silt Clay Loam (0–1%)Hoban Silt Clay Loam (0–1%)
Soil layer12341234
Depth (cm)0–4343–7171–9797–2000–4343–7171–9797–200
BD (Mg m−3)1.451.41.41.51.381.431.431.47
WP (m m−1)0.080.140.140.142022.722.923
FC (m m−1)0.20.230.230.2332.434.134.233.7
Sand (%)634835306.67.37.47.4
Silt (%)1925354059.45453.653.6
Soil pH8.28.28.28.28.28.28.28.2
OCC (%)10.650.30.21.50.810.750.75
CCC (%)39232310242513
CEC (cmol kg−1)9.513141617.517.517.517.5
EC (dS m−1)1.01.52.02.03334.6
Note: The soil properties were obtained from the Soil Survey Geographic (SSURGO) database [7]. [a] BD = bulk density, WP = wilting point, FC = field capacity, OCC = organic carbon concentration, CCC = calcium carbonate content, CEC = cation exchange capacity, and EC = electrical conductivity.
Table 2. Agronomic and irrigation data for energy sorghum at Pecos, TX and Weslaco, TX.
ActivityPecosWeslaco
2014201520142015
Planting date23 June7 June6 March24 March
Harvesting date15 October19 September28 June8 July
Length of
growing season (d)
114104114106
In-season
precipitation (mm)
10446148238
Full irrigation (mm)10671067400304
ETo [b] (mm)994981636545
ETc [c] (mm)871910633521
Fertilizer:
Nitrogen (kg ha−1)
100100100100
Sum Srad [d] (MJ m−2)2411239721111840
Cumulative GDU (°D)2063192418971986
No. of days daylight > 12:20 h8610293102
[b] ETo = reference evapotranspiration. [c] ETc = sorghum evapotranspiration. [d] Srad = solar radiation.
Table 3. Parameters analyzed of the irrigation water quality applied in the different field experiments.
Parameter AnalyzedUnitsPecosWeslaco
Calcium (Ca2+)ppm19674
Magnesium (Mg2+)ppm4132
Sodium (Na+)ppm1134160
Potassium (K+)ppm2411
Boron (B+)ppm0.880.42
Carbonate (CO32−)ppm00
Bicarbonate (HCO3)ppm165115
Sulfate (SO42−)ppm1322344
Chloride (Cl)ppm1193176
pH 7.747.47
Conductivity (EC)dS m−16.41.42
Total dissolved salts (TDS)ppm4076913
Sodium adsorption radio (SAR) 19.23.6
Table 4. Parameters used in the economic analysis.
ParameterPecosWeslaco
ES 5140ES 5200ES 5140ES 5200
Yield (dry Mg ha−1)12.0014.1028.3024.95
Ethanol conversion rate (L Mg−1)302.83302.83302.83302.83
Ethanol price (USD L−1)0.400.400.400.40
Ethanol production cost (USD L−1)0.360.360.360.36
Feedstock variable costs (USD ha−1)902.77996.381056.091059.53
Seeds (USD ha−1)64.11122.1264.11122.12
Fertilizers (USD ha−1)289.36289.36289.36289.36
Insecticides (USD ha−1)17.5417.5417.5417.54
Irrigation (USD ha−1)160.05160.0562.0062.00
Labor (USD ha−1)52.6852.6839.4839.48
Fuel (USD ha−1)39.5139.5139.5139.51
Repair and maintenance (USD ha−1)70.6170.6166.9266.92
Harvest and hauling (USD ha−1)195.63229.86461.35406.74
Interest on operating capital (USD ha−1)13.2814.6615.8215.87
Feedstock fixed costs (USD ha−1)216.66216.66317.78317.78
Machinery depreciation (USD ha−1)80.0480.0475.1275.12
Equipment investment (USD ha−1)37.7837.7832.6232.62
Land rent (USD ha−1)98.8498.84210.04210.04
Return to producers (USD ha−1)111.94121.30137.39137.73
Table 5. Statistical significance values of dry biomass productivity, plant height, stem diameter, and water-use efficiency (WUE).
EffectDry Biomass ProductivityPlant HeightStem DiameterWUE
Pecos
Cultivar 20140.3720.0150.0370.366
Cultivar 20150.4890.0230.0350.492
Year (Y)0.0340.1700.3950.034
Cultivar (C)0.004<0.0010.1360.014
Y × C0.9940.8210.3170.979
Weslaco
Cultivar 20140.3640.0180.0460.127
Cultivar 20150.0640.0400.0320.080
Year (Y)0.1110.1560.2950.047
Cultivar (C)0.019<0.0010.0490.079
Y × C0.9520.7420.7030.792
Table 6. Soil properties for the experimental areas in Weslaco and Pecos at the beginning and end of the duration of the experiments.
Soil PropertiesWeslacoPecos
InitialFinalInitialFinal
pH7.57.58.47.7
EC (dS m1)0.630.654.542.7
SAR1.974.3517.5915.1
Organic Carbon (%)0.710.710.620.6
Potassium (ppm)16165.55.3
Calcium (ppm)635093131.9
Magnesium (ppm)662035.3
Table 7. Expected net returns and break-even analysis.
ParameterPecosWeslaco
ES 5140ES 5200ES 5140ES 5200
Net return (USD ha−1)−1058.46−1131.18−1103.46−1155.52
Break-even ethanol price (USD L−1)0.700.670.530.56

