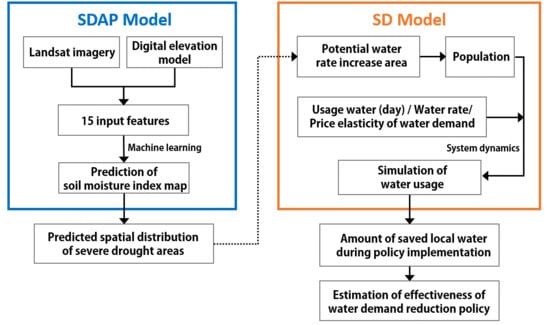
Is Water Pricing Policy Adequate to Reduce Water Demand for Drought Mitigation in Korea?
Abstract
1. Introduction
2. Study Area and Data
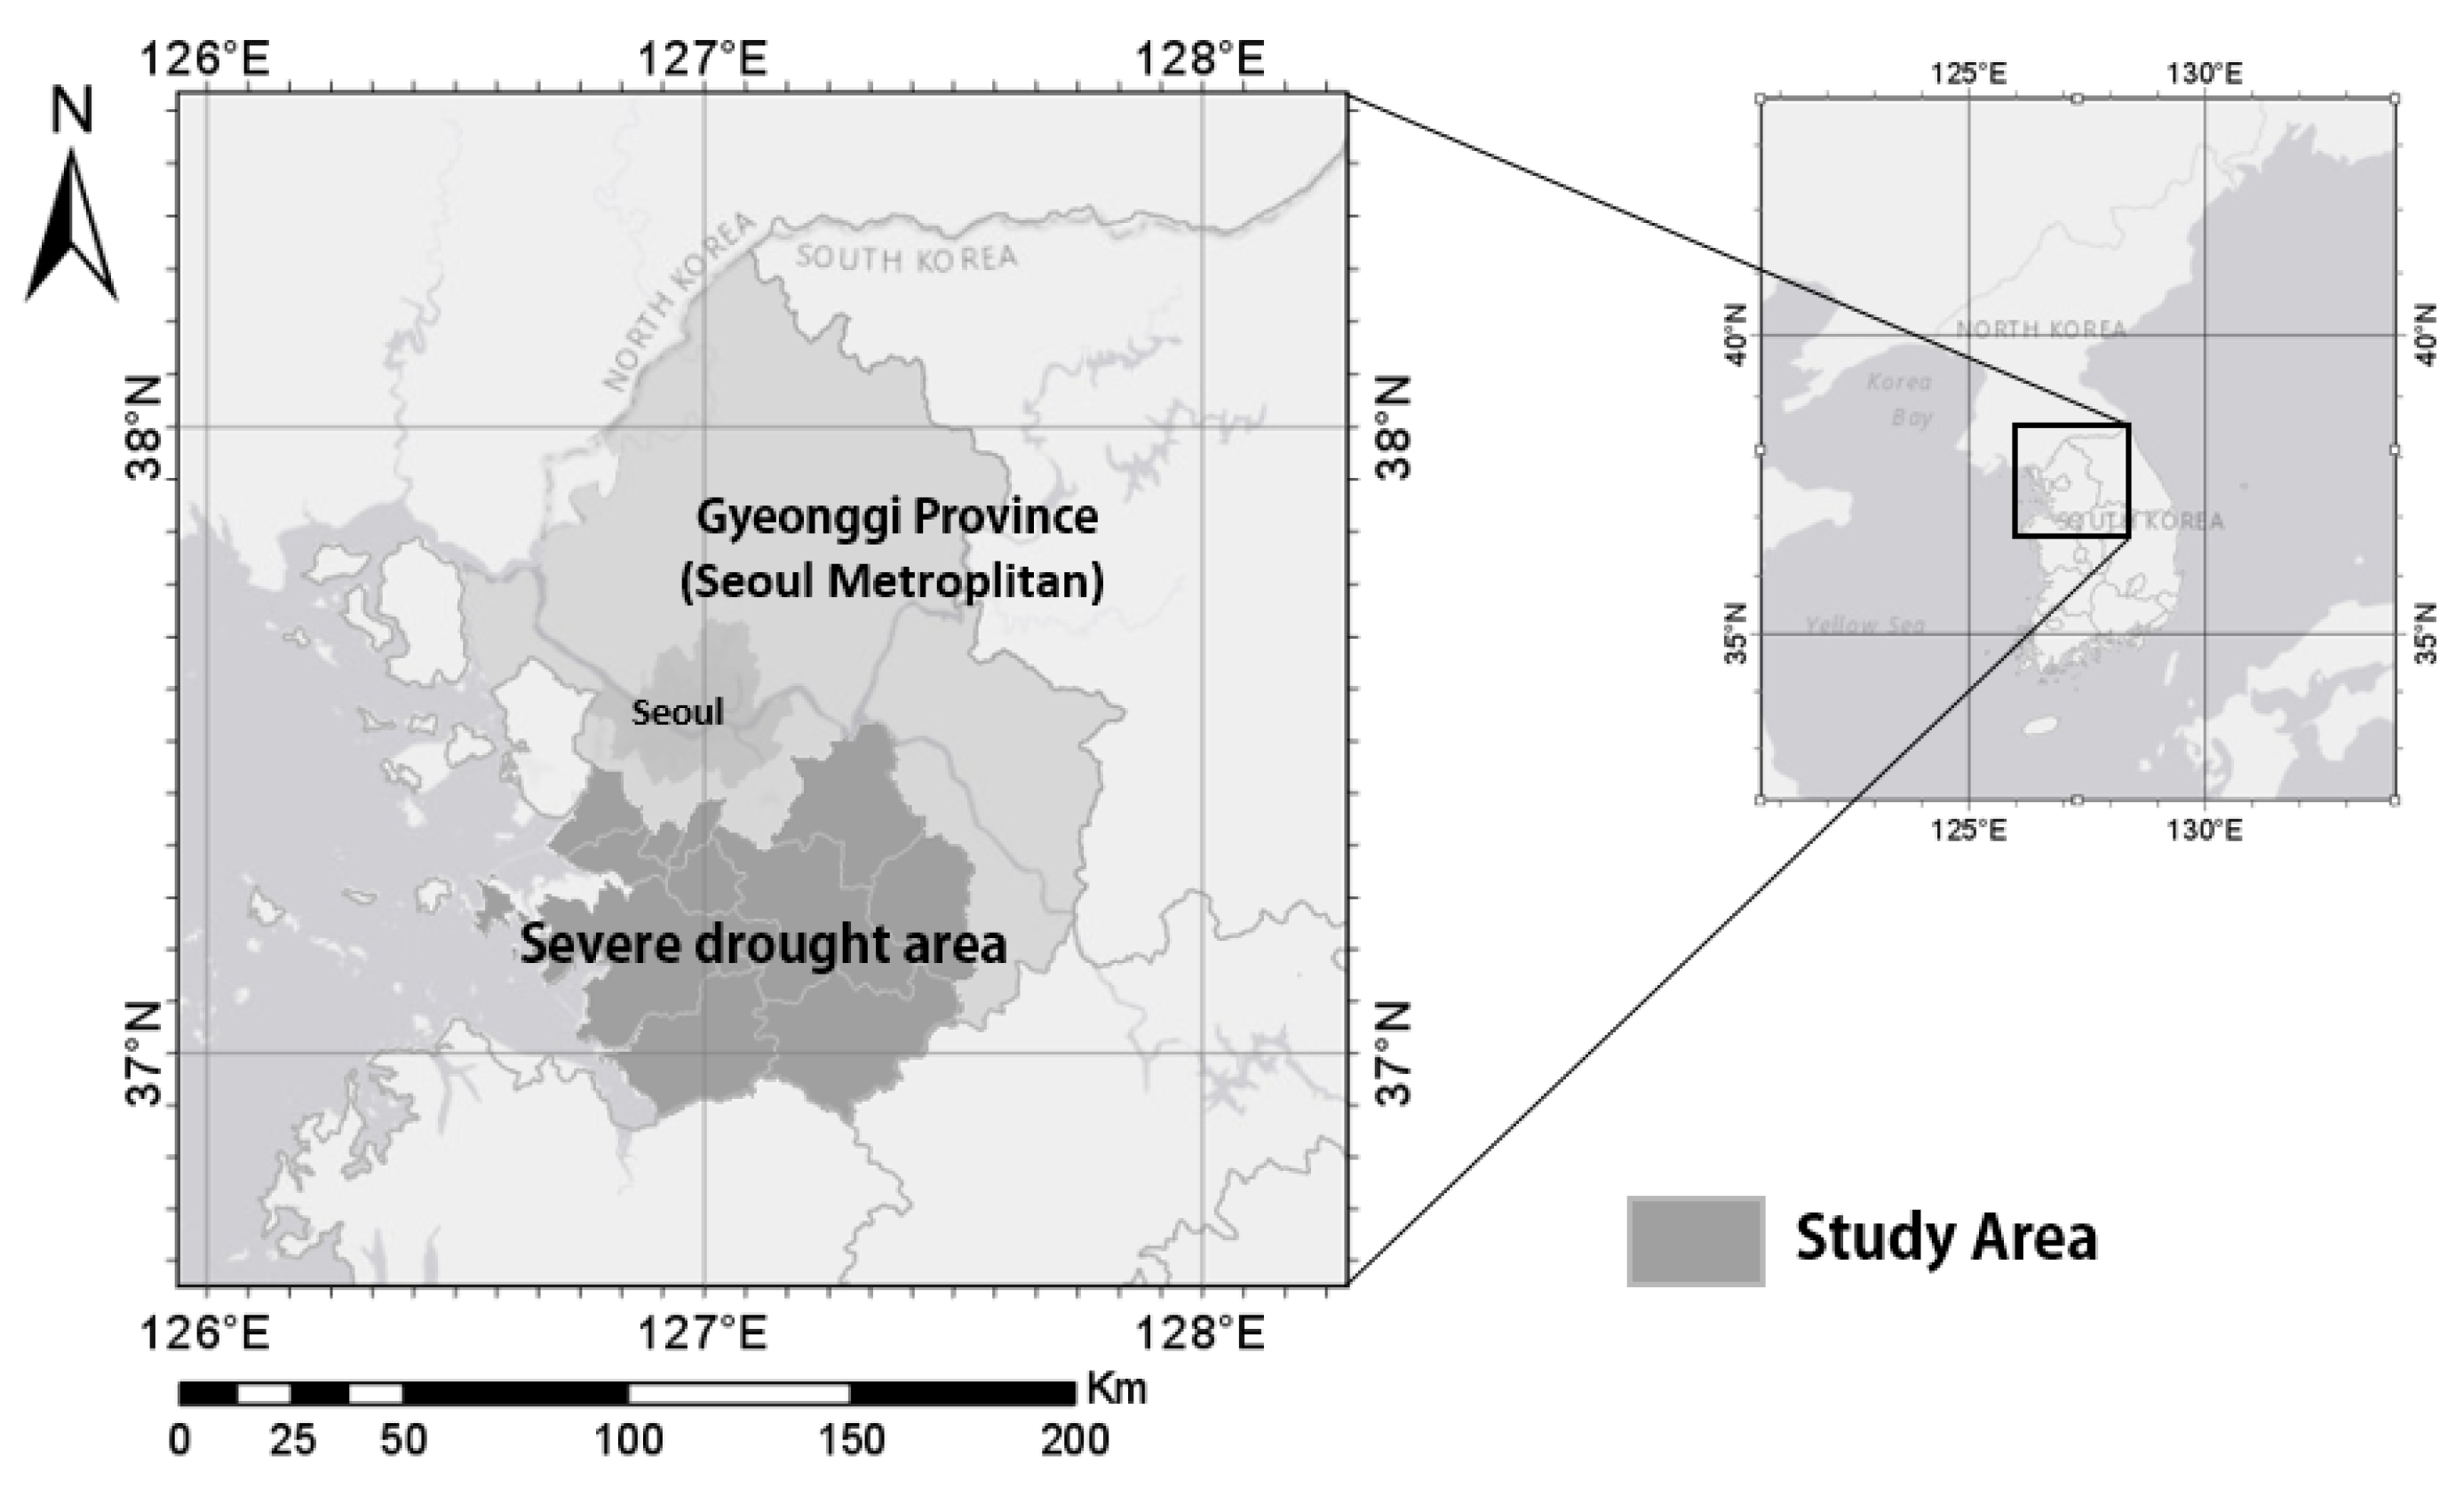
2.1. Study Area
2.2. Data
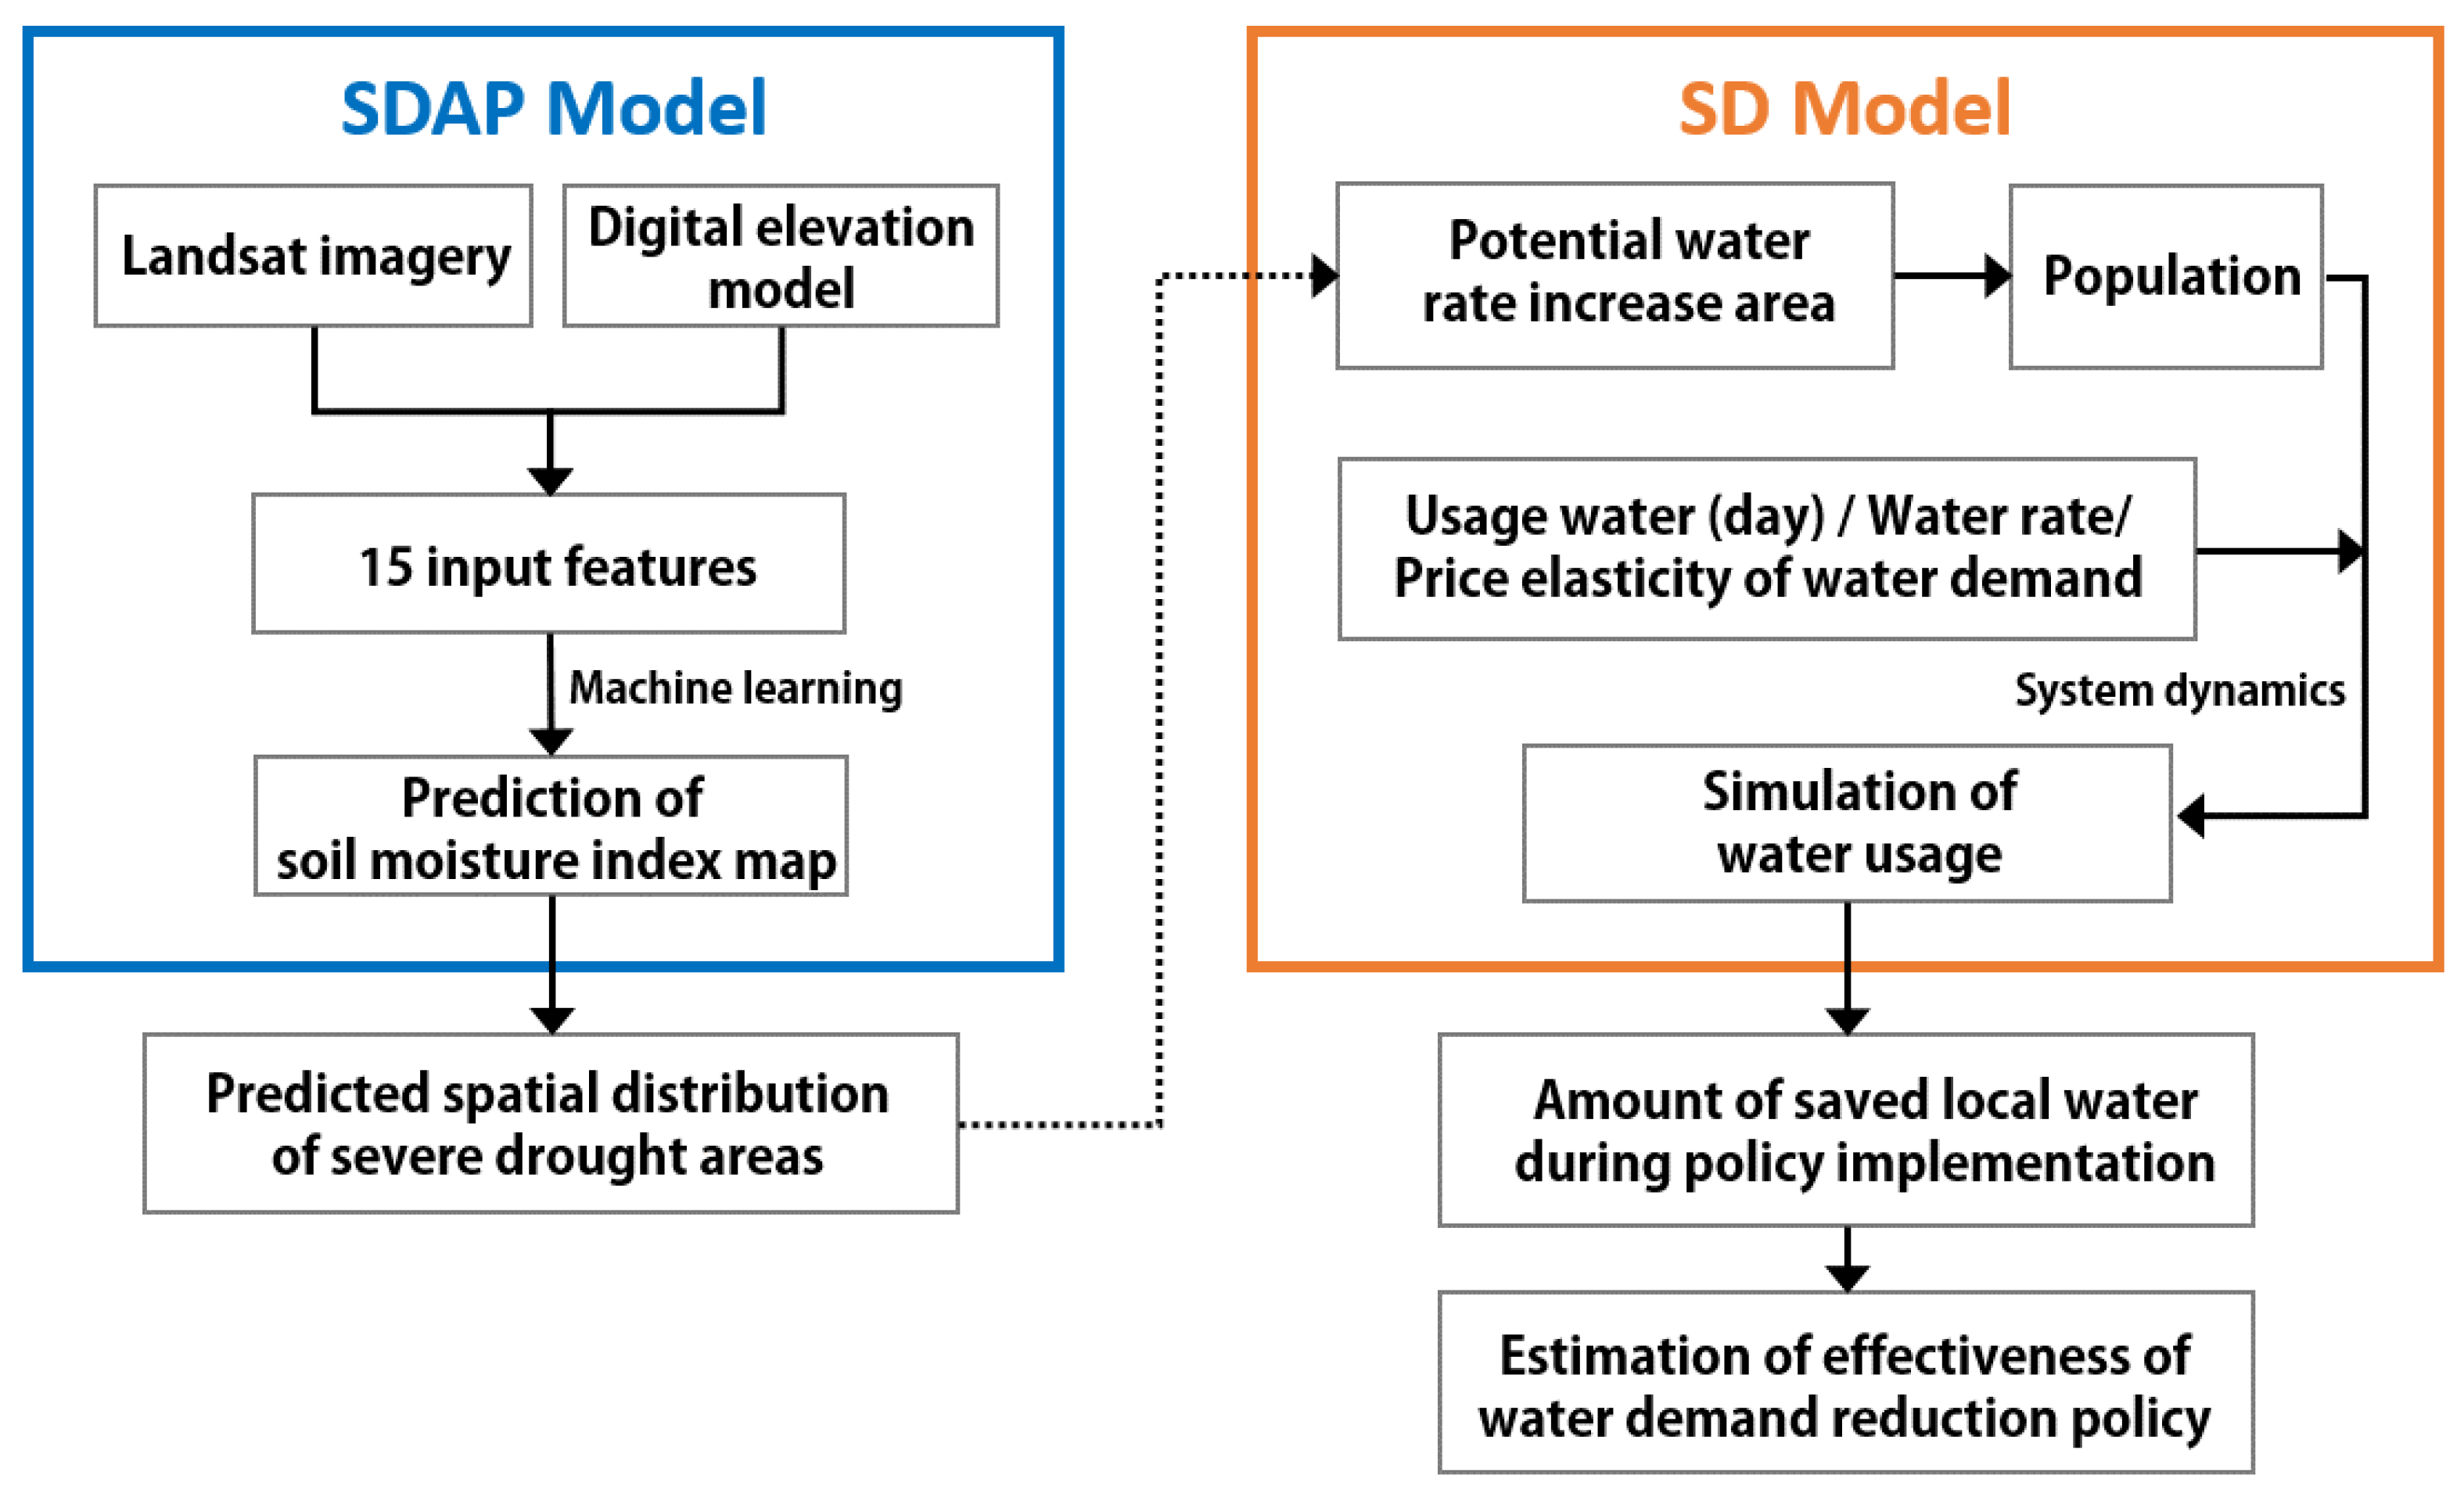
3. Methods
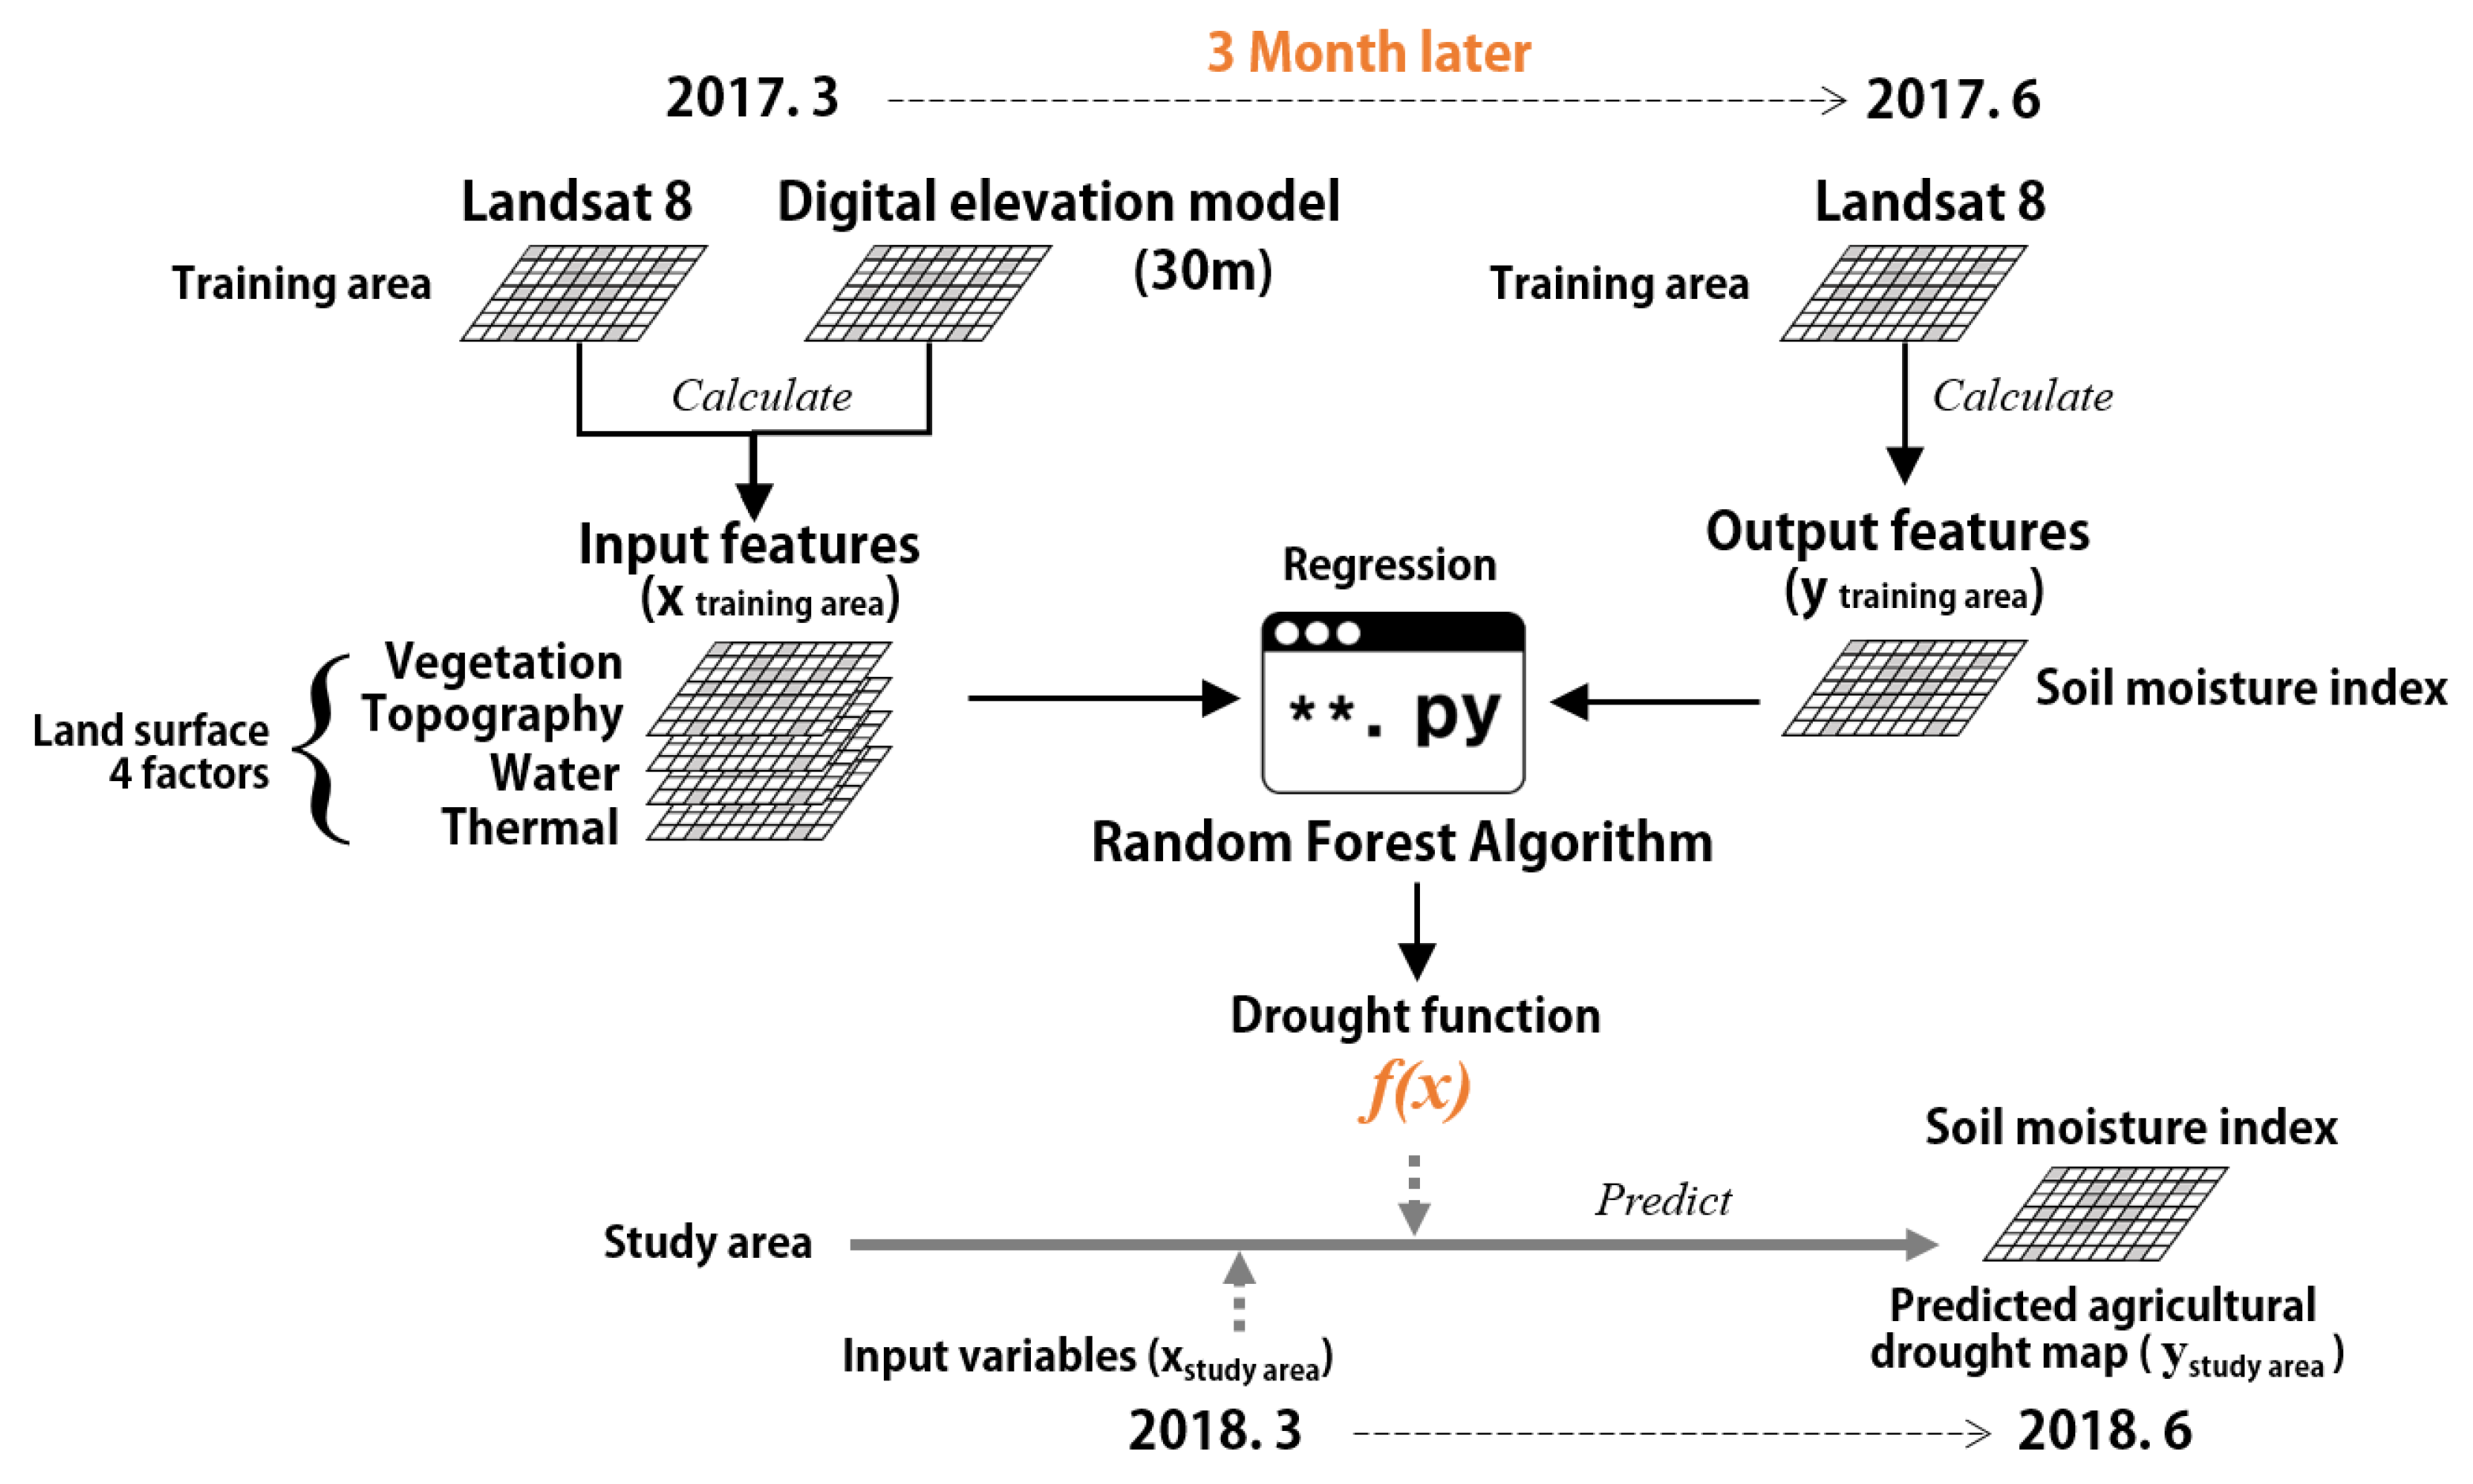
3.1. SDAP Model: Prediction Drought Spatial Distribution
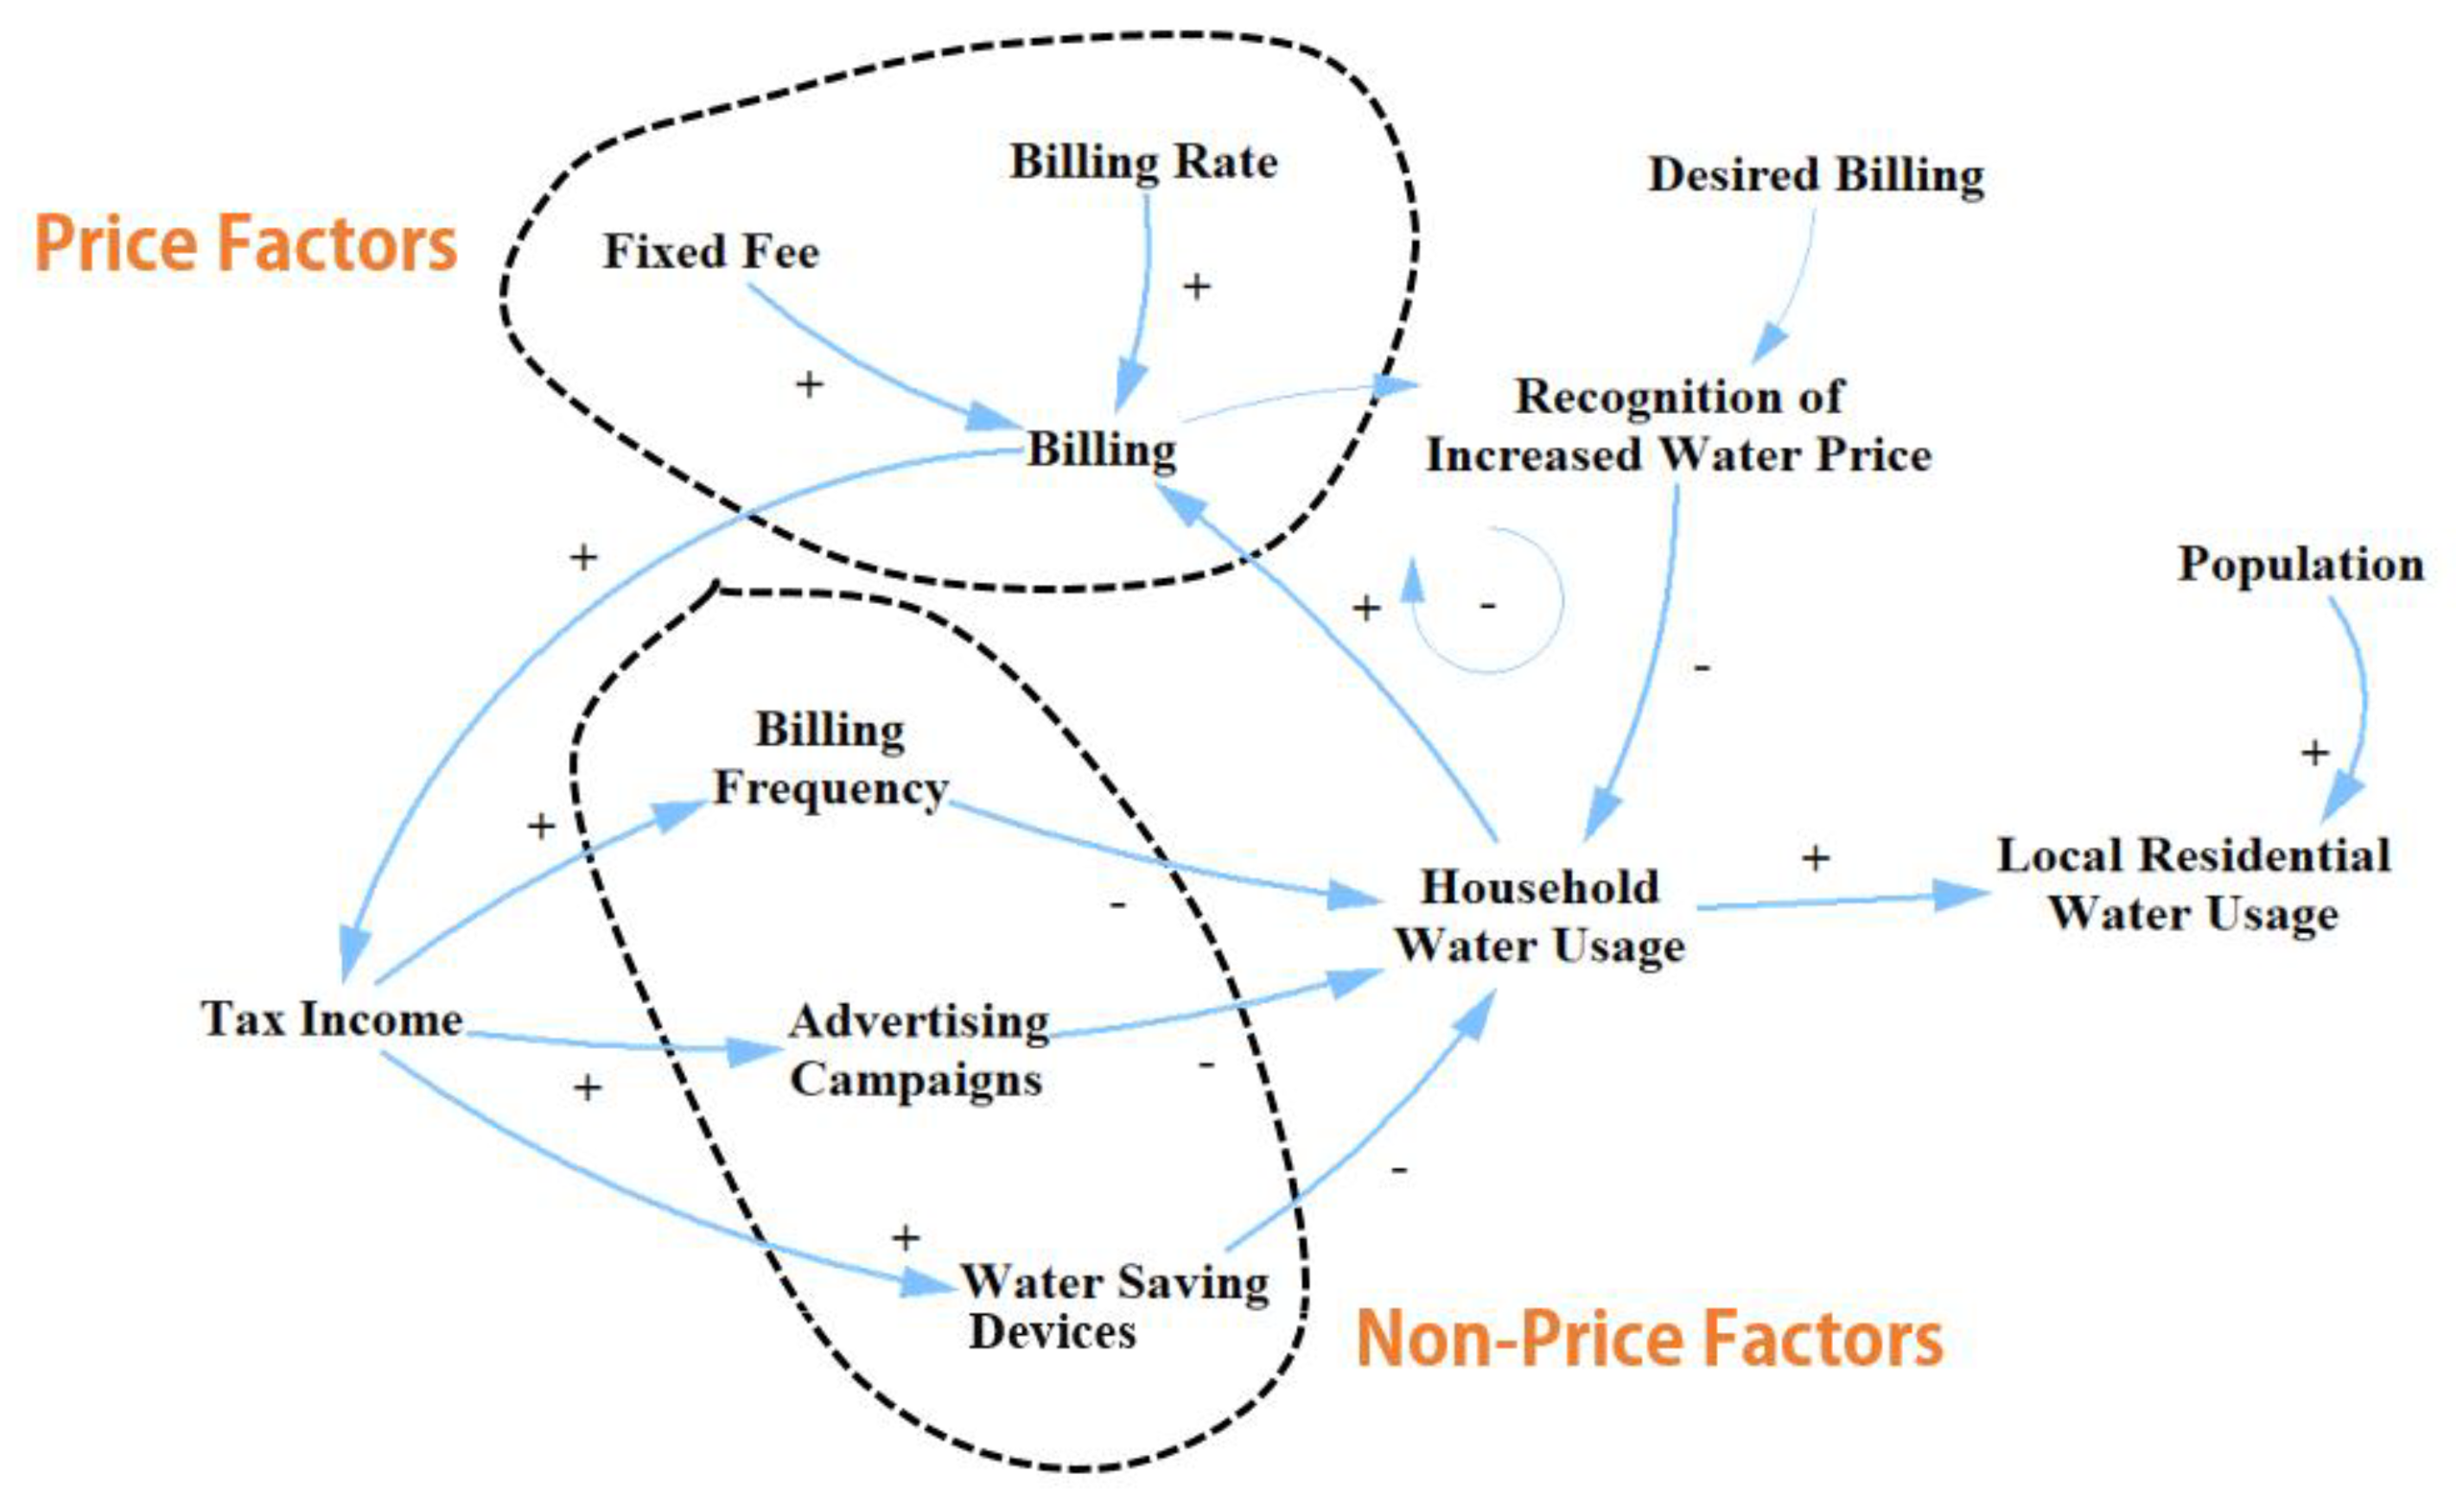
3.2. SD Model: Simulation of Increased Water Price Policy Implementation
4. Results
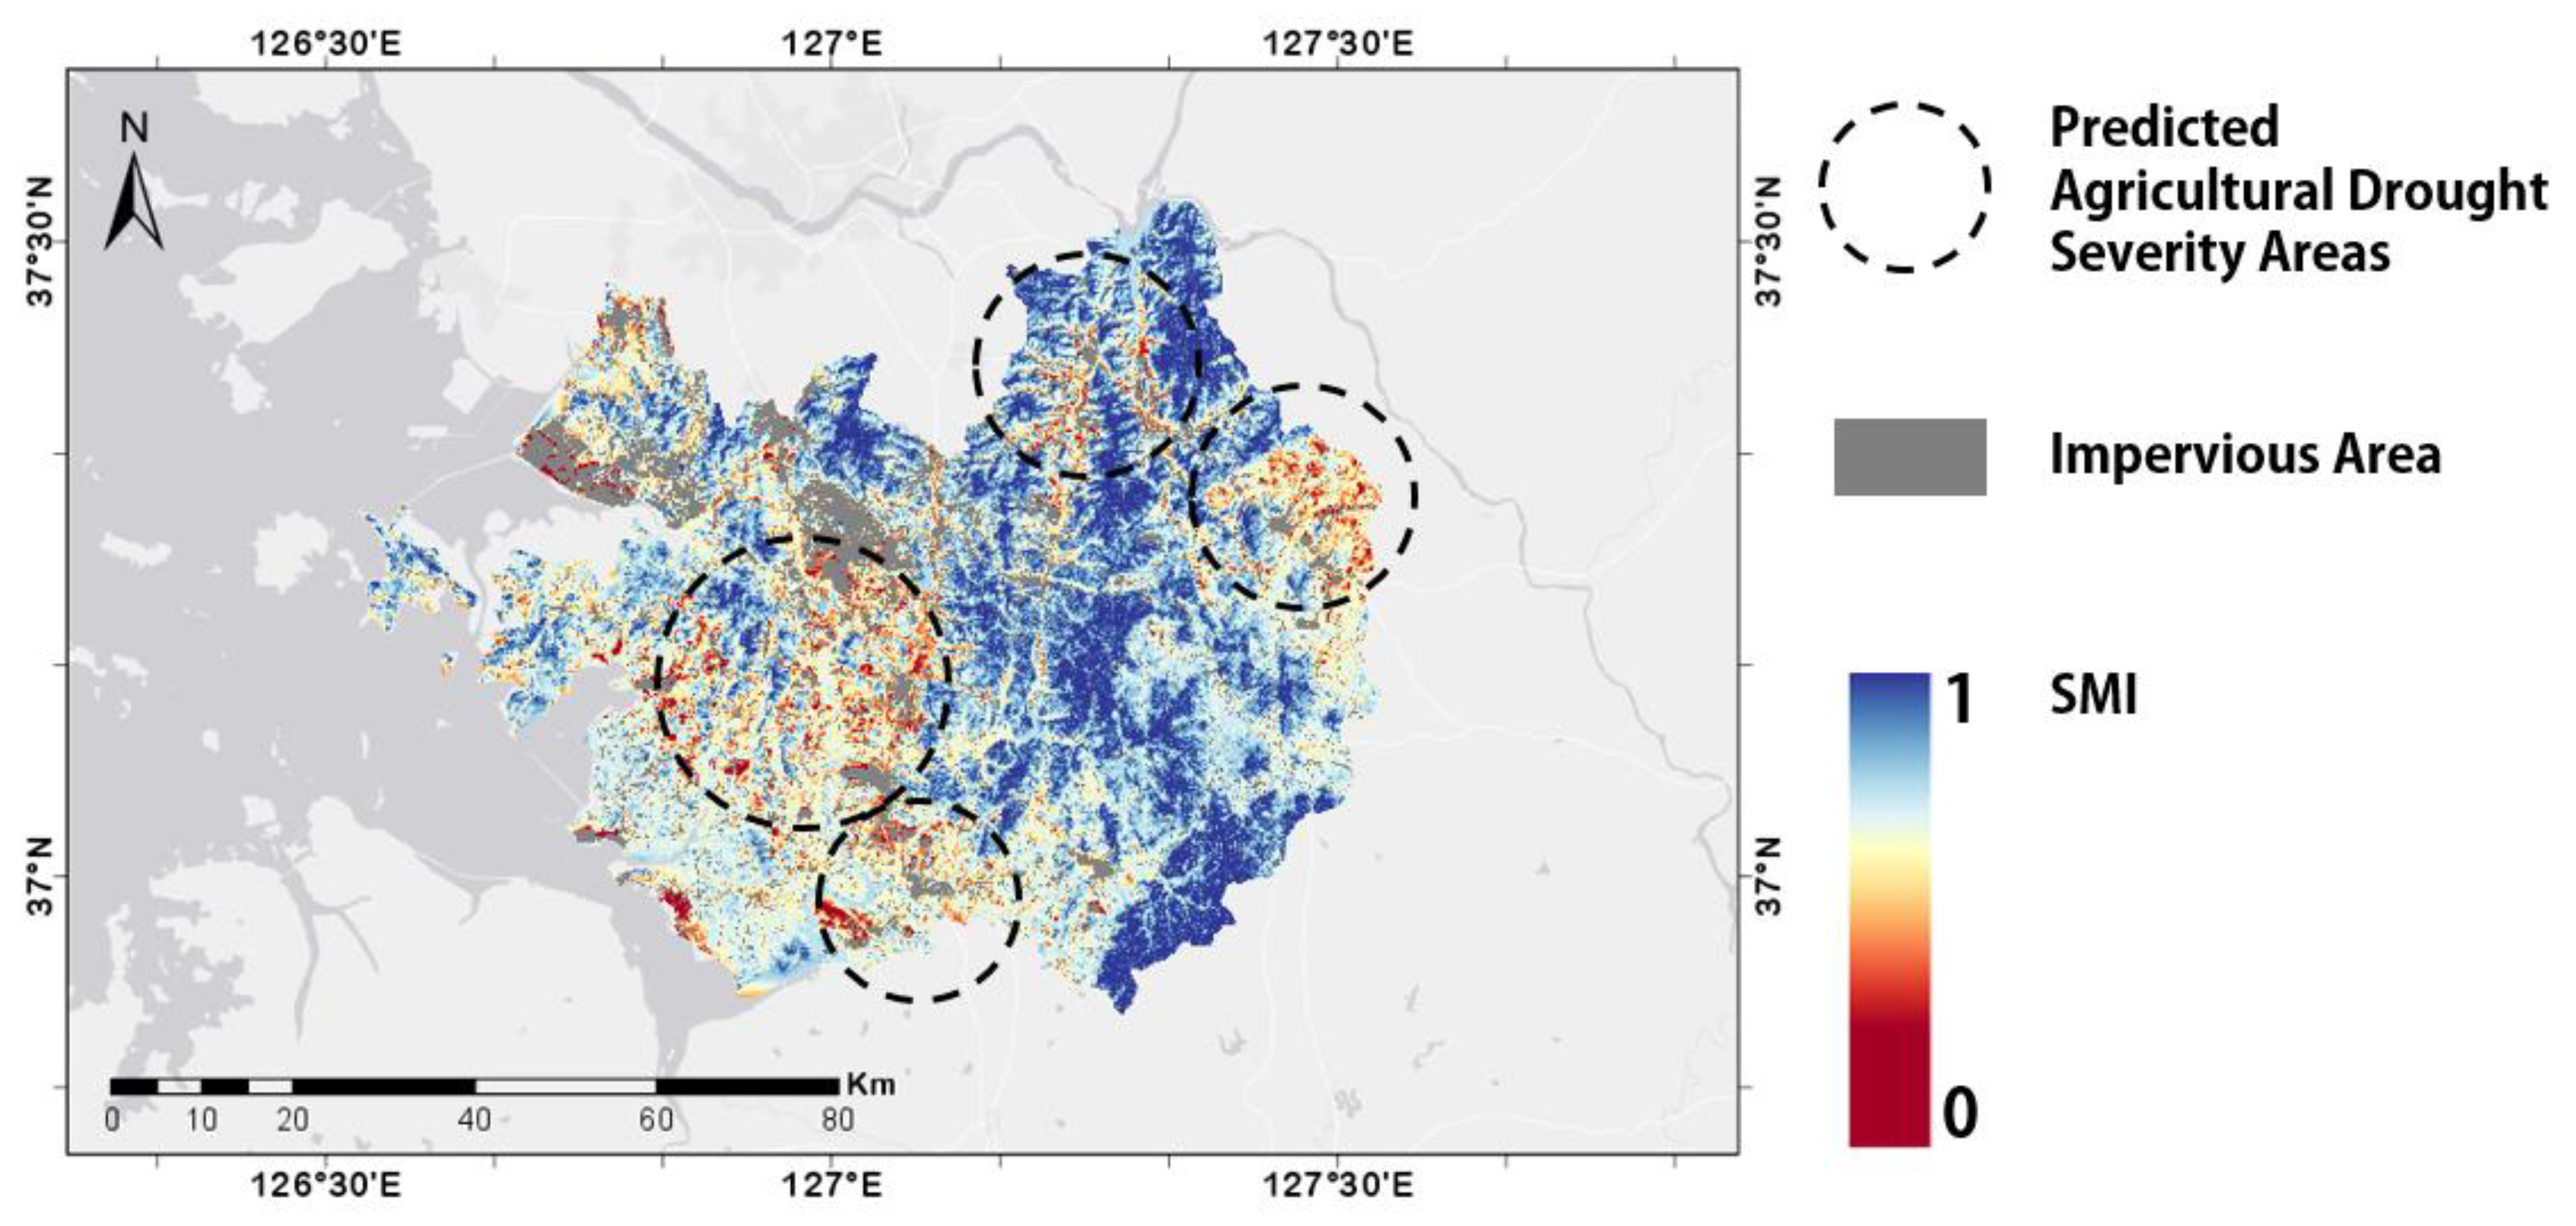
4.1. Predicted Agricultural Drought Severity Areas
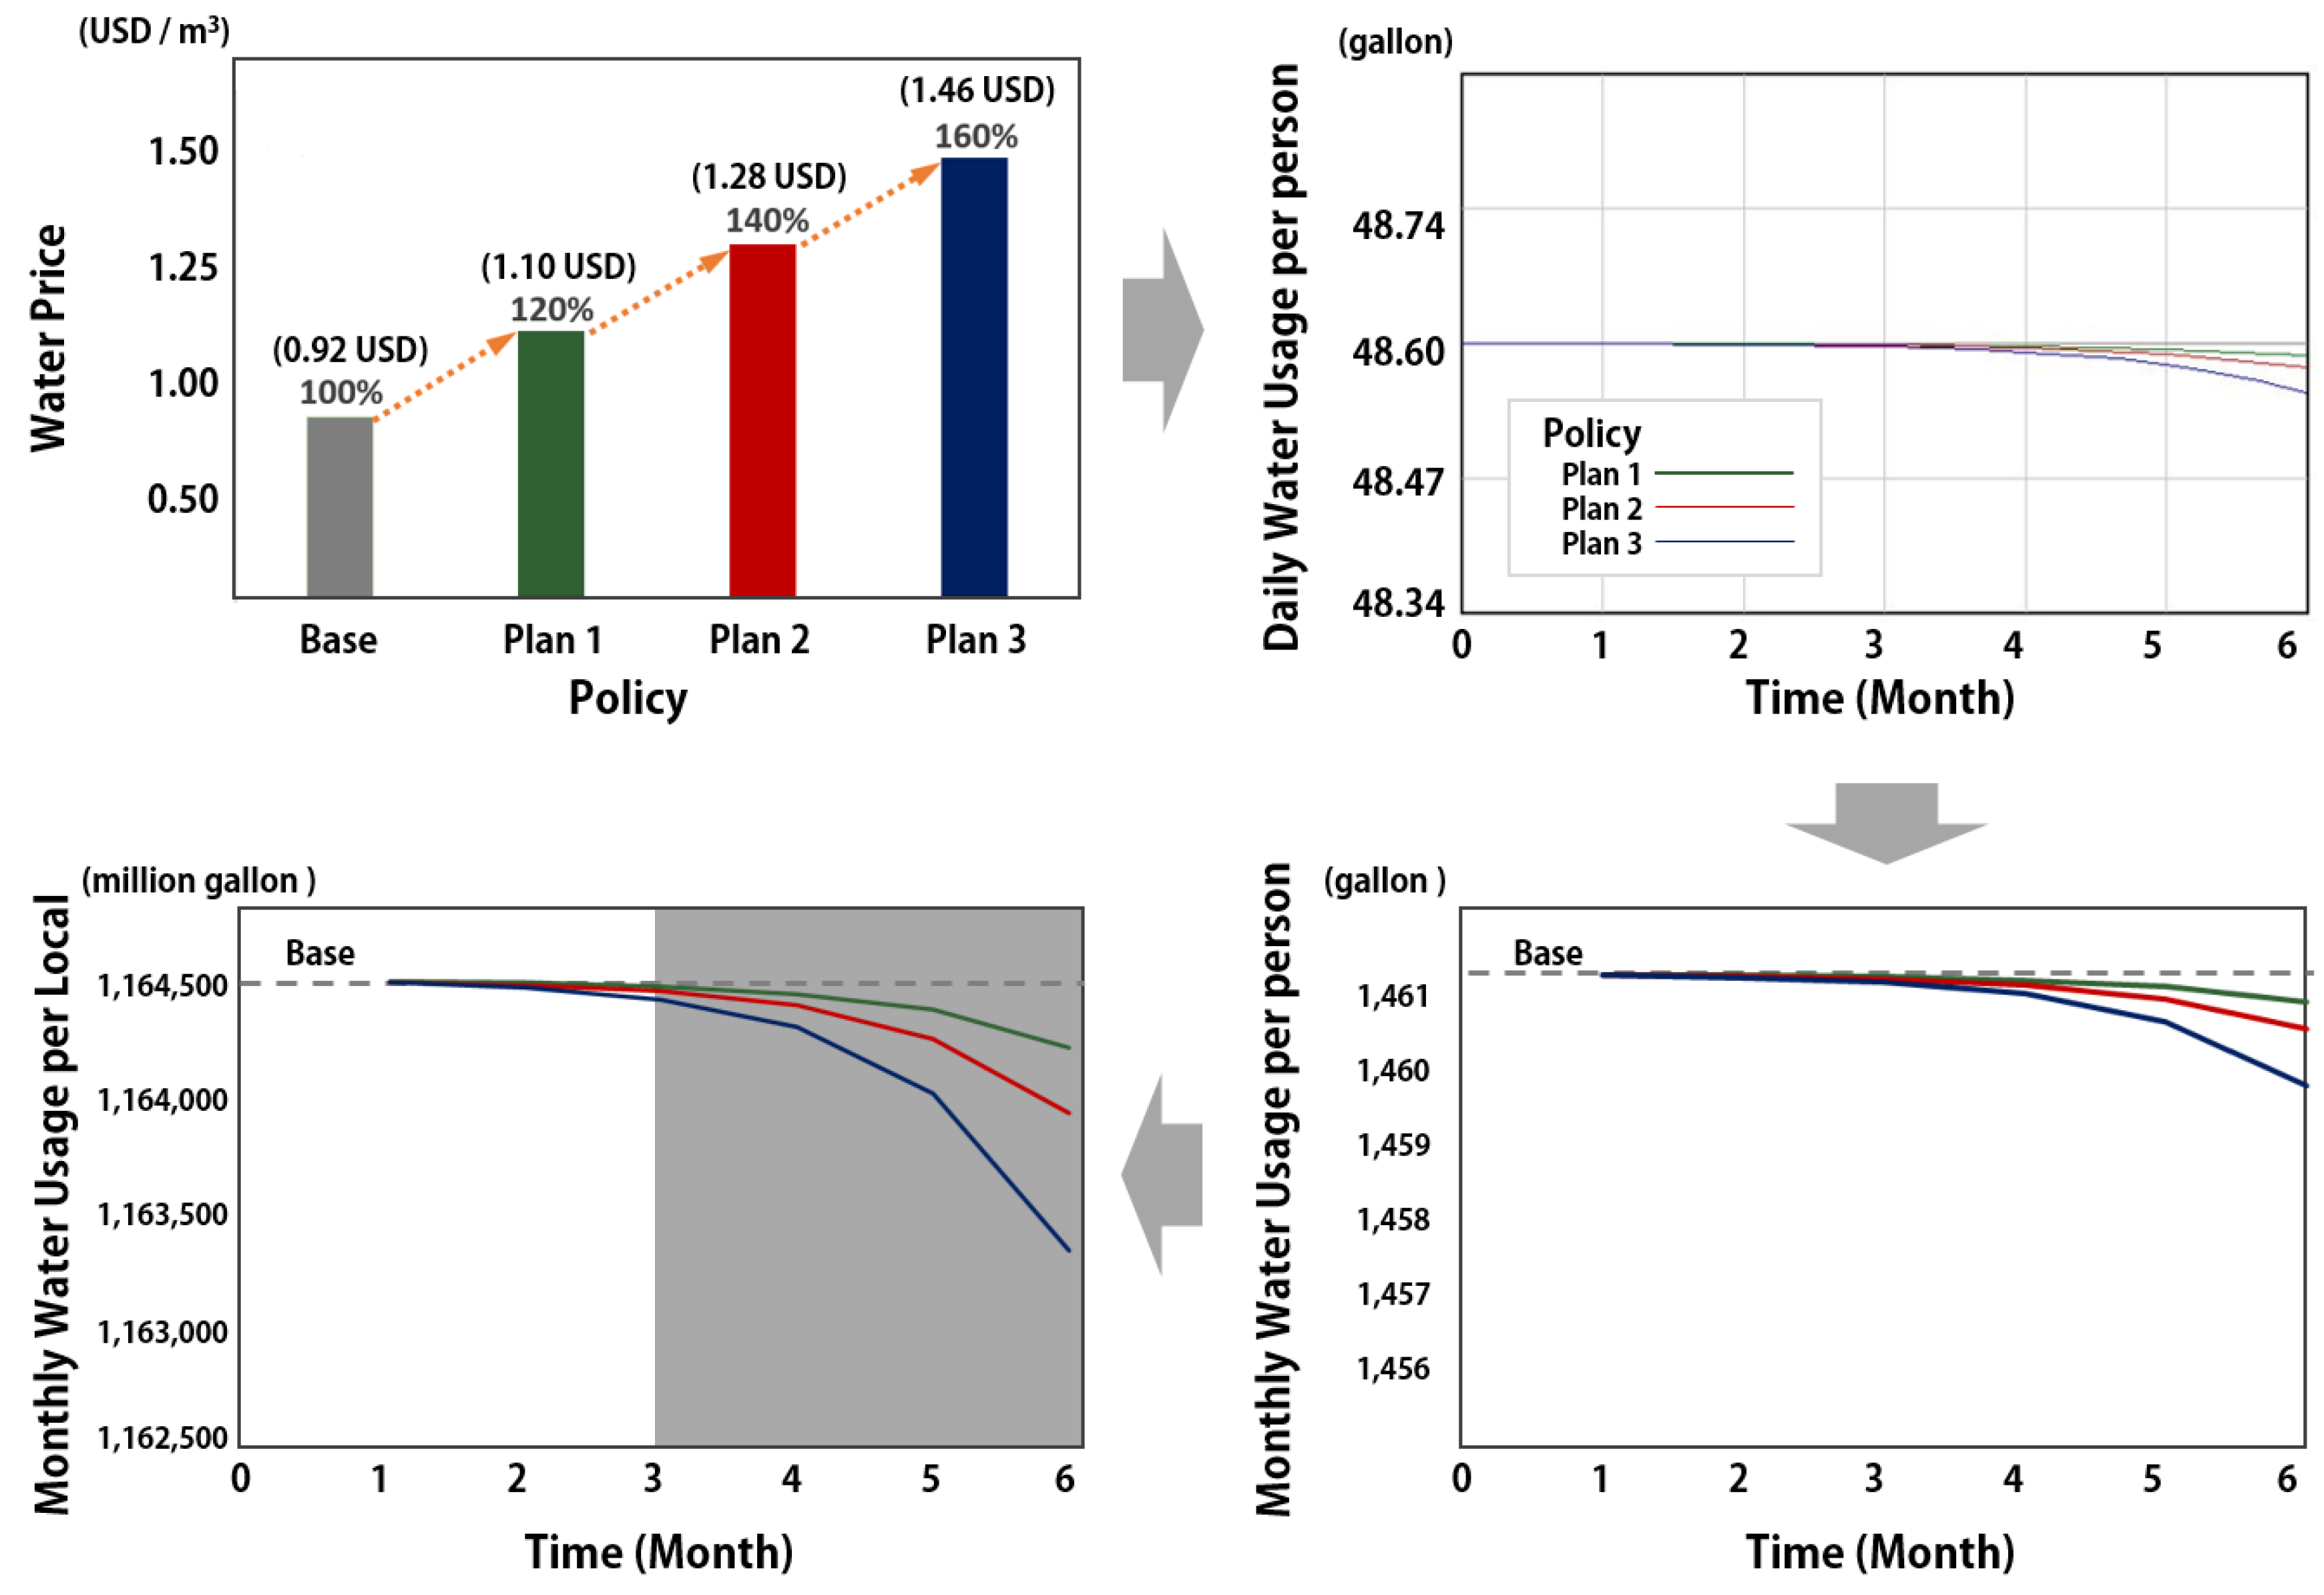
4.2. Simulation of Water Pricing Policy Effect
5. Discussion
5.1. Effectiveness of Water Demand Reduction Policy Price in Korea
5.2. Non-Price Policy for Water Demand Reduction
6. Conclusions
Author Contributions
Funding
Acknowledgments
Conflicts of Interest
References
- Korean Statistical Information Service (KOSIS). Available online: http://kosis.kr (accessed on 14 May 2018).
- Gyeonggi Province Statistics. Available online: https://www.gg.go.kr/ggstat (accessed on 14 May 2018).
- Kim, K. Gyeonggi Province, 44 billion KRW Development of rural water including Namhan River and Pyeongtaek Lake. Newsis, 28 March 2019. [Google Scholar]
- Brears, R.C. Urban Water Security/Robert C; John Wiley & Sons, Ltd.: Chichester, UK, 2017. [Google Scholar]
- Kukulich, T. California Drought Over, Conservation Continues. Press, 28 March 2019. [Google Scholar]
- Water Resources Control Board. Available online: https://www.waterboards.ca.gov (accessed on 25 April 2019).
- Jay, L.; Josue, M.-A.; John, D.; Kathleen, S. Lessons from California’s 2012–2016 Drought. J. Water Resour. Plan. Manag. 2018, 144, 4018067. [Google Scholar] [CrossRef]
- European Agriculture Impacted by Drought and Water Scarcity. Available online: https://www.euroscientist.com/european-agriculture-impacted-by-drought-and-water-scarcity/ (accessed on 25 April 2019).
- PPIC Water Policy Center. California’s Water; PPIC Water Policy Center: San Francisco, CA, USA, 2016. [Google Scholar]
- Kim, H. Estimating Price Elasticity of Residential Water Demand in Korea Using Panel Quatile Model. Environ. Resour. Econ. Rev. 2018, 27, 195–214. [Google Scholar] [CrossRef]
- Seo, S. K-Water Tried to Raise Water Tax during Drought (Parliamentary Audit). News1Korea, 30 September 2016. [Google Scholar]
- Grafton, R.Q.; Ward, M.B.; To, H.; Kompas, T. Determinants of residential water consumption: Evidence and analysis from a 10-country household survey. Water Resour. Res. 2011, 47. [Google Scholar] [CrossRef]
- Park, H.; Kim, K.; Lee, D.K. Prediction of Severe Drought Area Based on Random Forest: Using Satellite Image and Topography Data. Water 2019, 11, 705. [Google Scholar] [CrossRef]
- Forrester, J.W. Industrial Dynamics; M.I.T. Press: Cambridge, MA, USA, 1961. [Google Scholar]
- Kim, E.; Kim, Y.P. Applying System Dynamics Model to Estimate the Effects of Healthy City Policies on Reducing Social Cost. Korean Syst. Dyn. Rev. 2012, 3, 23–46. [Google Scholar]
- Kim, E.J.; Kim, Y.-P. Effect Analysis of Healthy City Policies on Residents’ Walking. Korean Syst. Dyn. Rev. 2012, 2, 25–45. [Google Scholar]
- Earth Explorer. Available online: https://earthexplorer.usgs.gov (accessed on 11 May 2018).
- My Water. Available online: https://www.water.or.kr (accessed on 15 August 2018).
- Zhou, X.Y.; Lei, K.; Meng, W.; Khu, S.T.; Zhao, J.; Wang, M.; Yang, J. Space–time approach to water environment carrying capacity calculation. J. Clean. Prod. 2017, 149, 302–312. [Google Scholar] [CrossRef]
- Hao, Z.; Singh, V.P.; Xia, Y. Seasonal Drought Prediction: Advances, Challenges, and Future Prospects. Rev. Geophys. 2018, 56, 108–141. [Google Scholar] [CrossRef]
- Sruthi, S.; Aslam, M.A.M. Agricultural Drought Analysis Using the NDVI and Land Surface Temperature Data; a Case Study of Raichur District. Aquat. Procedia 2015, 4, 1258–1264. [Google Scholar] [CrossRef]
- Raduła, M.W.; Szymura, T.H.; Szymura, M. Topographic wetness index explains soil moisture better than bioindication with Ellenberg’s indicator values. Ecol. Indic. 2018, 85, 172–179. [Google Scholar] [CrossRef]
- Huete, A.; Didan, K.; Miura, T.; Rodriguez, E.P.; Gao, X.; Ferreira, L.G. Overview of the radiometric and biophysical performance of the MODIS vegetation indices. Remote Sens. Environ. 2002, 83, 195–213. [Google Scholar] [CrossRef]
- World Meteorologcal Organizatio (WMO); Global Water Partnership (GWP). Handbook of Drought Indicators and Indices; World Meteorologcal Organizatio (WMO) and Global Water Partnership (GWP): Geneva, Switzerland, 2016; ISBN 978-92-63-11173-9. [Google Scholar]
- Product Guide: Landsat Surface Reflectance-Derived Spectral Indices; 3.6 version; Department of the Interior, U.S. Geological Survey (USGS): Reston, VA, USA, 2017.
- Tucker, C.J. Red and photographic infrared linear combinations for monitoring vegetation. Remote Sens. Environ. 1979, 8, 127–150. [Google Scholar] [CrossRef]
- Sydney, T. A Soil-Adjusted Vegetation Index (SAVI). Remote Sens. Environ. 1988, 25, 295–309. [Google Scholar] [CrossRef]
- Qi, J.; Chehbouni, A.; Huete, A.R.; Kerr, Y.H.; Sorooshian, S. A modified soil adjusted vegetation index. Remote Sens. Environ. 1994, 48, 119–126. [Google Scholar] [CrossRef]
- Beven, K.J.; Kirkby, M.J. A physically based, variable contributing area model of basin hydrology. Hydrol. Sci. Bull. 1979, 24, 43–69. [Google Scholar] [CrossRef]
- Burrough, P.A.; Mcdonnell, R.A. Data Models and Axioms. Princ. Geogr. Inf. Syst. 1998, 17–34. [Google Scholar] [CrossRef]
- How Slope Works. Available online: http://desktop.arcgis.com/en/arcmap/10.3/tools/spatial-analyst-toolbox/how-slope-works.htm (accessed on 21 December 2018).
- How Aspect Works. Available online: http://pro.arcgis.com/en/pro-app/tool-reference/spatial-analyst/how-aspect-works.htm (accessed on 21 December 2018).
- Gao, B. NDWI—A normalized difference water index for remote sensing of vegetation liquid water from space. Remote Sens. Environ. 1996, 58, 257–266. [Google Scholar] [CrossRef]
- Xu, H. Modification of normalised difference water index (NDWI) to enhance open water features in remotely sensed imagery. Int. J. Remote Sens. 2006, 27, 3025–3033. [Google Scholar] [CrossRef]
- Welikhe, P.; Quansah, J.E.; Fall, S.; McElhenney, W. Estimation of Soil Moisture Percentage Using LANDSAT-based Moisture Stress Index. J. Remote Sens. GIS 2017, 6. [Google Scholar] [CrossRef]
- Bands Specifications of Landsat 8. Available online: https://landsat.usgs.gov/provisional-landsat-8-surface-reflectance-data-available (accessed on 19 December 2018).
- Breiman, L. Random forests. Mach. Learn. 2001, 45, 5–32. [Google Scholar] [CrossRef]
- Sandholt, I.; Rasmussen, K.; Andersen, J. A simple interpretation of the surface temperature/vegetation index space for assessment of surface moisture status. Remote Sens. Environ. 2002, 79, 213–224. [Google Scholar] [CrossRef]
- Hanak, E.; Mount, J.; Chappelle, C.; Lund, J.; Medellín-Azuara, J.; Moyle, P.; Seavy, N. What If California’s Drought Continues? Public Policy Inst. Calif. 2015, 29, 16–23. [Google Scholar]
- Drought Year Water Actions. Available online: https://www.waterboards.ca.gov/waterrights/water_issues/programs/drought/pricing/ (accessed on 26 April 2019).
- Owen, D. Water and Taxes. UC Davis L. Rev. 2017, 50, 1559–1617. [Google Scholar]
- Koundouri, P.; Pashardes, P.; Hajispyrou, S. Household Demand and Welfare Implications of Water Pricing in Cyprus. Environ. Dev. Econ. 2002, 7, 659–685. [Google Scholar] [CrossRef]
- Nataraj, S. Do Residential Water Consumers React to Price Increases? Evidence from a Natural Experiment in Santa Cruz. Agric. Resour. Econ. Update 2007, 10, 9–11. [Google Scholar]
- Water Price. Available online: https://www.pub.gov.sg/watersupply/waterprice (accessed on 25 April 2019).
- Gaudin, S. Effect of price information on residential water demand. Appl. Econ. 2006, 38, 383–393. [Google Scholar] [CrossRef]

| Land Surface Factors | Input Variables | Formula or Description | References |
|---|---|---|---|
| Vegetation | Enhanced vegetation index (EVI) | 2.5 × ((NIR − Red)/(NIR + 6.0 × Red − 7.5 × Blue + 1) | [23,24,25] |
| Normalized difference vegetation index (NDVI) | (NIR − Red)/(NIR − Red) | [24,25,26] | |
| Soil-adjusted vegetation index (SAVI) | ((NIR − Red)/(NIR − Red + B)) × (1 + 0.5) | [24,25,27] | |
| Modified soil-adjusted vegetation Index (MSAVI) | (2 × NIR + 1 − sqrt((2 × NIR + 1)2 − 8 × (NIR − Red)))/2 | [25,28] | |
| Topography | Topographic wetness index (TWI) | Ln (α/tan β) 1 | [29] |
| Slope | Degree of slope | [30,31] | |
| Aspect | Degree of aspect | [30,32] | |
| Water | Normalized difference moisture index (NDMI) | (NIR − SWIR1)/(NIR + SWIR1) | [25,33] |
| Modification of normalized difference water index (MNDWI) | (Green − SWIR1)/(Green + SWIR1) | [34] | |
| Moisture stress index (MSI) | MidIR/NIR | [35] | |
| Thermal | Near infrared (NIR) | 0.851–0.879 μm | [36] |
| Short-wavelength infrared 1 (SWIR1) | 1.566–1.651 μm | [36] | |
| Short-wavelength infrared 2 (SWIR2) | 2.107–2.294 μm | [36] | |
| Thermal infrared sensor 1 (TIRS1) | 10.60–11.19 μm | [36] | |
| Thermal infrared sensor 2 (TIRS2) | 11.50–12.51 μm | [36] |
| Variable | Type | Equation |
|---|---|---|
| Daily water usage per person | Level | water usage per day + (-) water saving effort initial value = 48.60 gallon 1 |
| Monthly water usage per person 2 | Auxiliary | water usage per day × 30 days × 0.003785 |
| Billing | Auxiliary | fixed fee + (monthly water usage × billing rate) |
| Billing rate | Constant | Base = 0.92, Plan 1 = 1.10, Plan 2 = 1.28, Plan 3 = 1.46 (Unit: USD/m3) |
| Fixed fee | Constant | 1.50 USD |
| Recognition of increase water price | Auxiliary | whether (desired billing < current billing) |
| Desired billing 3 | Constant | 6.63 USD/person per month |
| Price elasticity of water demand | Constant | −0.175 |
| Water saving effort | Auxiliary | 4 the water demand changes rate (%) × water usage per day |
| Population 5 | Constant | 7,969,432 |
| Monthly water usage per local | Auxiliary | Monthly Water Usage per person × Population |
| Policy (Unit: Gallon) | One Month | Two Months | Three Months | Cumulative Amount |
|---|---|---|---|---|
| Plan 1 | 0 | 63,290 | 253,160 | 316,450 |
| Plan 2 | 63,290 | 189,870 | 443,030 | 696,190 |
| Plan 3 | 63,290 | 316,450 | 822,771 | 1,202,511 |
© 2019 by the authors. Licensee MDPI, Basel, Switzerland. This article is an open access article distributed under the terms and conditions of the Creative Commons Attribution (CC BY) license (http://creativecommons.org/licenses/by/4.0/).
Share and Cite
Park, H.; Lee, D.K. Is Water Pricing Policy Adequate to Reduce Water Demand for Drought Mitigation in Korea? Water 2019, 11, 1256. https://doi.org/10.3390/w11061256
Park H, Lee DK. Is Water Pricing Policy Adequate to Reduce Water Demand for Drought Mitigation in Korea? Water. 2019; 11(6):1256. https://doi.org/10.3390/w11061256
Chicago/Turabian StylePark, Haekyung, and Dong Kun Lee. 2019. "Is Water Pricing Policy Adequate to Reduce Water Demand for Drought Mitigation in Korea?" Water 11, no. 6: 1256. https://doi.org/10.3390/w11061256
APA StylePark, H., & Lee, D. K. (2019). Is Water Pricing Policy Adequate to Reduce Water Demand for Drought Mitigation in Korea? Water, 11(6), 1256. https://doi.org/10.3390/w11061256


