Non-Stationary Bayesian Modeling of Annual Maximum Floods in a Changing Environment and Implications for Flood Management in the Kabul River Basin, Pakistan


Abstract
1. Introduction
2. Study Area and Data Description
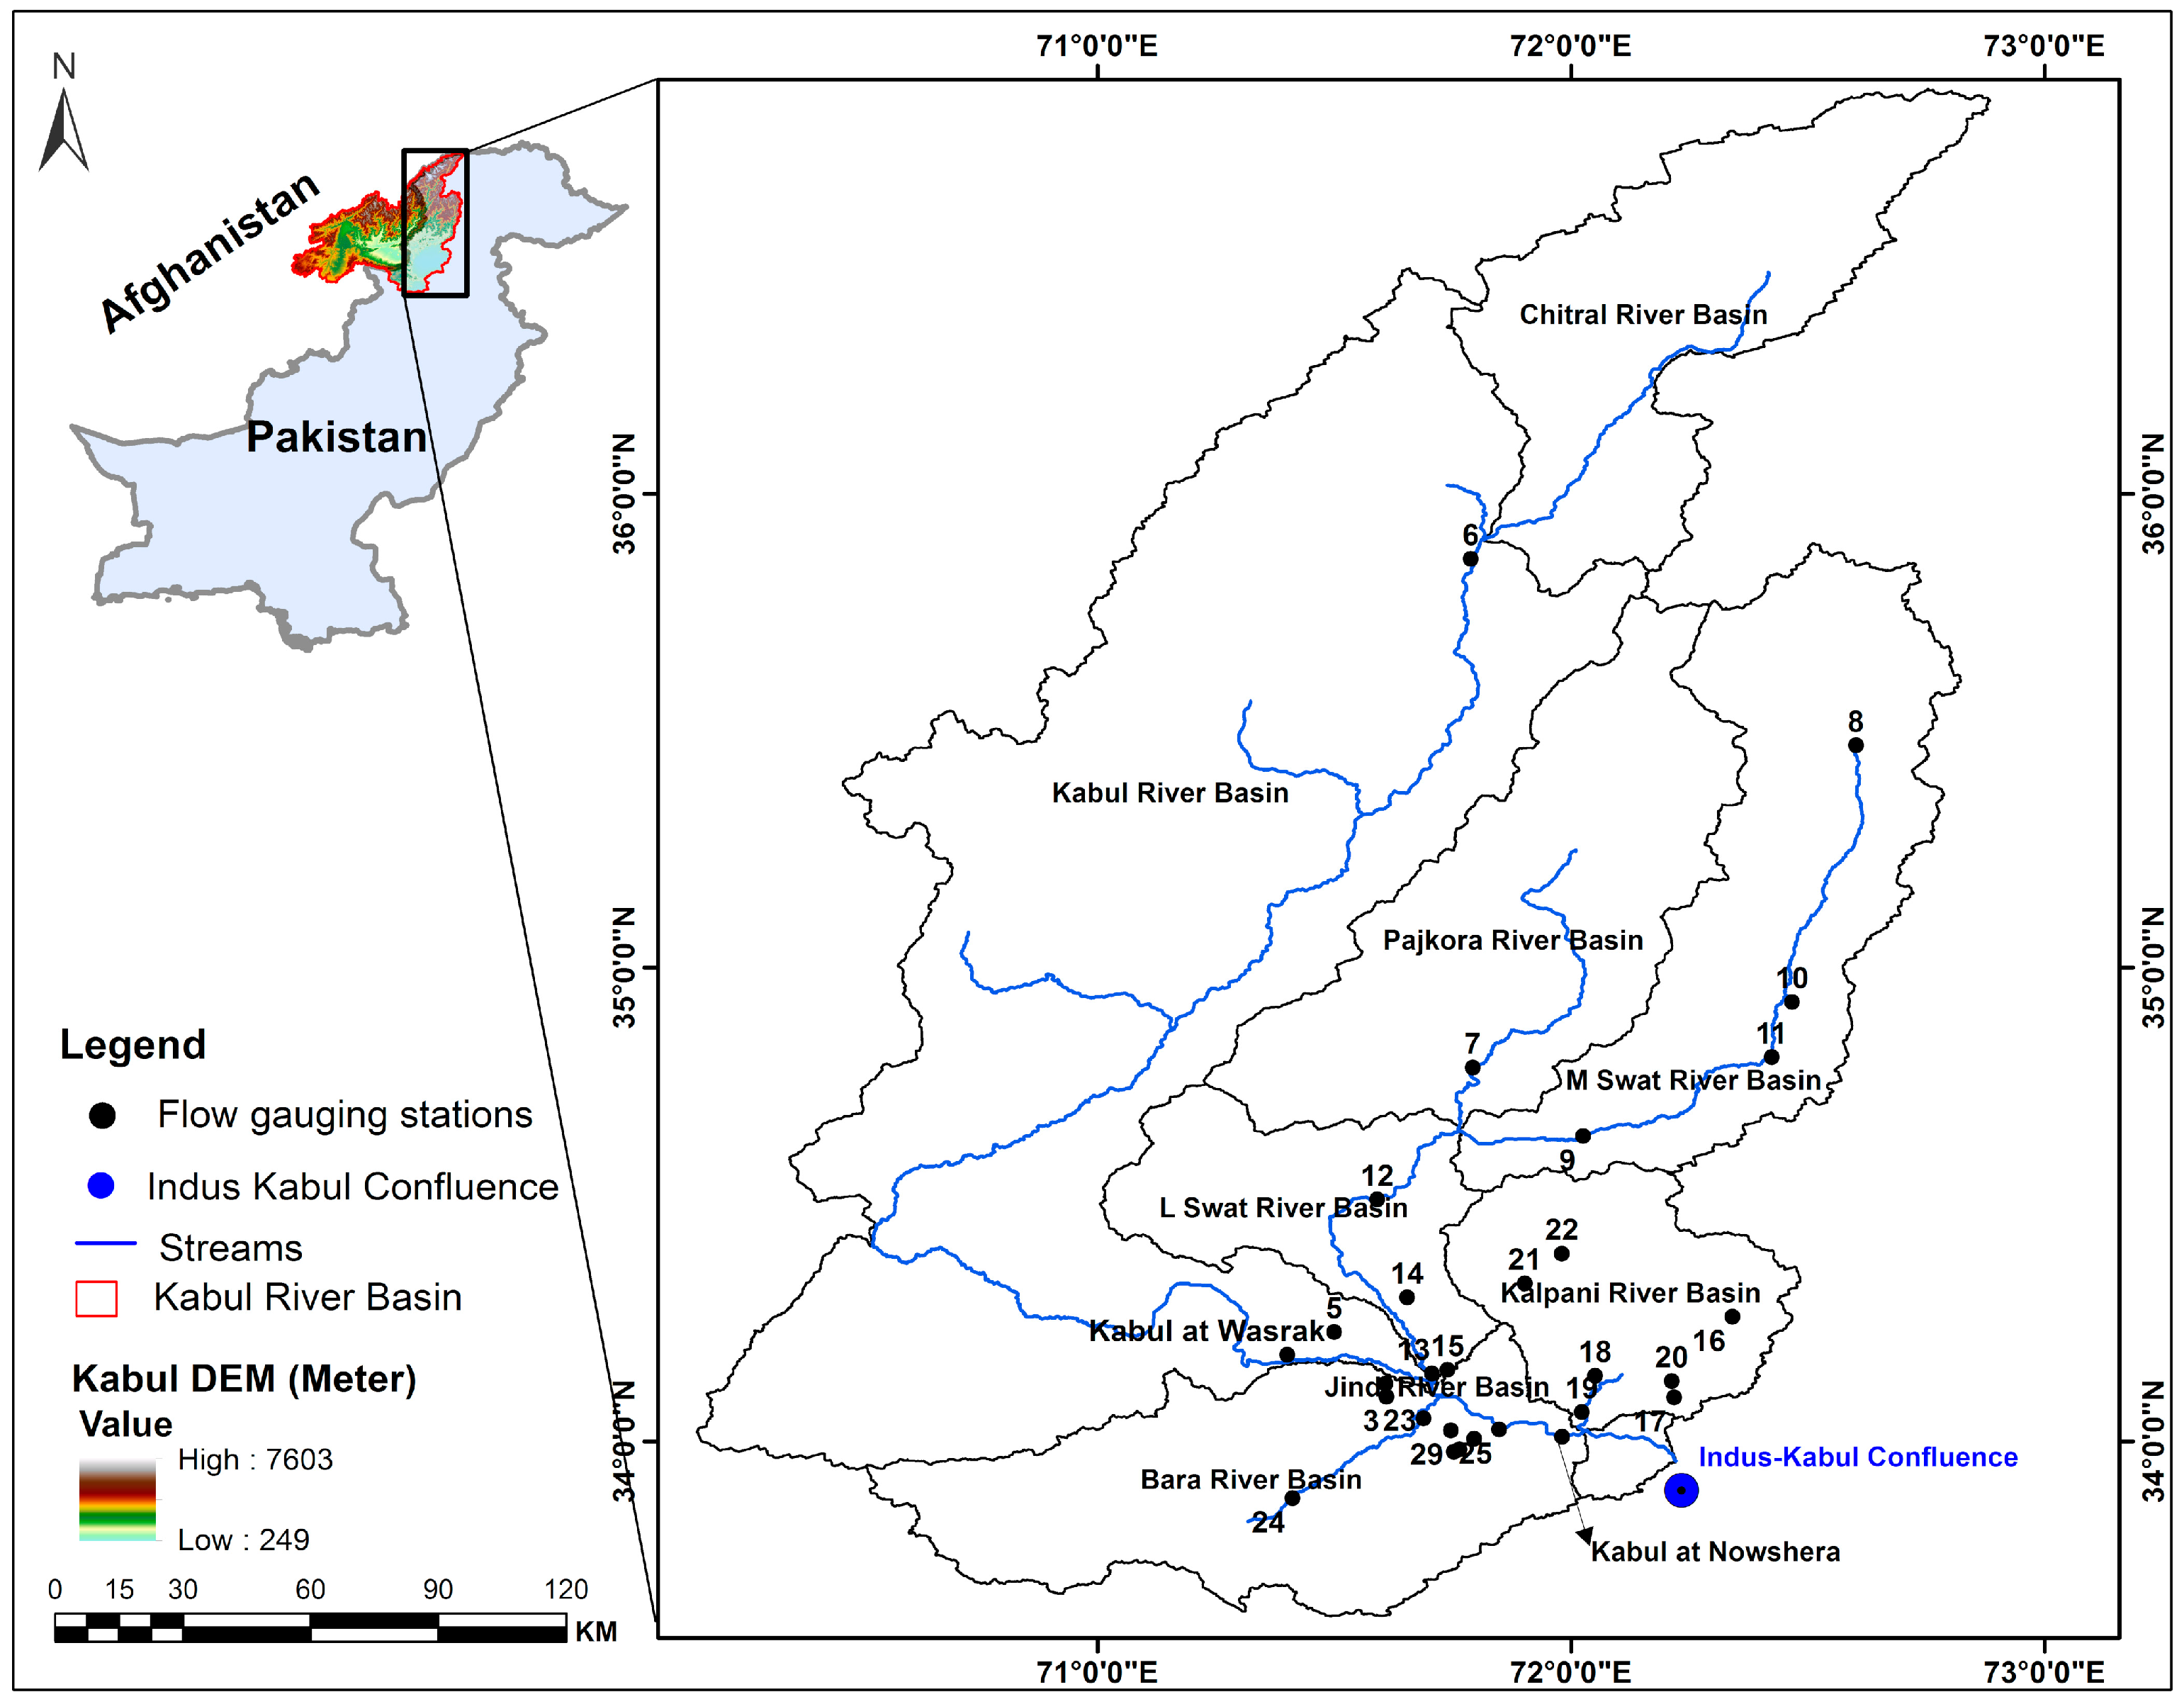
2.1. Study Area
2.2. Flood Data
2.3. Flood Generating Mechanism in KRB
3. Methods
3.1. Preliminary Analysis
3.1.1. Trend Analysis
3.1.2. Selection of Extreme Value Distribution
3.1.3. Goodness of Fit Statistics to GEV Distribution
3.2. Model Design
- (1)
- Stationary Case: all the model parameters were considered constant.
- (2)
- Non-stationary Case: the location parameter (µ) was considered a function of time, as shown in Equation (4), while scale and shape parameters were kept constant:where t is time, θ = (µ1, µ0) are the regression parameters [50,57,58,59,60]. The location parameter was calculated for each study site in the stationary case and non-stationary case.
3.2.1. Bayes Theorem for GEV Distribution
3.2.2. Prior Distribution
3.2.3. Parameters Estimation and Convergence Criterion
3.2.4. Model Evaluation
4. Results and Discussion
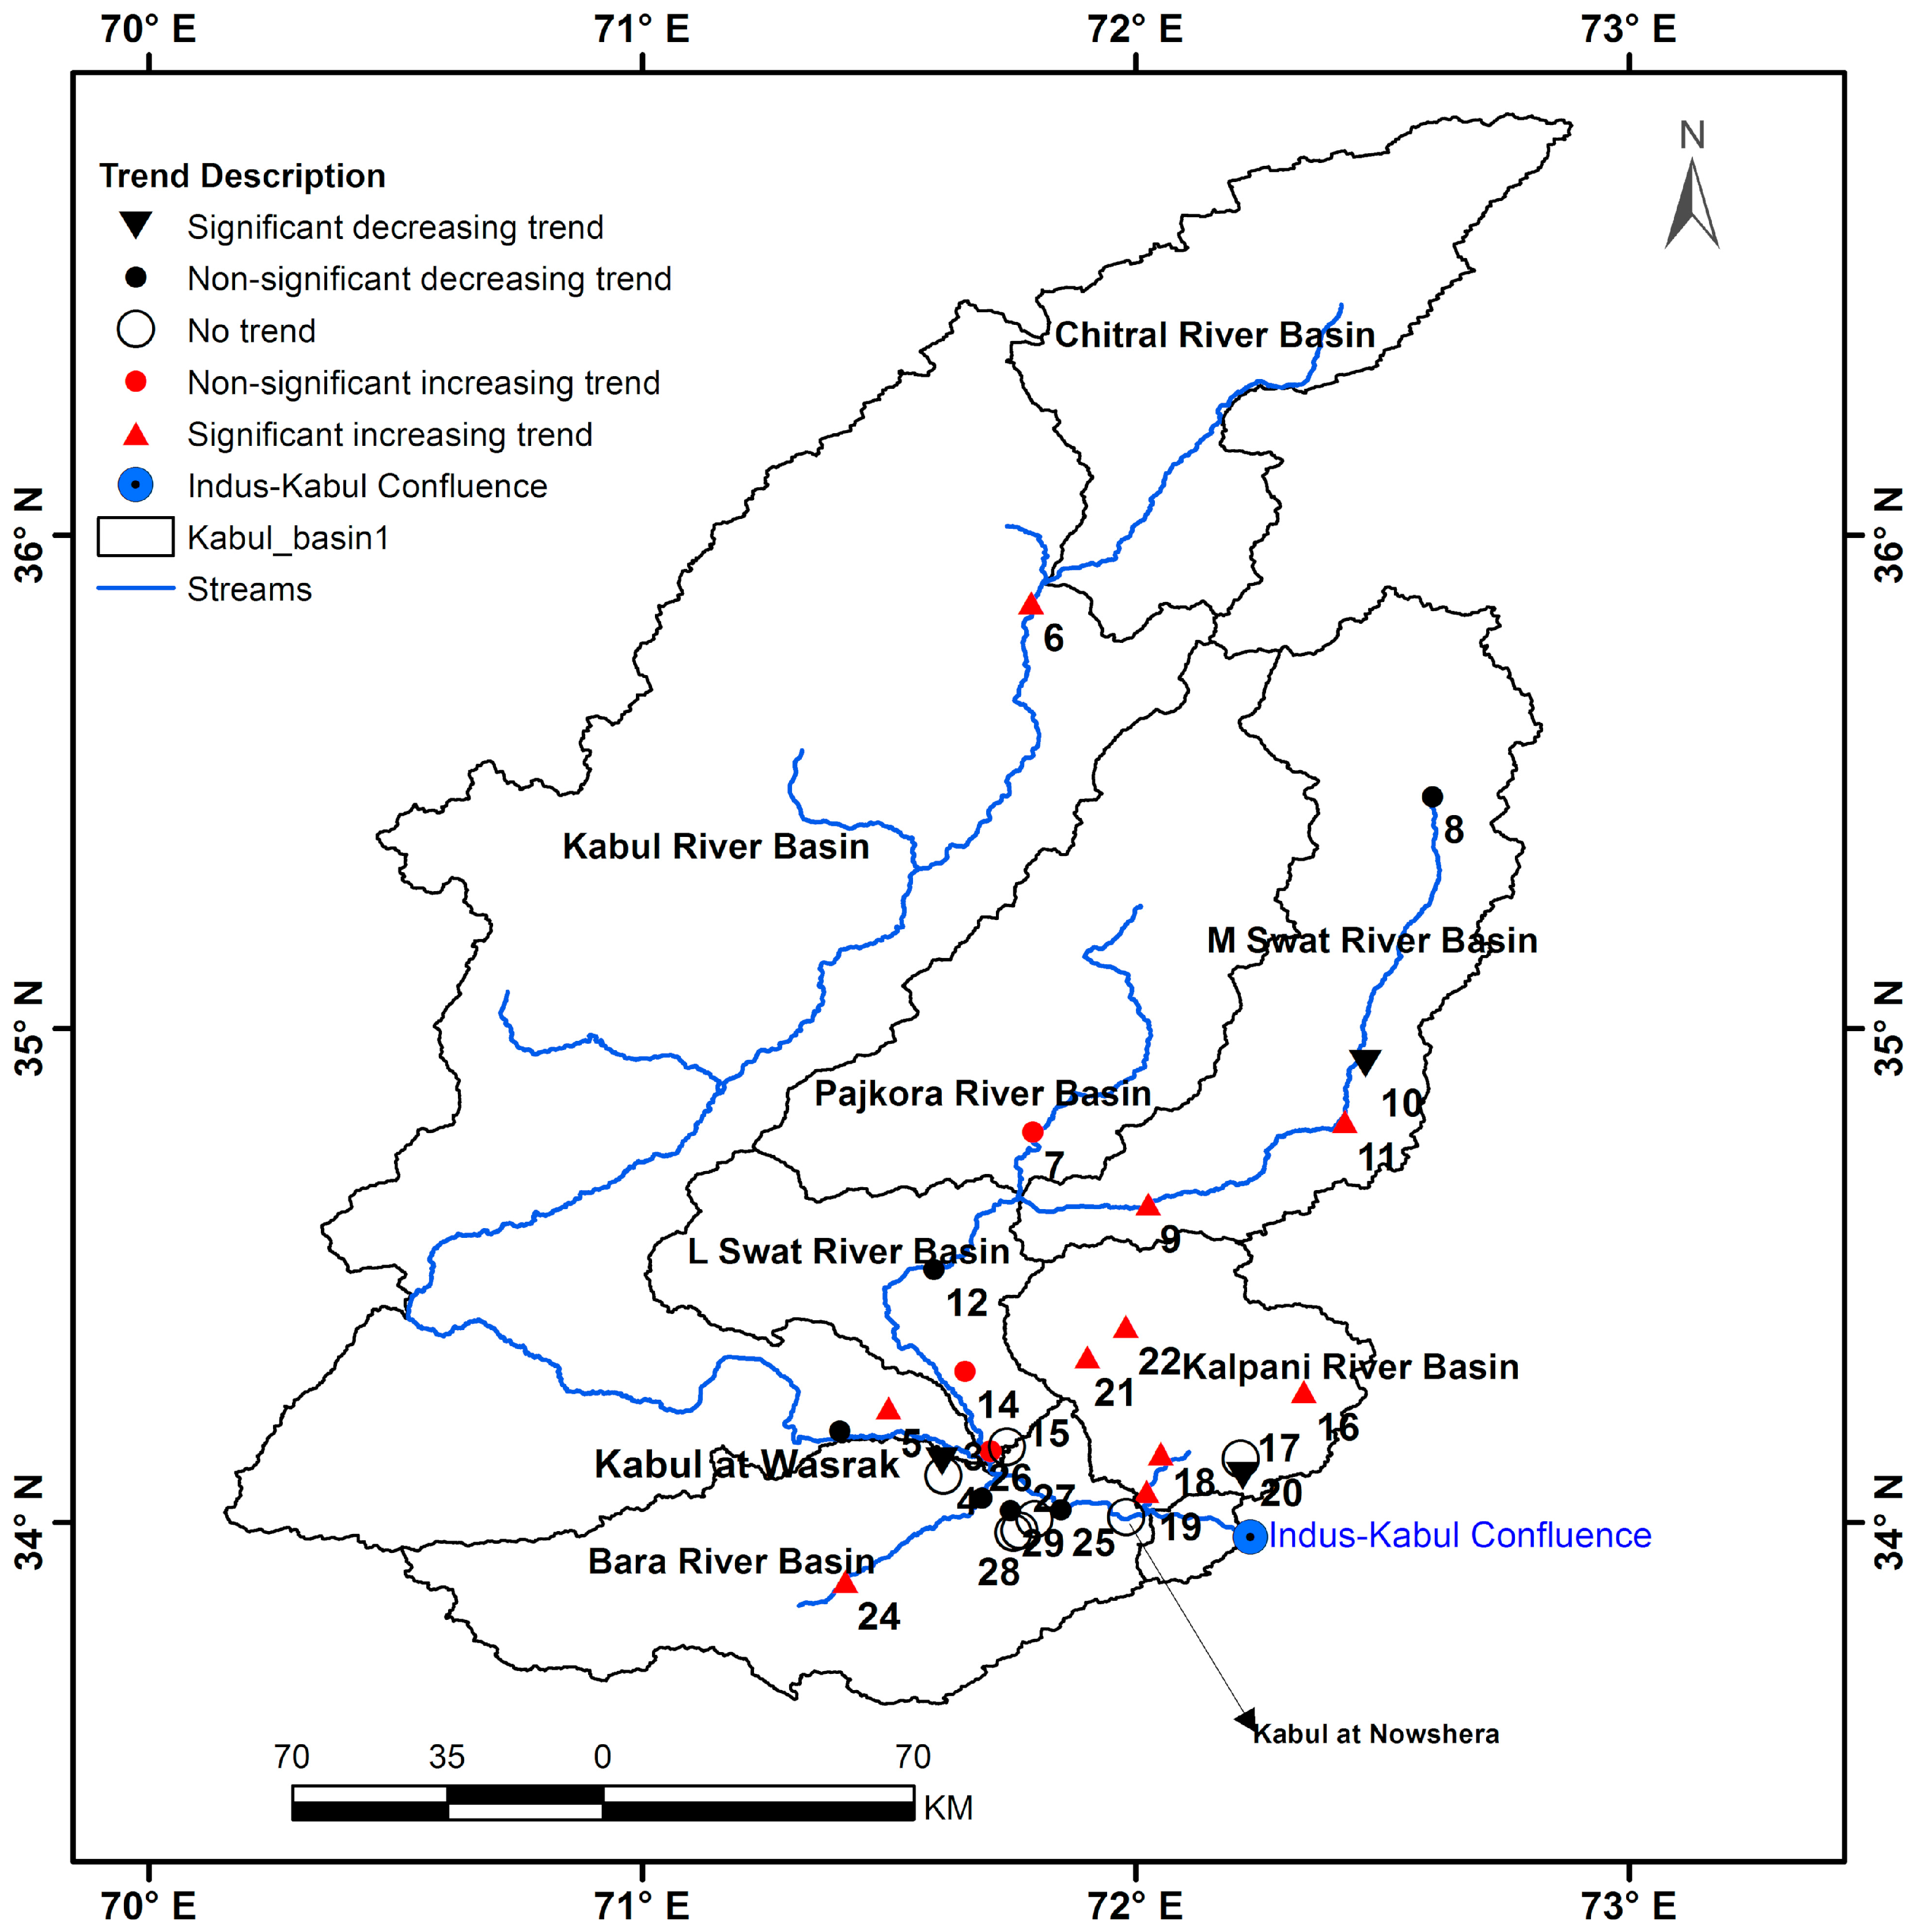
4.1. Temporal and Spatial Trends in Flood Regime
4.2. Evaluation of Goodness of Fit for Annual Extreme Data of Flood
4.3. Regionalization of Shape Parameter for Flash Floods Across the KRB
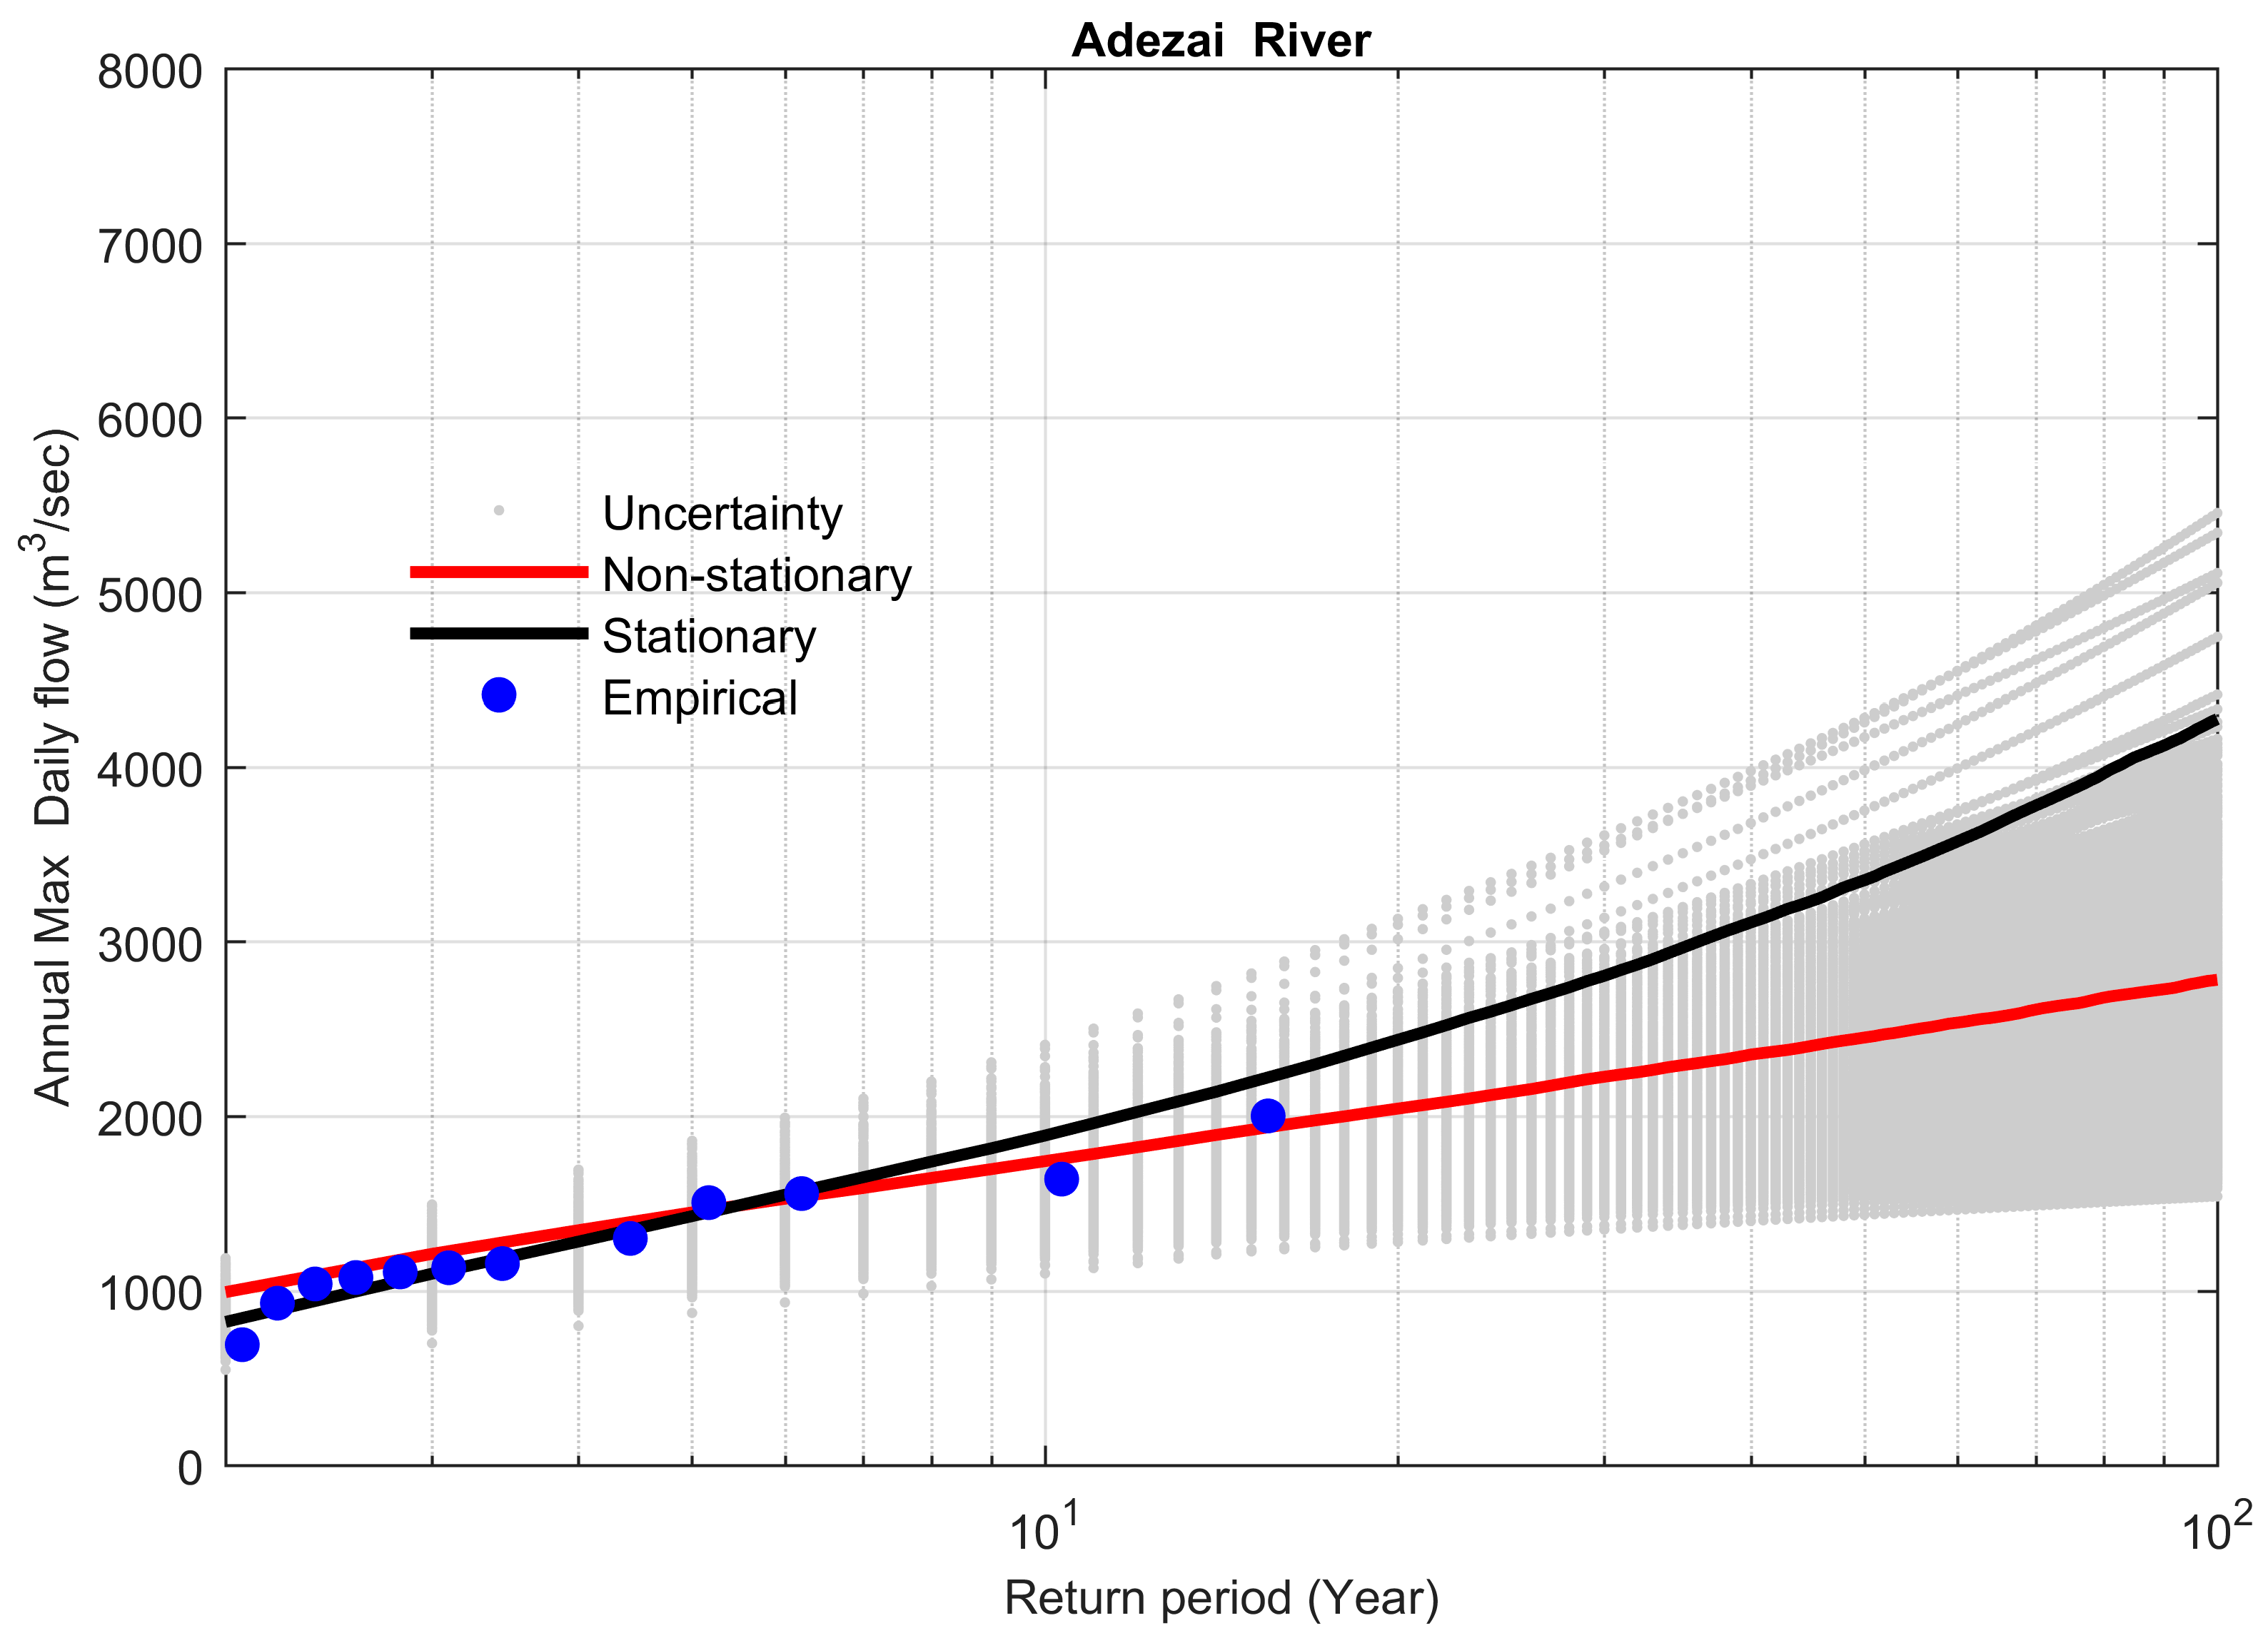
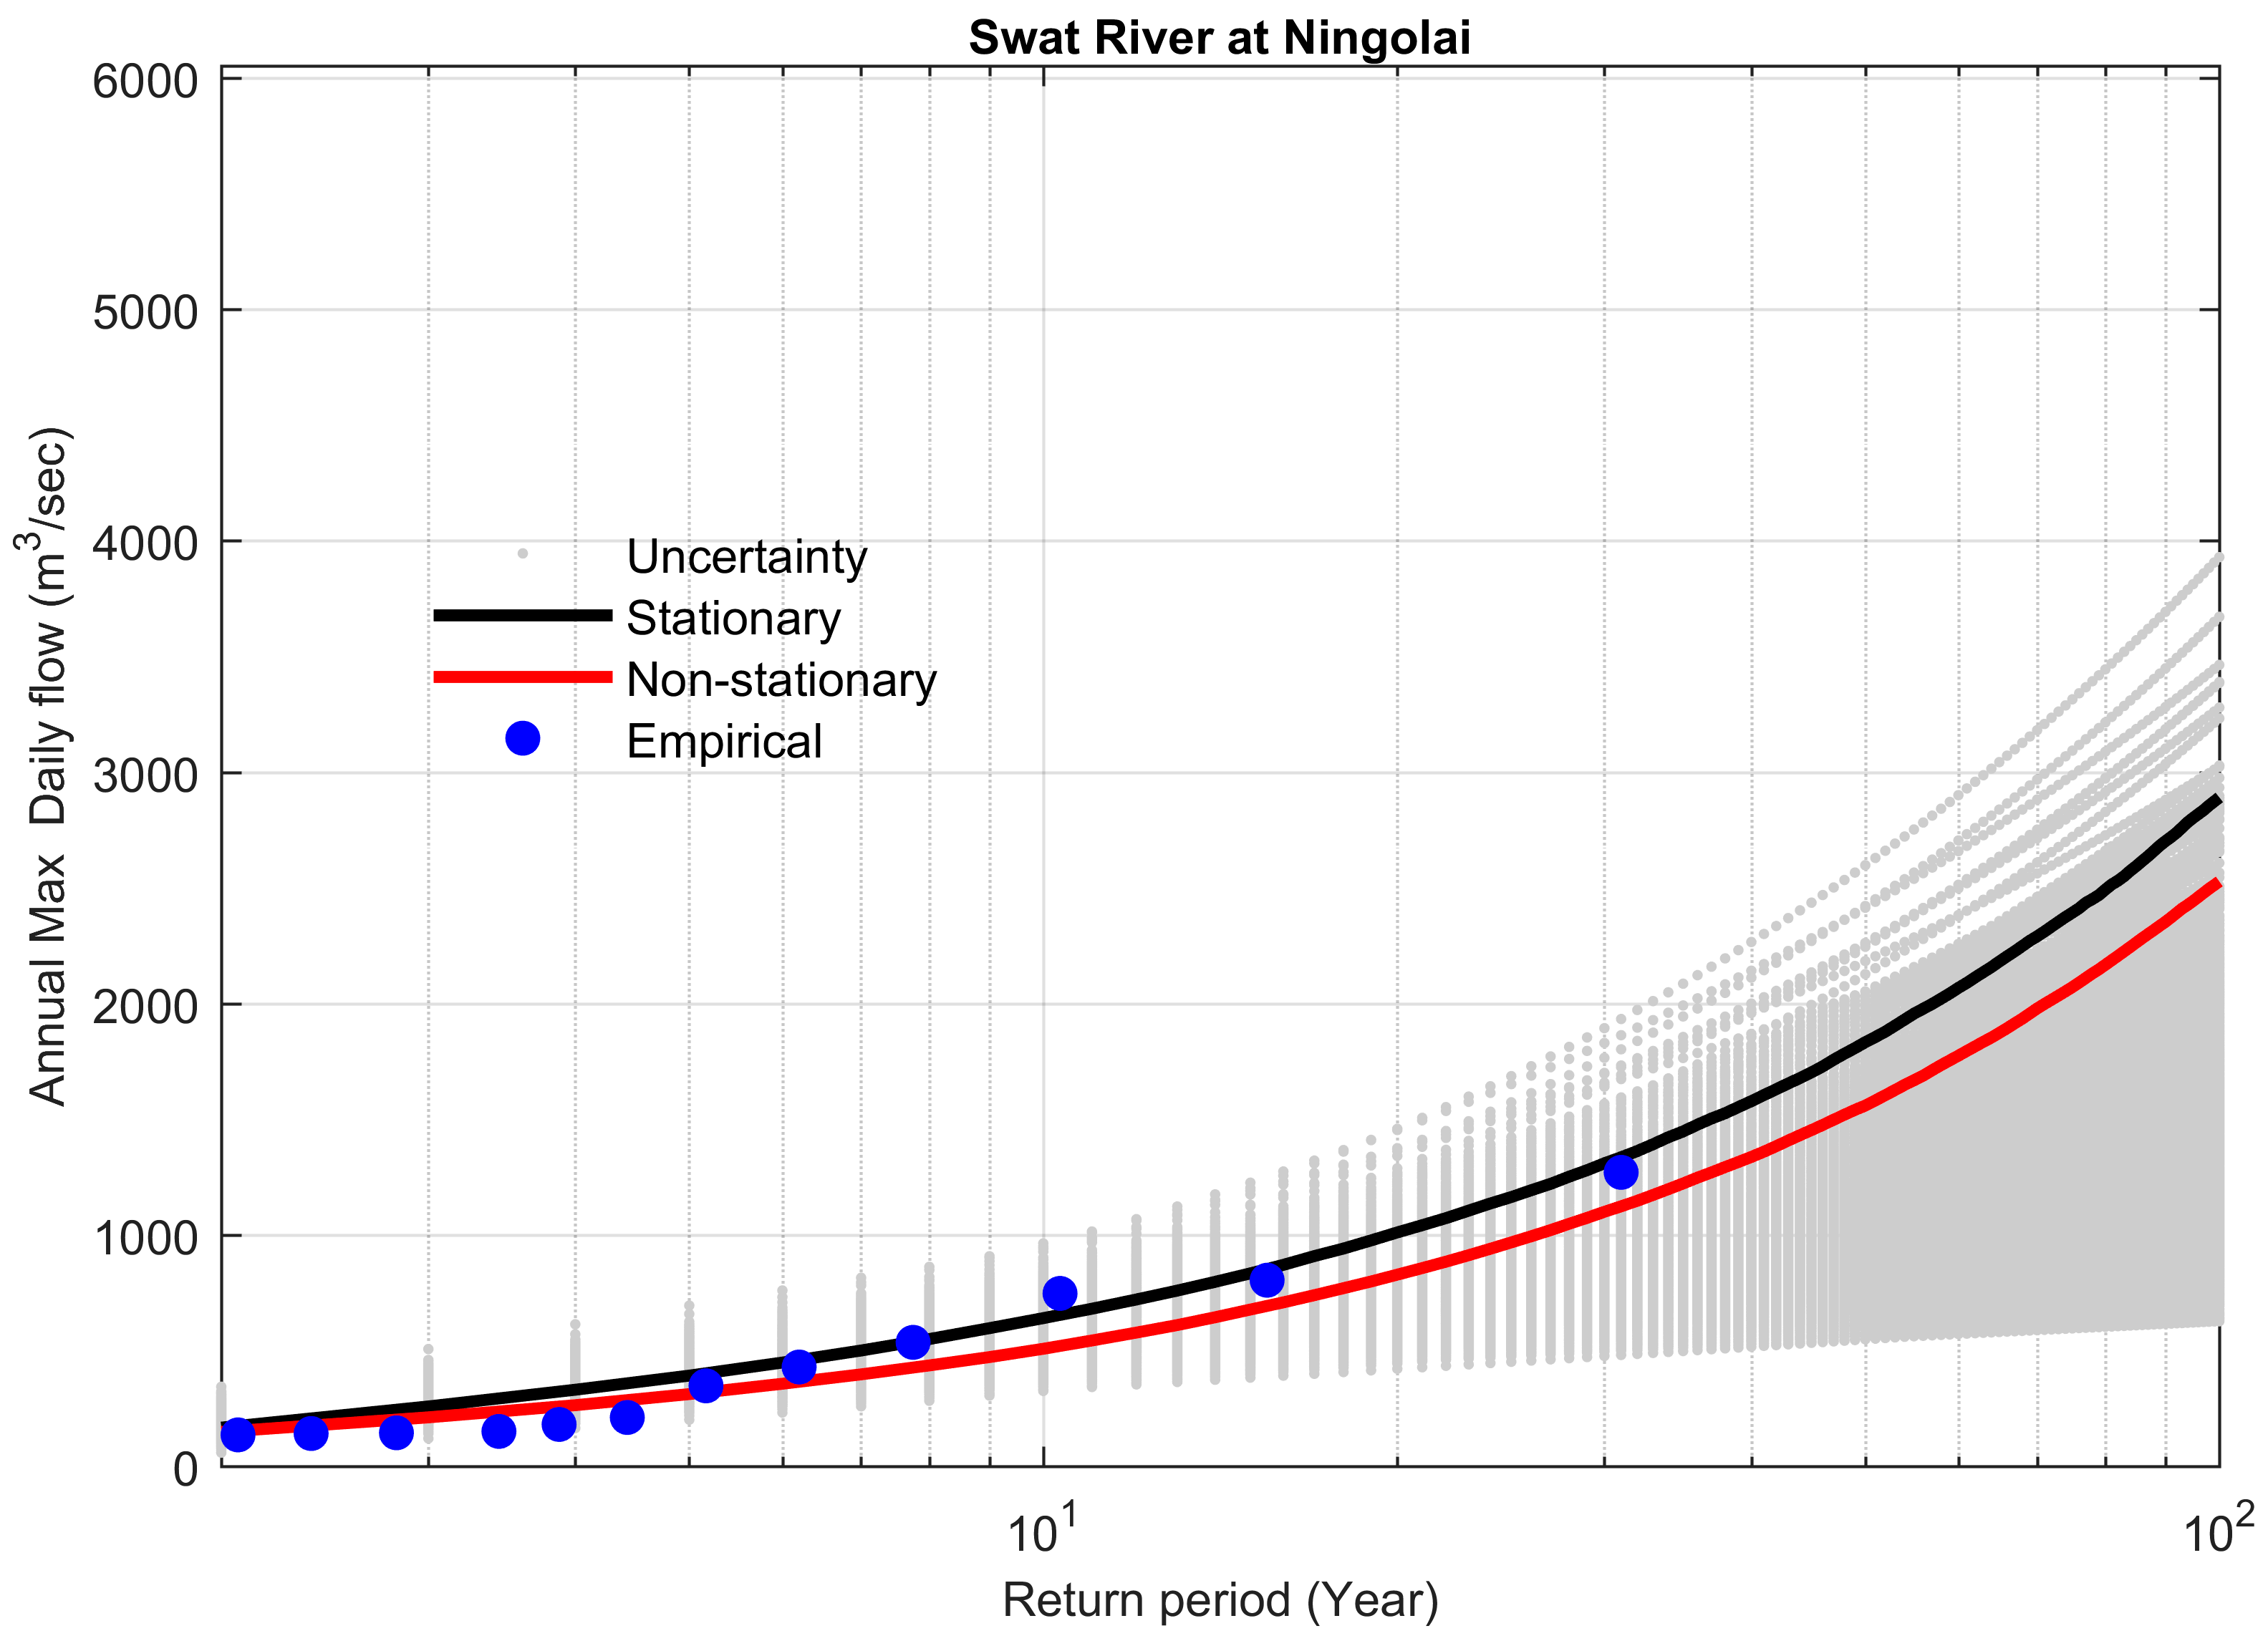
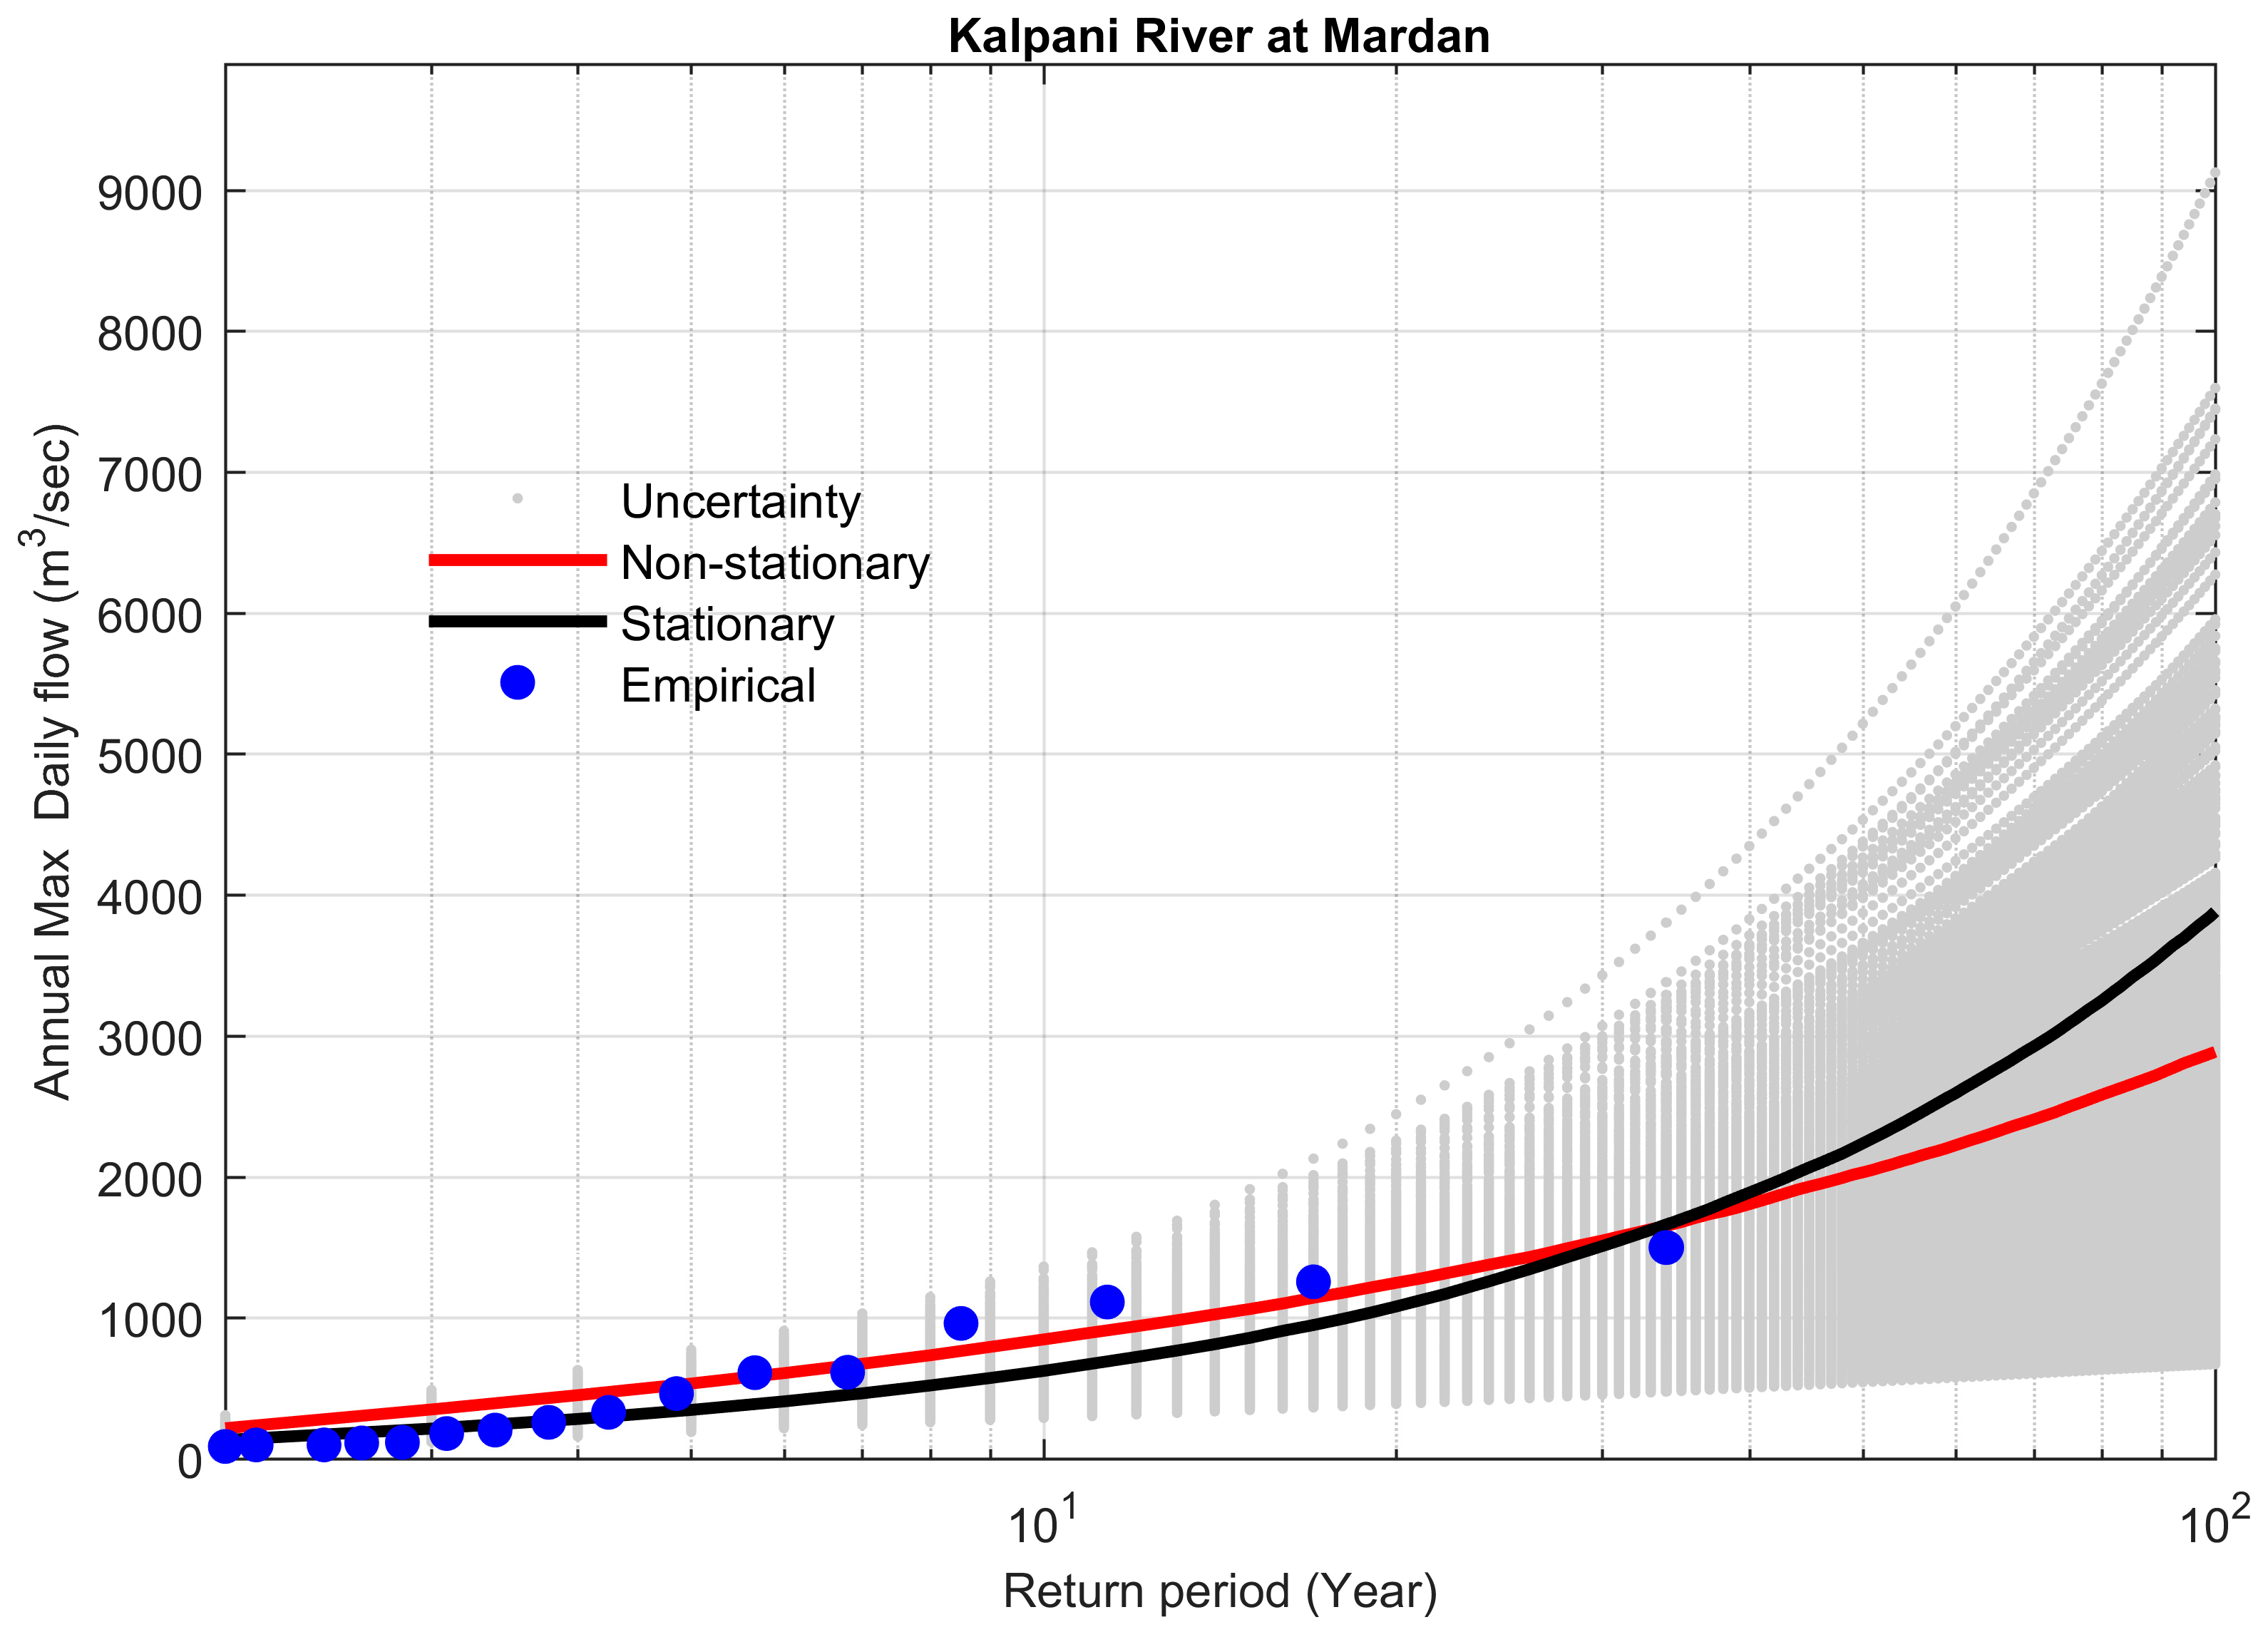
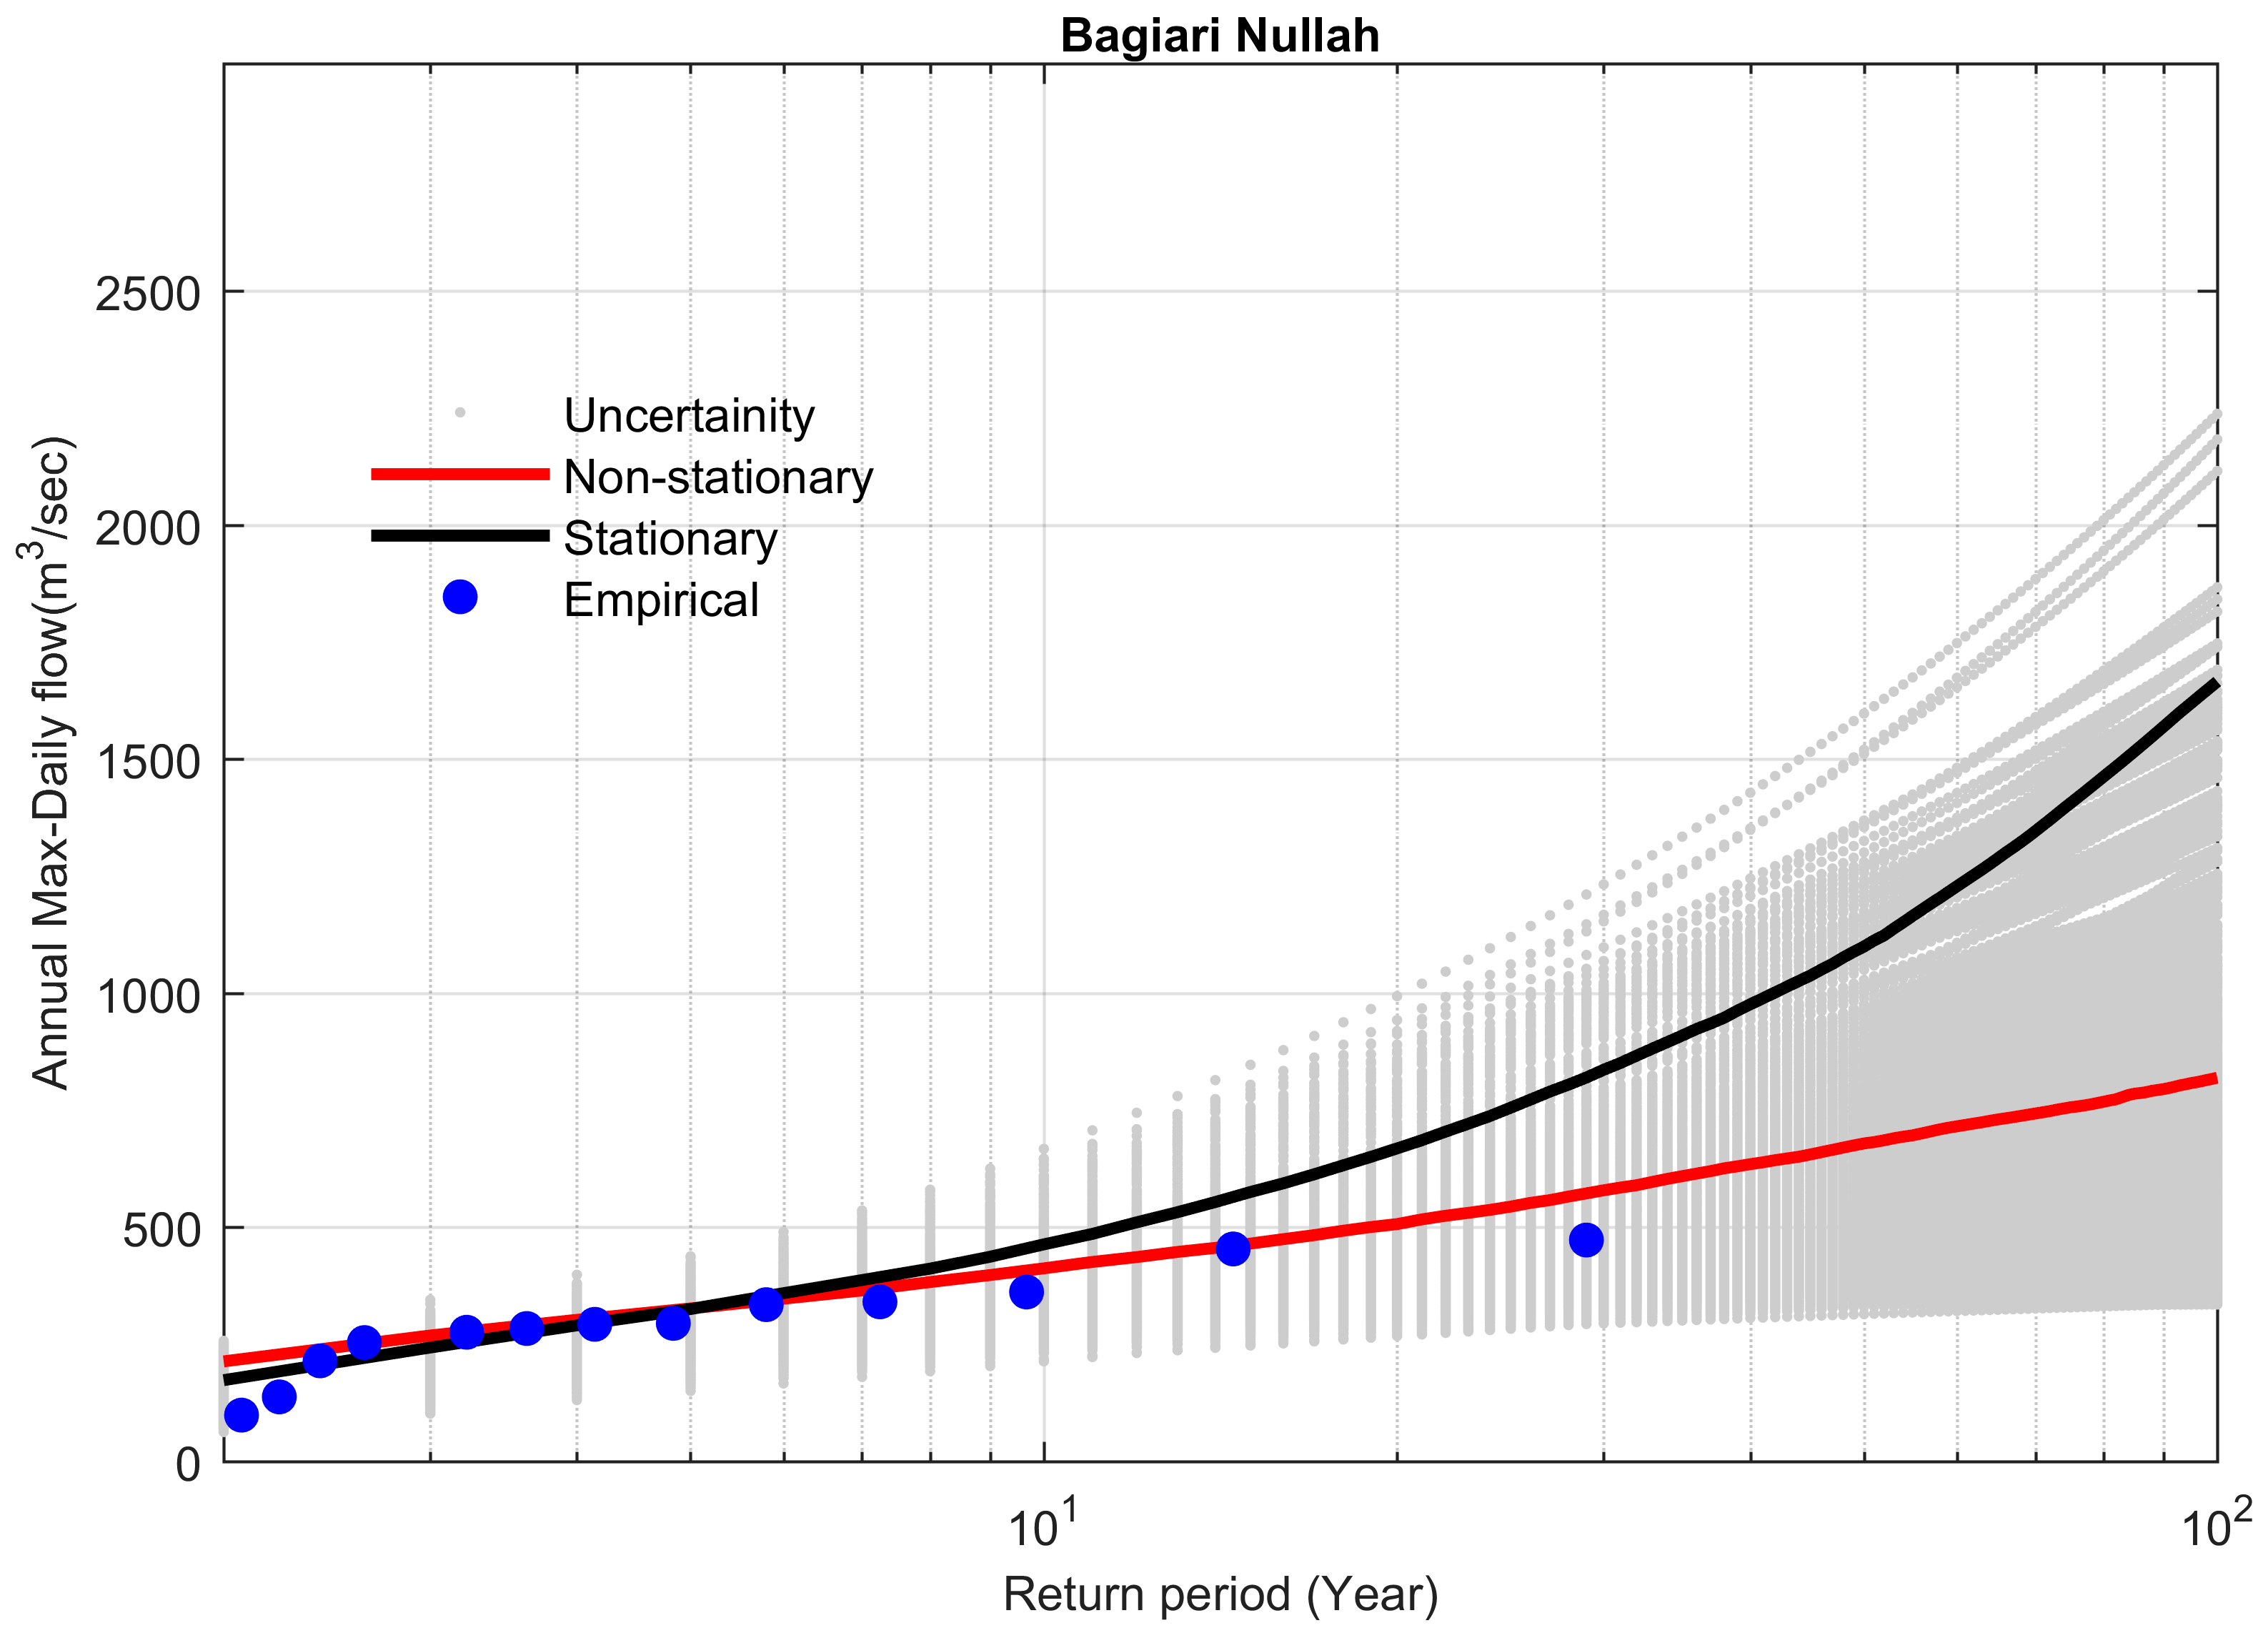
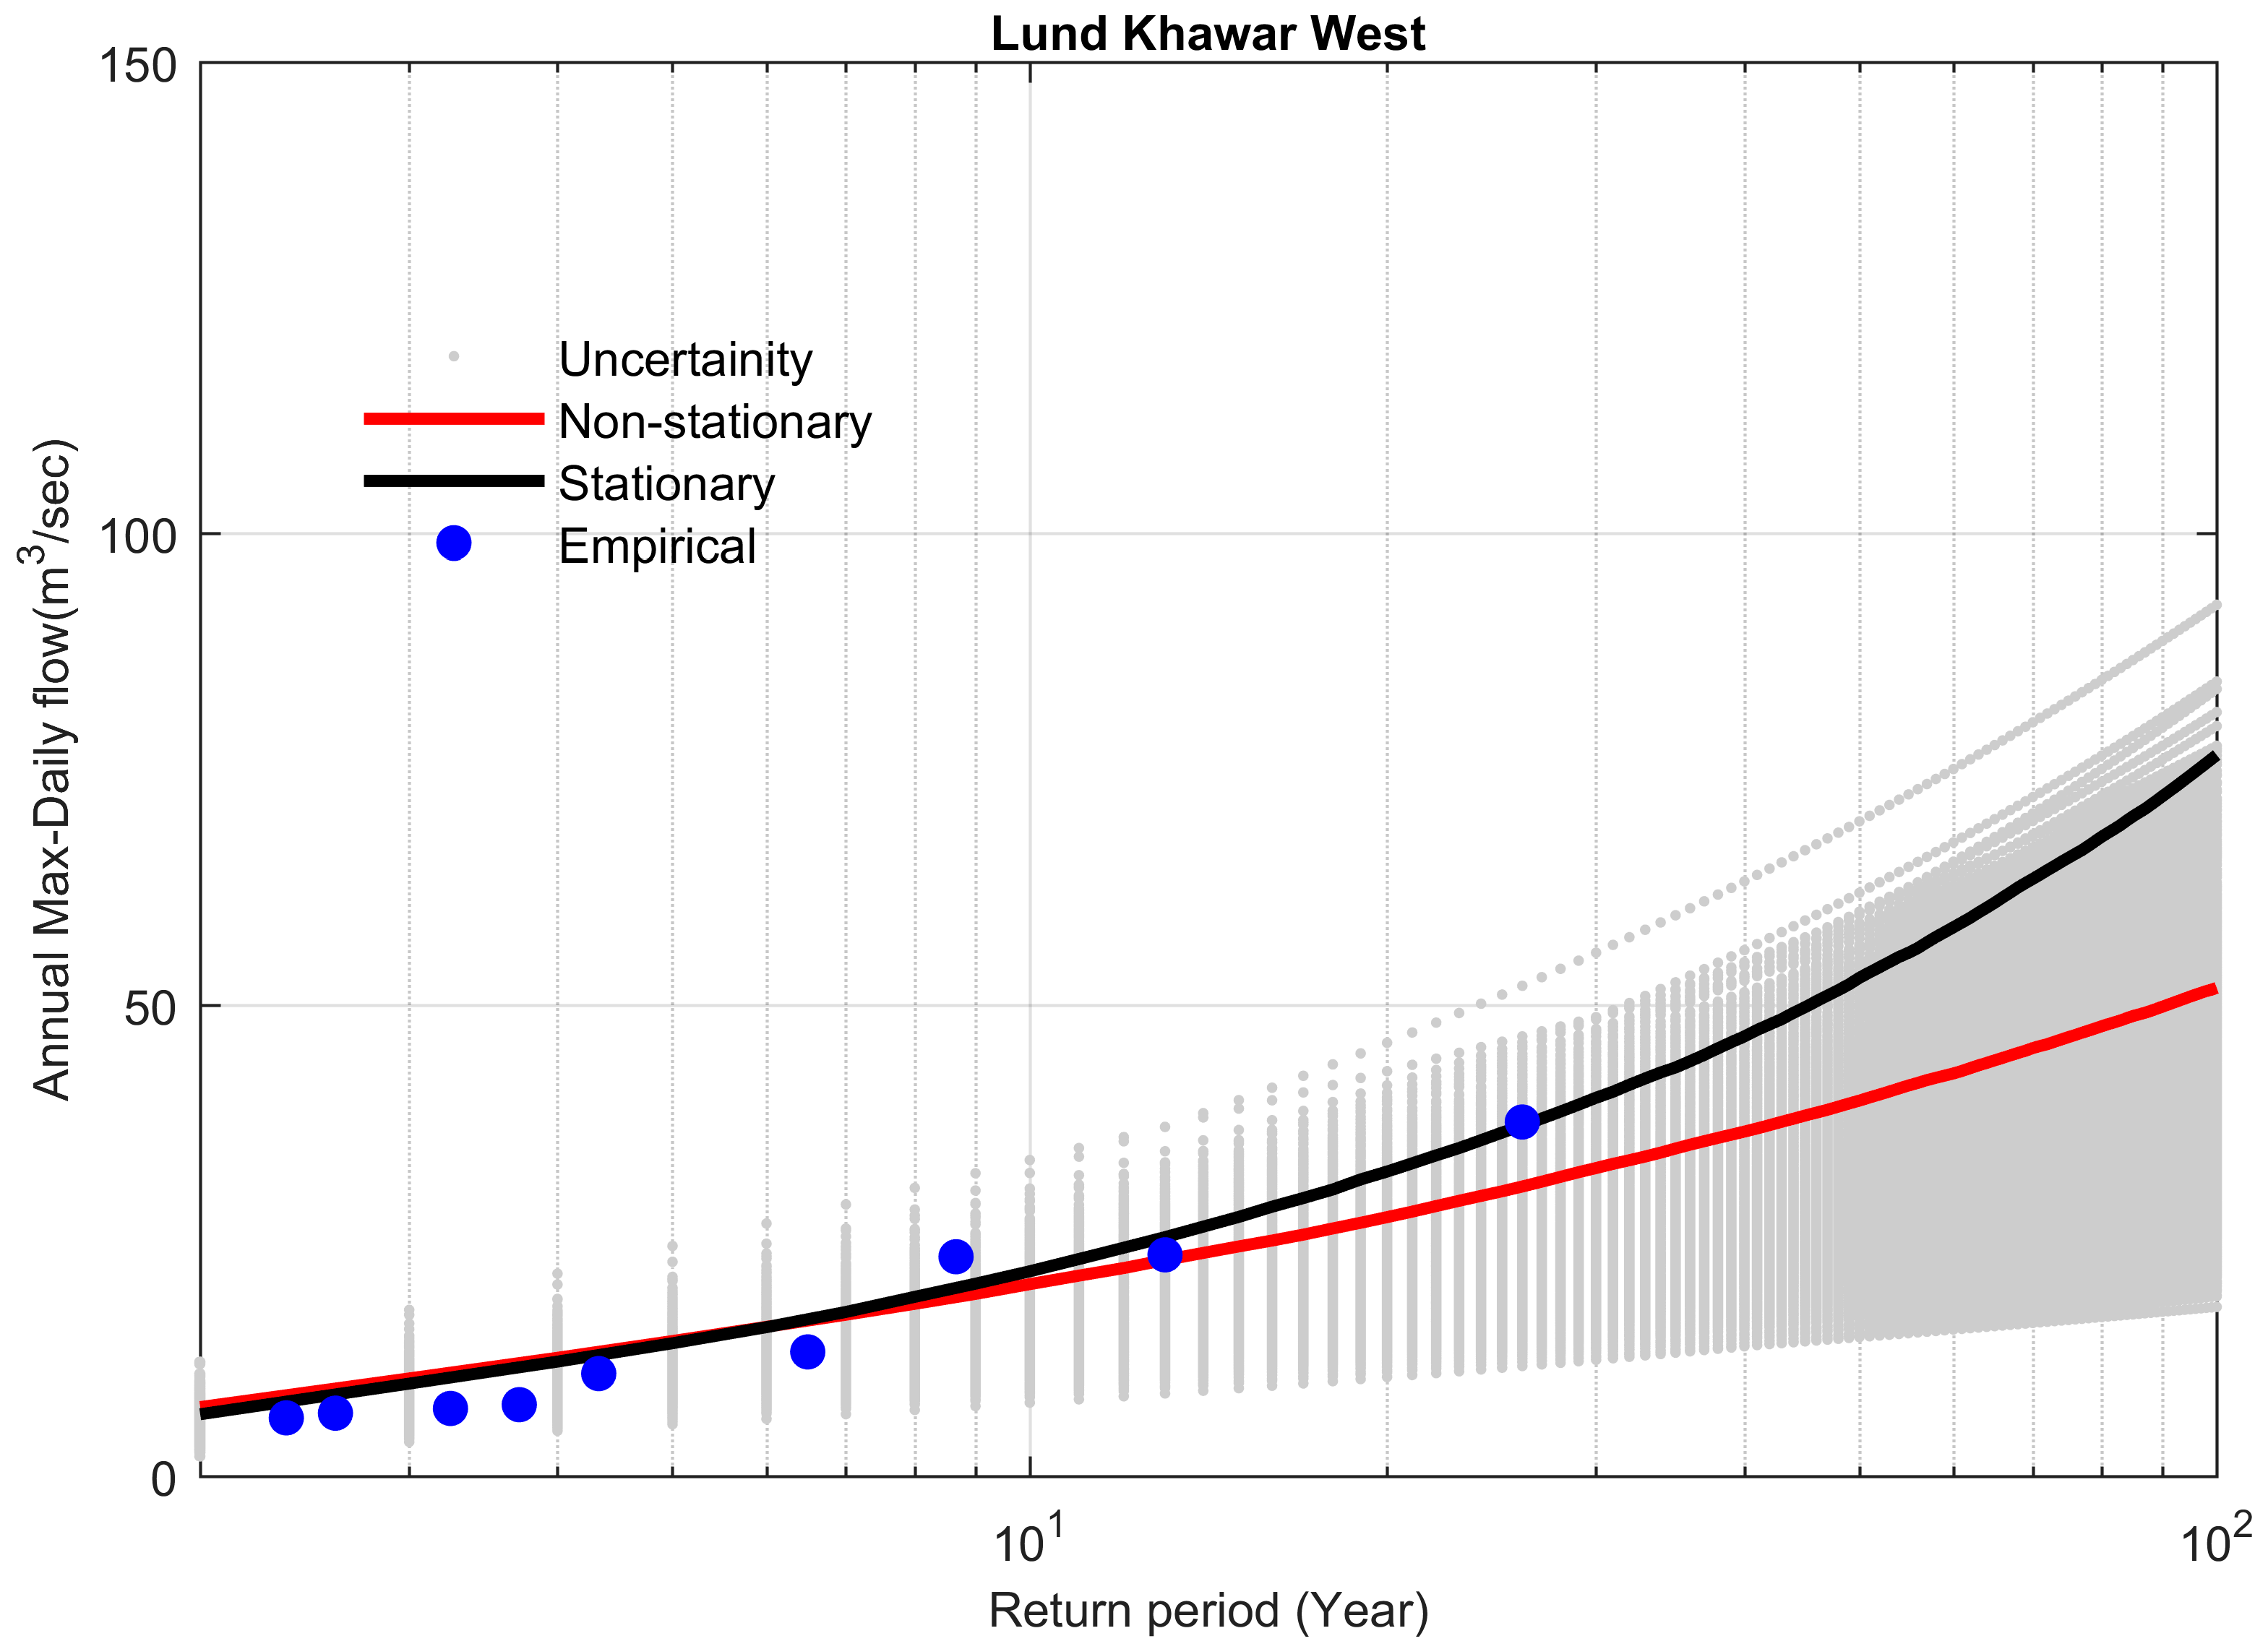
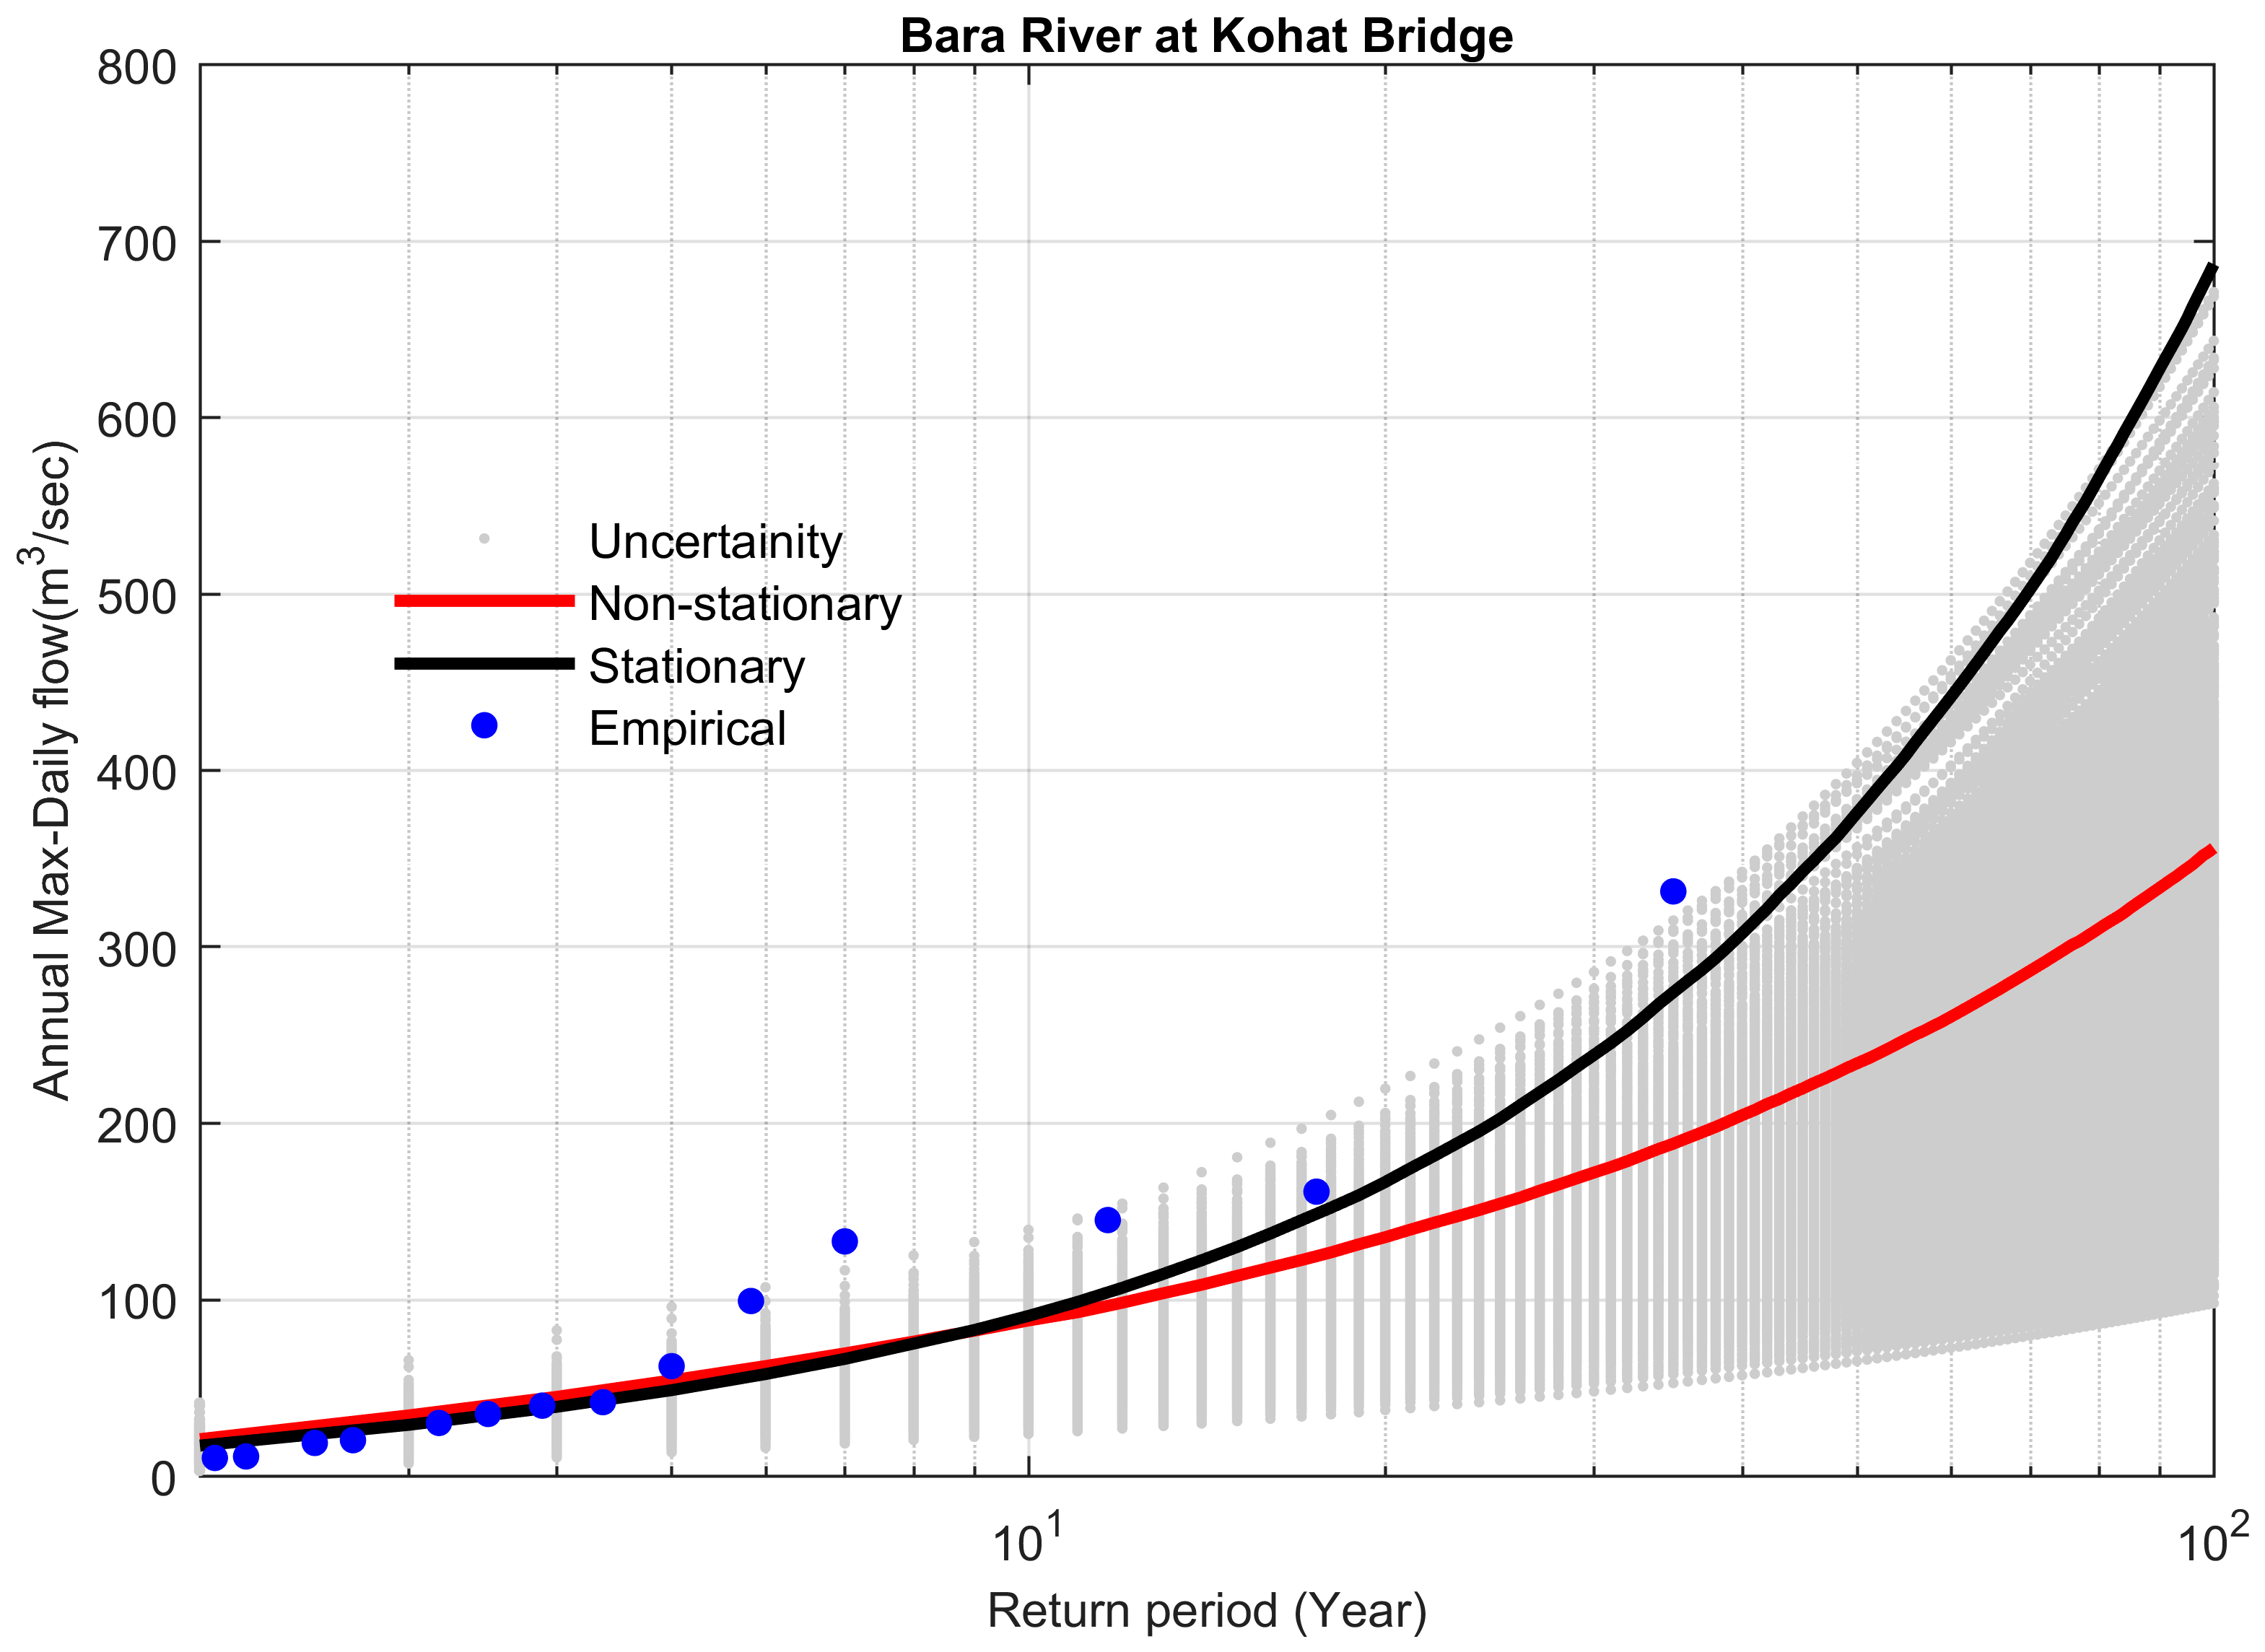
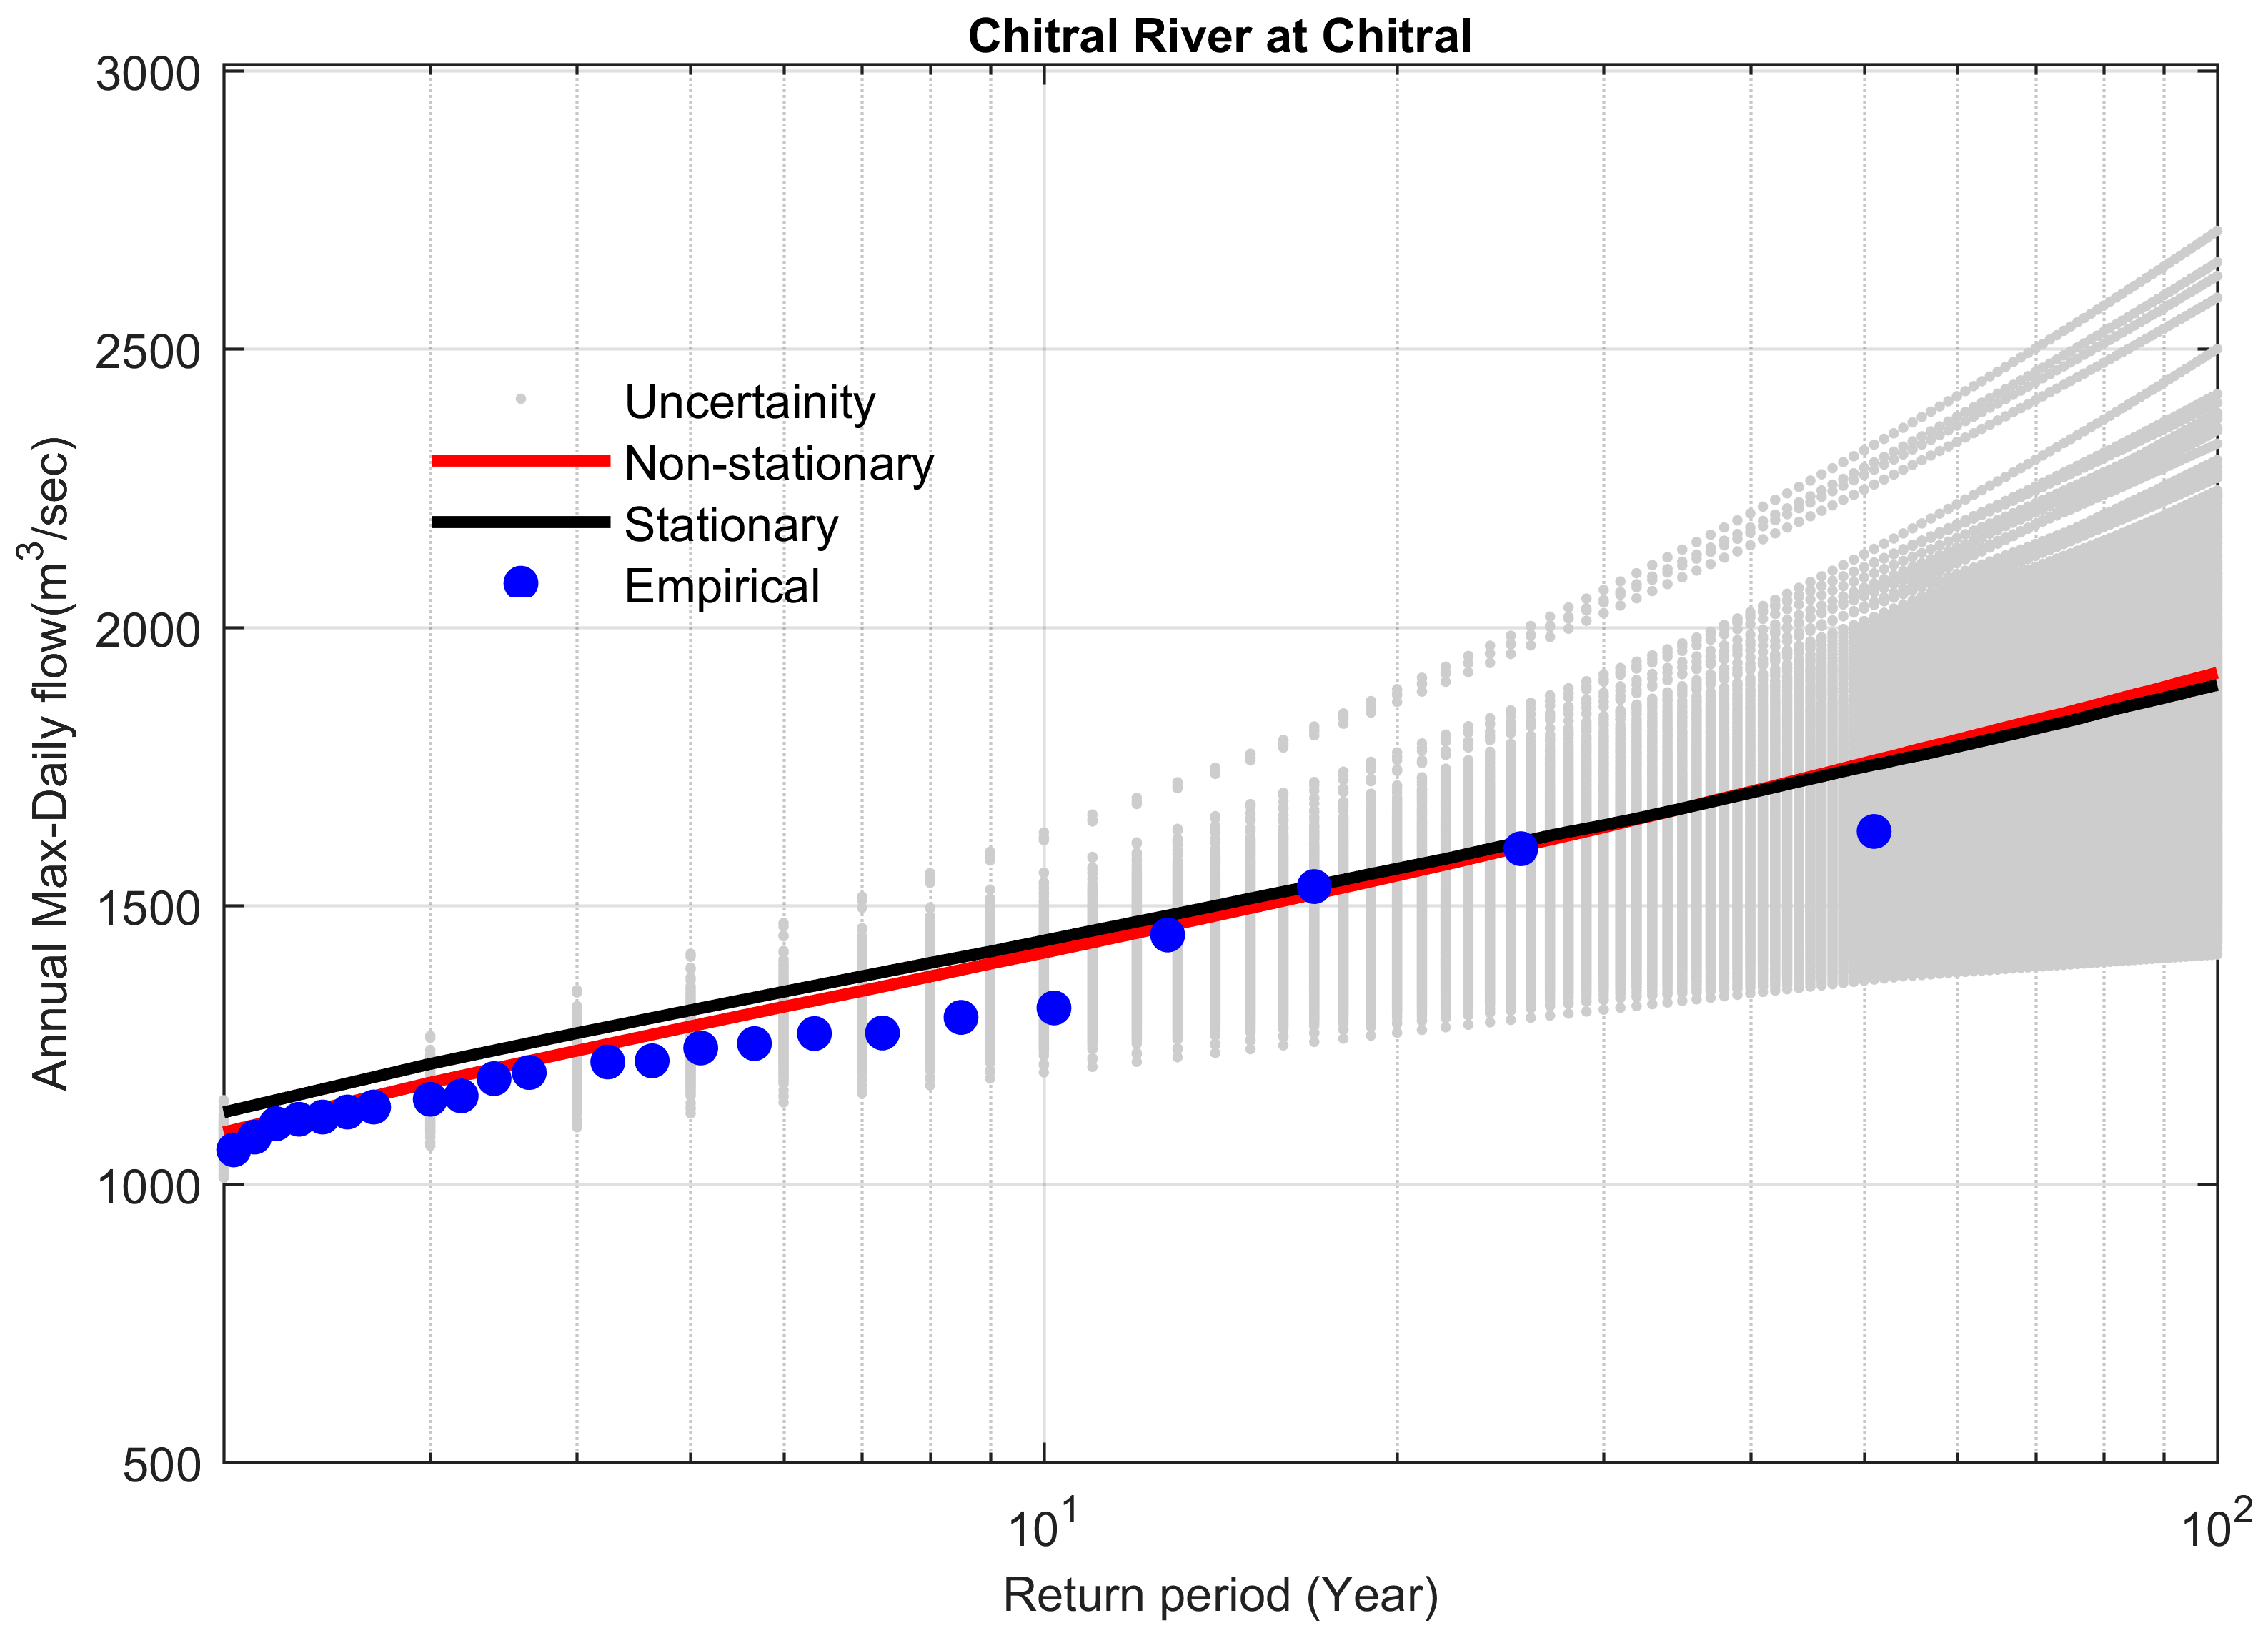
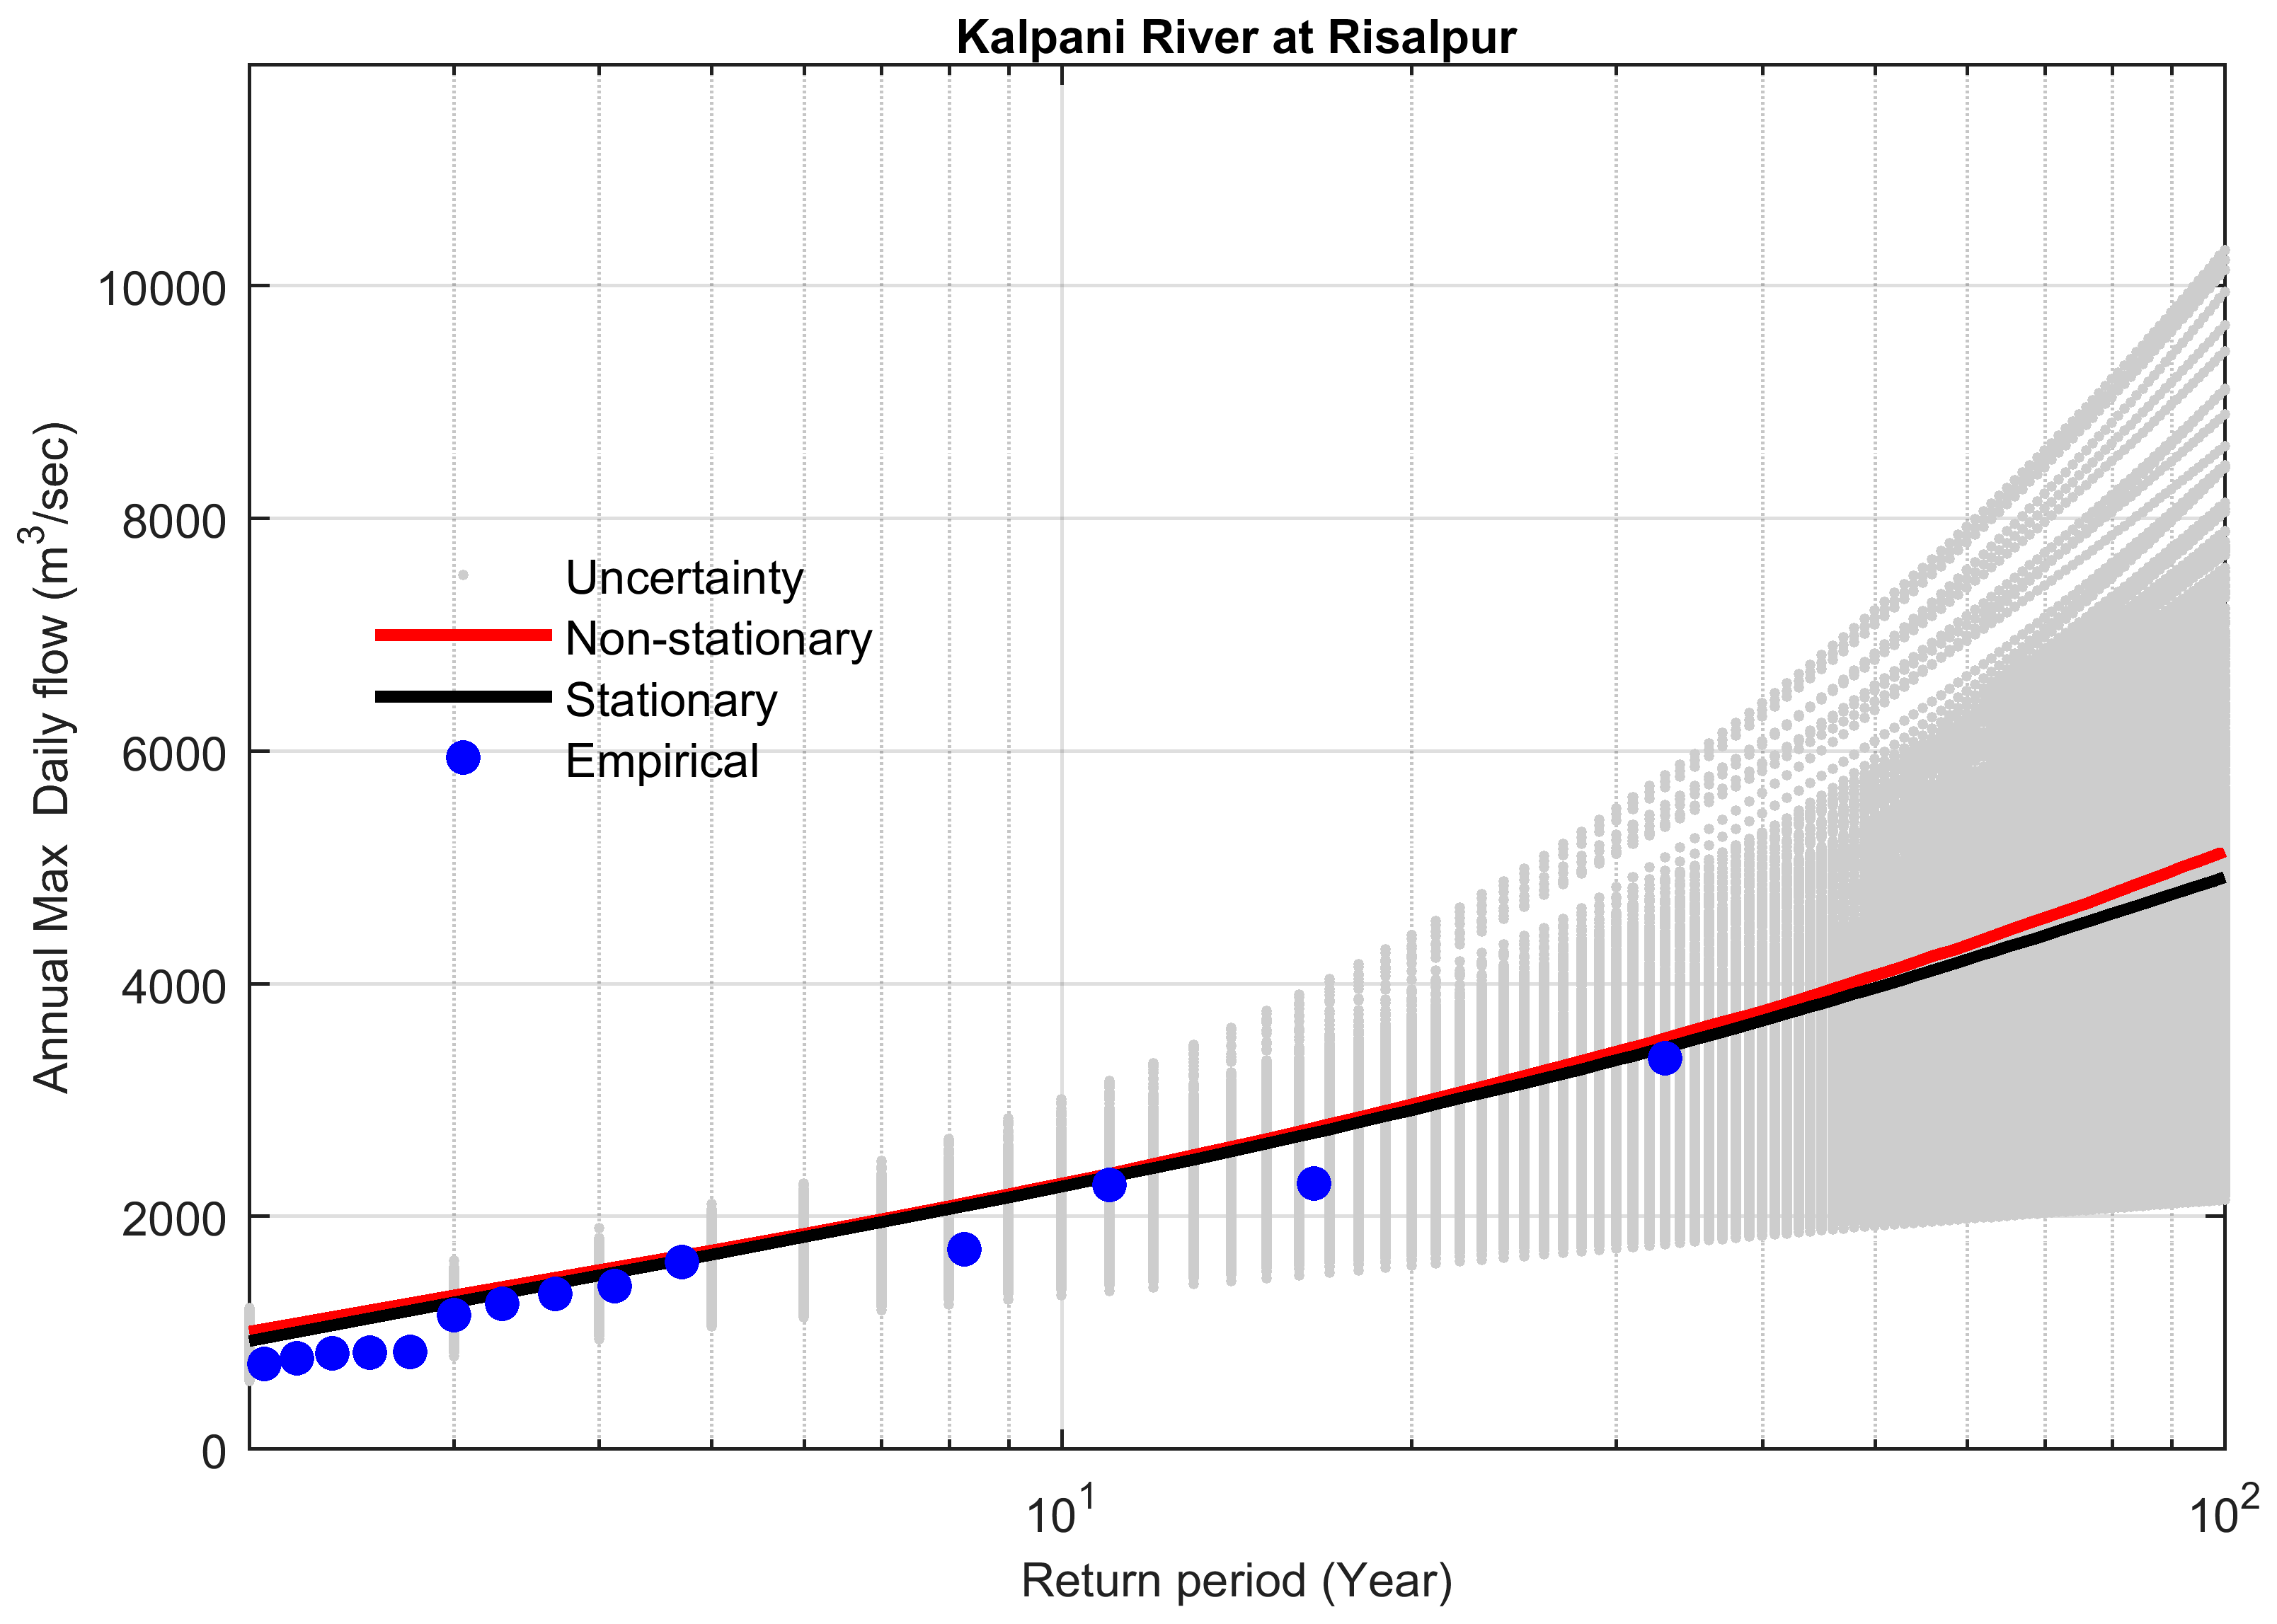
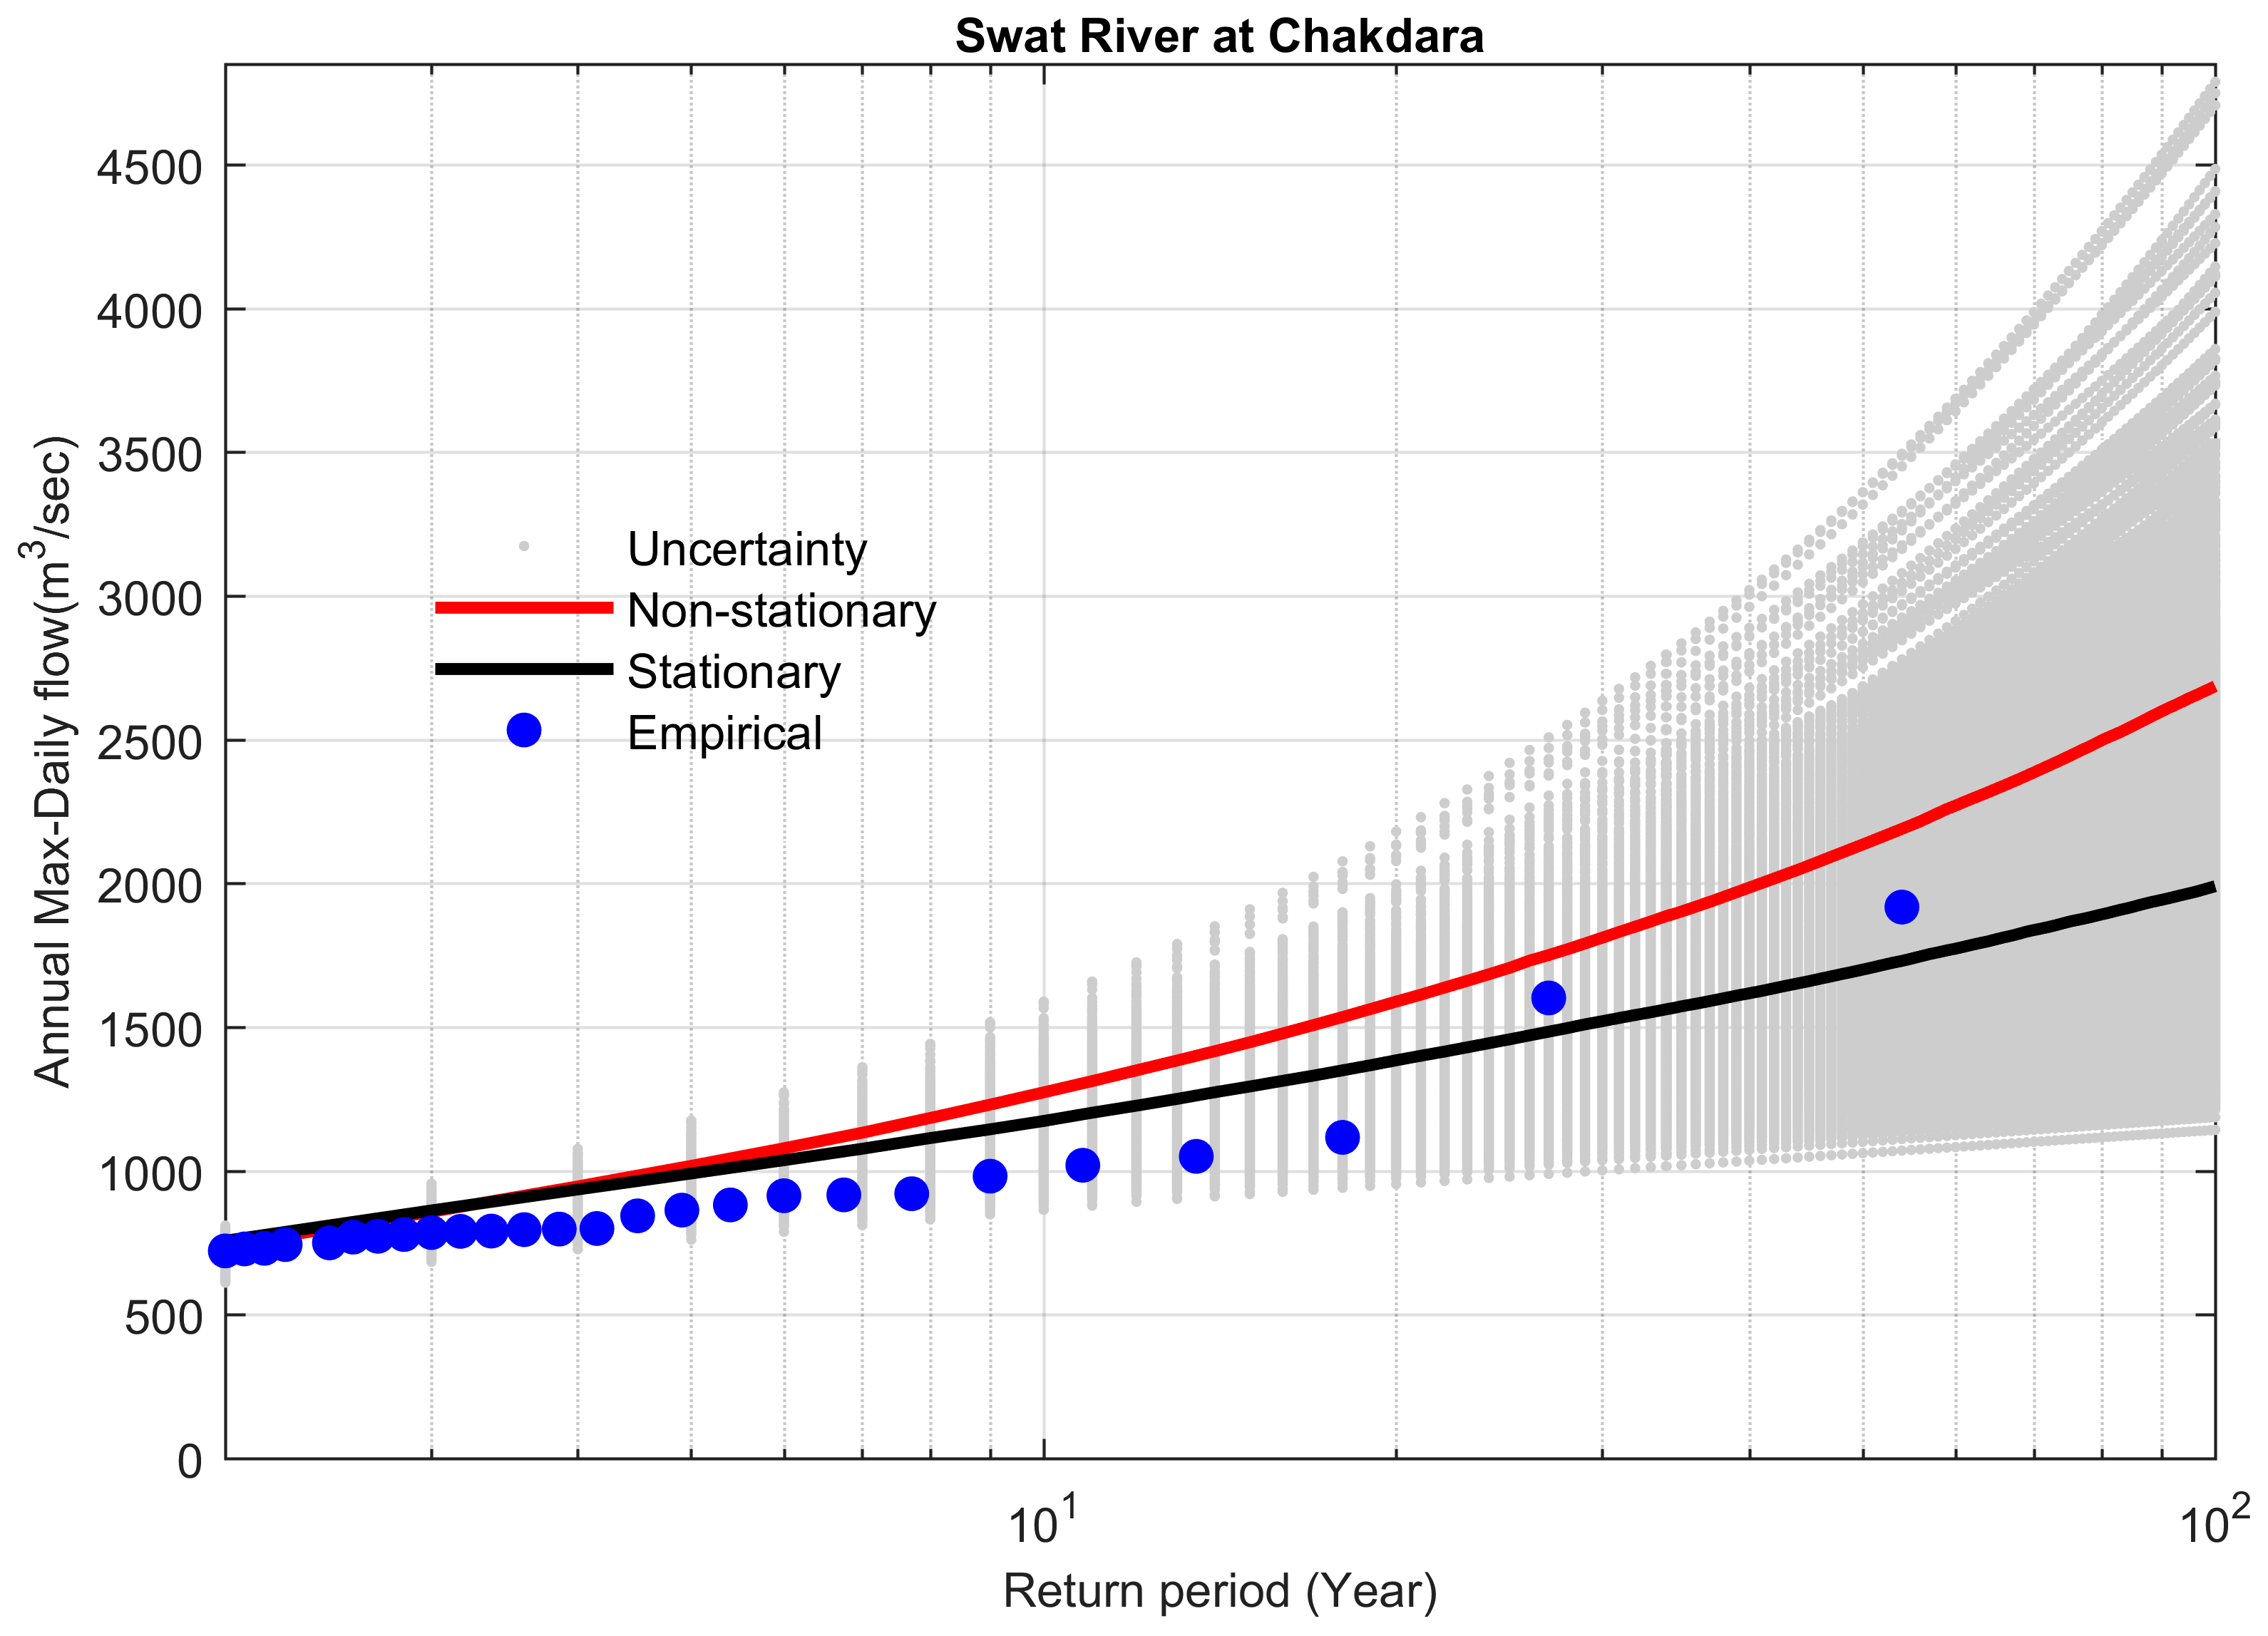
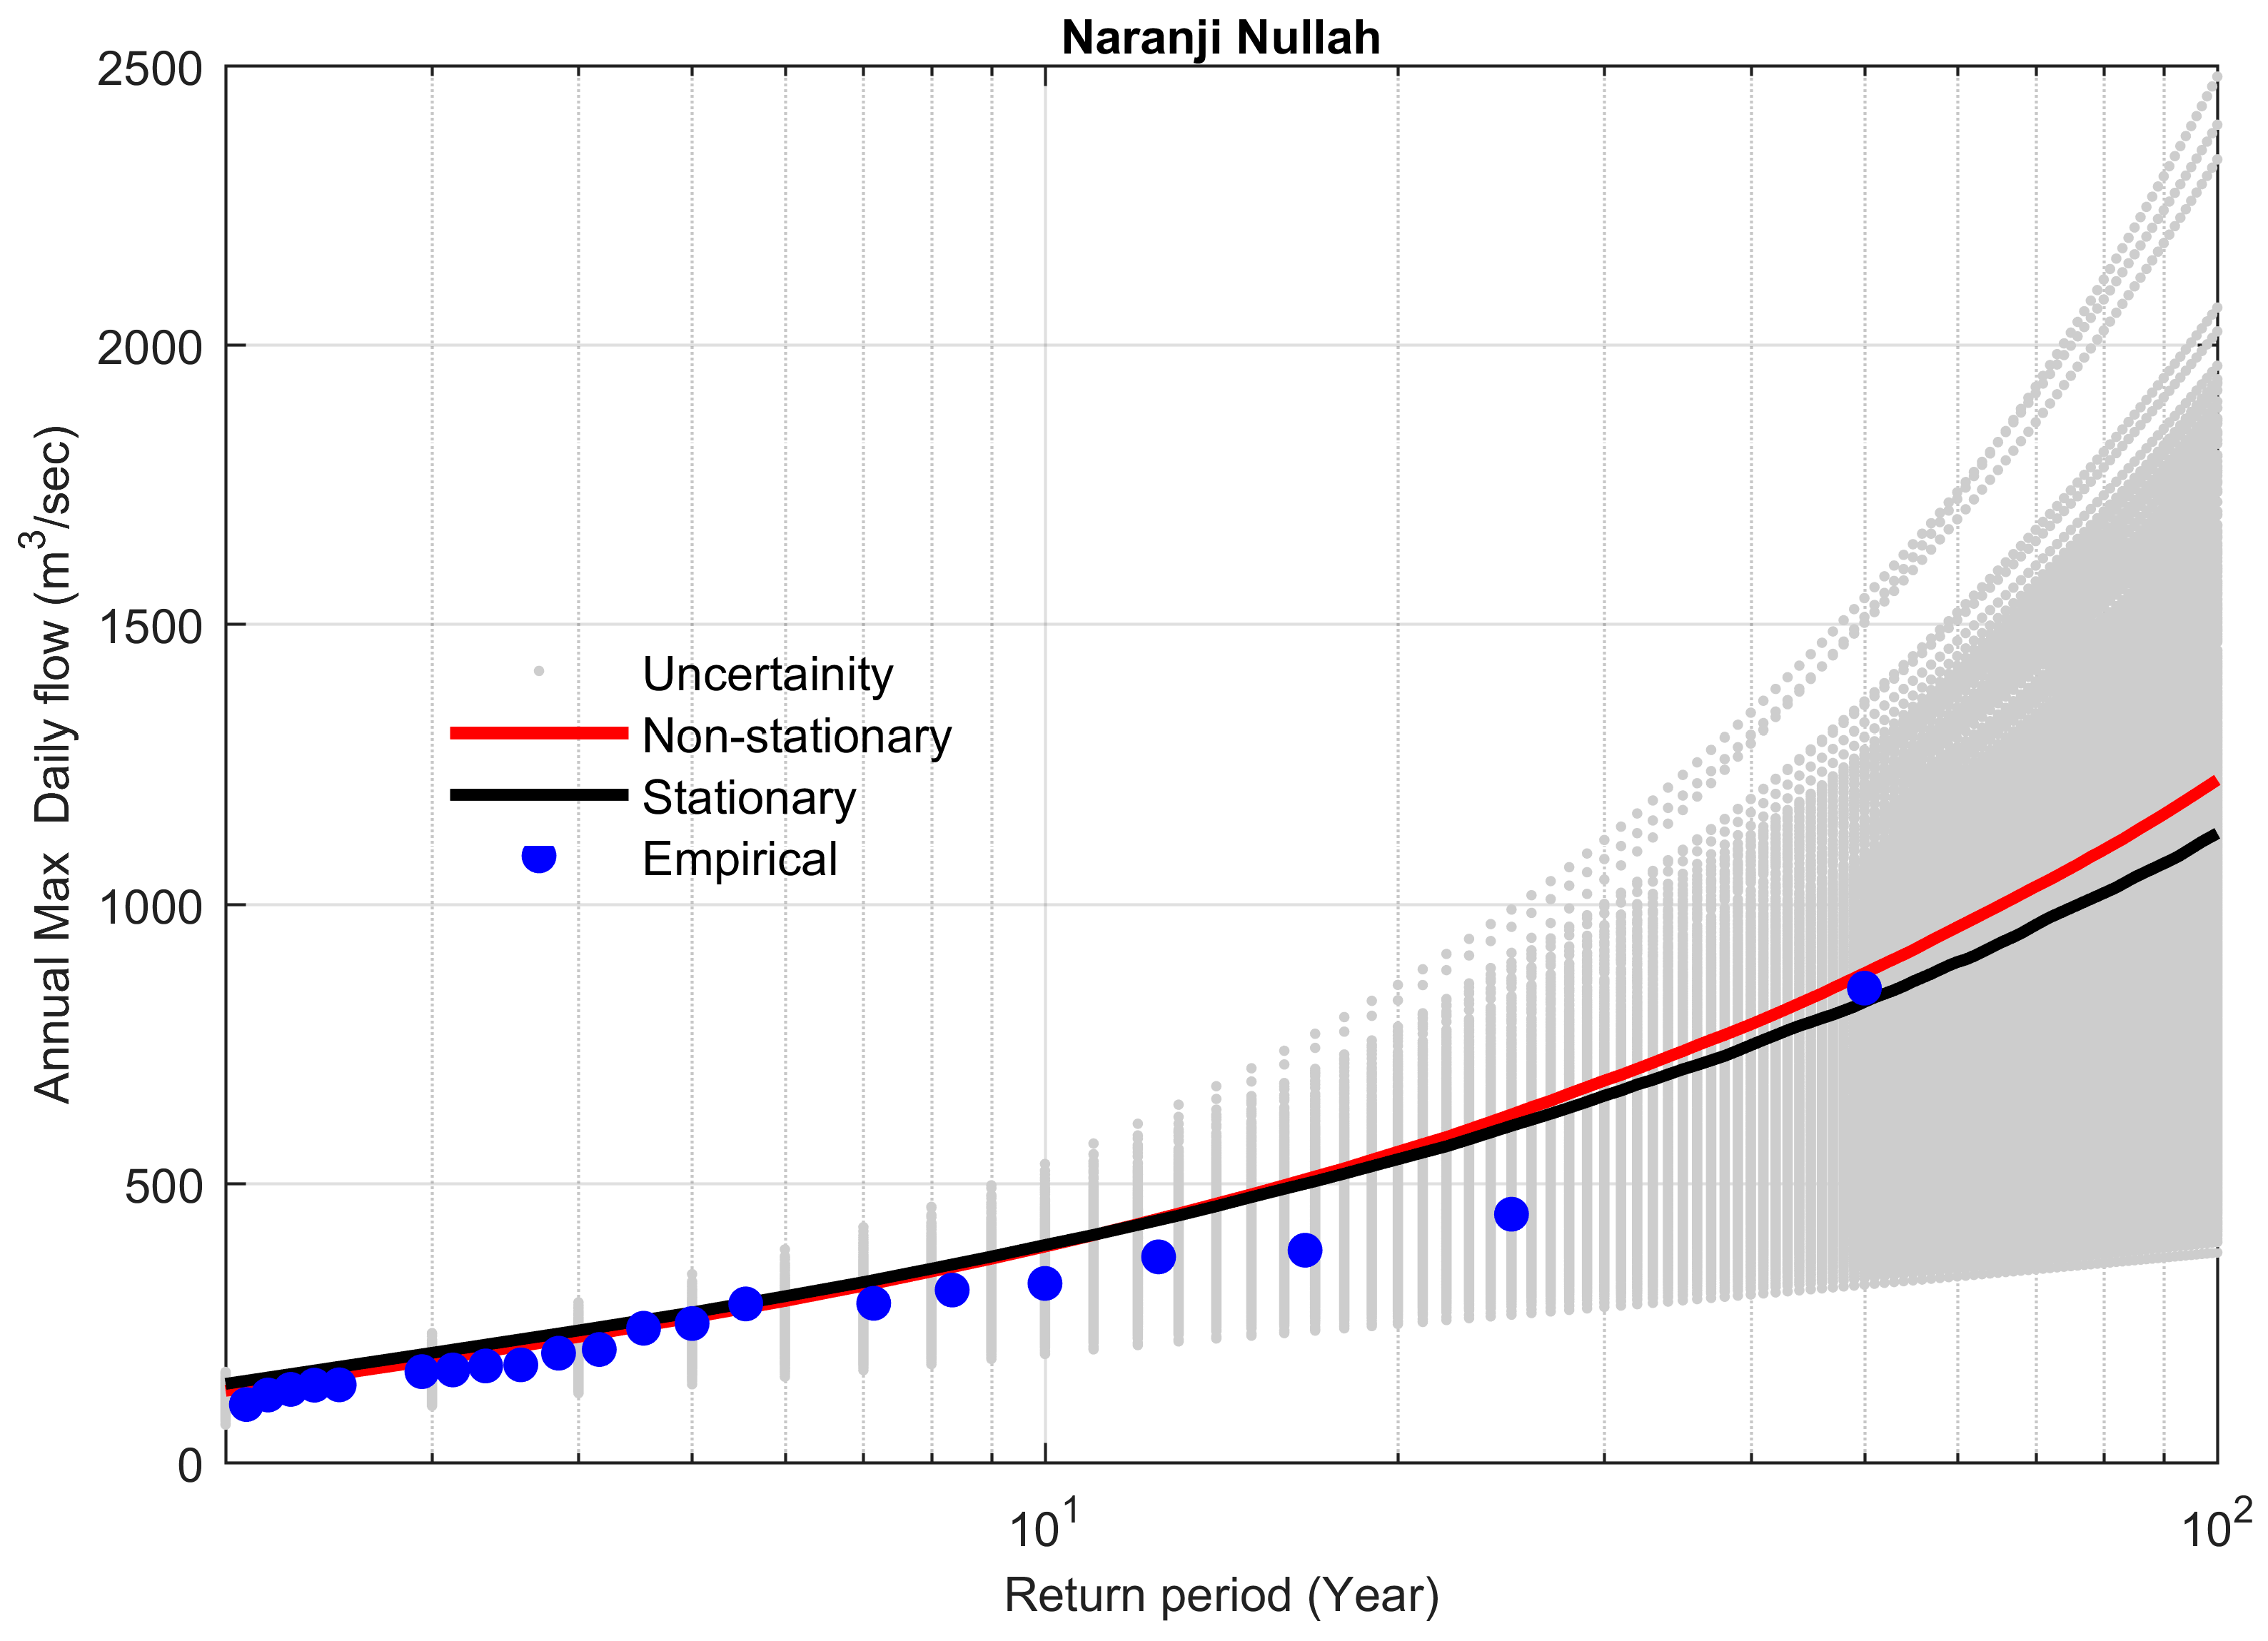
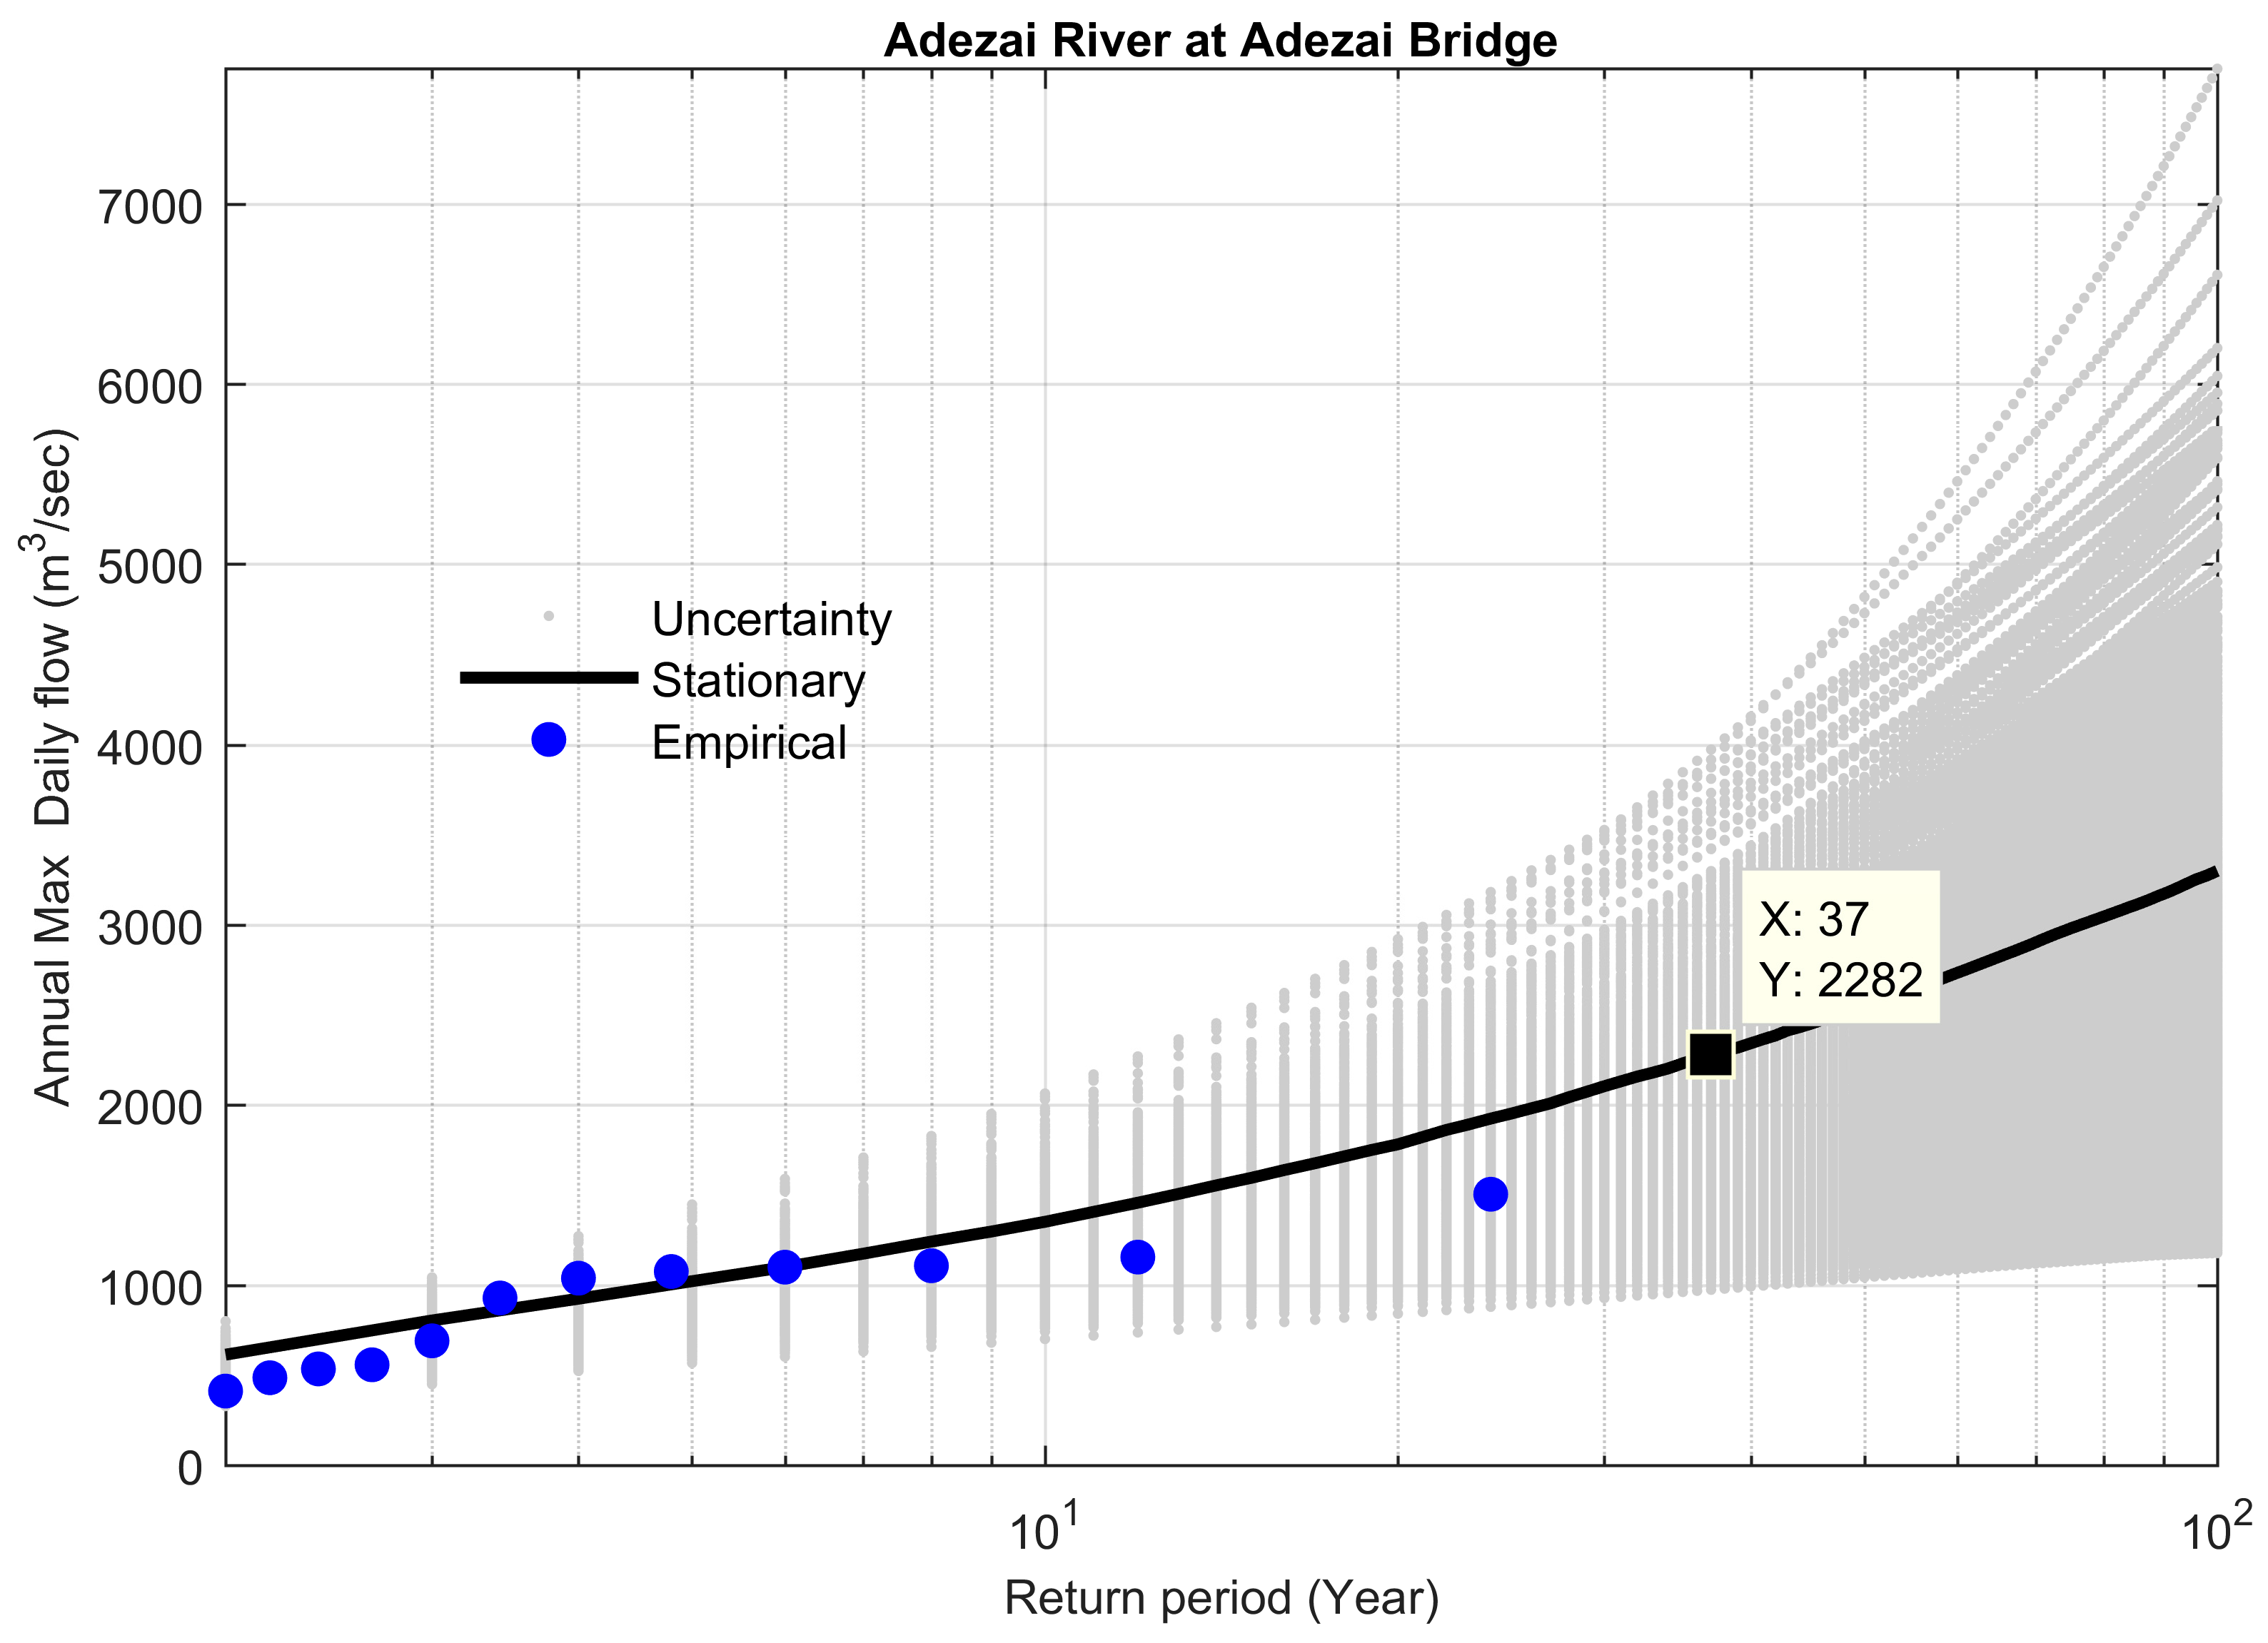
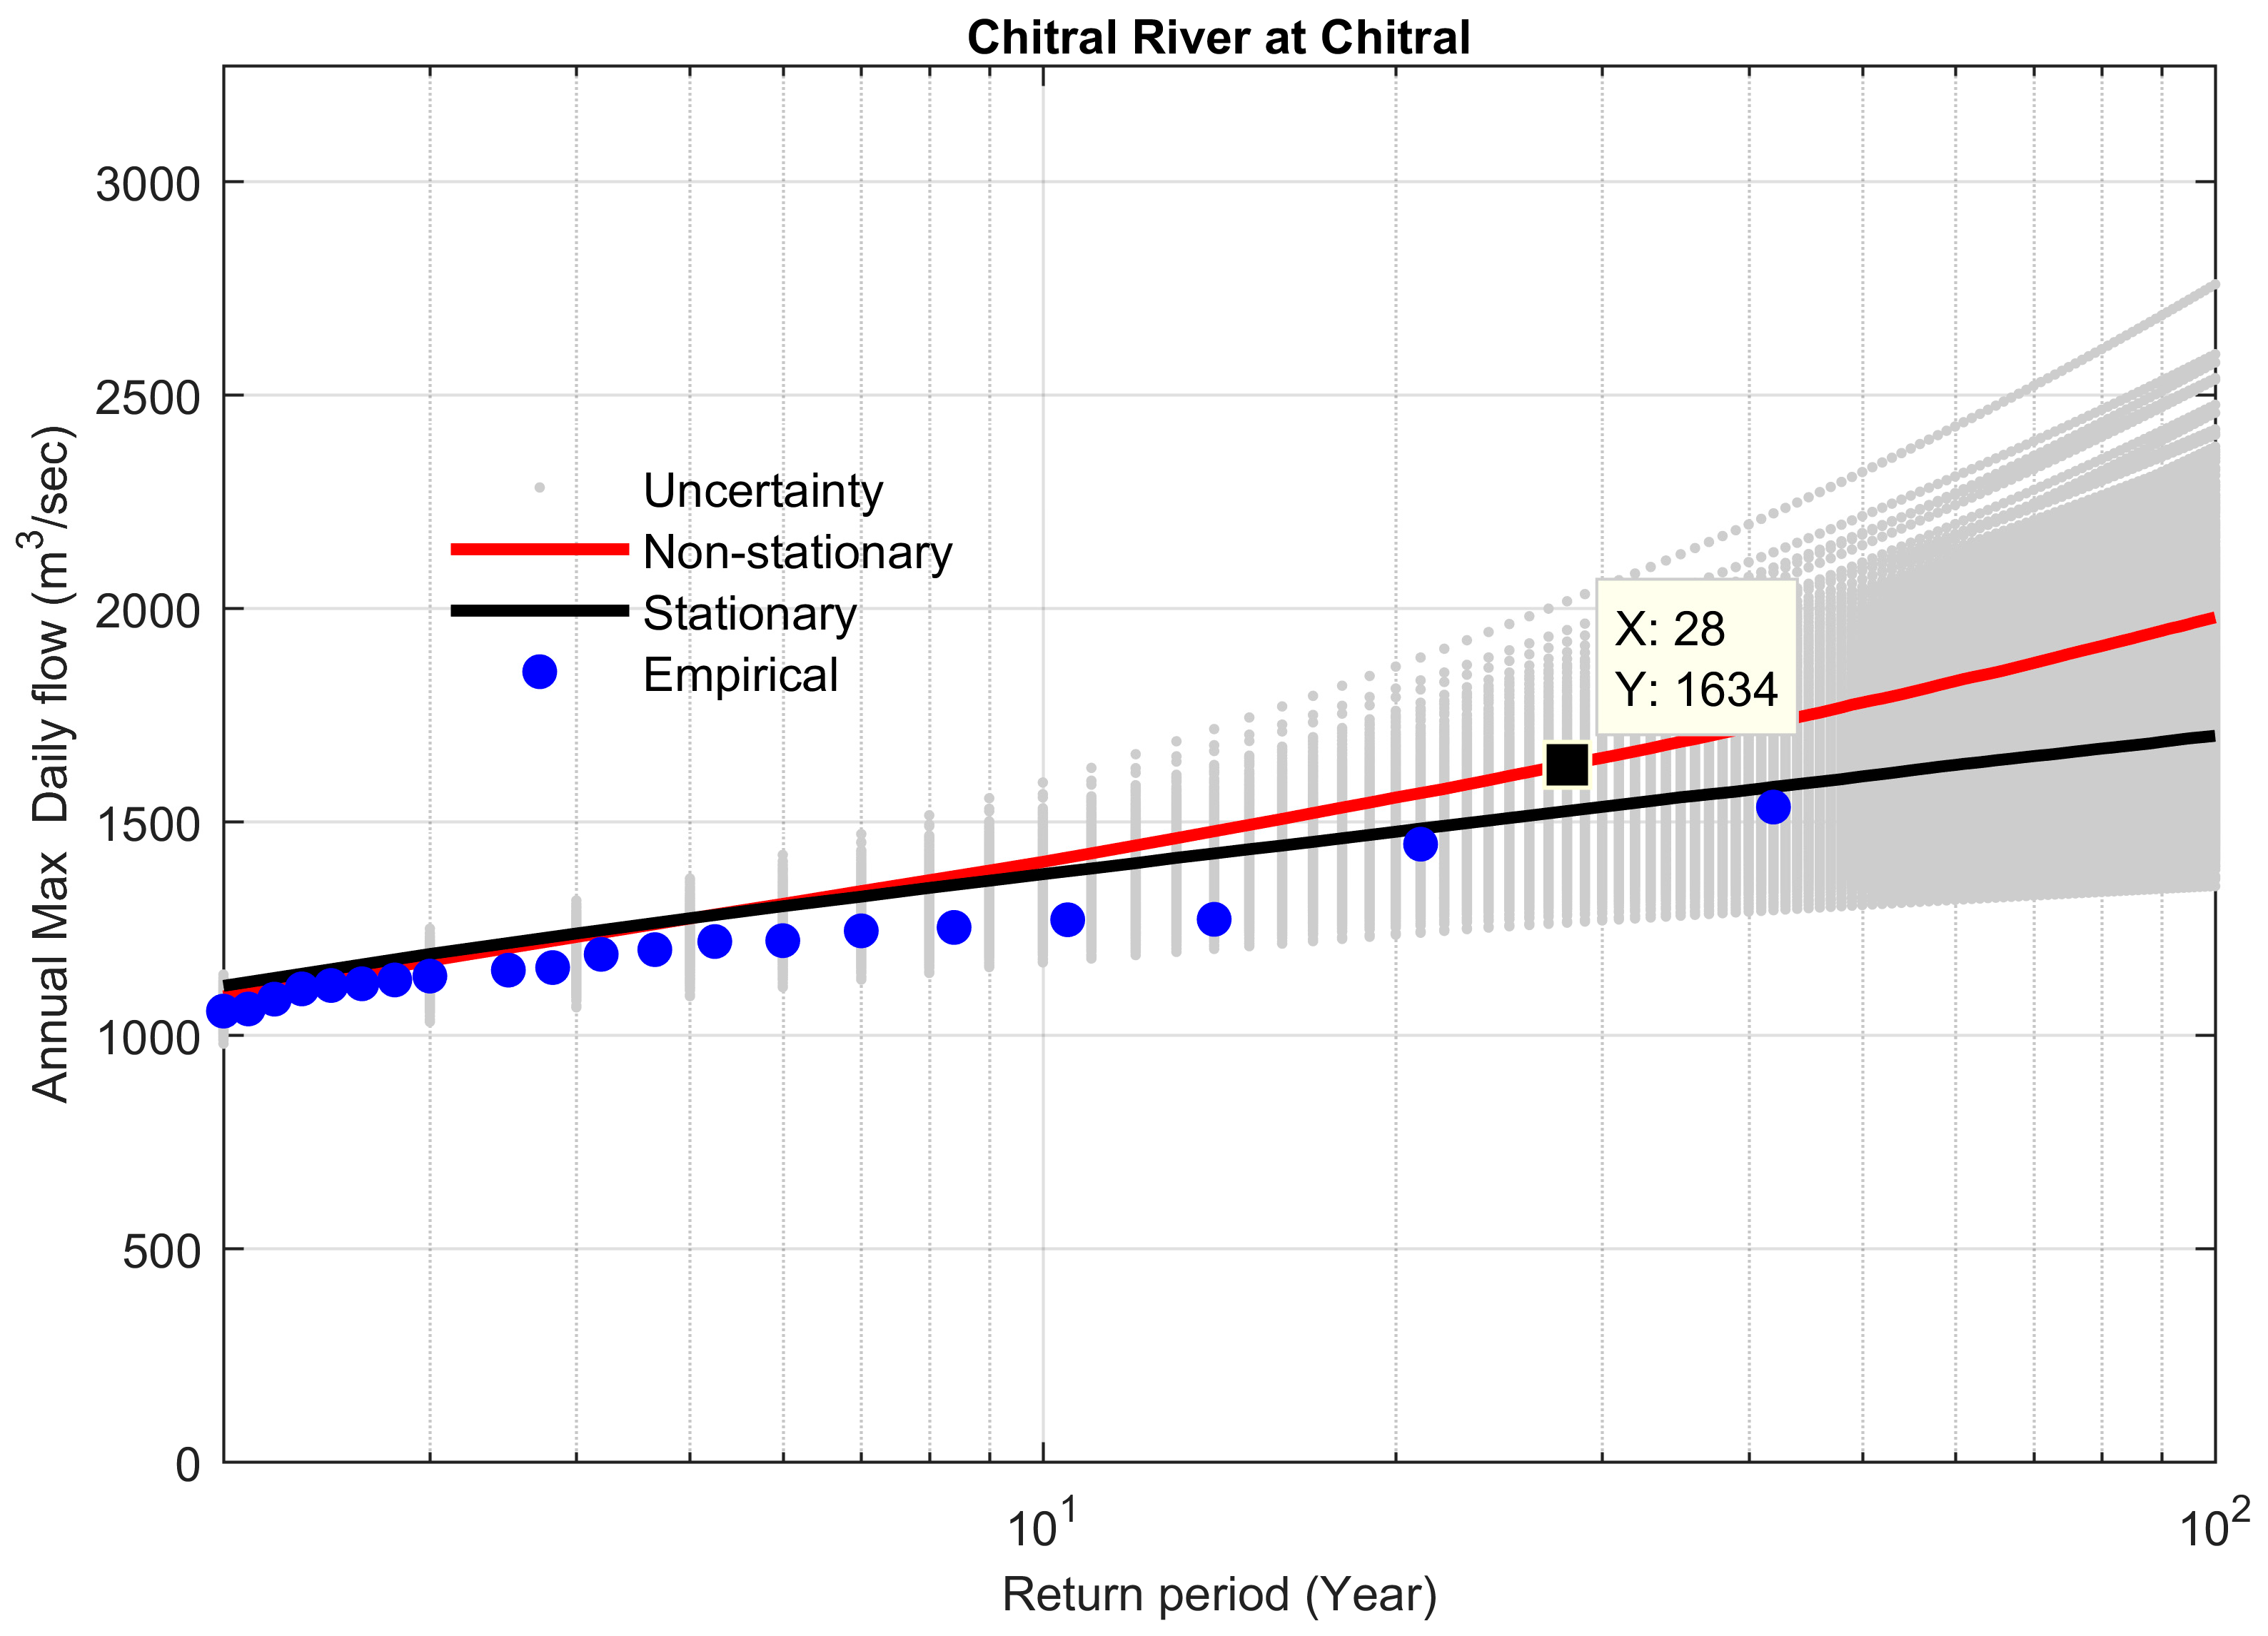
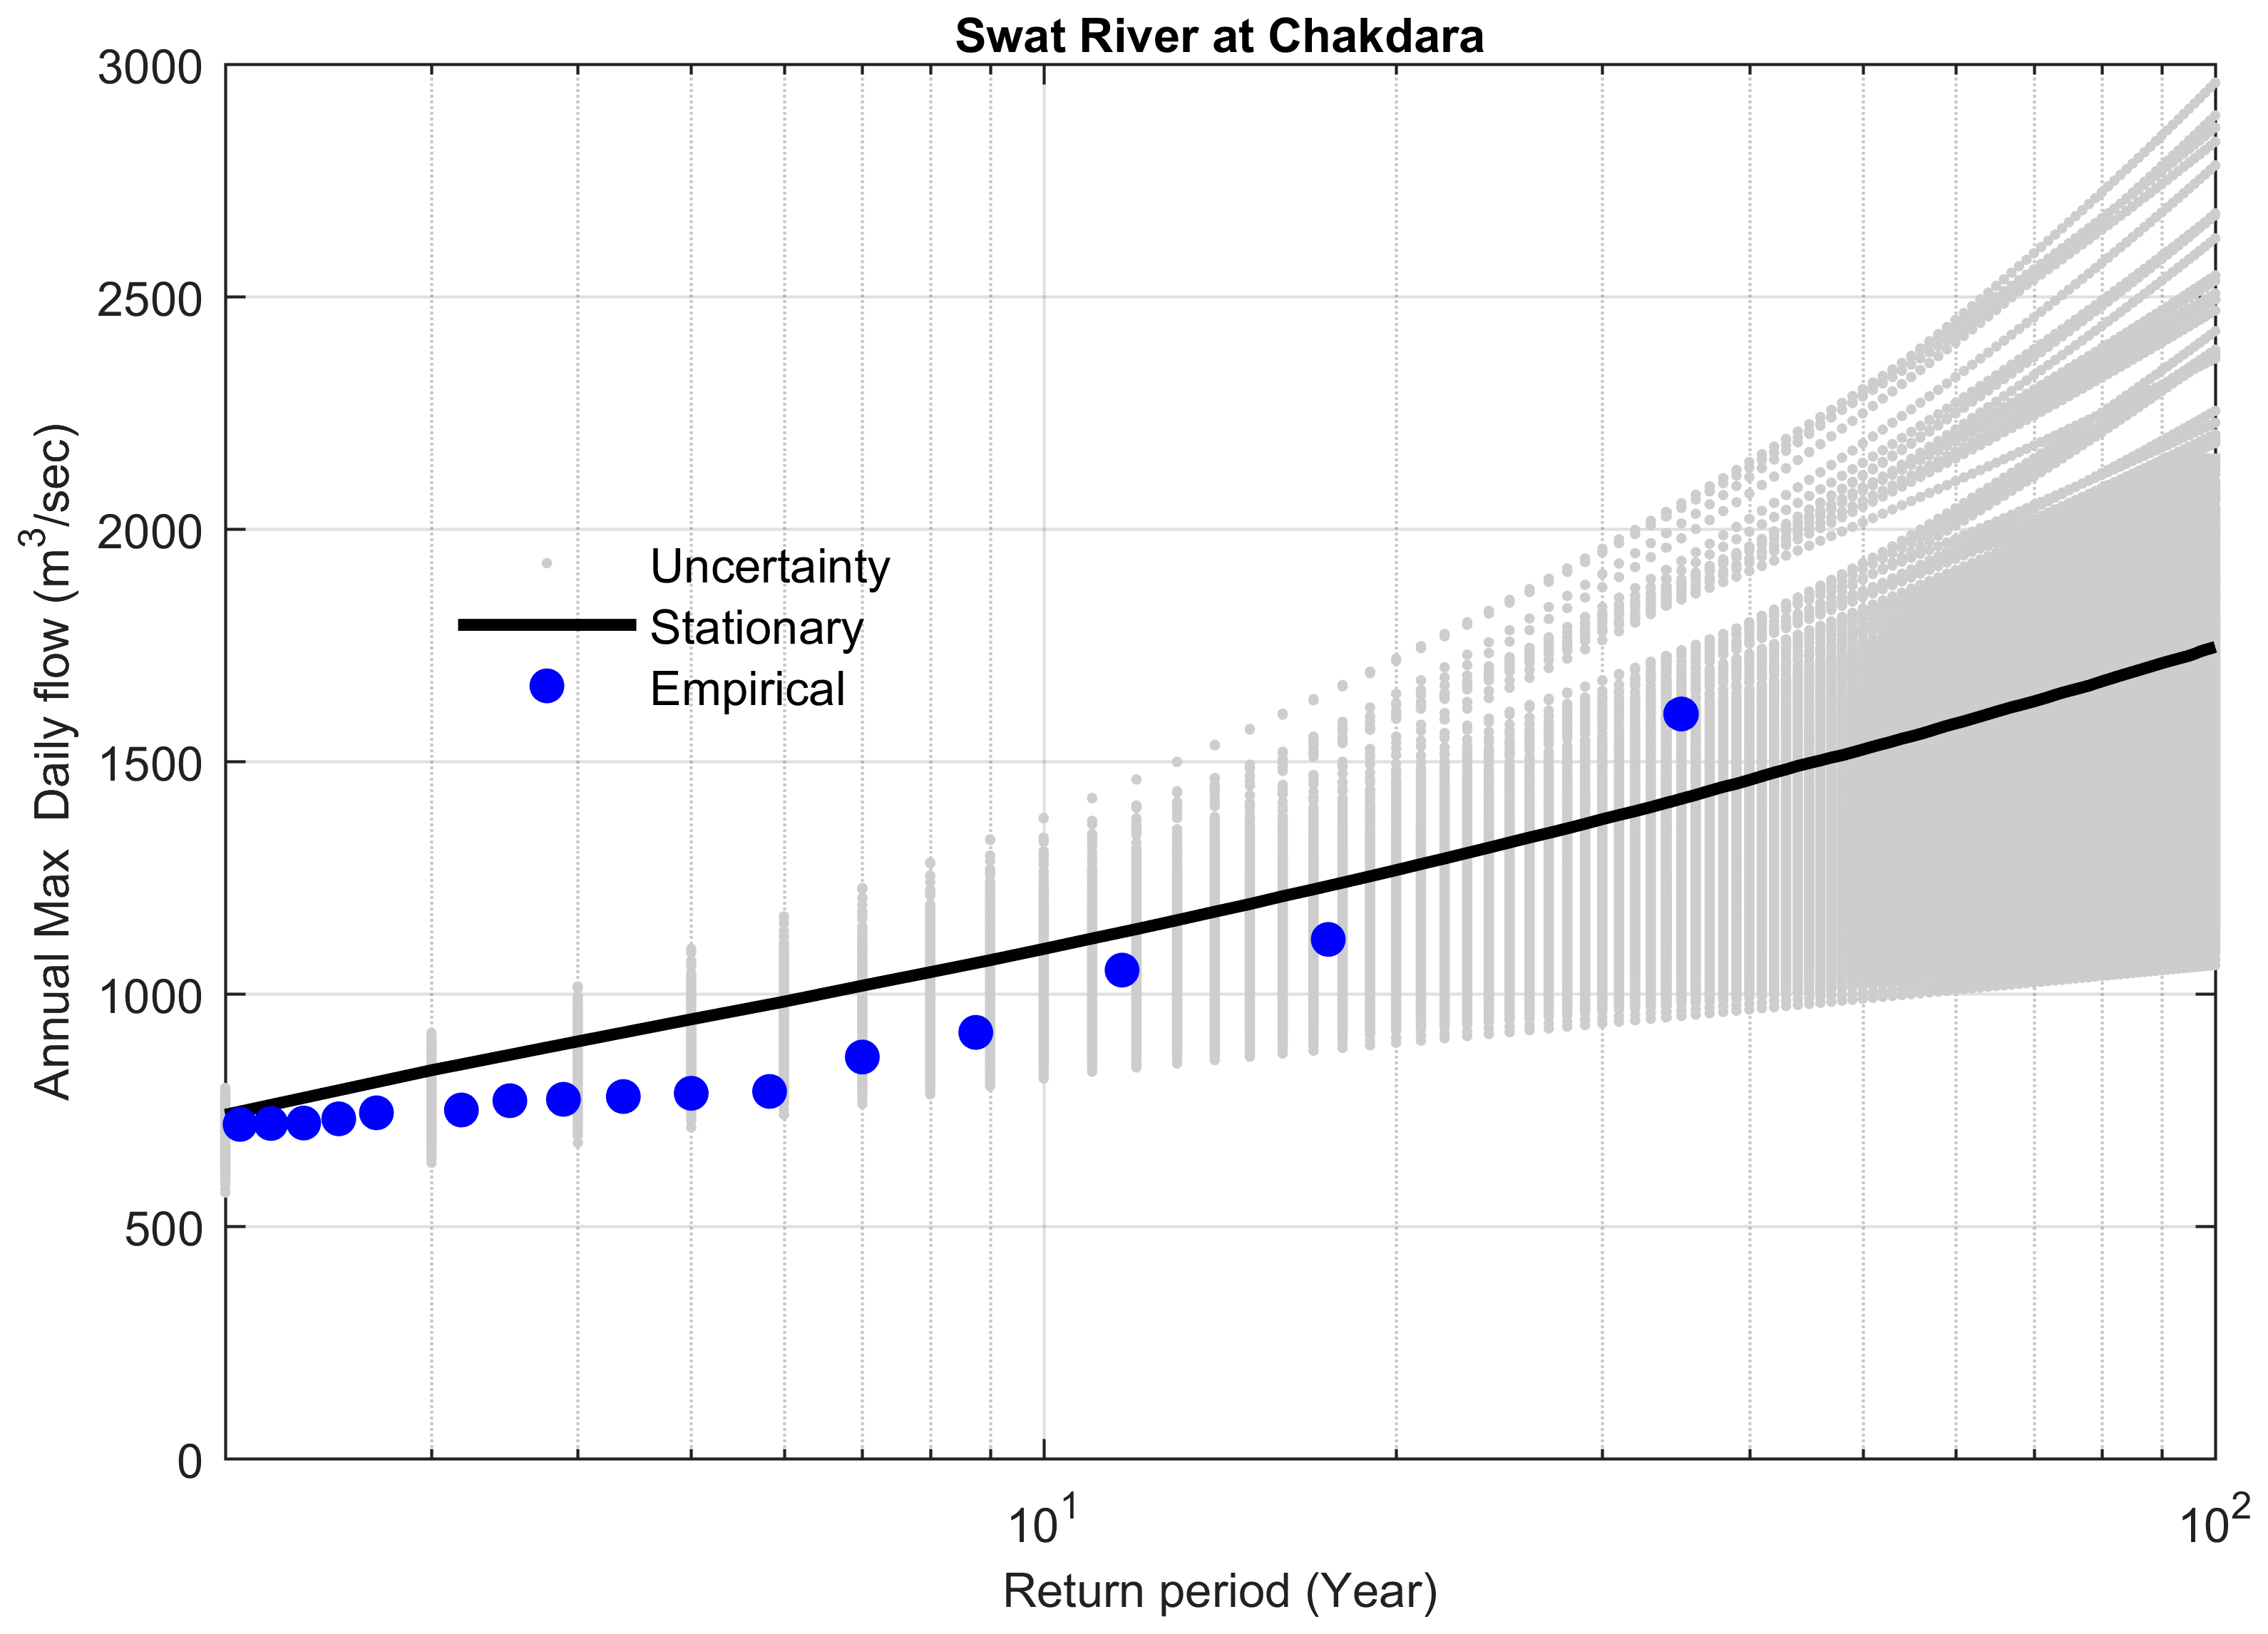
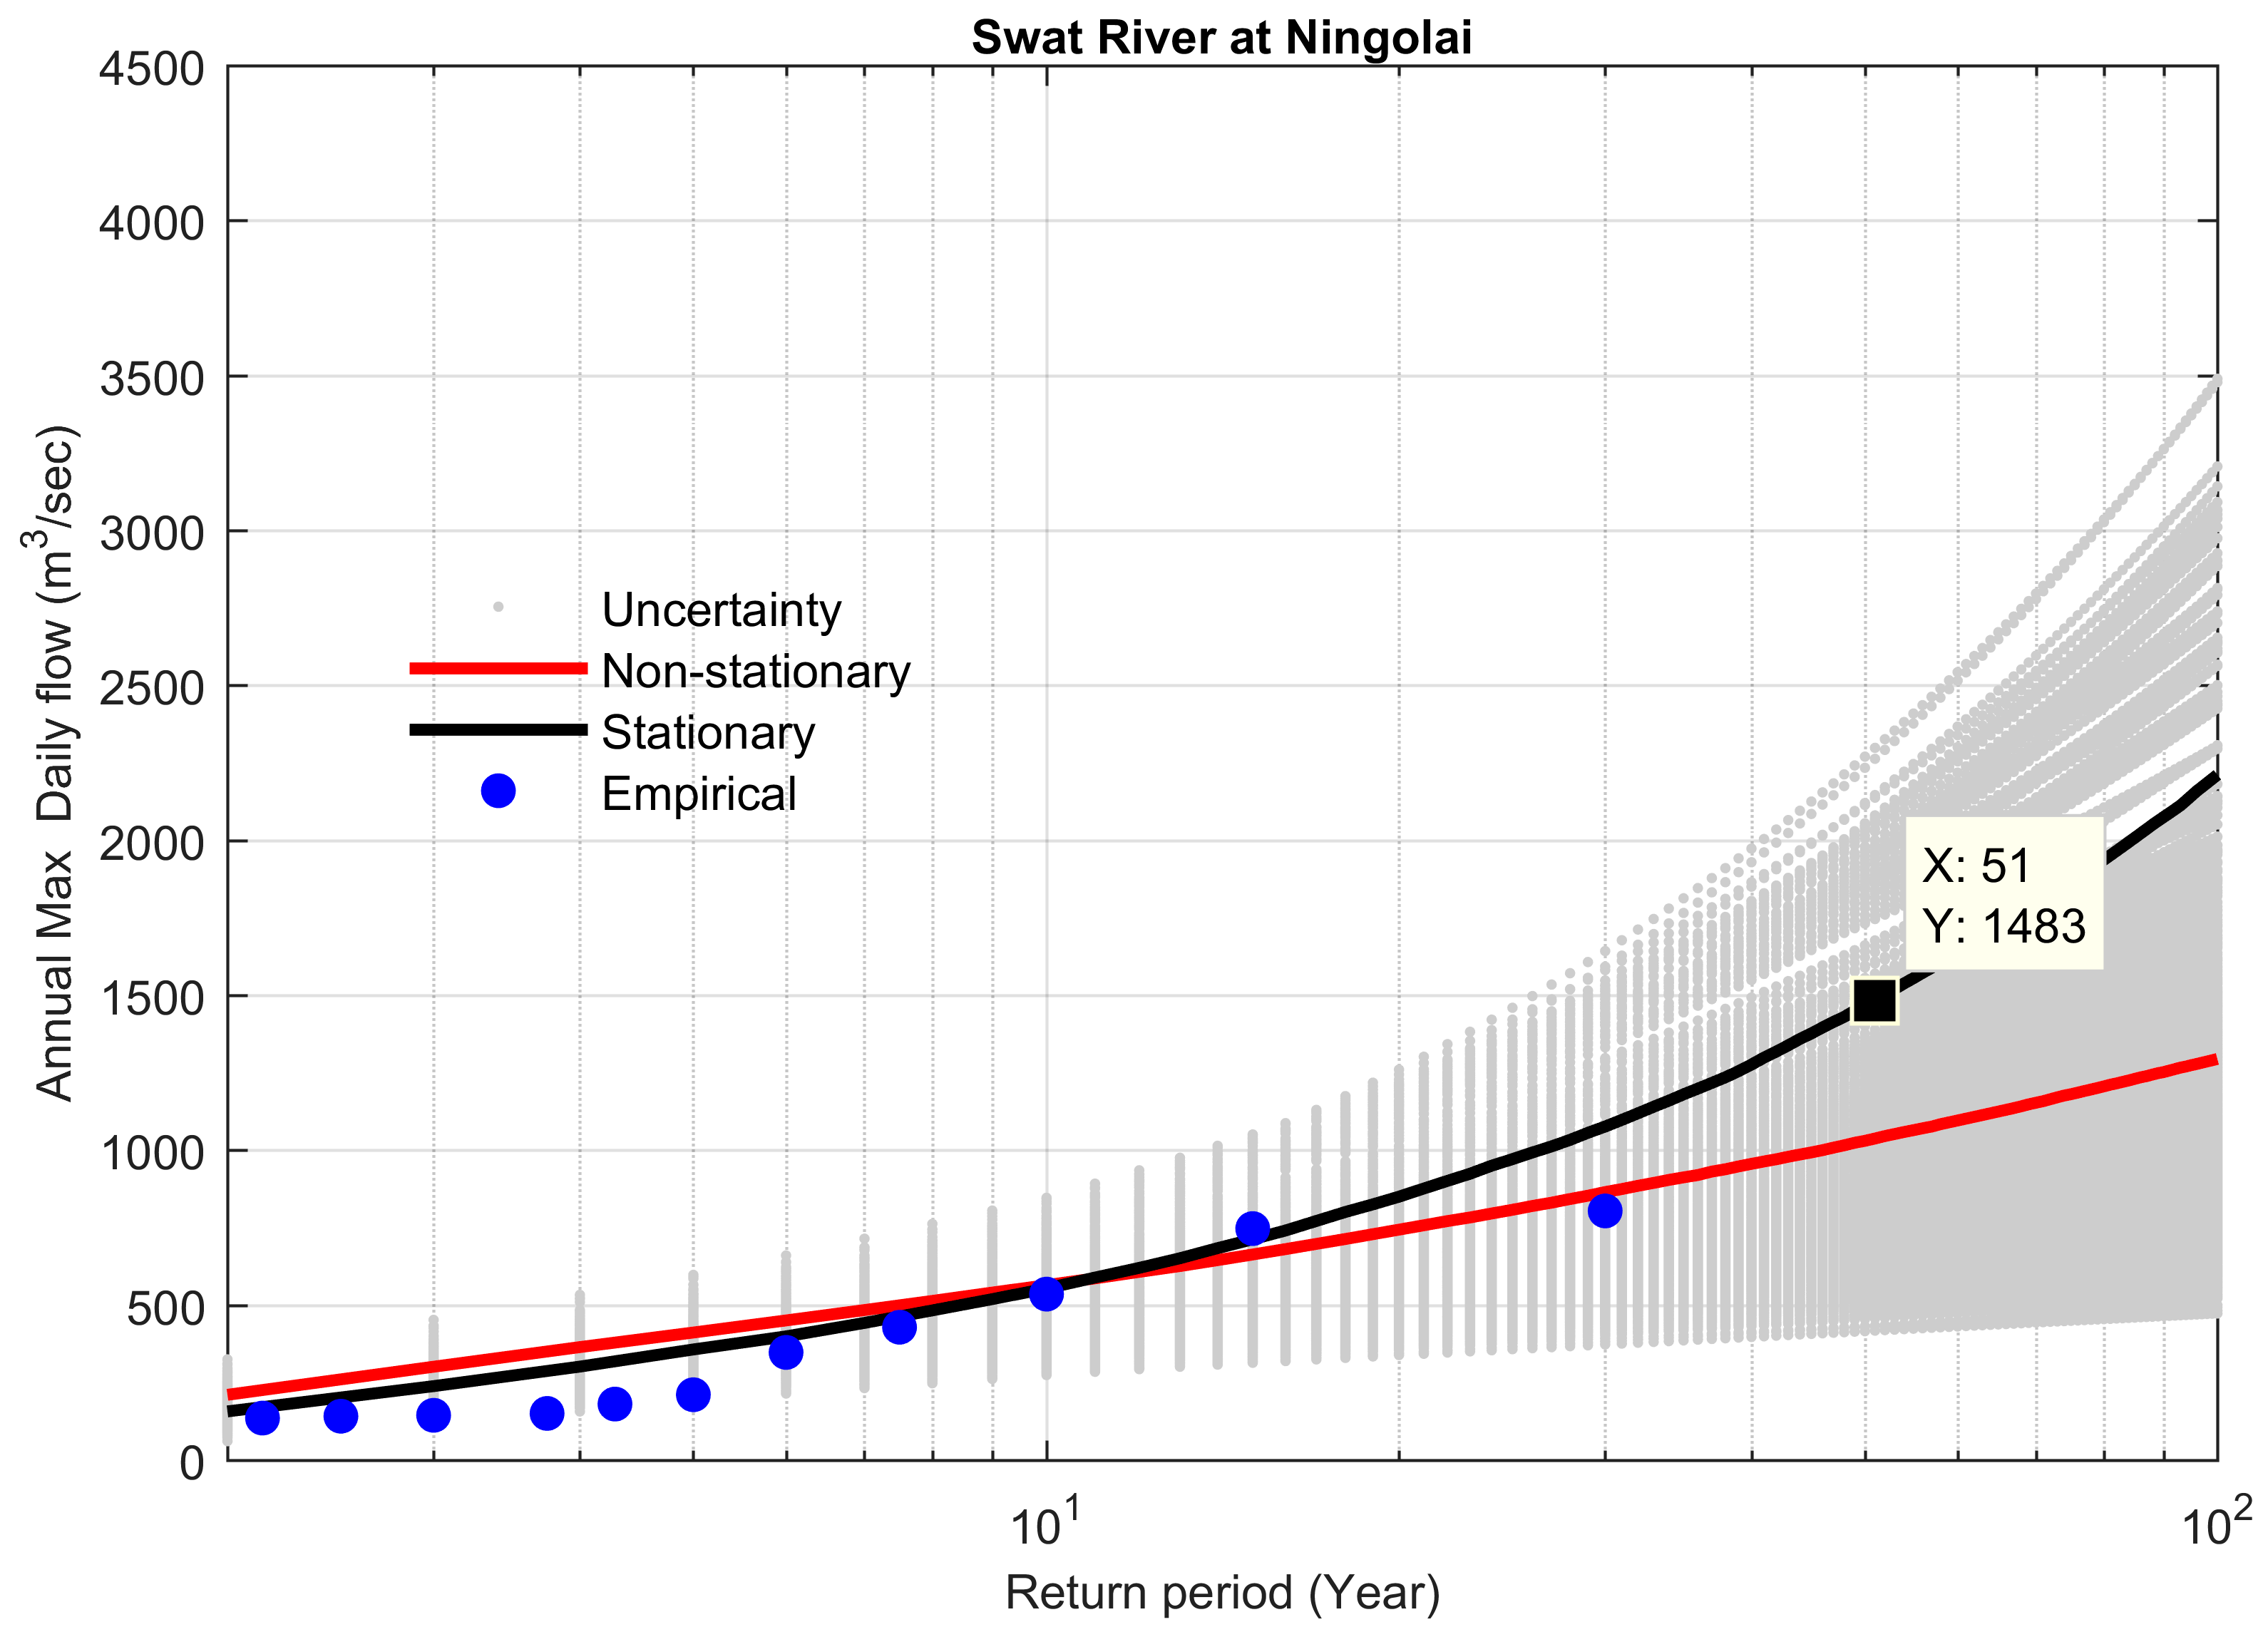
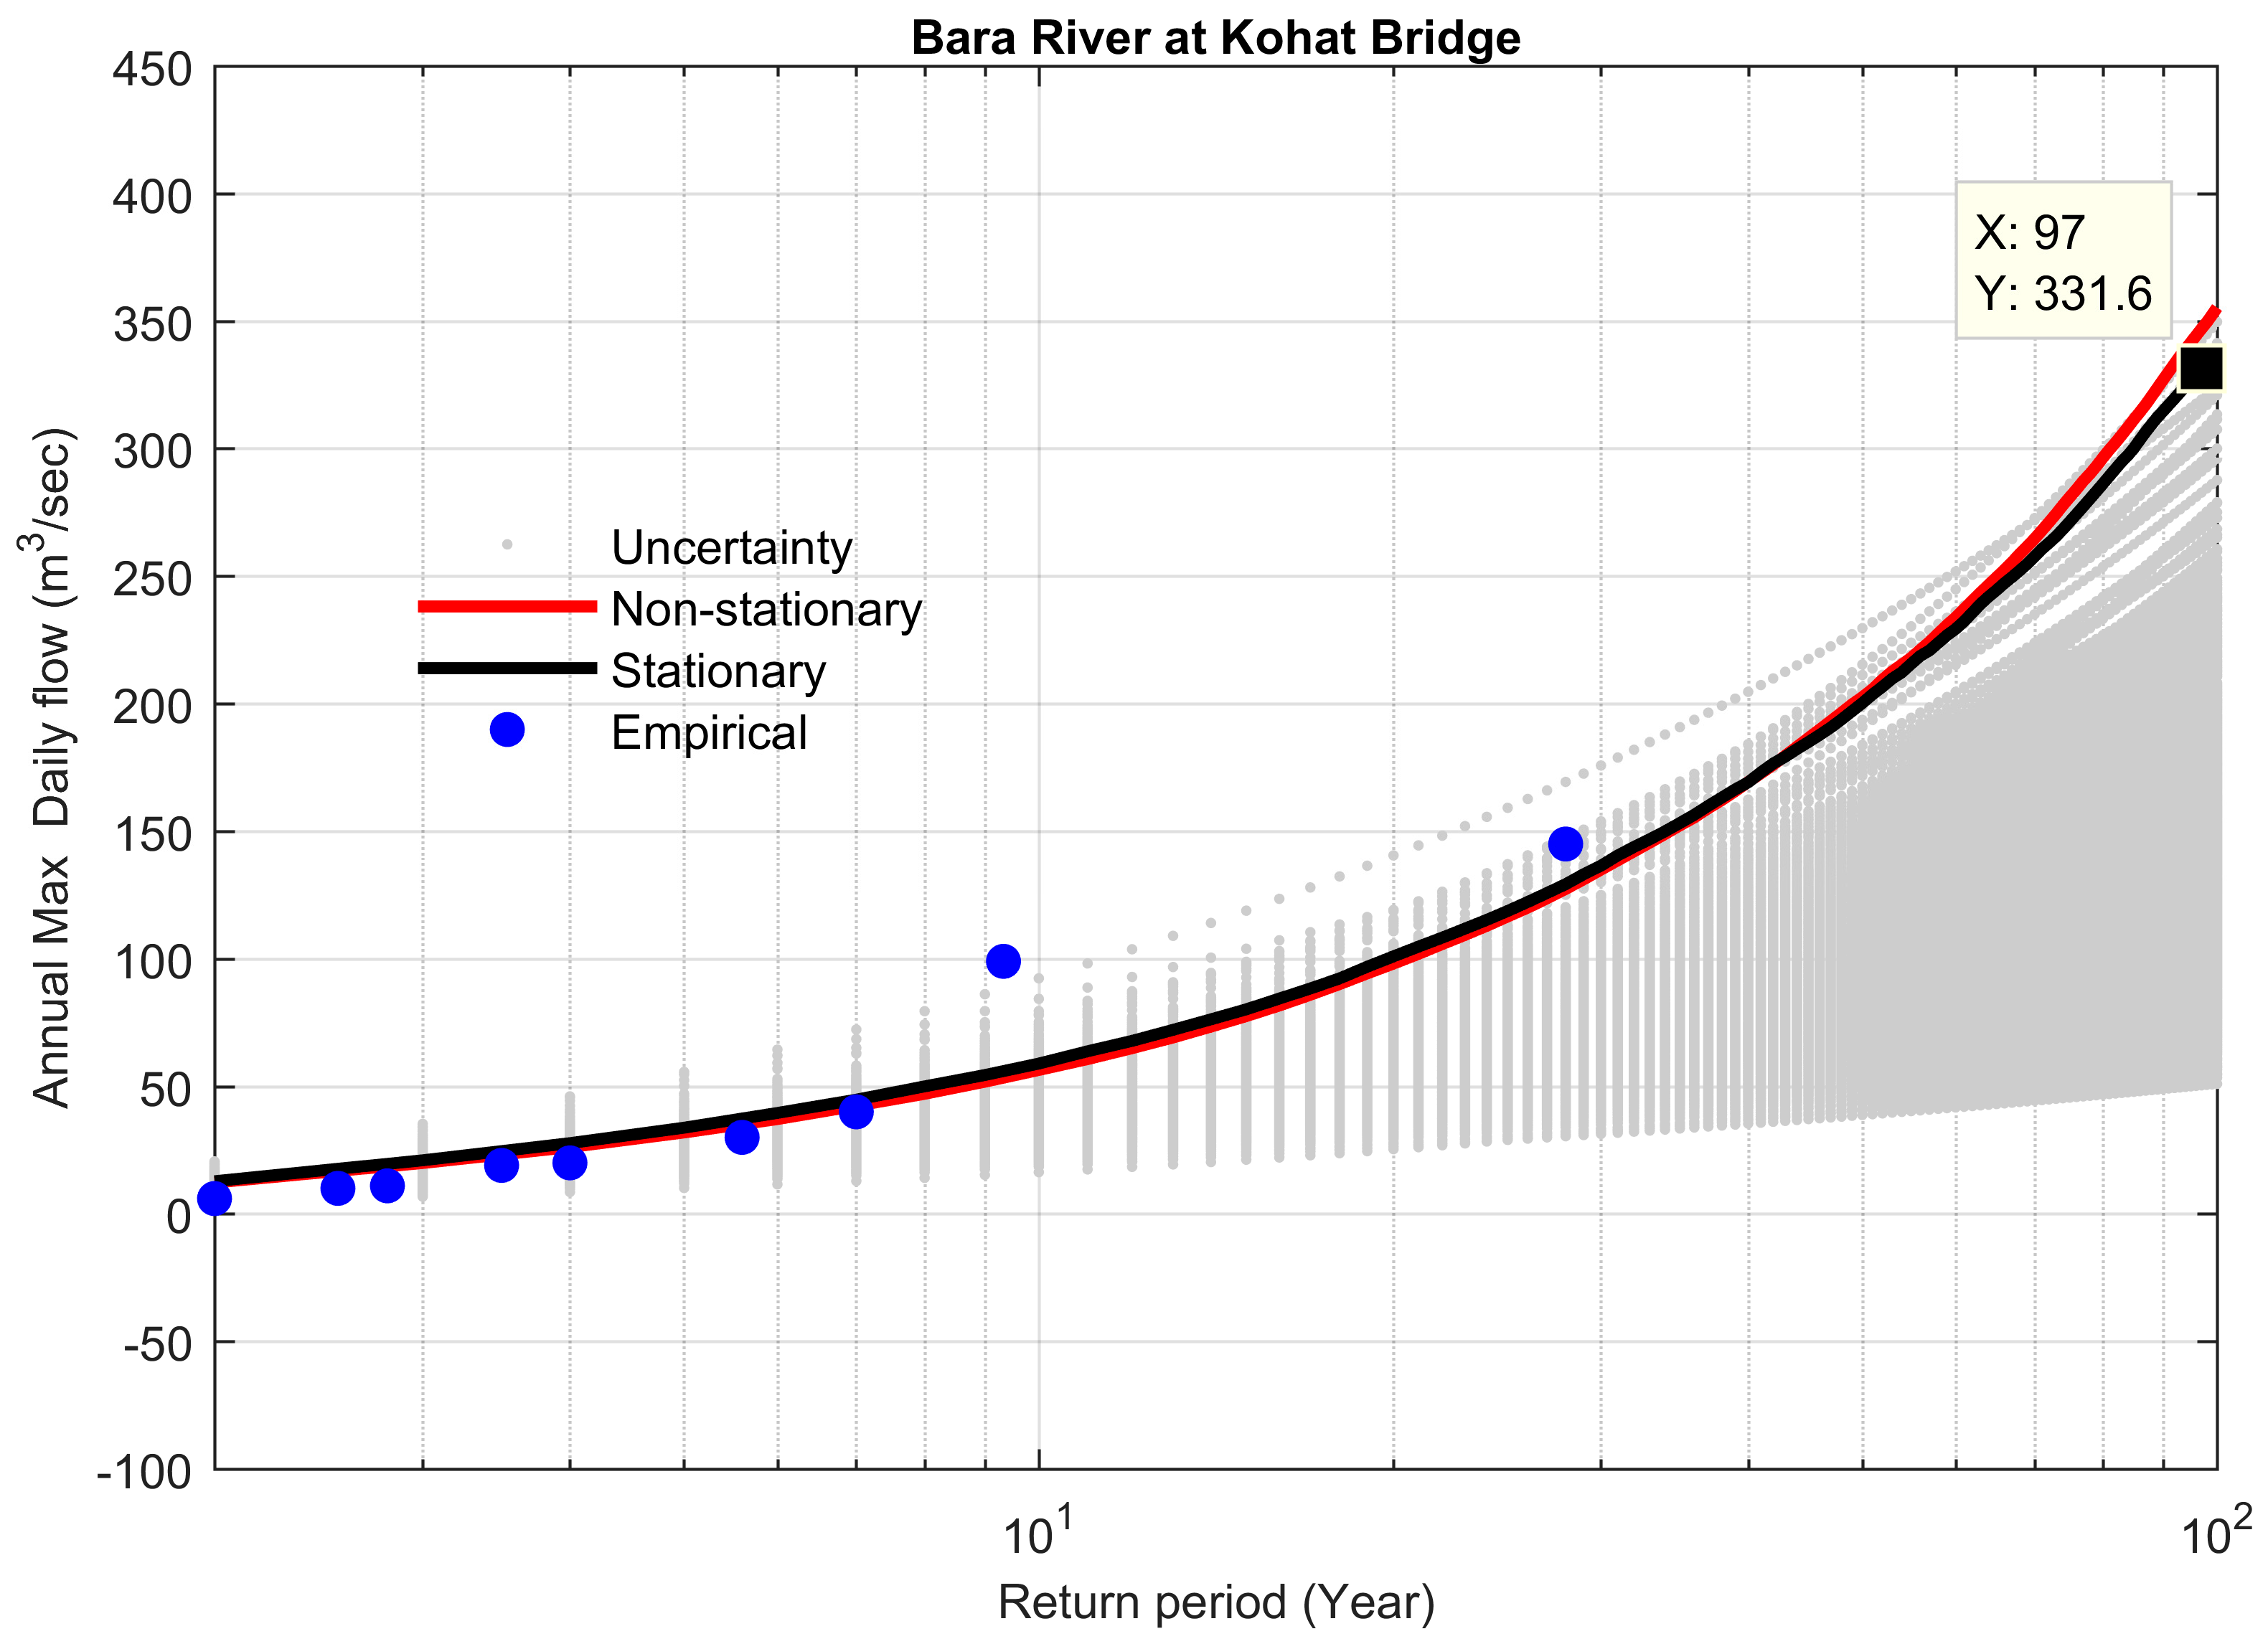
4.4. Comparison between Stationary and Non-Stationary Bayesian Models
4.5. Performance of Bayesian Models to Predict the Extreme Floods
5. Conclusions
- Trend analysis showed a mixture of increasing and decreasing trends at different gauges in the KRB at α = 0.05. The Chitral River, Kalpani River, Main Swat River, and Bara River basins showed significant increasing trends, and the Panjkora River basin displayed a moderate increasing trend in its annual maximum flood regime. However, the Lower Swat and Kabul sub-basins showed decreasing trends, except for the Adezai River in the Kabul sub-basin, which showed a significant increasing trend.
- The overall basin was under critical change and signals of clear non-stationarity in the flood regime were evident at various spatial scales throughout the basin.
- The presence of a significant trend and significant difference in flood estimates for 100-year flood between stationary and non-stationary FFCs were found that represent the clear violation from the so-called stationary assumption.
- The non-stationary Bayesian model was found to be reliable for the study sites that had a significant trend at α = 0.05, while the stationary model overestimated or underestimated the flood risk for these sites. On the other hand, the stationary Bayesian model performed better for the study sites for trends at α = 0.1, while the non-stationary Bayesian model overestimated or underestimated the flood risk for such sites.
- The use of informed priors on the shape parameter based on regional information improved the estimation of flood quantiles and reduced the uncertainty.
- Proper consideration should be given to identify the outliers while using Bayesian models.
- The presence of non-stationarity in the flood regime of the KRB has substantial implications for flood management and water resources development. A design with stationary assumption will cause two major concerns: under estimation or overestimation of design for structural and non-structural measures in the KRB. An event-based design may also overestimate or underestimate the risk in hydraulic design that was intended. Some previous studies in other parts of world also provided similar results [1,13,31,84,85,86].
Author Contributions
Funding
Acknowledgments
Conflicts of Interest
References
- López, J.; Francés, F. Non-stationary flood frequency analysis in continental Spanish rivers, using climate and reservoir indices as external covariates. Hydrol. Earth Syst. Sci. 2013, 17, 3189–3203. [Google Scholar] [CrossRef]
- Khaliq, M.; Ouarda, T.; Ondo, J.-C.; Gachon, P.; Bobée, B. Frequency analysis of a sequence of dependent and/or non-stationary hydro-meteorological observations: A review. J. Hydrol. 2006, 329, 534–552. [Google Scholar] [CrossRef]
- Stedinger, J.R.; Vogel, R.; Foufoula-Georgiou, E. Frequency analysis of extreme events. Handb. Hydrol. 1993, 18, 68. [Google Scholar]
- Salas, J. Analysis and Modeling of Hydrologic Time Series in Hand Book of Hydrology; Maidment, D.R., Ed.; McGraw Hill Book Co.: New York, NY, USA, 1993. [Google Scholar]
- Council, N.R. Decade-to-Century-Scale Climate Variability and Change: A Science Strategy; National Academies Press: Washington, DC, USA, 1998. [Google Scholar]
- Norrant, C.; Douguédroit, A. Monthly and daily precipitation trends in the Mediterranean (1950–2000). Theor. Appl. Climatol. 2006, 83, 89–106. [Google Scholar] [CrossRef]
- Mudelsee, M.; Börngen, M.; Tetzlaff, G.; Grünewald, U. No upward trends in the occurrence of extreme floods in central Europe. Nature 2003, 425, 166–169. [Google Scholar] [CrossRef]
- Douglas, E.; Vogel, R.; Kroll, C. Trends in floods and low flows in the United States: Impact of spatial correlation. J. Hydrol. 2000, 240, 90–105. [Google Scholar] [CrossRef]
- Franks, S.W. Identification of a change in climate state using regional flood data. Hydrol. Earth Syst. Sci. 2002, 6, 11–16. [Google Scholar] [CrossRef]
- Milly, P.C.; Dunne, K.A.; Vecchia, A.V. Global pattern of trends in streamflow and water availability in a changing climate. Nature 2005, 438, 347–350. [Google Scholar] [CrossRef]
- Villarini, G.; Serinaldi, F.; Smith, J.A.; Krajewski, W.F. On the stationarity of annual flood peaks in the continental united states during the 20th century. Water Resour. Res. 2009, 45. [Google Scholar] [CrossRef]
- Wilson, D.; Hisdal, H.; Lawrence, D. Has streamflow changed in the nordic countries?–recent trends and comparisons to hydrological projections. J. Hydrol. 2010, 394, 334–346. [Google Scholar] [CrossRef]
- Villarini, G.; Smith, J.A.; Serinaldi, F.; Bales, J.; Bates, P.D.; Krajewski, W.F. Flood frequency analysis for nonstationary annual peak records in an urban drainage basin. Adv. Water Resour. 2009, 32, 1255–1266. [Google Scholar] [CrossRef]
- Vogel, R.M.; Yaindl, C.; Walter, M. Nonstationarity: Flood magnification and recurrence reduction factors in the United States. J. Am. Water Resour. Assoc. 2011, 47, 464–474. [Google Scholar] [CrossRef]
- Hejazi, M.I.; Markus, M. Impacts of urbanization and climate variability on floods in northeastern Illinois. J. Hydrol. Eng. 2009, 14, 606–616. [Google Scholar] [CrossRef]
- Held, I.M.; Soden, B.J. Robust responses of the hydrological cycle to global warming. J. Clim. 2006, 19, 5686–5699. [Google Scholar] [CrossRef]
- Allen, M.R.; Smith, L.A. Monte carlo ssa: Detecting irregular oscillations in the presence of colored noise. J. Clim. 1996, 9, 3373–3404. [Google Scholar] [CrossRef]
- Zaman, C.Q.U.; Mahmood, A.; Rasul, G.; Afzal, M. Climate Change Indicators of Pakistan; Report No: PMD-22/2009; Pakistan Meteorological Department: Islamabad, Pakistan, 2009.
- Ahmad, I.; Tang, D.; Wang, T.; Wang, M.; Wagan, B. Precipitation trends over time using mann-kendall and spearman’s rho tests in Swat river basin, Pakistan. Adv. Meteorol. 2015, 2015, 431860. [Google Scholar] [CrossRef]
- Khalid, S.; Rehman, S.U.; Shah, S.M.A.; Naz, A.; Saeed, B.; Alam, S.; Ali, F.; Gul, H. Hydro-meteorological characteristics of Chitral river basin at the peak of the Hindukush range. Nat. Sci. 2013, 5, 987. [Google Scholar] [CrossRef]
- Hartmann, H.; Buchanan, H. Trends in extreme precipitation events in the Indus river basin and flooding in Pakistan. Atmos. Ocean 2014, 52, 77–91. [Google Scholar] [CrossRef]
- Najmuddin, O.; Deng, X.; Siqi, J. Scenario analysis of land use change in Kabul river basin–a river basin with rapid socio-economic changes in Afghanistan. Phys. Chem. Earth Parts A B C 2017, 101, 121–136. [Google Scholar] [CrossRef]
- Qasim, M.; Hubacek, K.; Termansen, M.; Khan, A. Spatial and temporal dynamics of land use pattern in district Swat, Hindu Kush Himalayan region of Pakistan. Appl. Geogr. 2011, 31, 820–828. [Google Scholar] [CrossRef]
- Ullah, S.; Farooq, M.; Shafique, M.; Siyab, M.A.; Kareem, F.; Dees, M. Spatial assessment of forest cover and land-use changes in the Hindu-Kush mountain ranges of northern Pakistan. J. Mt. Sci. 2016, 13, 1229–1237. [Google Scholar] [CrossRef]
- Sajjad, A.; Adnan, S.; Hussain, A. Forest land cover change from year 2000 to 2012 of tehsil Barawal Dir Upper Pakistan. Int. J. Adv. Res. Biol. Sci. 2016, 3, 144–154. [Google Scholar]
- Ahmad, A.; Nizami, S.M. Carbon stocks of different land uses in the Kumrat valley, Hindu Kush region of Pakistan. J. For. Res. 2015, 26, 57–64. [Google Scholar] [CrossRef]
- Yar, P.; Atta-ur-Rahman, M.A.K.; Samiullah, S. Spatio-temporal analysis of urban expansion on farmland and its impact on the agricultural land use of Mardan city, Pakistan. Proc. Pak. Acad. Sci. B Life Environ. Sci. 2016, 53, 35–46. [Google Scholar]
- Raziq, A.; Xu, A.; Li, Y.; Zhao, Q. Monitoring of land use/land cover changes and urban sprawl in peshawar city in khyber pakhtunkhwa: An application of geo-information techniques using of multi-temporal satellite data. J. Remote Sens. GIS 2016, 5. [Google Scholar] [CrossRef]
- Milly, P.C.; Betancourt, J.; Falkenmark, M.; Hirsch, R.M.; Kundzewicz, Z.W.; Lettenmaier, D.P.; Stouffer, R.J. Stationarity is dead: Whither water management? Science 2008, 319, 573–574. [Google Scholar] [CrossRef] [PubMed]
- Delgado, J.M.; Apel, H.; Merz, B. Flood trends and variability in the Mekong river. Hydrol. Earth Syst. Sci. 2010, 14, 407–418. [Google Scholar] [CrossRef]
- Leclerc, M.; Ouarda, T.B. Non-stationary regional flood frequency analysis at ungauged sites. J. Hydrol. 2007, 343, 254–265. [Google Scholar] [CrossRef]
- Olsen, J.R.; Lambert, J.H.; Haimes, Y.Y. Risk of extreme events under nonstationary conditions. Risk Anal. 1998, 18, 497–510. [Google Scholar] [CrossRef]
- McNeil, A.J.; Saladin, T. Developing Scenarios for Future Extreme Losses Using the Pot Method. In Extremes and Integrated Risk Management; Embrechts, P., Ed.; CiteseerX: Zurich, Switzerland, 2000; pp. 253–267. [Google Scholar]
- Stedinger, J.R.; Crainiceanu, C.M. Climate Variability and Flood-Risk Management. In Risk-Based Decision Making in Water Resources IX; ASCE: Reston, VA, USA, 2001; pp. 77–86. [Google Scholar]
- Strupczewski, W.; Singh, V.; Mitosek, H. Non-stationary approach to at-site flood frequency modelling. III. Flood analysis of Polish rivers. J. Hydrol. 2001, 248, 152–167. [Google Scholar] [CrossRef]
- He, Y.; Bárdossy, A.; Brommundt, J. Non-Stationary Flood Frequency Analysis in Southern Germany. In Proceedings of the Seventh International Conference on Hydroscience and Engineering, Philadelphia, PA, USA, 10–13 September 2006. [Google Scholar]
- Renard, B.; Lang, M.; Bois, P. Statistical analysis of extreme events in a non-stationary context via a bayesian framework: Case study with peak-over-threshold data. Stoch. Environ. Res. Risk Assess. 2006, 21, 97–112. [Google Scholar] [CrossRef]
- Khattak, M.; Anwar, F.; Sheraz, K.; Saeed, T.; Sharif, M.; Ahmed, A. Floodplain mapping using hec-ras and arcgis: A case study of Kabul river. Arab. J. Sci. Eng. (Springer Sci. Bus. Media BV) 2016, 41, 1375–1390. [Google Scholar] [CrossRef]
- Sayama, T.; Ozawa, G.; Kawakami, T.; Nabesaka, S.; Fukami, K. Rainfall–runoff–inundation analysis of the 2010 Pakistan flood in the Kabul river basin. Hydrol. Sci. J. 2012, 57, 298–312. [Google Scholar] [CrossRef]
- Bahadar, I.; Shafique, M.; Khan, T.; Tabassum, I.; Ali, M.Z. Flood hazard assessment using hydro-dynamic model and gis/rs tools: A case study of Babuzai-Kabal tehsil Swat basin, Pakistan. J. Himal. Earth Sci. 2015, 48, 129–138. [Google Scholar]
- Aziz, A. Rainfall-runoff modeling of the trans-boundary Kabul river basin using integrated flood analysis system (ifas). Pak. J. Meteorol. 2014, 10, 75–81. [Google Scholar]
- Ullah, S.; Farooq, M.; Sarwar, T.; Tareen, M.J.; Wahid, M.A. Flood modeling and simulations using hydrodynamic model and aster dem—A case study of Kalpani river. Arab. J. Geosci. 2016, 9, 439. [Google Scholar] [CrossRef]
- Mack, T.J.; Chornack, M.P.; Taher, M.R. Groundwater-level trends and implications for sustainable water use in the Kabul basin, afghanistan. Environ. Syst. Decis. 2013, 33, 457–467. [Google Scholar] [CrossRef]
- Lashkaripour, G.R.; Hussaini, S. Water resource management in Kabul river basin, Eastern Afghanistan. Environmentalist 2008, 28, 253–260. [Google Scholar] [CrossRef]
- Tariq, M.A.U.R.; Van de Giesen, N. Floods and flood management in Pakistan. Phys. Chem. Earth Parts A B C 2012, 47, 11–20. [Google Scholar] [CrossRef]
- Anjum, M.N.; Ding, Y.; Shangguan, D.; Ijaz, M.W.; Zhang, S. Evaluation of high-resolution satellite-based real-time and post-real-time precipitation estimates during 2010 extreme flood event in Swat river basin, Hindukush region. Adv. Meteorol. 2016, 2016, 2604980. [Google Scholar] [CrossRef]
- Rasul, G.; Dahe, Q.; Chaudhry, Q. Global warming and melting glaciers along southern slopes of HKH range. Pak. J. Meteorol. 2008, 5, 63–76. [Google Scholar]
- Mann, H.B. Nonparametric tests against trend. Econom. J. Econom. Soc. 1945, 13, 245–259. [Google Scholar] [CrossRef]
- Kendall, M. Rank Correlation Methods; Charles Griffin: London, UK, 1975. [Google Scholar]
- Katz, R.W. Statistics of extremes in climate change. Clim. Chang. 2010, 100, 71–76. [Google Scholar] [CrossRef]
- Coles, S.; Bawa, J.; Trenner, L.; Dorazio, P. An Introduction to Statistical Modeling of Extreme Values; Springer: Berlin/Heidelberg, Germany, 2001; Volume 208. [Google Scholar]
- Smith, R. Extreme value statistics in meteorology and the environment. Environ. Stat. 2001, 8, 300–357. [Google Scholar]
- Shukla, R.K.; Trivedi, M.; Kumar, M. On the proficient use of gev distribution: A case study of subtropical monsoon region in India. arXiv 2012, arXiv:1203.0642. [Google Scholar]
- Massey, F.J., Jr. The kolmogorov-Smirnov test for goodness of fit. J. Am. Stat. Assoc. 1951, 46, 68–78. [Google Scholar] [CrossRef]
- Mehrannia, H.; Pakgohar, A. Using easy fit software for goodness-of-fit test and data generation. Int. J. Math. Arch. 2014, 5, 118–124. [Google Scholar]
- Lin, L.; Sherman, P.D. Cleaning Data the Chauvenet Way. In Proceedings of the SouthEast SAS Users Group, Hilton Head Island, SC, USA, 4–6 November 2007. SESUG Proceedings, Paper SA11. [Google Scholar]
- Renard, B.; Sun, X.; Lang, M. Bayesian Methods for Non-Stationary Extreme Value Analysis. In Extremes in a Changing Climate; Springer: Berlin/Heidelberg, Germany, 2013; pp. 39–95. [Google Scholar]
- Meehl, G.A.; Karl, T.; Easterling, D.R.; Changnon, S.; Pielke, R., Jr.; Changnon, D.; Evans, J.; Groisman, P.Y.; Knutson, T.R.; Kunkel, K.E. An introduction to trends in extreme weather and climate events: Observations, socioeconomic impacts, terrestrial ecological impacts, and model projections. Bull. Am. Meteorol. Soc. 2000, 81, 413–416. [Google Scholar] [CrossRef]
- Gilleland, E.; Katz, R.W. New software to analyze how extremes change over time. Eos Trans. Am. Geophys. Union 2011, 92, 13–14. [Google Scholar] [CrossRef]
- Cheng, L.; AghaKouchak, A.; Gilleland, E.; Katz, R.W. Non-stationary extreme value analysis in a changing climate. Clim. Chang. 2014, 127, 353–369. [Google Scholar] [CrossRef]
- Stephenson, A.; Tawn, J. Bayesian inference for extremes: Accounting for the three extremal types. Extremes 2004, 7, 291–307. [Google Scholar] [CrossRef]
- Ragno, E.; AghaKouchak, A.; Love, C.A.; Cheng, L.; Vahedifard, F.; Lima, C.H. Quantifying changes in future intensity-duration-frequency curves using multimodel ensemble simulations. Water Resour. Res. 2018, 54, 1751–1764. [Google Scholar] [CrossRef]
- Martins, E.S.; Stedinger, J.R. Generalized maximum-likelihood generalized extreme-value quantile estimators for hydrologic data. Water Resour. Res. 2000, 36, 737–744. [Google Scholar] [CrossRef]
- Ter Braak, C.J. A Markov chain monte carlo version of the genetic algorithm differential evolution: Easy bayesian computing for real parameter spaces. Stat. Comput. 2006, 16, 239–249. [Google Scholar] [CrossRef]
- Vrugt, J.A.; Ter Braak, C.; Diks, C.; Robinson, B.A.; Hyman, J.M.; Higdon, D. Accelerating markov chain monte carlo simulation by differential evolution with self-adaptive randomized subspace sampling. Int. J. Nonlinear Sci. Numer. Simul. 2009, 10, 273–290. [Google Scholar] [CrossRef]
- Gelman, A.; Shirley, K. Inference from Simulations and Monitoring Convergence. In Handbook. Markov Chain Monte Carlo; CRC Press: Boca Raton, FA, USA, 2011; pp. 163–174. [Google Scholar]
- Kass, R. Re kass and ae raftery. J. Am. Stat. Assoc. 1995, 90, 773–795. [Google Scholar] [CrossRef]
- Khan, A. Analysis of streamflow data for trend detection on major rivers of the indus basin. J. Himal. Earth Sci. Vol. 2015, 48, 99–111. [Google Scholar]
- Khan, K.; Yaseen, M.; Latif, Y.; Nabi, G. Detection of river flow trends and variability analysis of Upper Indus basin, pakistan. Sci. Int. 2015, 27, 1261–1270. [Google Scholar]
- Sharif, M.; Archer, D.; Fowler, H.; Forsythe, N. Trends in timing and magnitude of flow in the Upper Indus basin. Hydrol. Earth Syst. Sci. 2013, 17, 1503–1516. [Google Scholar] [CrossRef]
- Rosner, A.; Vogel, R.M.; Kirshen, P.H. A risk-based approach to flood management decisions in a nonstationary world. Water Resour. Res. 2014, 50, 1928–1942. [Google Scholar] [CrossRef]
- Sun, X.; Thyer, M.; Renard, B.; Lang, M. A general regional frequency analysis framework for quantifying local-scale climate effects: A case study of enso effects on southeast Queensland rainfall. J. Hydrol. 2014, 512, 53–68. [Google Scholar] [CrossRef]
- Halbert, K.; Nguyen, C.C.; Payrastre, O.; Gaume, E. Reducing uncertainty in flood frequency analyses: A comparison of local and regional approaches involving information on extreme historical floods. J. Hydrol. 2016, 541, 90–98. [Google Scholar] [CrossRef]
- Kyselý, J.; Gaál, L.; Picek, J. Comparison of regional and at-site approaches to modelling probabilities of heavy precipitation. Int. J. Climatol. 2011, 31, 1457–1472. [Google Scholar] [CrossRef]
- Viglione, A.; Merz, R.; Salinas, J.L.; Blöschl, G. Flood frequency hydrology: 3. A bayesian analysis. Water Resour. Res. 2013, 49, 675–692. [Google Scholar] [CrossRef]
- Kuczera, G. Combining site-specific and regional information: An empirical bayes approach. Water Resour. Res. 1982, 18, 306–314. [Google Scholar] [CrossRef]
- Sun, X.; Lall, U.; Merz, B.; Dung, N.V. Hierarchical bayesian clustering for nonstationary flood frequency analysis: Application to trends of annual maximum flow in Germany. Water Resour. Res. 2015, 51, 6586–6601. [Google Scholar] [CrossRef]
- Katz, R.W.; Parlange, M.B.; Naveau, P. Statistics of extremes in hydrology. Adv Water Resour. 2002, 25, 1287–1304. [Google Scholar] [CrossRef]
- Lima, C.H.; Lall, U.; Troy, T.; Devineni, N. A hierarchical bayesian gev model for improving local and regional flood quantile estimates. J. Hydrol. 2016, 541, 816–823. [Google Scholar] [CrossRef]
- Kwon, H.H.; Brown, C.; Lall, U. Climate informed flood frequency analysis and prediction in Montana using hierarchical bayesian modeling. Geophys. Res. Lett. 2008, 35. [Google Scholar] [CrossRef]
- Steinschneider, S.; Lall, U. A hierarchical bayesian regional model for nonstationary precipitation extremes in northern california conditioned on tropical moisture exports. Water Resour. Res. 2015, 51, 1472–1492. [Google Scholar] [CrossRef]
- Lima, C.H.; Lall, U.; Troy, T.J.; Devineni, N. A climate informed model for nonstationary flood risk prediction: Application to negro river at Manaus, Amazonia. J. Hydrol. 2015, 522, 594–602. [Google Scholar] [CrossRef]
- Machado, M.J.; Botero, B.; López, J.; Francés, F.; Díez-Herrero, A.; Benito, G. Flood frequency analysis of historical flood data under stationary and non-stationary modelling. Hydrol. Earth Syst. Sci. 2015, 19, 2561–2576. [Google Scholar] [CrossRef]
- Šraj, M.; Viglione, A.; Parajka, J.; Blöschl, G. The influence of non-stationarity in extreme hydrological events on flood frequency estimation. J. Hydrol. Hydromech. 2016, 64, 426–437. [Google Scholar] [CrossRef]
- Hounkpè, J.; Diekkrüger, B.; Badou, D.F.; Afouda, A.A. Non-stationary flood frequency analysis in the Ouémé river basin, Benin Republic. Hydrology 2015, 2, 210–229. [Google Scholar] [CrossRef]
- Xiong, L.; Du, T.; Xu, C.-Y.; Guo, S.; Jiang, C.; Gippel, C.J. Non-stationary annual maximum flood frequency analysis using the norming constants method to consider non-stationarity in the annual daily flow series. Water Resour. Manag. 2015, 29, 3615–3633. [Google Scholar] [CrossRef]


| Site# | Sub Basin and Flow Gauge Stations | Basin Area (km2) | Coefficient of Variation (Cv) | Number of Years of Record |
|---|---|---|---|---|
| Kabul River Basin | 87,499 | |||
| 1 | Kabul River at Warsak | 0.292 | 52 (1965–2016) | |
| 2 | Kabul River at Nowshera | 0.433 | 55 (1962–2016) | |
| 3 | Shahalam River | 0.724 | 30 (1987–2016) | |
| 4 | Naguman River | 0.829 | 30 (1987–2016) | |
| 5 | Adezai River | 0.739 | 30 (1987–2016) | |
| Chitral River Basin | 11,396 | |||
| 6 | Chitral River | 0.2 | 50 (1964–2013) | |
| Panjkora River Basin | 5917 | |||
| 7 | Panjkora River | 0.859 | 33 (1984–2016) | |
| Main Swat River Basin | 6066 | |||
| 8 | Swat River at Kalam | 0.2 | 59 (1961–2009) | |
| 9 | Swat River at Chakdara | 0.336 | 49 (1961–2009) | |
| 10 | Swat River at Khawazakela | 0.84 | 34 (1983–2016) | |
| 11 | Swat River at Ningolai | 1.425 | 31(1986–2016) | |
| Lower Swat River Basin | 2685 | |||
| 12 | Swat River at Munda Head Works | 0.744 | 55 (1962–2016) | |
| 13 | Khiyali River at Charsada Road | 0.815 | 48 (1969–2016) | |
| 14 | Jundi Nullah at Tangi | 3.06 | 37 (1974–2011) | |
| Jindi River Basin | 13 | |||
| 15 | Jindi River | 0.684 | 48 (1969–2016) | |
| Kalpani River Basin | 2830 | |||
| 16 | Naranji Nullah | 0.975 | 49 (1968–2016) | |
| 17 | Badri Nullah | 0.893 | 45 (1966–2010) | |
| 18 | Kalpani River at Mardan | 1.476 | 33 (1984–2016) | |
| 19 | Kalpani River at Risalpur | 0.752 | 33 (1984–2016) | |
| 20 | Dagi Nullah | 1.01 | 33 (1984–2016) | |
| 21 | Bagiari Nullah | 0.917 | 30 (1987–2016) | |
| 22 | Lund Khawar West | 1.13 | 30 (1987–2016) | |
| Bara River Basin | 3388 | |||
| 23 | Budni Nullah | 1.28 | 43 (1974–2016) | |
| 24 | Bara River at Kohat Bridge | 1.69 | 34 (1983–2016) | |
| 25 | Khuderzai Nullah | 1.65 | 32 (1980–2011) | |
| 26 | Chillah Nullah at Pabi | 1.15 | 32 (1980–2011) | |
| 27 | Hakim Garhi Nullah | 0.6 | 31 (1980–2010) | |
| 28 | Wazir Garhi Nullah | 1.69 | 30 (1981–2010) | |
| 29 | Muqam Nullah | 0.781 | 30 (1981–2010) |
| Site # | Mann–Kendall (Test-Z) | Site # | Mann–Kendall (Test-Z) | Site # | Mann–Kendall (Test-Z) |
|---|---|---|---|---|---|
| 1 | −1.54 | 11 | 4.78 *** | 21 | 3.28 ** |
| 2 | −0.35 | 12 | −0.89 | 22 | 2.83 ** |
| 3 | 0.41 | 13 | 1.18 | 23 | −1.28 |
| 4 | −2.02 * | 14 | 0.86 | 24 | 2.28 * |
| 5 | 2.61 ** | 15 | −0.37 | 25 | −1.19 |
| 6 | 2.80 ** | 16 | 1.79 + | 26 | −0.67 |
| 7 | 0.93 | 17 | −3.07 ** | 27 | 0.34 |
| 8 | −1.36 | 18 | 3.24 ** | 28 | −0.54 |
| 9 | 1.73 + | 19 | 2.13 * | 29 | −0.83 |
| 10 | −2.36 * | 20 | 0.16 |
| Site # | Gauge Stations | GEV Parameters | Anderson–Darling Test | Kolmogorov–Smirnov Test | |
|---|---|---|---|---|---|
| A-D Statistics | K-S Statistics | p-Value | |||
| 5 | Adezai River | ξ = 0.07899 σ = 454.66 µ = 521.18 | 0.6903 | 0.15394 | 0.43251 |
| 6 | Chitral River | ξ = 0.00307 σ = 143.37 µ = 1026.5 | 0.22503 | 0.06435 | 0.97732 |
| 9 | Swat River at Chakdara | ξ = 0.13247 σ = 152.1 µ = 646.8 | 0.66053 | 0.10305 | 0.59055 |
| 11 | Swat River at Ningolai | ξ = 0.52162 σ = 103.82 µ = 83.499 | 0.60066 | 0.1453 | 0.48501 |
| 16 | Naranji Nullah | ξ = 0.25789 σ = 77.168 µ = 81.939 | 0.19219 | 0.06263 | 0.98424 |
| 18 | Kalpani River at Mardan | ξ = 0.55205 σ = 106.9 µ = 77.204 | 1.2218 | 0.17818 | 0.21796 |
| 19 | Kalpani River at Risalpur | ξ = 0.20781 σ = 441.0 µ = 604.88 | 0.42201 | 0.10944 | 0.7987 |
| 21 | Bagiari Nullah | ξ = 0.06073 σ = 112.05 µ = 94.608 | 1.838 | 0.22761 | 0.08399 |
| 22 | Lund Khawar West | ξ = 0.37899 σ = 3.7993 µ = 3.164 | 0.48511 | 0.12903 | 0.7523 |
| 24 | Bara River at Kohat Bridge | ξ = 0.57308 σ = 16.871 µ = 9.4788 | 1.2595 | 0.15782 | 0.33006 |
| Site # | Station Name | Historical Extreme (Outliers) | Observed Value | Critical Value |
|---|---|---|---|---|
| 5 | Adezai River | 2285 | 2.449 | 2.394 |
| 6 | Chitral River | 1633/1603 | 2.941/2.76 | 2.576 |
| 9 | Swat River at Chakdara | 1918/1602 | 4.6/3.35 | 2.576 |
| 11 | Swat River at Ningolai | 1475 | 3.447 | 2.406 |
| 16 | Naranji Nullah | 850 | 4.748 | 2.576 |
| 18 | Kalpani River at Mardan | 1499 | 3.182 | 2.429 |
| 19 | Kalpani River at Risalpur | 3358 | 3.316 | 2.418 |
| 21 | Bagiari Nullah | 473 | 2.102 | 2.394 |
| 22 | Lund Khawar West | 37 | 3.235 | 2.394 |
| 24 | Bara River at Kohat Bridge | 331 | 4.234 | 2.44 |
| Site # | 5 | 6 | 9 | 11 | 16 | 18 | 19 | 21 | 22 | 24 |
|---|---|---|---|---|---|---|---|---|---|---|
| 5 | 1 | 0.24 | −0.04 | 0.63 | 0.35 | 0.61 | 0.14 | 0.25 | 0.39 | 0.48 |
| 6 | 0.24 | 1 | 0.29 | 0.11 | 0.42 | 0.33 | 0.42 | 0.37 | 0.38 | 0.41 |
| 9 | −0.04 | 0.29 | 1 | 0.11 | 0.11 | −0.05 | −0.22 | −0.02 | −0.17 | 0.04 |
| 11 | 0.63 | 0.11 | 0.11 | 1 | 0.2 | 0.59 | 0.04 | 0.49 | 0.6 | 0.21 |
| 16 | 0.35 | 0.42 | 0.12 | 0.2 | 1 | 0.41 | 0.47 | 0.29 | 0.32 | 0.63 |
| 18 | 0.61 | 0.33 | −0.05 | 0.59 | 0.41 | 1 | 0.63 | 0.53 | 0.52 | 0.54 |
| 19 | 0.14 | 0.42 | −0.22 | 0.04 | 0.47 | 0.63 | 1 | 0.65 | 0.64 | 0.42 |
| 21 | 0.25 | 0.37 | −0.02 | 0.49 | 0.29 | 0.53 | 0.65 | 1 | 0.41 | 0.2 |
| 22 | 0.39 | 0.38 | −0.17 | 0.6 | 0.32 | 0.52 | 0.64 | 0.41 | 1 | 0.47 |
| 24 | 0.48 | 0.41 | 0.04 | 0.21 | 0.63 | 0.54 | 0.42 | 0.2 | 0.47 | 1 |
| Site # | Station Name | Historical Extreme m3 s−1 | Stationary m3 s−1 | Non-Stationary m3 s−1 | Difference b/w Stationary & Non-Stationary m3 s−1 | Percent Difference (%) | Bayes Factor | % Difference between Preferred Model and Historical Extreme |
|---|---|---|---|---|---|---|---|---|
| 5 | Adezai River | 2285 | 4276 | 2782 | 1494 | 34.9 | 0.0058 | 17.86 |
| 6 | Chitral River | 1633 | 1895 | 1918 | −23 | −1.19 | 0.068 | 14.85 |
| 9 | Swat River at Chakdara | 1918 | 1991 | 2686 | −695 | −25.8 | 7.06 | 3.8 |
| 11 | Swat River at Ningolai | 1475 | 2891 | 2528 | 363 | 12.5 | 0.0065 | 41.65 |
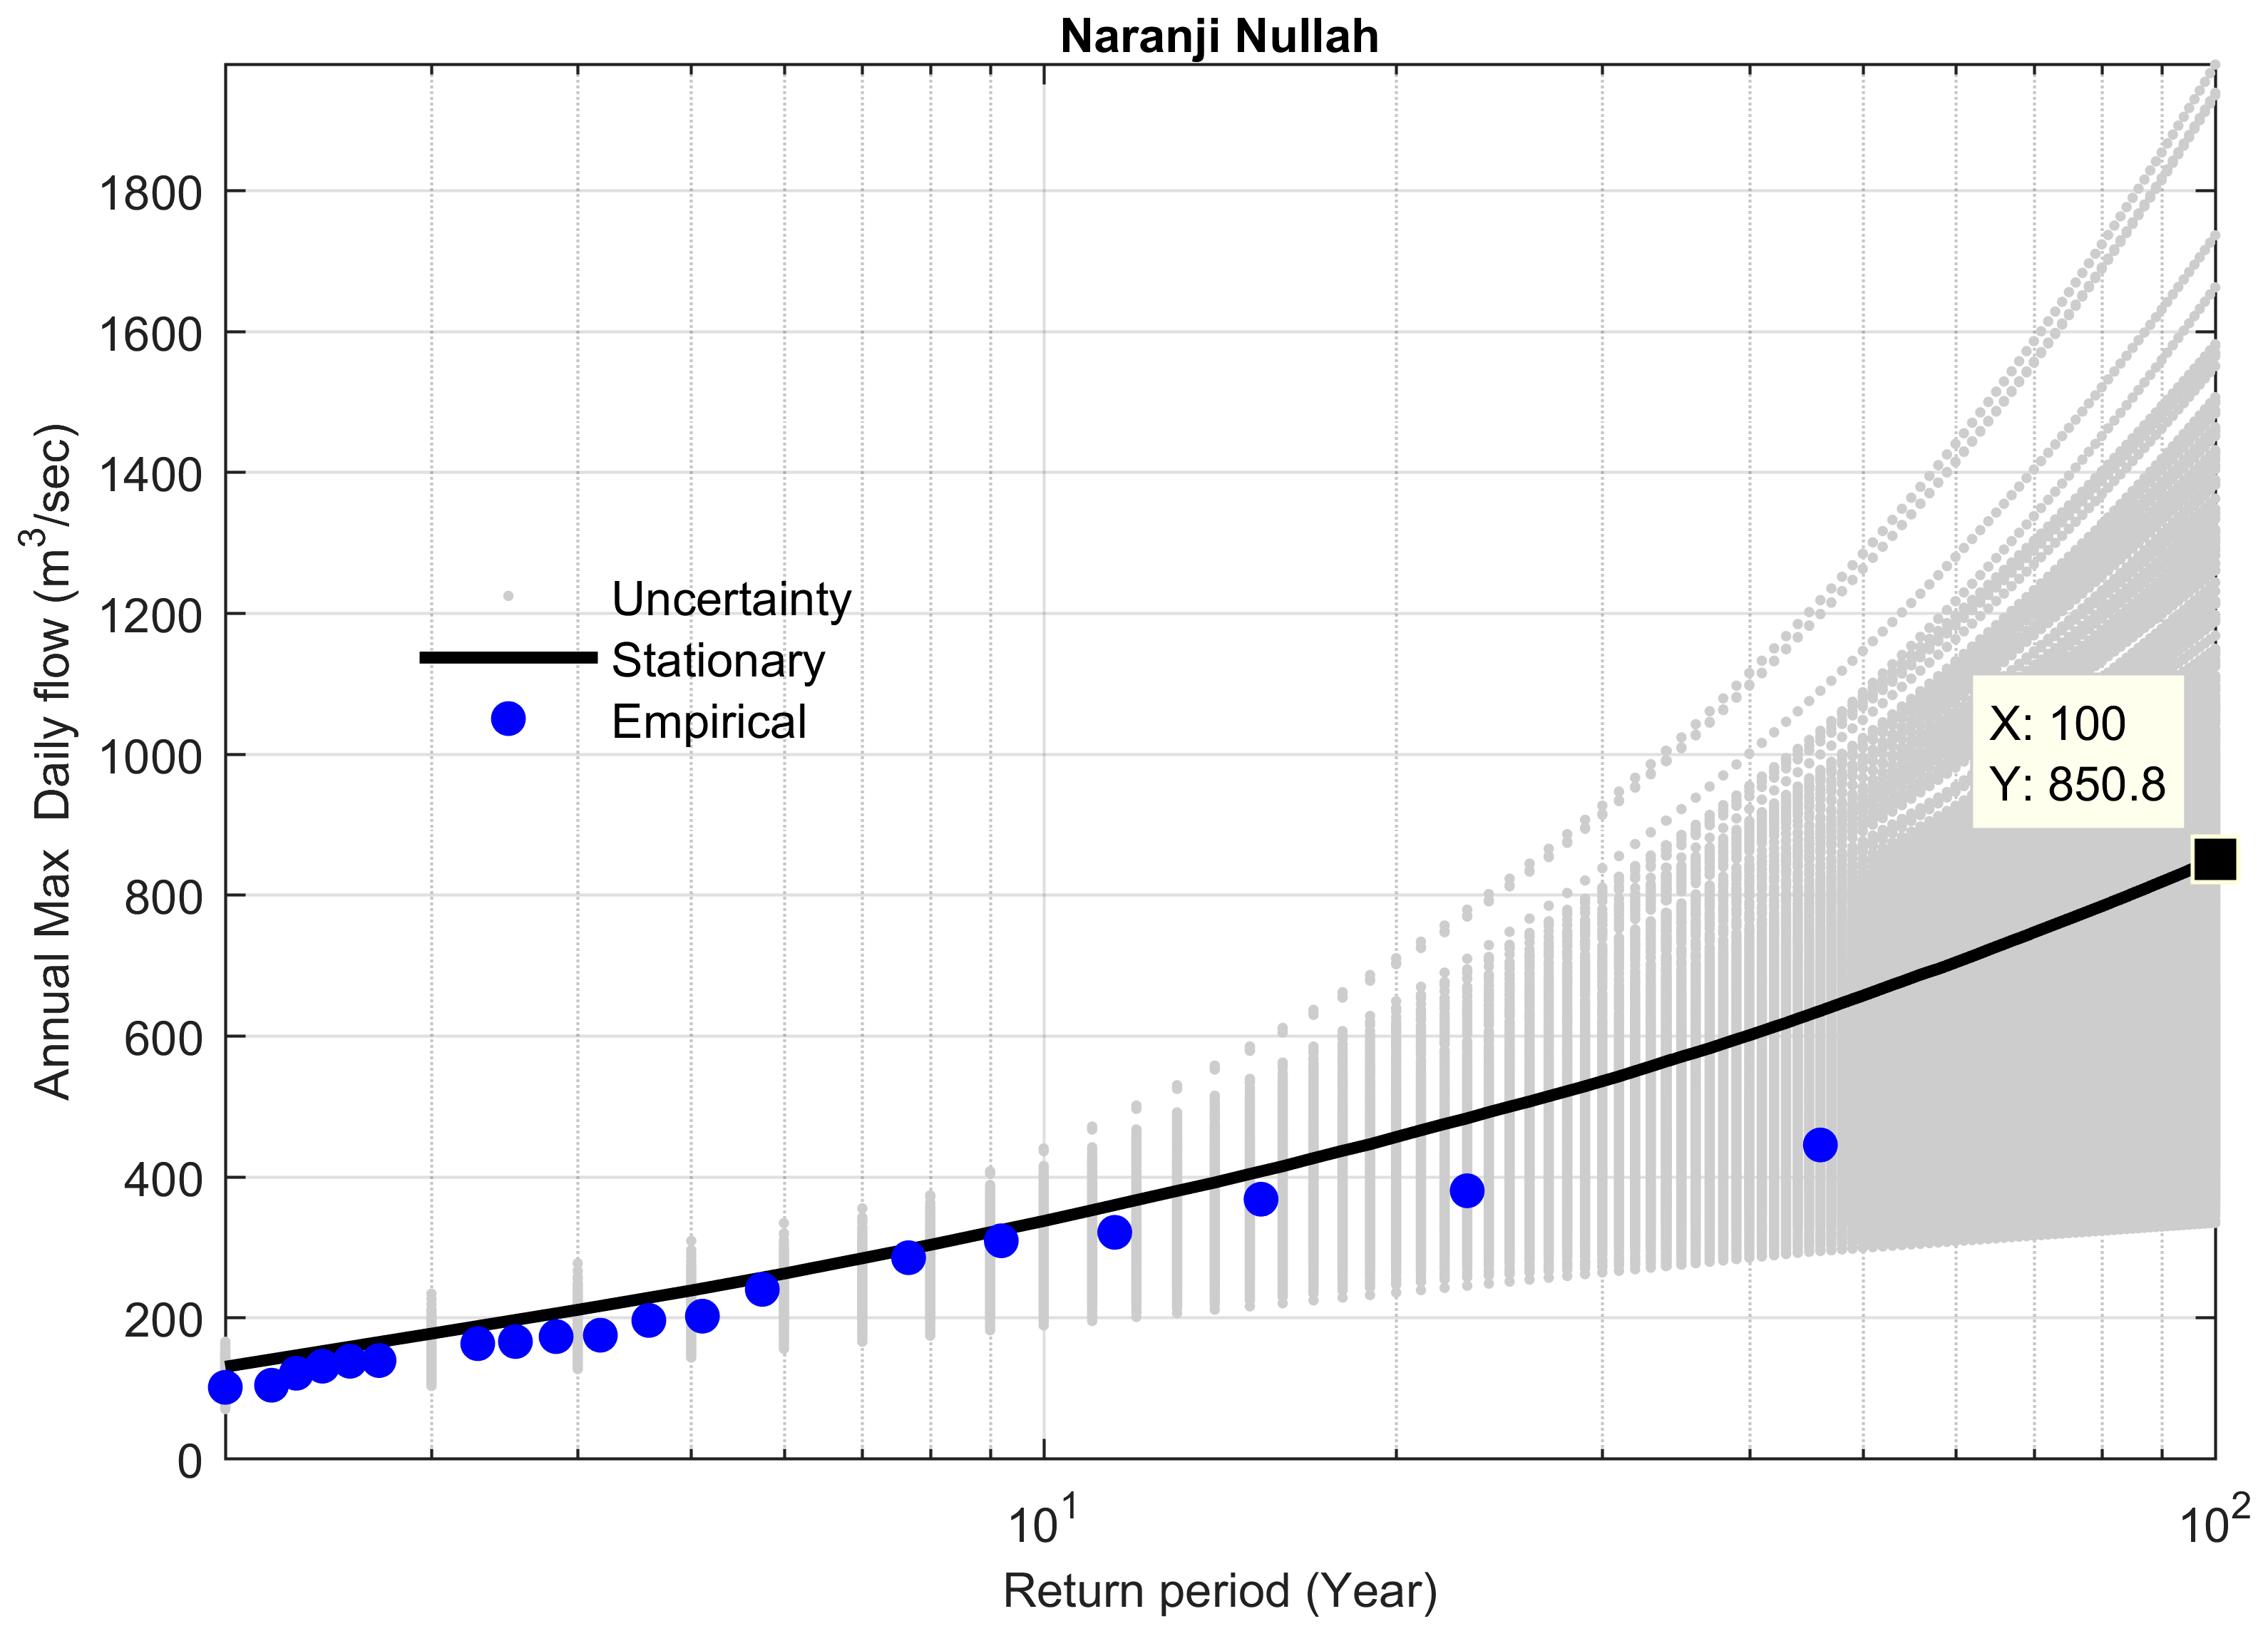
| 16 | Naranji Nullah | 850 | 1127 | 1222 | −95 | −7.7 | 9.55 | 24.6 |
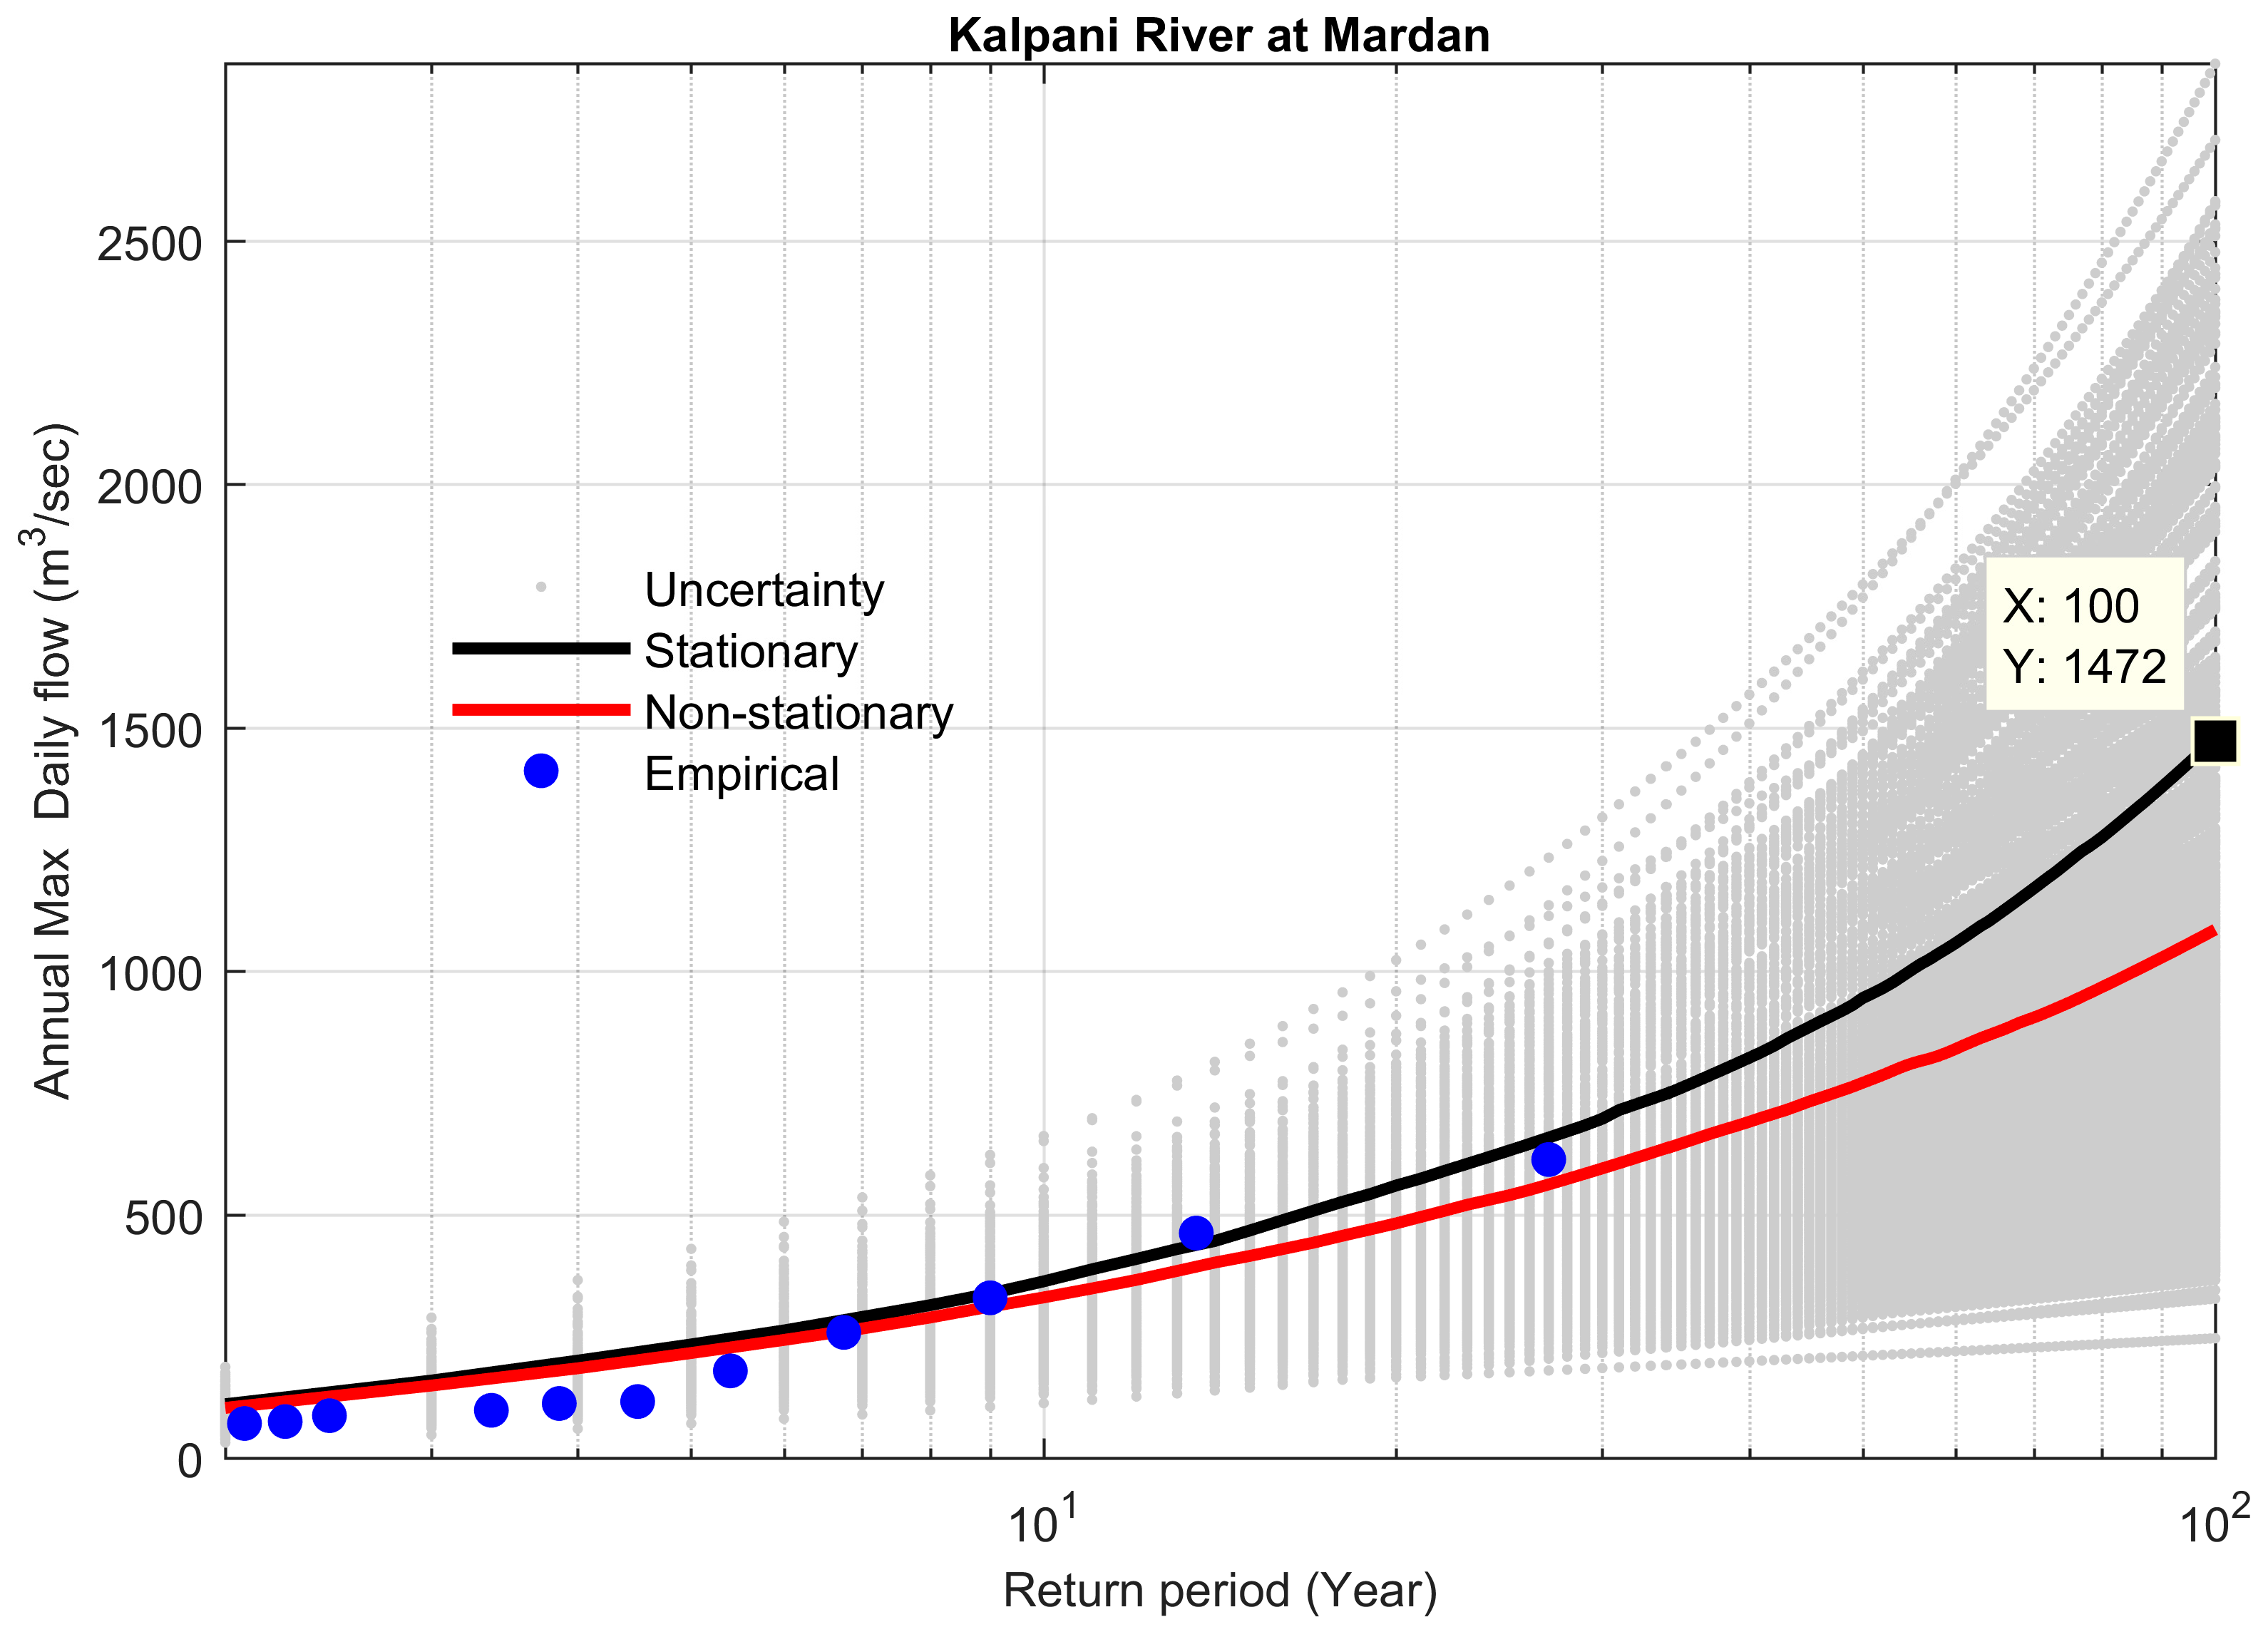
| 18 | Kalpani River at Mardan | 1499 | 3881 | 2887 | 1054 | 27.15 | −Infinity | 48.14 |
| 19 | Kalpani River at Risalpur | 3358 | 4918 | 5140 | −222 | −4.31 | 0.4348 | 34.66 |
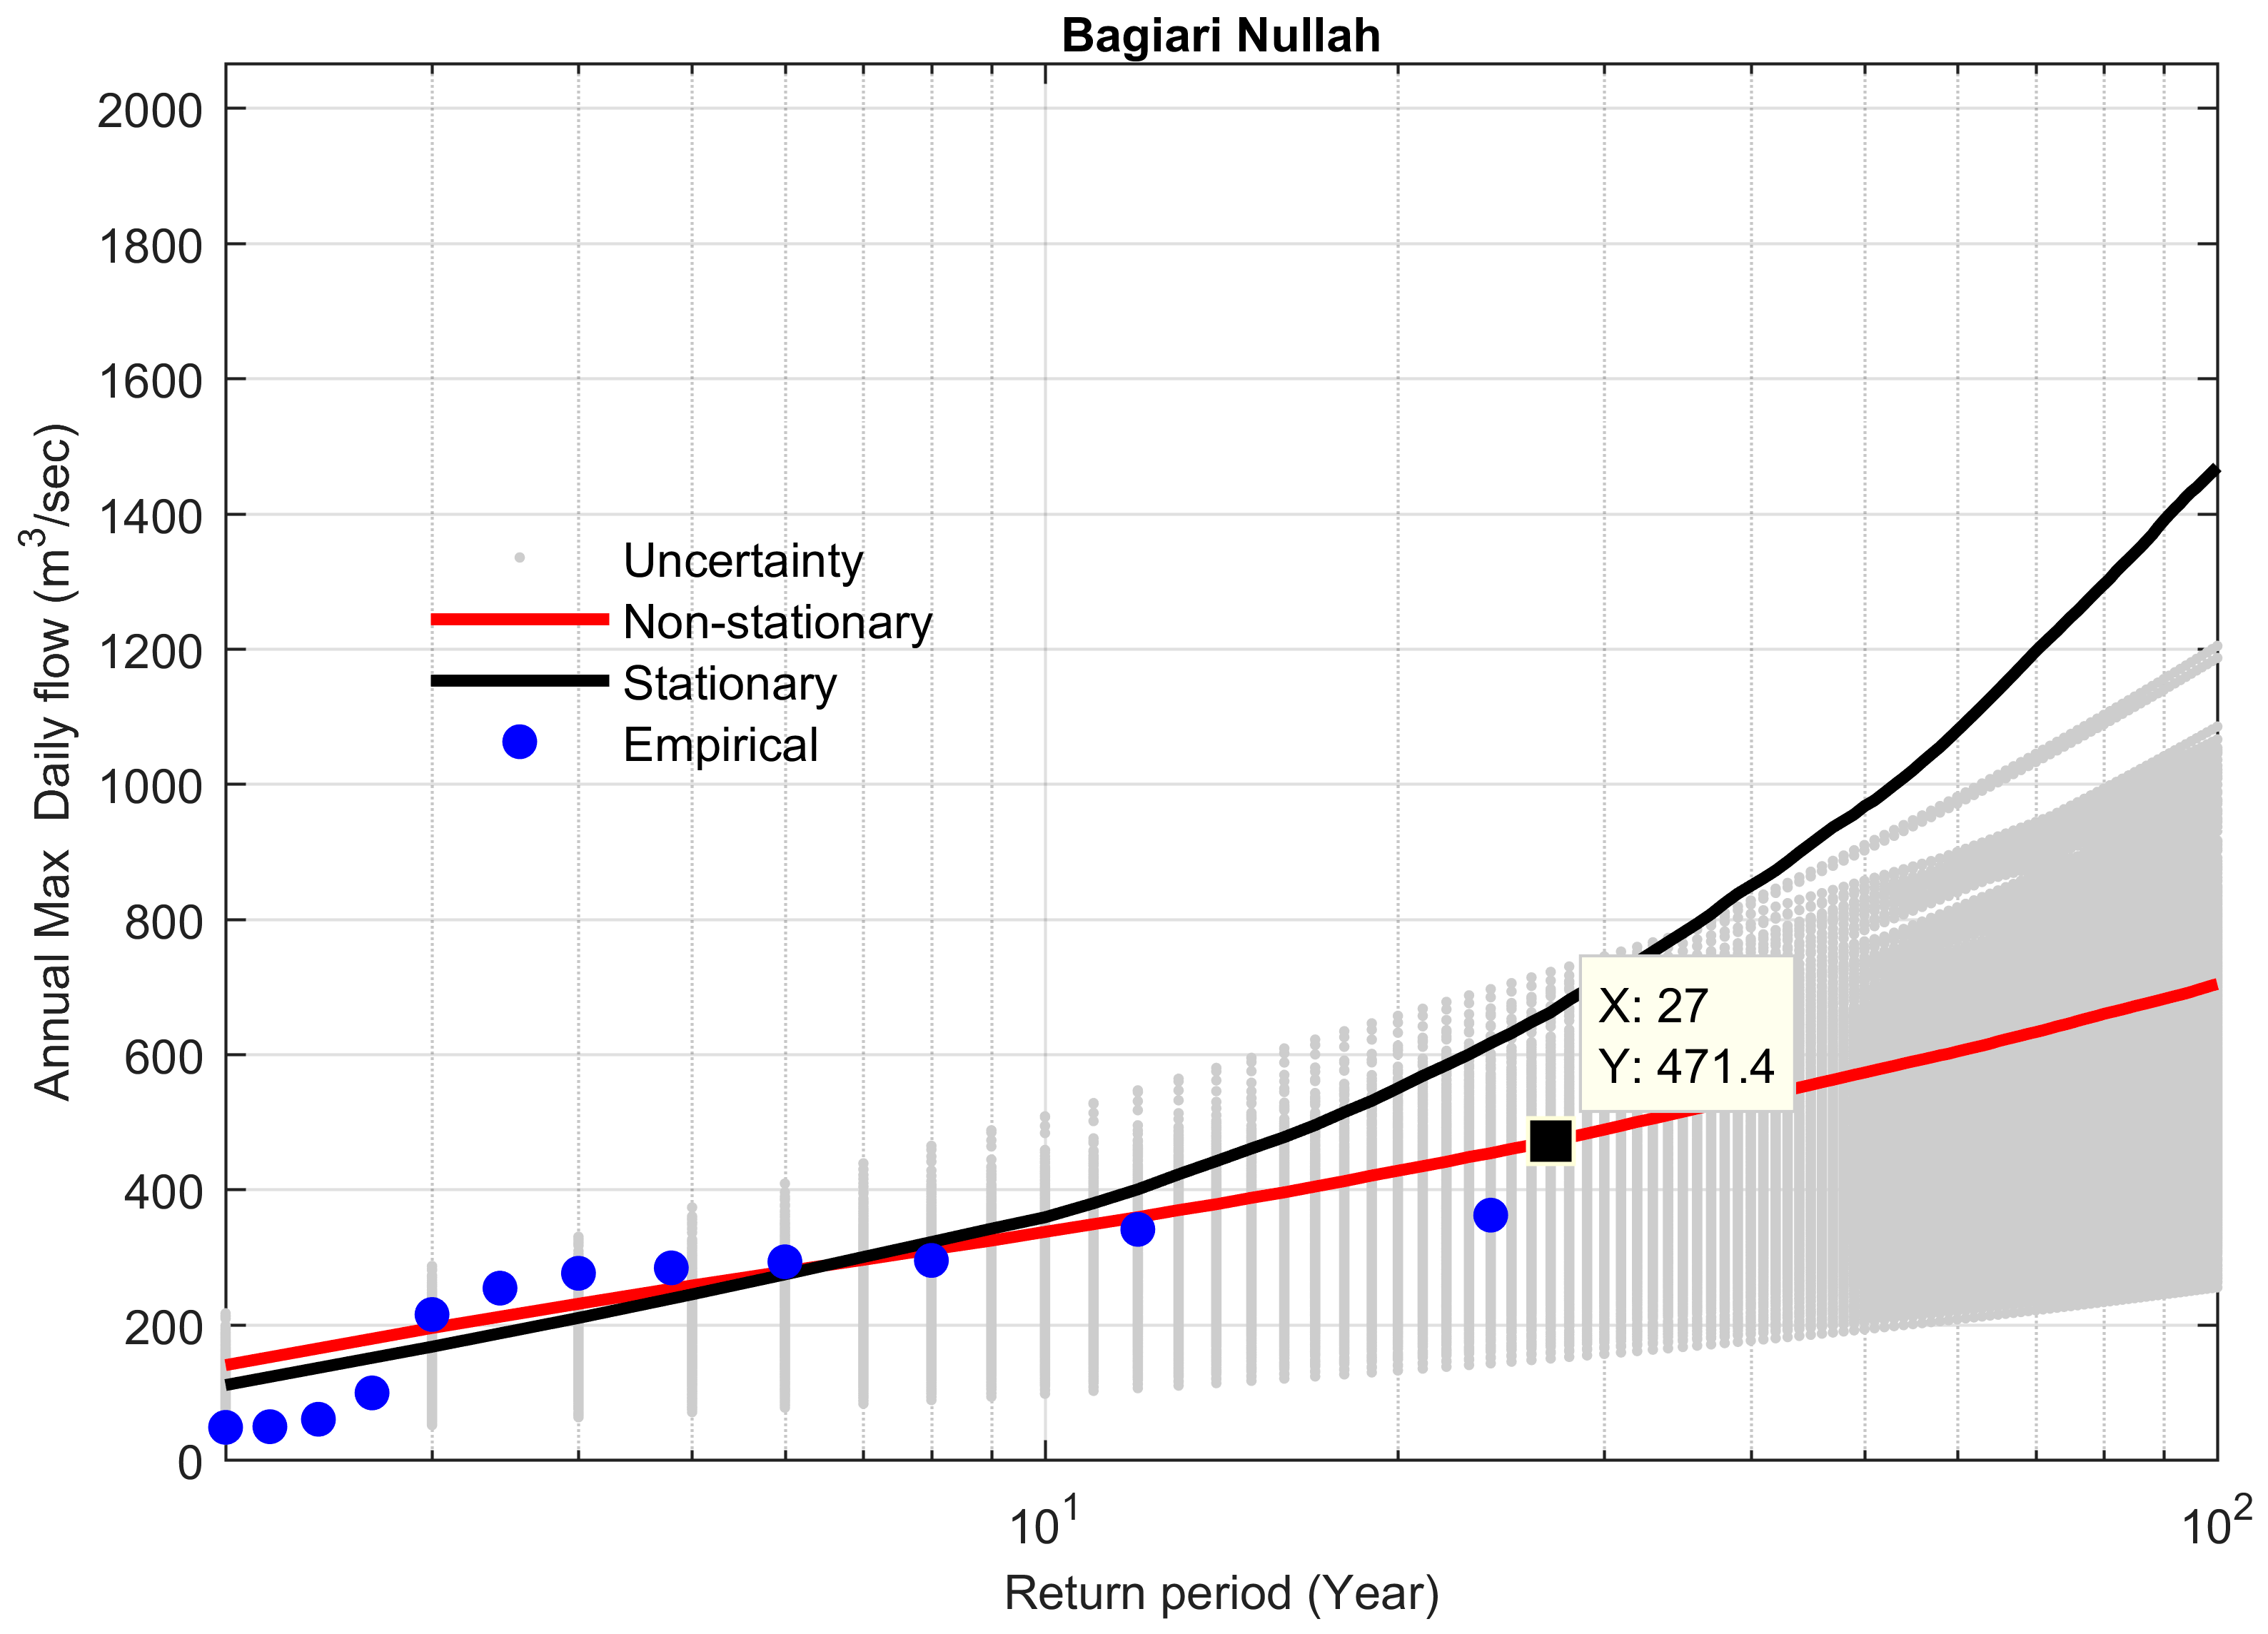
| 21 | Bagiari Nullah | 473 | 1666 | 819 | 847 | 50.8 | 0.0321 | 42.24 |
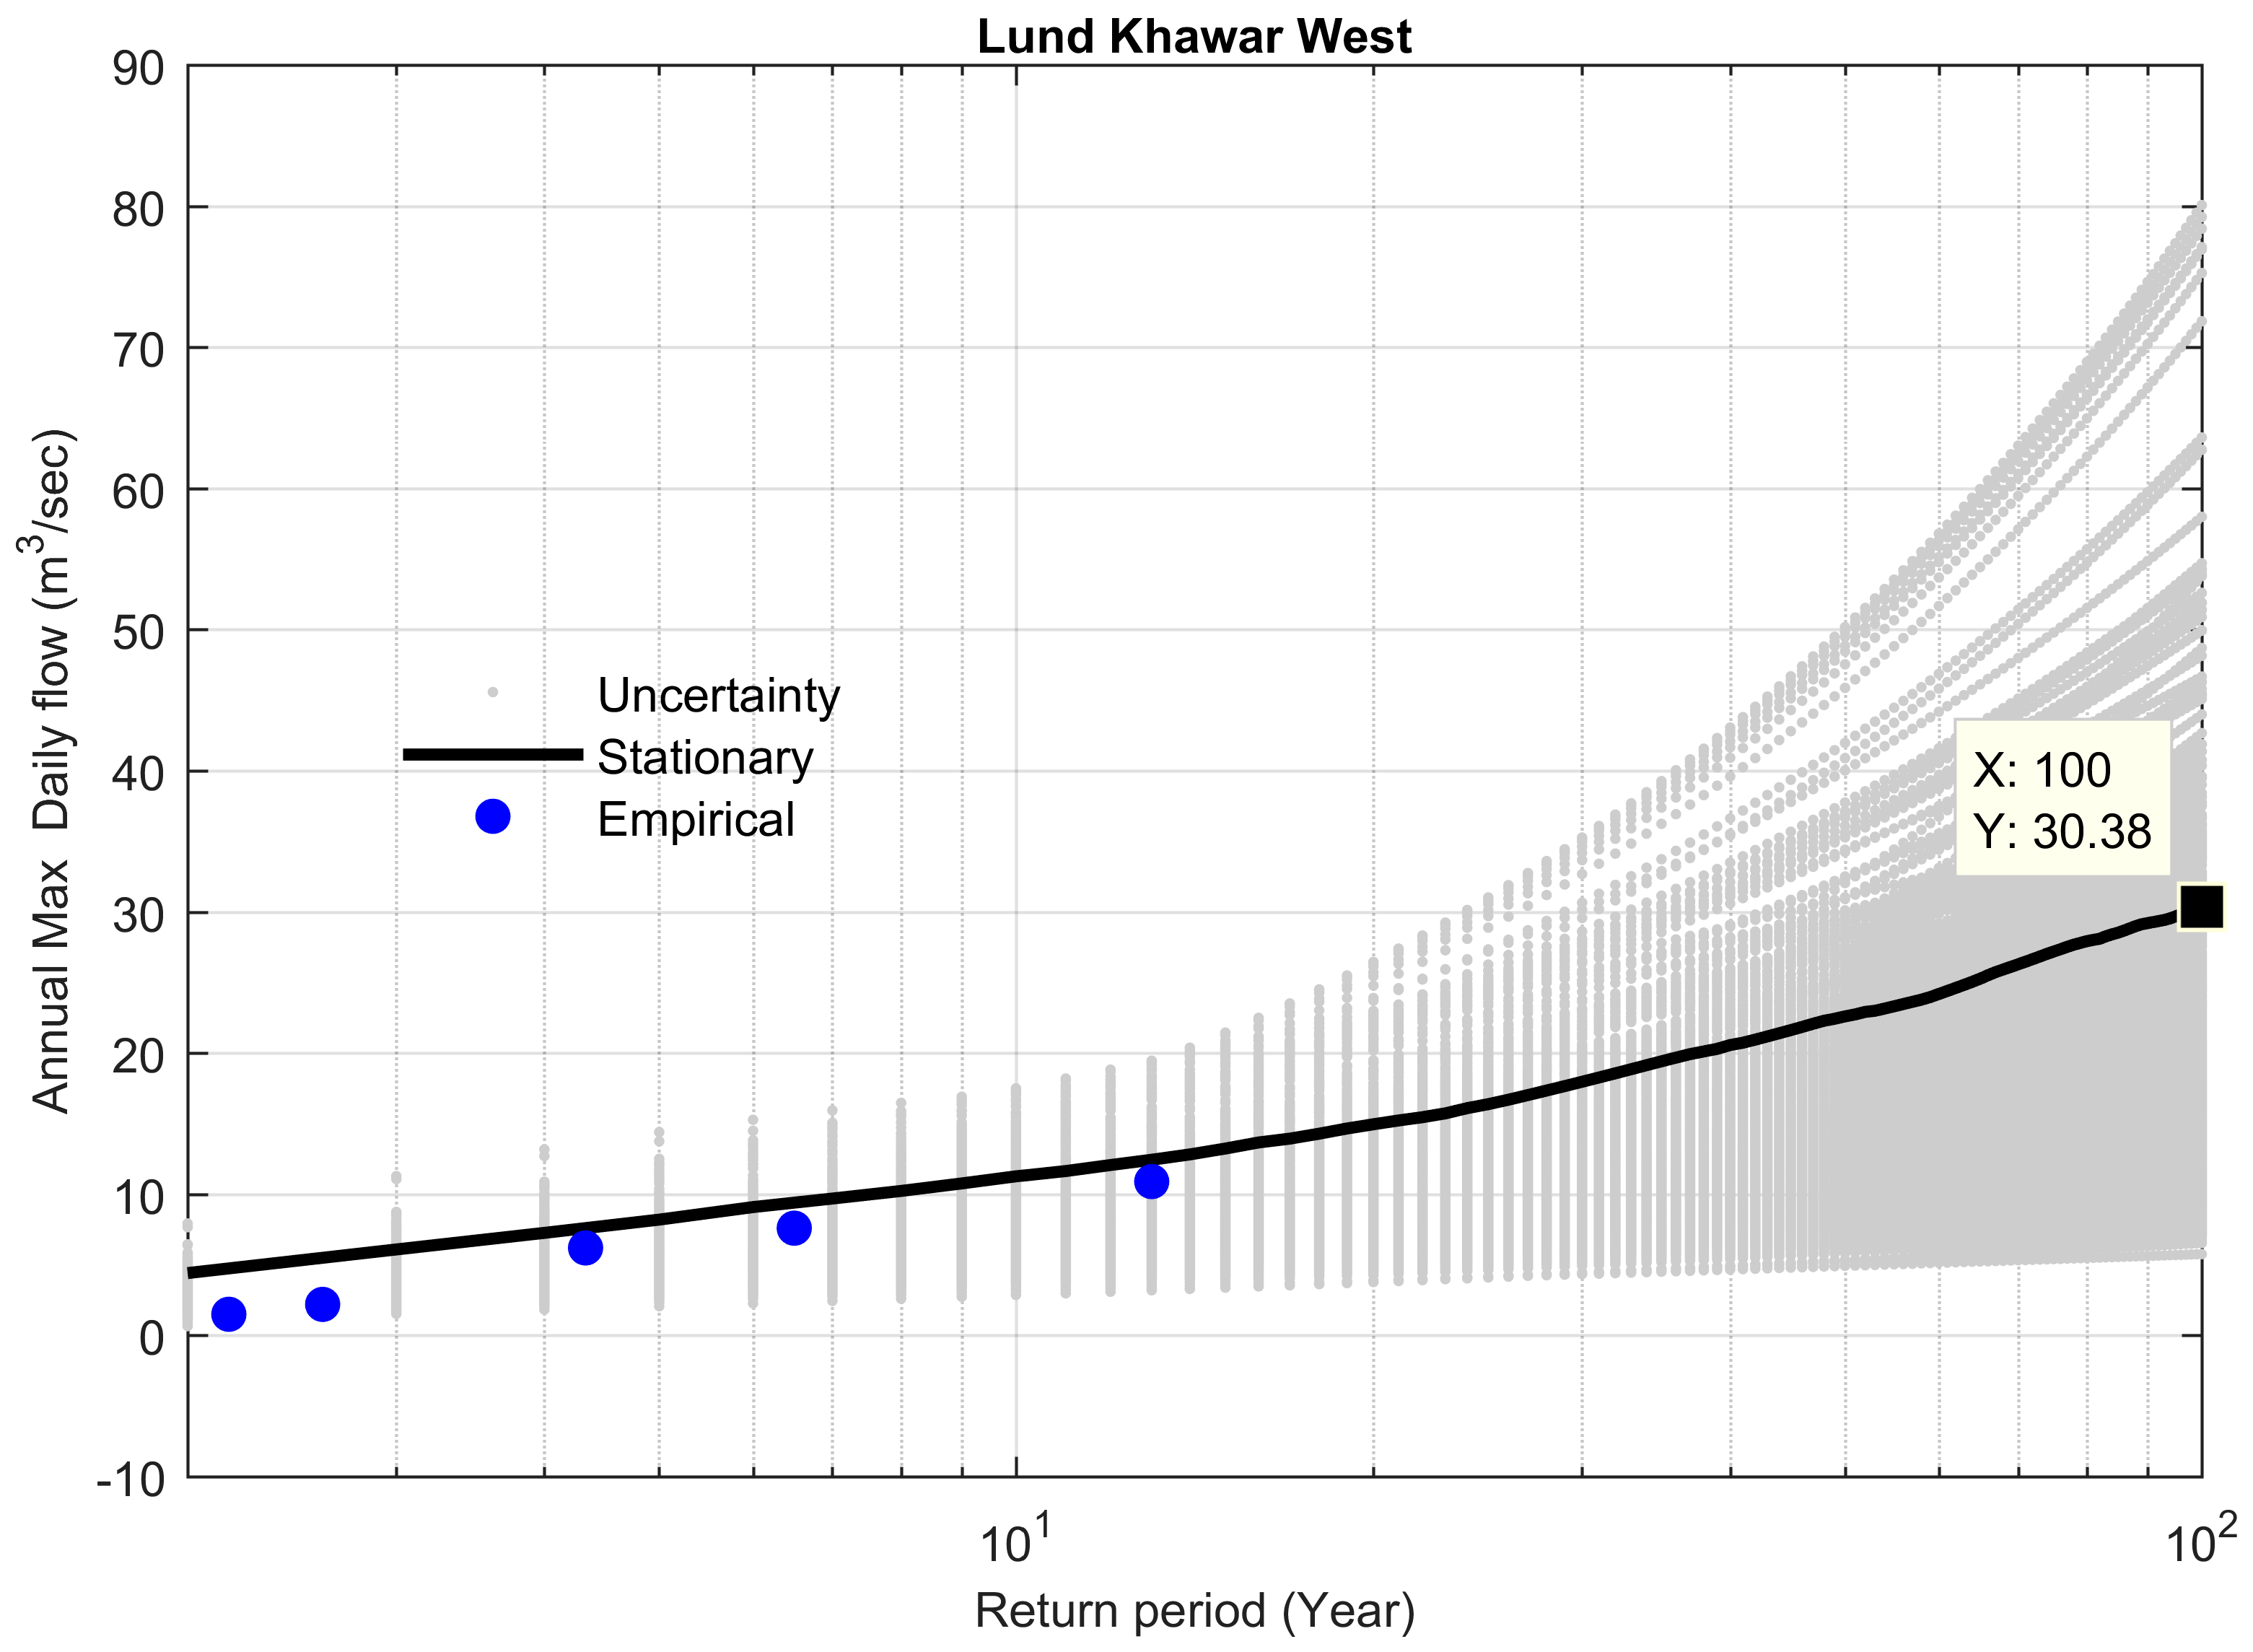
| 22 | Lund Khawar West | 37 | 76 | 51 | 25 | 32.89 | 0.11 | 27.45 |
| 24 | Bara River at Kohat Bridge | 331 | 686.7 | 357.5 | 330.9 | 48.18 | −Infinity | 7.2 |
| Site # | Time Series Length | Extreme Event (Year) | Mann–Kendall (Test-Z) | Stationary m3 s−1 | Non-Stationary m3 s−1 | Difference between Stationary and Non-Stationary m3 s−1 | Percent Difference (%) | Bayes Factor |
|---|---|---|---|---|---|---|---|---|
| 5 | 1987–2009 | 2010 | −0.05 | 3300 | N/A | N/A | N/A | N/A |
| 6 | 1964–2004 | 2005/2010 | 2.88 ** | 1701 | 1978 | 277 | 14 | 0.0054 |
| 9 | 1961–1991 | 1992 | 1.42 | 1746 | N/A | N/A | N/A | N/A |
| 11 | 1986–2015 | 2016 | 4.49 *** | 2211 | 1295 | 916 | 41.43 | 15.167 |
| 16 | 1968–2009 | 2010 | 1.31 | 850.8 | N/A | N/A | N/A | N/A |
| 18 | 1984–2009 | 2010 | 2.29 * | 1472 | 1085 | 387 | 26.3 | 0.1208 |
| 19 | 1984–2009 | 2010 | 2.76 ** | 4580 | 3595 | 990 | 21.6 | 0.008 |
| 21 | 1987–2009 | 2010 | 2.2 * | 1469 | 704 | 765 | 52 | 0.016 |
| 22 | 1987–1996 | 1997 | −0.28 | 30.38 | N/A | N/A | N/A | N/A |
| 24 | 1983–2009 | 2010 | 1.15 | 339.6 | 355 | 15.4 | 4.33 | +Infinity |
© 2019 by the authors. Licensee MDPI, Basel, Switzerland. This article is an open access article distributed under the terms and conditions of the Creative Commons Attribution (CC BY) license (http://creativecommons.org/licenses/by/4.0/).
Share and Cite
Mehmood, A.; Jia, S.; Mahmood, R.; Yan, J.; Ahsan, M. Non-Stationary Bayesian Modeling of Annual Maximum Floods in a Changing Environment and Implications for Flood Management in the Kabul River Basin, Pakistan. Water 2019, 11, 1246. https://doi.org/10.3390/w11061246
Mehmood A, Jia S, Mahmood R, Yan J, Ahsan M. Non-Stationary Bayesian Modeling of Annual Maximum Floods in a Changing Environment and Implications for Flood Management in the Kabul River Basin, Pakistan. Water. 2019; 11(6):1246. https://doi.org/10.3390/w11061246
Chicago/Turabian StyleMehmood, Asif, Shaofeng Jia, Rashid Mahmood, Jiabao Yan, and Moien Ahsan. 2019. "Non-Stationary Bayesian Modeling of Annual Maximum Floods in a Changing Environment and Implications for Flood Management in the Kabul River Basin, Pakistan" Water 11, no. 6: 1246. https://doi.org/10.3390/w11061246
APA StyleMehmood, A., Jia, S., Mahmood, R., Yan, J., & Ahsan, M. (2019). Non-Stationary Bayesian Modeling of Annual Maximum Floods in a Changing Environment and Implications for Flood Management in the Kabul River Basin, Pakistan. Water, 11(6), 1246. https://doi.org/10.3390/w11061246