Article

Advanced Supervisory Control System Implemented at Full-Scale WWTP—A Case Study of Optimization and Energy Balance Improvement

by
Jakub Drewnowski
1,2
1
Faculty of Civil and Environmental Engineering, Gdansk University of Technology, Narutowicza Str. 11/12, 80-233 Gdansk, Poland
2
College of Environmental Science and Engineering, Tongji University, 1239 Siping Road, Shanghai 200092, China
Water 2019, 11(6), 1218; https://doi.org/10.3390/w11061218
Submission received: 18 November 2018 / Revised: 28 March 2019 / Accepted: 6 May 2019 / Published: 11 June 2019
(This article belongs to the Special Issue Advances in Water and Wastewater Monitoring and Treatment Technology)

Abstract

:
In modern and cost-effective Wastewater Treatment Plants (WWTPs), processes such as aeration, chemical feeds and sludge pumping are usually controlled by an operating system integrated with online sensors. The proper verification of these data-driven measurements and the control of different unit operations at the same time has a strong influence on better understanding and accurately optimizing the biochemical processes at WWTP—especially energy-intensive biological parts (e.g., the nitrification zone/aeration system and denitrification zone/internal recirculation). In this study, by integrating a new powerful PreviSys with data driven from the Supervisory Control and Data Acquisition (SCADA) software and advanced algorithms such as Model Predictive Control (MPC) by using the WEST computer platform, it was possible to conduct different operation strategies for optimizing and improving the energy balance at a full-scale “Klimzowiec” WWTP located in Chorzow (Southern Poland). Moreover, the novel concept of double-checking online data-driven measurements (from installed DO, NO3, NH4 sensors, etc.) by mathematical modelling and computer simulation predictions was applied in order to check the data uncertainty and develop a support operator system (SOS)—an additional tool for the widely-used in-operation and control of modern and cost-effective WWTPs. The results showed that by using sophisticated PreviSys technology, a better understanding and accurate optimization of biochemical processes, as well as more sustainable WWTP operation, can be achieved.

1. Introduction

The Polish National Program for Municipal Wastewater Treatment Plants (WWTPs) in accordance with European Union (EU) strategies has begun identifying and solving wastewater treatment management challenges in the context of energy-neutral operations. The increasing demand for control and process optimization in WWTPs require advanced technology for the energy balance improvement of the activated sludge system. Mathematical modeling and computer simulations have become helpful tools in the analysis of each part of wastewater treatment and its effectiveness. By using advanced software (WEST, GPS-x, SIMBA, AQUASIM, etc.), it is possible to create a model of a full-scale WWTP in order to run a simulation and, subsequently, interpret results under various operational conditions [1,2,3]. The laboratory tests, online measurements and additional calculations (e.g., COD fractions and biochemical processes rates) should be carried out to better integrate the computer model to the conditions prevailing in the local parameters of each individual part of WWTPs [4]. In addition, the development of instrumentation, control and automation (ICA) as well as mathematical modeling and computer simulations (MMCS) currently need more detailed data and analyses of whole technological processes in order to take into account the specific variables in each modeled device/unit within real conditions. However, many automatic control strategies have shown their usefulness in full-scale WWTPs or even in a pilot-scale simulation process for improving the modeled object performance without requiring structural changes [5,6,7,8,9,10] due to the still-low reliability of the data provided by online sensors and analyzers [11]. The specific MMCS platforms (e.g., GPS-x, WEST®/Tornado, Simba) provide quite limited and, in most cases, values that are too idea for the behaviors of sensors and actuators based on the controller models. Moreover, general-purpose modeling and simulation tools (e.g., MATLAB®/Simulink®, C++ Generator) lack specific wastewater treatment processes that are integrated into the model libraries and/or general purpose simulation packages, commonly used for the design and implementation of wastewater automatic controllers in full-scale WWTPs. Therefore, the knowledge of the building process of the architecture structure and the complex model to create an advanced supervisory control system (ASCS) through mathematical representation and computer simulations was used according to the literature (e.g., References [12,13]) and the author’s experience from this study and a previous study (model-based evaluation of plant improvement at one of the largest facilities in Northern Poland “Debogorze” WWTP presented by Drewnowski et al. [2]).
Generally, a well-prepared model should include all physical and biochemical processes and reflect sensor data-driven measurements in order to be operated in a similar way to the WWTP under dynamic simulations. The main point of a creating a newly added control system based on the implemented model is to make the process output behave in the desired way by manipulating the WWTP inputs, such as air blowers, valves and pumps. The accuracy of the model predictions is entirely dependent on the degree of calibration/validation conducted, but sometimes it could be a challenge to lead the stable process conditions to the demanded results and cost-effective process operation. Especially if the WWTP operational data are being used for the calibration/validation of the model; usually a period of equilibrium is used to establish the performance of the plant and the kinetic and stoichiometric parameters are adjusted according to the MMCS practice. Ideally, if there are different operating conditions during another period (e.g., lower temperatures in winter) and/or dynamic data, these could be used to verify the model and validation process [14]. Currently, in modern and cost-effective WWTPs processes such as aeration, chemical feeds and sludge pumping, these are generally controlled by an operating system integrated with online probe and sensor measurements. The proper verification of these different instrumentations and units is crucial for the estimation of the most sensitive parameters in the model and for the final implementation at a full-scale plant. The previous study at the “Klimzowiec” WWTP conducted by Drewnowski and Zmarzly [15] showed that actual online measurements (e.g., the N-NO3 and/or N-NH4 sensor(s)) located at the bioreactor or final clarifier could be unstable and generate serious problems (usually faults and/or uncertain data occur, e.g., after flocs attach to/block sensitive measurement areas of the probe/sensor) in the operating WWTP—especially a biological part (such as the nitrification zone/aeration system and denitrification zone/internal recirculation) which is the most energy-intensive area.
As the energy balance gains attention and the new approach emphasizes sustainability in wastewater treatment, a more complex analysis and criteria have to be considered. A sensible approach is to report the energy consumption in WWTPs per unit of pollutant removed, i.e., the amount of TSS, BOD, COD, N and/or P removed, depending on the object of the study and plant treatment scheme [16]. Several authors have used the kWh/kg TSS removed, kWh/kg BOD removed and kWh/kg COD removed [17,18,19], kWh/kg N removed is the case in which the nitrogen removal processes on an annual basis [20] or a combination of these indicators where both organic matter and nutrients (N, P) are merged and converted in terms of a reference unit such as PO43− equivalent [21]. The advantage of reporting the energy consumption per unit of pollutant removed relies on the fact that the removal of organic matter and nutrients are major contributors to the energy consumption in WWTPs during biological treatment [16,22]. The aeration of bioreactors may account for 50–75% of the total electric energy consumption in WWTPs [23,24,25]. Optimizing the aeration system is essential for achieving cost-effective biological wastewater treatment and, finally, introducing environmentally-friendly plants by reducing the energy required for operating the activated sludge systems. In this study, the innovative PreviSys unit projected and produced by ZapSoft Ltd. was implemented as an advanced supervisory control system for operating the biological nutrient removal (BNR) process at the full-scale “Klimzowiec” WWTP located in Chorzow (Southern Poland). In contrast to the Supervisory Control and Data Acquisition (SCADA) software that is wildly applied for wastewater treatment control and operations, integrating a new powerful PreviSys with data-driven and advanced algorithms such as Model Predictive Control (MPC) by using the WEST computer platform made it possible to conduct different operation strategies for BNR process optimization and to improve the energy balance at the studied plant. The aim of this study was to evaluate a novel concept of double-checking the data-driven measurements (from installed DO, NO3, NH4 sensors, etc.) obtained from mathematical modeling and computer simulation predictions using the WEST computer platform for the verification of the data uncertainty and to develop a support operator system (SOS)—an additional tool for the widely-used in-operation and control of modern and cost-effective WWTPs.

2. Materials and Methods

The study was divided into two steps: the experimental and modeling steps. The experimental part of the study comprised several laboratory “batch tests” and a measurement campaign (“tracer test”) in the full-scale bioreactor. The modeling part was supported by the WEST platform with ASM2d in order to evaluate the COD fractionation and it was implemented in a plant-wide model in the PreviSys for the appropriate optimization and operation of the BNR activated sludge system. In the beginning—the labeled “steady-state”—the studied plant characteristics and the collection of the operational data according to the Good Modelling Practice (GMP) were provided [26]. Regarding this, an existing model of the “Klimzowiec” WWTP was created in the WEST software and was tested on the standard stable full-scale operational conditions of biological treatment. In the next step, called the “dynamic state”, the stoichiometric and kinetic parameters were determined by numerical optimization using the Nelder–Mead simplex method by Nelder and Mead [27]. Moreover, a stress test was also conducted to evaluate the performance of the secondary clarifiers under high solids loadings and verifying these results resulted in a short period of washout from the final clarifier for at least 30 days. This period was generally used to enhance the MMCS calibration in terms of the final clarifier settling parameters in order to better reflect the reality and to make an accurate simulation under various operating modes. Once calibrated and validated, the model is widely used in this and the previous study, as well as in data collection campaigns in different seasons of the year conducted by Banaszek [28] as well as by Drewnowski and Zmarzly [15] at the “Klimzowiec” WWTP, showing a high correlation (mostly below 10% deviations) between the measurement data and model simulations.

2.1. The Description of the Bioreactor Arrangement and Operation of “Klimzowiec” WWTP

The “Klimzowiec” is a mechanical–biological WWTP with enhanced nutrient removal processes, based on the activated sludge “Bardenpho” system, operated by Chorzowsko-Świętochłowice Water and Wastewater Management Utility Ltd. The “Klimzowiec” WWTP includes a pre-denitrification and phosphorus removal zone, three denitrification bioreactors and five nitrification bioreactors. Each nitrification bioreactor consists of three independent aerobic zones [28]. The average current flow rate at the WWTP is 25,900 m3/d, which is approximately 200,000 P.E. In addition, the plant consists of six secondary settling tanks, but only four of them are used at the same time. The investigations were carried out to present the model calibration process according to experimental study (lab and full-scale) and online measurements for achieving better integration of MMCS with the prevailing conditions in the local parameters of the individual biological part of the bioreactor for the aeration system at “Klimzowiec” WWTP. The technological layout of the existing “Klimzowiec” as a plant wide-model was created in the WEST software and implemented in PreviSys. More information about the process configuration, operational conditions and control system are available from Banaszek [28] as well as Drewnowski and Zmarzly [15].

2.2. Preliminary Data Collection and Analysis

The sample characteristics of the wastewater composition at the “Klimzowiec” WWTP are presented in Table 1. Research activities were started with a detailed analysis of the influent and effluent historical lab and online operational data available for a 3-year period (2014–2016) at the studied plant in order to investigate the performance, as well as to create appropriate input parameter values for the mathematical model simulation. The GPM data reconciliation procedure [26] has been selected to detect, isolate, identify faults and, finally, reconcile the dataset and maintain the quality of the effluent (TN < 10 mg∙dm−3, N-NH4+ < 4 mg∙dm−3, TSS < 30 mg∙dm−3, TP < 1 mg∙dm−3 and COD < 50 mg∙dm−3), whatever the variations of the incoming wastewater, in terms of the flow rate and composition (Table 1). This approach was used in the control of various concentrations (such as nitrate, oxygen, ammonium, etc.) at specific locations inside the bioreactor. The global aim to maintain the effluent quality within set limits was performed during the 2 sampling campaigns under summer and winter during full-scale operational conditions at the “Klimzowiec” WWTP. Temperature, pH and DO levels, as well as the concentrations of dissolved COD, NH4-N, NO3-N, NO2-N, TN and PO4-P, were measured. The MLSS (Mixed Liquor Suspended Solids) concentration and settling characteristics of the activated sludge were determined. The total COD, BOD5 and TSS concentrations in samples of raw inflow and pre-clarified wastewater were also taken.

2.3. Analytical Methods and On-Site Pollutant Versus Biomass Profile Concentration

The total or soluble COD, PO4-P, NO3-N and NH4-N were analyzed by the Hach Lange UV–VIS DR 5000 “test-in-tube” spectrophotometer (Hach Lange GmbH). The TN concentrations were measured using a TOC/TN analyzer (SHIMADZU Corporation, Japan). The analytical procedures, which were adopted by Hach Lange GmbH (Loveland, CO, USA), followed the Standard Methods [29]. Total suspended solids (TSS) and volatile suspended solids (VSS) analyses were performed in accordance with the Polish Standards (PN-72/C-04559). The historical and current operational data were acquired by investigations and on-site measurements that tracked the treatment process through the determination of the concentration profiles of different pollutants at the bioreactor. Regarding this work, which was integrated with lab-scale batch tests (NUR, PRR and PURanox/PURaero, AUR) as well as a full-scale campaign with tracer tests, a database for modeling the study was achieved (Table 2).
Experimental online data (pH, T, Redox) to regulate the computer distinct and/or activated sludge processes operational strategies were collected from the control box and sensors/probes. The Dissolve Oxygen (DO) concentration was verified during the batch tests with the DO probe (WTW Cellox 325). The consumption of biodegradable substrates during the aerobic phase was investigated by automatic short-term (3–5 min) oxygen uptake rate (OUR) measurements in separated small cylindrical reactors equipped with special DO probes (WTW Stirrox 625). The DO concentrations were measured during the whole respiration stage until they reached an endogenous respiration rate. The OUR was calculated from the following equation:
OUR = DO 1 DO 2 t 2 t 1
where DO1,2 are the initial and final concentrations of the dissolved oxygen, respectively; t2 − t1 is the time interval between the first and last DO measurement.
Based on the measurements of the total oxygen uptake rate, that is ∫OUR(t)dt) and degraded COD (CODdegr.), the YH coefficient was determined according to Equation (2):
Y H = COD degr . t 0 te OUR Hnet · Vdt COD degr .
where YH is the yield coefficient needed to estimate a heterotrophic biomass in an AS system; V—volume.

2.4. Organization of Mathematical Modelling and Computer Simulation Studies

The Wastewater Treatment Plant Engine for Simulation and Training (WEST) provides the modeler with a user-friendly platform to use existing models or to implement and test new extended models [30]. Generally, WEST is mainly applied to the MMCS of WWTPs and could be described as a structured collection of Differential Algebraic Equations (DAE’s) for any kind of AS process [30,31,32]. The WEST modelling platform has an extensive model library which includes, for example, different models for activated sludge units (ASM1, ASM2, ASM2d, etc.), models for fermentation (ADM1) and models for settling tanks (Takacs, Plosz, Burger, etc.). By combining these models, different WWTP configurations could be built, so that it is possible to perform a sensitivity analysis, parameter estimation experiments, an uncertainty analysis and a scenario analysis. The WEST software ver. 2014 SP3, based on ASM2d (Activated Sludge Model No. 2d) according to Henze et al. [33] with a ModTemp extension was used to create the “Klimzowiec” WWTP model fed with the lab and full-scale online data from this study, such as
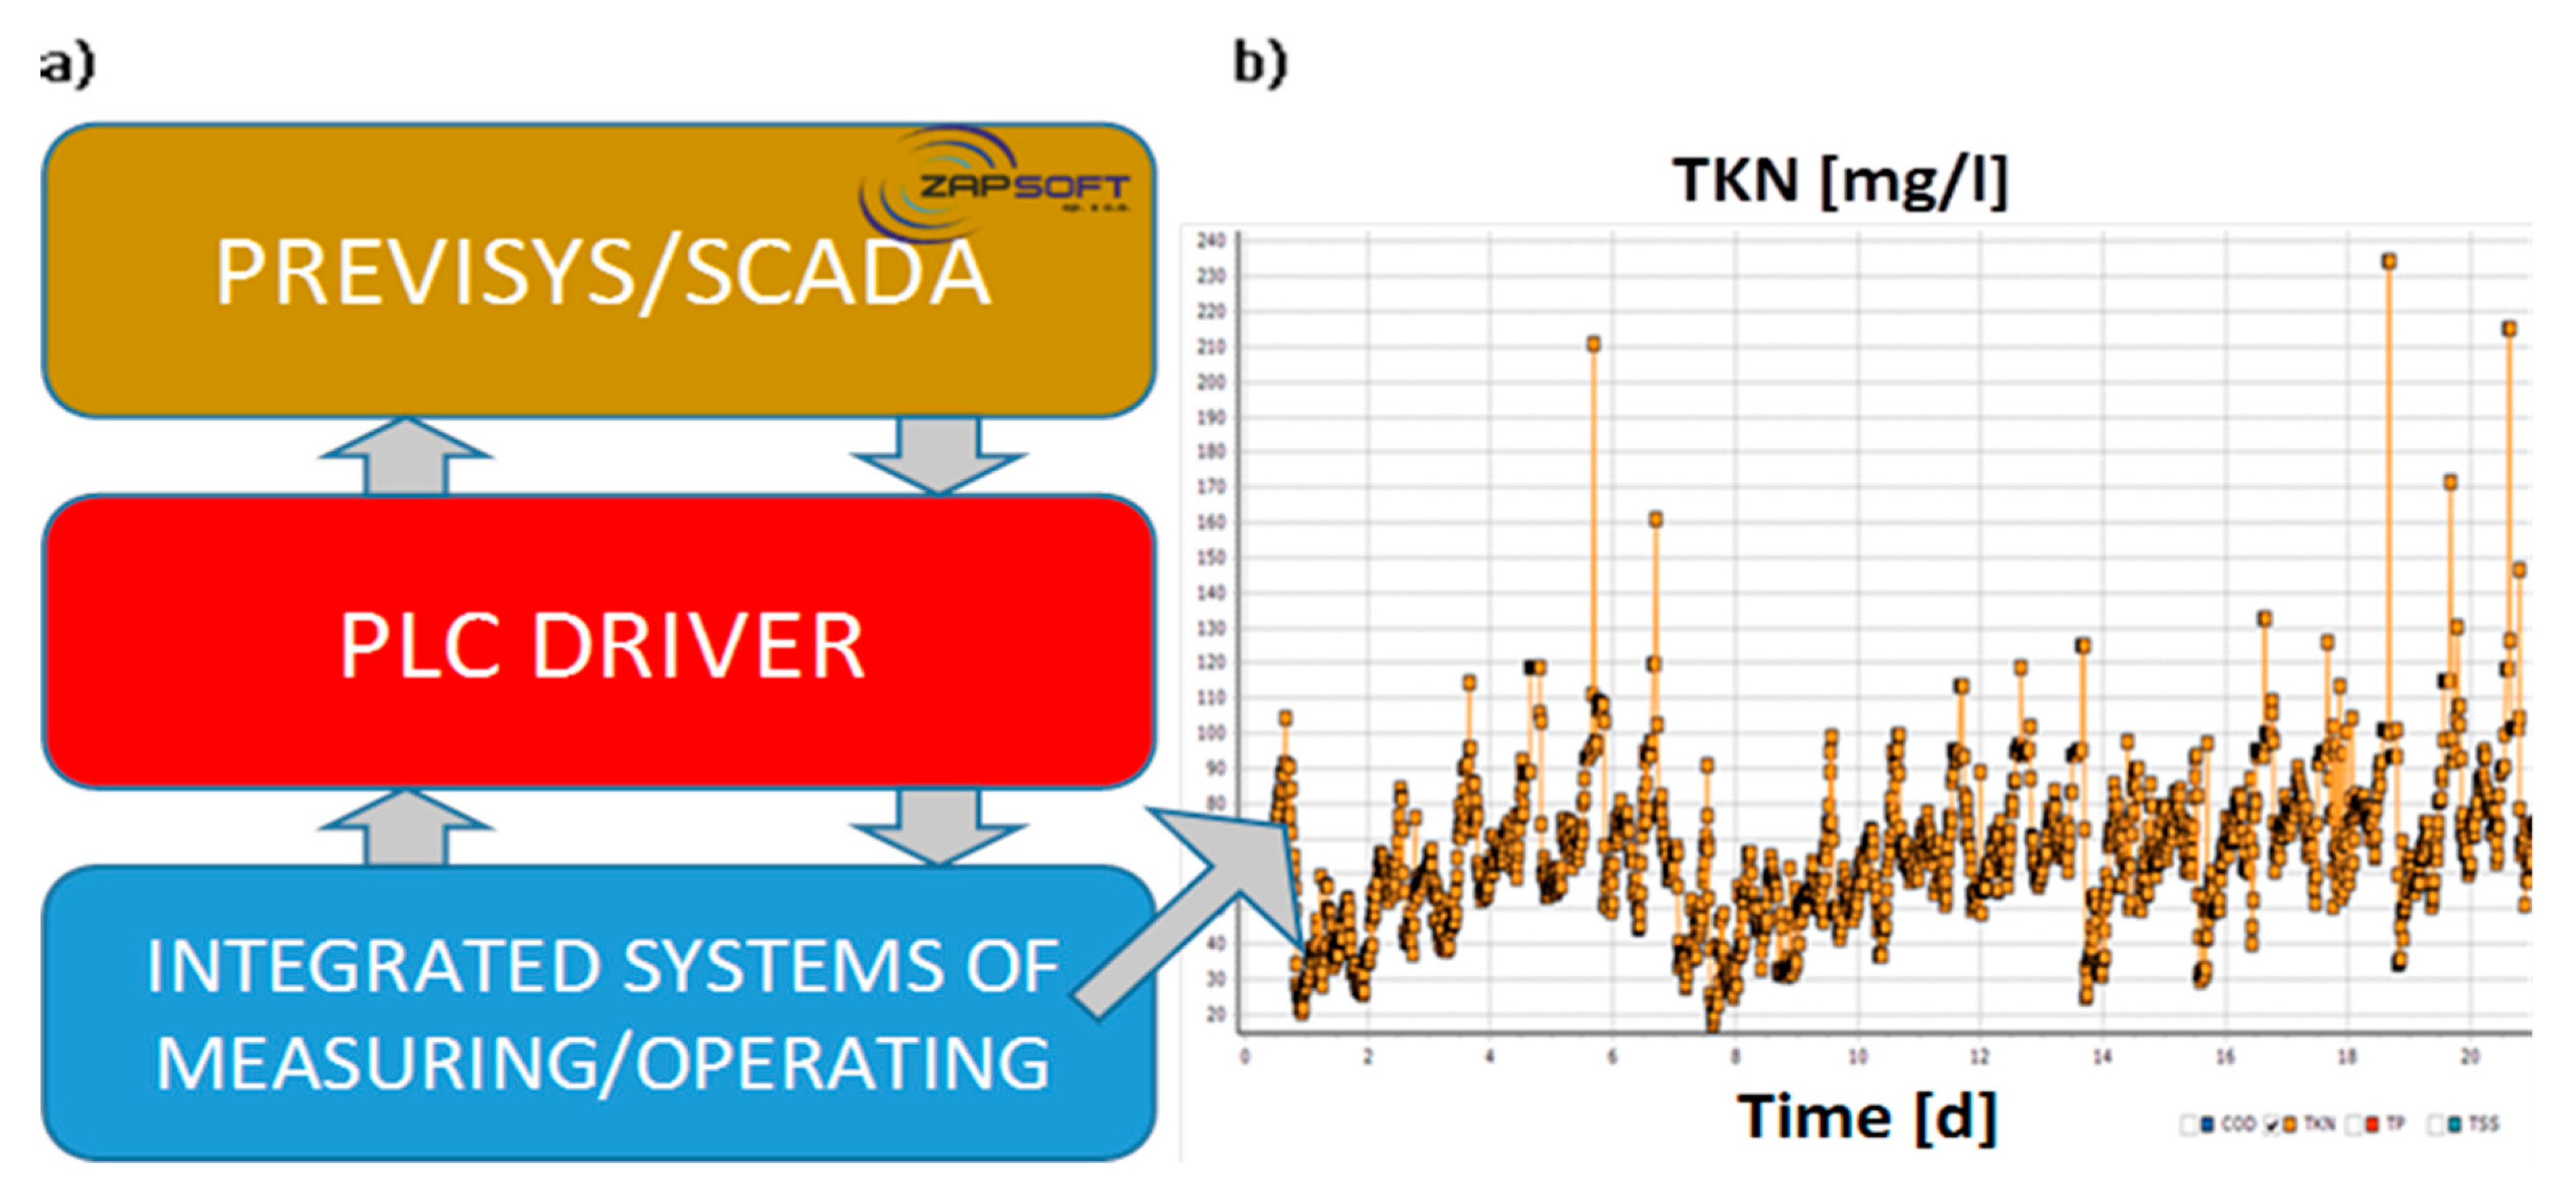
the inflow of wastewater (COD, TSS, TP and TKN—sample results were presented in Figure 1b),
temperature, pH, Redox in each of the denitrification, phosphorus removal, pre-denitrification processes
part of the bioreactors as well as DO concentration in three nitrification zones
intensification of external and internal recirculation.
Since nearly 3 decades, the activated sludge models (ASMs) created by the IWA Task Group (e.g., [34,35,36,37] have been commonly used to understand the microorganism mechanisms in the activated sludge processes in order to design, upgrade or optimize various WWTPs. Modelling techniques could be carried on in different ways depending on the circumstances (e.g., design, upgrade, optimization or operating and control of WWTP and how accurate a model needs to be created) and include different elements such as wastewater characterization, identification of part/whole real object, statistical methods, mathematical modeling and computer simulation, as well as a sensitivity analysis [38]. According to the methodology of GMP—Unified Protocol [26]—the model should be as complex as it needs to be and reflect most of the important physical and biochemical processes in order to make simulations and dynamically react in a similar way to the real activated sludge plant. The activated sludge model no. 2d (ASM2d), which was implemented in this study, is an essential model that simulates the dynamics of biological mechanisms such as carbon, nitrogen and phosphorus removal by Henze et al. [33] in order to reflect similar conditions to “Klimzowiec” WWTP. The chosen ASM2d for the plant layout is aimed at enhancing the biological phosphorus removal (EBPR) systems and also might reflect the denitrification mechanisms of phosphorus accumulating organisms (PAOs) under anoxic conditions and phosphorus utilization by PAOs under aerobic conditions. Moreover, the double-exponential settling velocity model proposed by IWA Task Group on Good Modelling Practice [26] was selected to describe the behavior of the clarifier. However, each of these processes is important in order to understand and model the dynamics of a complex AS system, but for accurate calibration of ASM2d, lab and tracer tests were carried out. The lithium chloride (LiCl) as a neutral agent was added to the denitrification tanks in order to create a hydraulic model of full-scale bioreactors at the “Klimzowiec” WWTP. LiCl has just been spread behind the recirculation zone and samples were taken directly from the effluent of the denitrification tank. The results showed a difference in the wastewater flow rate between each of the three denitrification zones regarding bioreactors no 14/1, 14/2, 14/3. In Table 3, the sample results of the tracer test were presented and, according to the GMP procedure, were implemented into the MMCS process of the “Klimzowiec” WWTP.
The calibration/validation process of the model is very important and the results were further described and discussed in Section 3.2. For a “Klimzowiec” WWTP a period of intensive monitoring and sampling probes, which was more than 6 months in duration. Data sets from the full-scale plant (including tracer test and the laboratory/online measurements) were used from this study (as was presented in Table 2 and 3) and compared with historical data and a previous study [2,15]. All these investigations were further used for steady-state and then dynamic-state simulations in the WEST software to accurately calibrate the studied WWTP model. However, the WEST standard model library does not reflect all individual parts of the WWTP, so new elements for the regulation of the suspended solids (SS) concentration in the effluent were introduced. Moreover, the PreviSys was based on the amount of waste activated sludge (WAS) discharged control from the system. For that reason, the proposed ASCS in this study was additionally integrated with online sensors data (such as NO3-N, NH4-N, PO4-P concentration) installed in the bioreactors and/or plant effluent for continuously tuning the complex model in order to conduct accurate simulations of the operation strategies at the full-scale “Klimzowiec” WWTP.

2.5. Implementation Online Data to Calibrated/Validated Model of Studied WWTP

The simulation process of the WWTP model corresponded to the task scheduler of the operating system for the cyclic run, creating a complex script that managed the execution of the individual steps (Figure 1a) and its integration with the measuring/operating system that presents online key parameters relating to the quality of the wastewater inflow (Figure 1b).
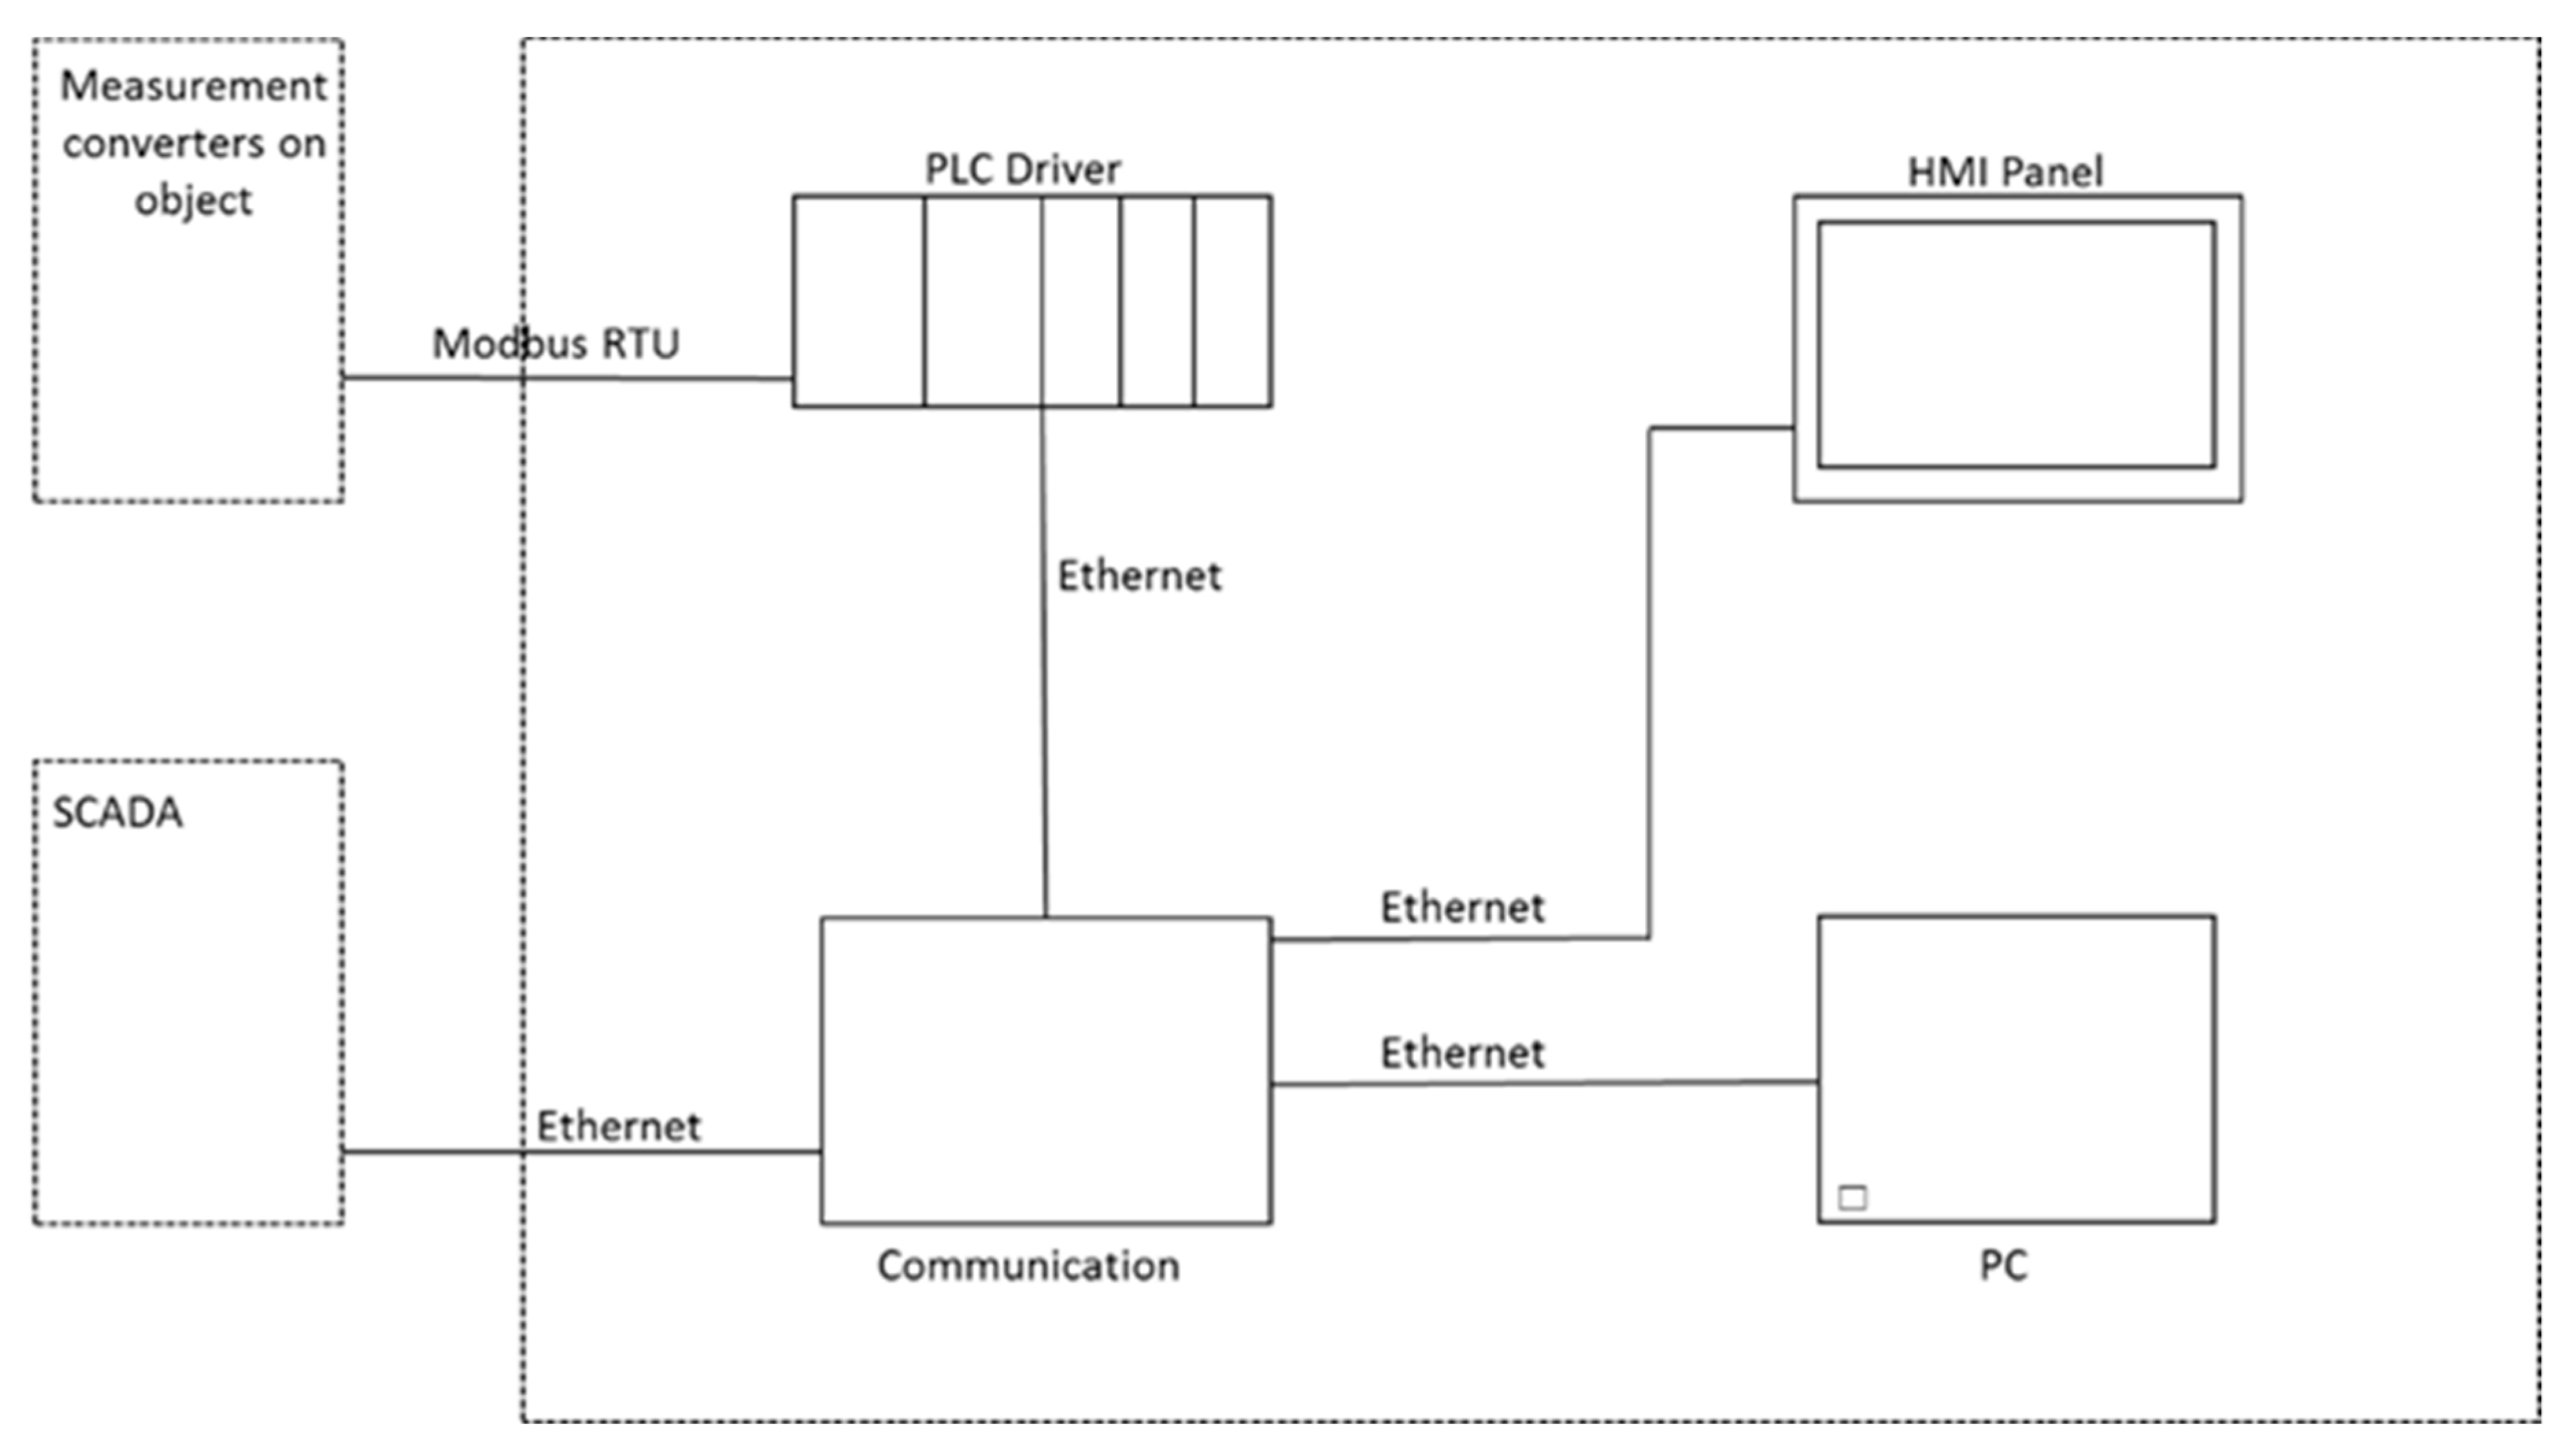
The master script runs a program for downloading the raw data from the SCADA system. The program was created in a C++ compiler in order to run in the console mode. The data configuration could be downloaded from the file “Config.ins”. All the necessary modeling parameters were collected in SCADA. The data from the SCADA files might be exported and then calculated by the model average value of the operating parameters in order to predict the data for the process control of the WWTP (e.g., in the case of the inflow model calculating the concentration of the pollutants in wastewater based on average daily loads). The data processing in each of the measurements were stored in separate CSV output files. In order to create data into the format supported by the WEST software, “Python Scripts” were used. The data in the output file were saved from the latest measurements, e.g., adding new data could be done by removing the oldest measurements, which were replaced with the latest measurements at the end line in the executive file. The script data model is responsible for the modification of the time period from which the data were collected. This script could read the configuration file from SCADA by retrieving the data during the last period for which the data were downloaded and then modifying the configuration file by a fixed amount of time (15 min by default). These data were used by the main script in order to verify whether the data supplied to the model corresponded to the real WWTP conditions. In the urgent situation (e.g., blackout, computer restart) when missing data from the period occurred, the script goes onto be repeated when the PreviSys communication system was turned off until the missing data was completed. The WWTP simulation model data was run in the text mode in order to save into the file “Dynamic_Simulation_Results.txt” selected earlier from the resulting data from the graphical display as was presented in an example in Figure 1b. After completion of the modeling script “Output.py”, the last results of the simulation were moved to the file “Results.csv”. In this file, the resulting data along with the execution time of the data transfer were saved. The last step in the process was sending the calculated measurements of NH4 to the SCADA system, which was done by using the “Python Libraries” according to the Modbus-tk and PLC driver. The data were read by PLC and saved in the internal memory. Then, the SCADA system read data from the PLC and the libraries of the collected data were used by the Modbus TCP server, which is integrated with the measuring/operating system at the “Klimzowiec” WWTP.

2.6. Integration of PreviSys Advanced Supervisory Control System with SCADA and Plant Wide-Modelling

In this study, an advanced supervisory control system (ASCS)—PreviSys as well as the WEST software for communicating with SCADA—commonly used in WWTPs were integrated. The PreviSys with advanced algorithms in the monitoring/controlling process technology for industrial automation was based on Model Predictive Control (MPC), which is widely used and accepted in general and in the process industries in particular. The MPC is described according to the following advanced algorithmic principle: at each time step t, a residual r(t) between the process output y(t) and the output prediction y*(t) based on the past inputs is calculated. Trajectories (e.g., predicted values over the prediction horizon) noted y*(t) and r*(t) are calculated respectively for y(t) and r(t). The corrected future output trajectory is compared to the desired (or reference) trajectory yref(t). According to the MPC methodology, only the first element of the optimal solution is implemented in the ASCS which included the ASM2d equations in order to carry out the modeling process by PreviSys. However, PreviSys is designed as open source, so both a general purpose software (MATLAB) and other modeling software (WEST, GPS-x, SIMBA, etc.) could be also implemented in a Personal Computer (PC) to simulate the operation strategies and/or advanced process control of a WWTP.
Fully equipped PreviSys might be divided into three parts: PreviBox, PreviSoft and PreviSCADA. The PreviSCADA software installed on an industrial PC called PreviBox could be implemented with several modules: communication, database, alerting, reporting, visualization, web server, etc. PreviBox is a device that could work together with the automation systems of WWTP or could even replace it. PLC modules consisted of PreviBox (with a touch panel, industrial PC, router and switch) suitable for communication with other devices at the WWTP. The results of the MMCS could be used by the SCADA system for proper control of the individual devices (blowers, pumps, internal recalculation, DO concentration, etc.). In order to control the aeration blower by using the model for simulating the NH4 concentration at the outlet of the bioreactor, it was assumed that every 15 minutes, online data are collected and then added to the set of input data and processed in mathematical model in order to generate the results of NO3, NH4 virtualization, etc. The actual result of the computer simulation could be sent back to the SCADA system which is responsible for the adequate control and operational strategy of the aeration system, which was tested during this study in the “Klimzowiec” WWTP (Figure 2).

3. Results

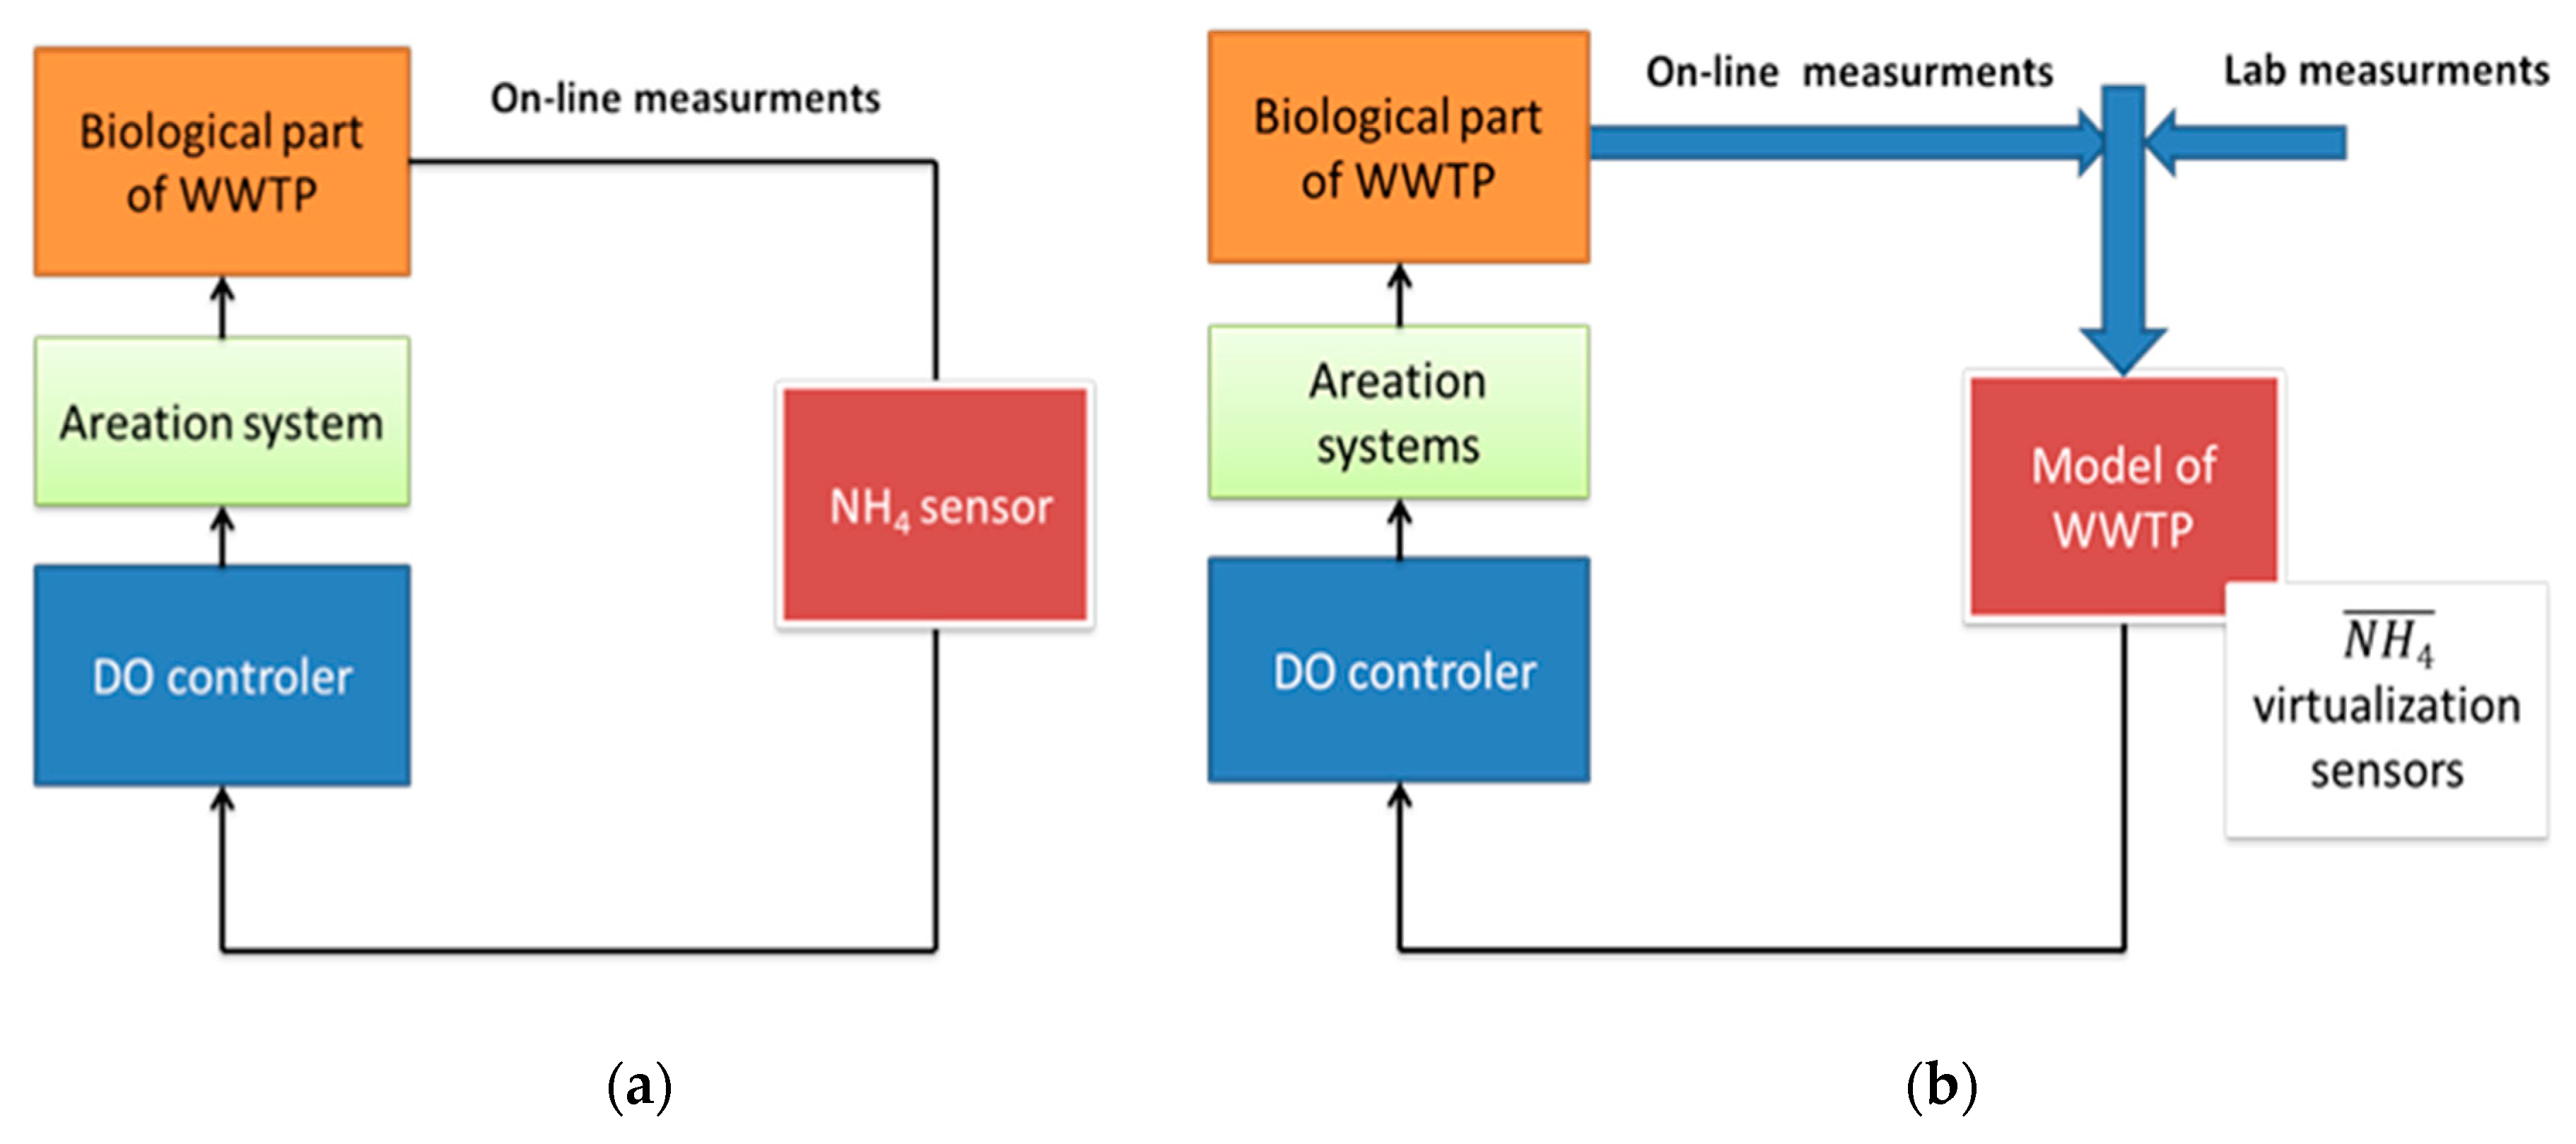
In this study, the author considered to not show a detailed procedure of the MMCS because a similar method was described in a previous research paper by Drewnowski et al. [2], however, the most important part of the calibration/validation results as well as the effects of the model implementation and predictions was presented. The main purpose of this paper was to present a successful example of the MMCS application in the optimization and operation strategies of aeration systems at the “Klimzowiec” WWTP by using the Previsys integrated with the NH4 sensor data-virtualization. Hence, different aspects of considerable influence on the real controller’s performance, batch and tracer tests results (as well as parameters) account for model predictions under dynamic conditions at WWTP (Table 2 and Table 3). Moreover, the PreviSys project goes a step further as an extension of the traditional WWTP modelling architectures commonly used in AS system simulation platforms, considering next to the classical mass transformations (hydraulic transport, physicochemical phenomena, and biological reactions) of all the instrumentation, actuation, automation and control components [2,5,6,7,8,9,10,15,39]. In comparison to the classic control aeration system at the WWTP, the proposed innovative advanced supervisory control system using virtual NH4 data-driven from the WEST model predictions supported by online and lab measurements was presented in Figure 3a,b. Regarding instrumentation and actuation, the real (but not ideal) behavior of dynamic processes changes were modeled (reflecting, e.g., COD, TP, N-NO3, N-NH4 predictions) in this study, including the actuators’ power consumption at the “Klimzowiec” WWTP (Table 4, Table 5 and Table 6, Figure 4 and Figure 5).

3.1. Model of Aeration System in PreviSys

The classic control of the aeration system at the WWTP is based on a device that uses a NH4 sensor, where the measurements are entered on the controller input depended on the concentration of DO in the AS systems. As part of the analysis of the proposed solutions’ applicability, a calibrated model of the “Klimzowiec” WWTP was used to simulate the operation of a NH4 probe concentration. For this purpose, calculations were generated periodically (every 15 min) for the simulation of WWTPs according to the data from last month. The control system of wastewater aeration based on measuring the concentration of NH4 in the aerobic zone of the bioreactor is very important to maintain an effective biochemical process in the WWTP in order to obtain the limits of N and P in the effluent. With the “virtual” measurement of NH4, the value is calculated based on the actual data reported to the model and, for that reason, the risk of deterioration in the quality of treated wastewater caused by a faulty probe and/or an erroneous measurement is minimized.
During the simulation, the current trends in the concentration of N, P and NH4 in a bioreactor and in the effluent from WWTP were observed. Data from the SCADA system feeds the simulation software in the form of mathematical model input files. The program deletes the oldest dataset in order of the amount of data used in the simulation system which was at the same level all the time. Calculations in the computer system PreviSys generate an output file of the implemented model. Information on the estimated concentrations of NH4 in the location corresponding to the position of the probe on a real object, i.e., the aeration reactor (object No. 17 at the “Klimzowiec” WWTP) was transmitted to the SCADA control system responsible for the selected aeration block in the biological bioreactor. The computer simulations were run on the calibrated plant-layout model included scenarios that might influence the WWTP process operation and energy balance in the amount of DO concentration in the activated sludge reactor.

3.2. “Klimzowiec” Plant Wide-Modeling

The values of ASM2d parameters adjusted during dynamic calibration of the full-scale “Klimzowiec” WWTP were compared to default ASM2d values in Table 4. The process rates (PRR, anoxic/aerobic PUR, NUR, and AUR) in batch tests were compared with a previous study by Drewnowski et al. [2] and the behavior of NH4-N, NO3-N concentrations in the full-scale “Bardenpho” bioreactor (Figure 4 and Figure 5) were matched (with some minor deviations) to the trends of the model predictions. The calibration approach was used according to a previous study conducted by Boontian [40] in order to avoid the extensive investigations and the difficulty of identifiability parameters in ASMs. For that reason, a stepwise method was proposed in each of the iterations conducted by the MMCS. The iteration procedure started with the initial default parameter value according to Henze et al. [33] and was carried out under the steady-state conditions. The number of iterations for each experimental dataset was based on the parameters’ quantity in the sensitivity analysis (SA). For example, 18 iteration steps (the same number as the parameters in the sensitivity ranking) for each of the data sets were used to predict the output of N-NH4, N- NO3, TP in the effluent and of PO4 in the anaerobic phase. The application of the parameter significance ranking was used to perform the calibration in order to best-fit the model’s parameter values to the experimental data observed. The most important parameters were iterated, mostly those that had a strong influence on the processes of calibration. From this study, only 9 parameters excluded in the parameter significance ranking with a value of 0.5 and below had no or only a minor influence. The parameters with the highest sensitivity were obtained as KNH4,AUT and YPO4. Boontian [40] also found that those parameters had the highest sensitivity, although they were ranked with lower values in other studies [38,41]. Considering the next most significant sensitivity ranking in this study, the half-saturation coefficient KNH4,AUT for NH4-N, it was of a similar order as in the one study conducted by Brun et al. [42], but it was again lower than that presented in the paper (e.g., References [38,41]). Generally, the current investigations showed that μAUT had a higher sensitivity ranking than previous studies, e.g., [38,42]. However, this ranking was also lower than that reported by Machado et al. [41]. However, it should be noticed that one group of investigators such as Yagci et al. [43] used manually repeating simulations as a sensitivity ranking approach to reflect the individual changes in the magnitude of related parameters in the model predictions. This study based on the steady-state cyclic simulations of SPO4, XPHA, SA and MLSS profiles contained the most sensitive parameters such as YPO4, qPHA, qPP, KPHA and lysis rates.
Anaerobic, anoxic and aerobic processes for both N and P removal on the N-NH4/NO3 and P-PO4 profiles were examined. The effluent NH4 data were one of the starting points for the experimental dataset that was used to calibrate the ASM2d parameters in order to observe the autotrophs activity. After successful calibration, the values for each parameter were tested under dynamic conditions at the “Klimzowiec” WWTP. As a result of fitting the simulated data to the effluent NH4 concentration, it was found that there were three important parameters. The nitrification process was calibrated with these parameters, including the maximum growth of autotrophs (μAUT) and the half-saturation coefficient for NH4-N (KNH4,AUT). Both parameters’ estimated values were always higher compared to the ASM2d defaults. High values of the KNH4,AUT for full-scale plants could be explained by the higher diffusion limitation as well as the low turbulence and large floc sizes as it was also noted in the literature [37]. In addition to KPO4,AUT, which represents the PO4-P saturation coefficient for autotrophic organisms, it was found that this had to be strongly reduced (by 10 times) in this study from 0.01 to 0.001 g P/m3. This approach was also confirmed by Meijer et al. [44] in order to provide simulations with high nitrification process rates, which could be caused by very low PO4-P concentrations, temporarily occurring in the aerobic zone of the bioreactor at full-scale WWTP.
In this study, default values were used according to Henze et al. [33] for stoichiometric parameters except for the YH and YPO4 coefficients, which were experimentally determined by OUR tests according to the respirometric methodology for YH [44] and anaerobic P-release tests for YPO4 (Table 4). The value of YH was only changed minorly from 0.63 g COD/g COD (default) to 0.65 g COD/g COD, but in the case of YPO4, a more significant adjustment was needed. The YPO4 coefficient was adjusted to 0.32 g P/g COD, which was 25% lower than the ASM2d default value (0.4 g P/g COD), however, it was still within the range reviewed in the literature, e.g., Makinia et al. [45,46] for MMCS (0.27 to 0.43 g P/g COD). Lower YPO4 coefficient values were also presented by Swinarski et al. [1] for batch tests conducted at the “Wschod” full-scale WWTP with mixed liquor of the settled wastewater and acetate (0.27 to 0.29 g P/g COD). Regarding that, a value of 0.36 g P/g COD was proposed by Brdjanovic et al. [47] for MMCS. By comparing both studies, lower values of YPO4 were observed probably because of the glycogen-accumulating organism’s (GAOs) presence in the AS system. In the anaerobic P release tests at the Wschod WWTP with mixed liquor [1,45,46], there was no significant acetate utilization after the polyphosphate depletion in the PAO biomass. The sensitive analysis of GAO showed a very low value of <0.01, which, according to the ranking and particulate forms, did not have a significant role at the plant, so there was no need to model their metabolism in this study. The calibration of denitrification was carried out based on the results conducted by Drewnowski and Makinia [48] of two-stage batch tests: the conventional NUR and PRR and anoxic PUR. The NUR tests were used to fit the model predictions to the measured NURs data by adjusting two parameters: the maximum heterotrophs growth rate (μH) and hydrolysis rate (khyd) constant (Table 4). In the case of the PRR/PURanox, no additional adjustments were needed to calibrate the NUR under anoxic conditions.
Once the calibration process finished, the model could offer accurate simulations but, in order to check further the model predictions, the validation with data from another season of the year (e.g., summer vs. winter) is necessary. The average deviations between the measured data and model predictions, e.g., ammonia, COD and TP concentrations were always lower than 10%, so the calibrated parameters at the “Klimzowiec” WWTP reflect ongoing biochemical process behaviors in the bioreactor without significant deviations. Several test and operational strategies confirmed that the model of the “Klimzowiec” WWTP was ready to use in practice as being able to simulate the variations of the effluent concentrations. After successful calibration, the model was validated with an extension of ASM2d called “ModTemp” by comparing the actual results from the unused dataset with the model predictions obtained in different temperatures of operations by the calibrated model. The parameter significance ranking proved that the temperature correction parameters and coefficients for the PAOs were among the most influential on the model outputs. Table 5 shows the comparison of the actual period of the steady-state sample results obtained by MMCS and online measurements by NH4 sensors at the “Klimzowiec” WWTP. The implemented model accurately characterized the performance of the studied plant and the biomass behavior in the AS system.

3.3. PreviSys Platform at the “Klimzowiec" WWTP

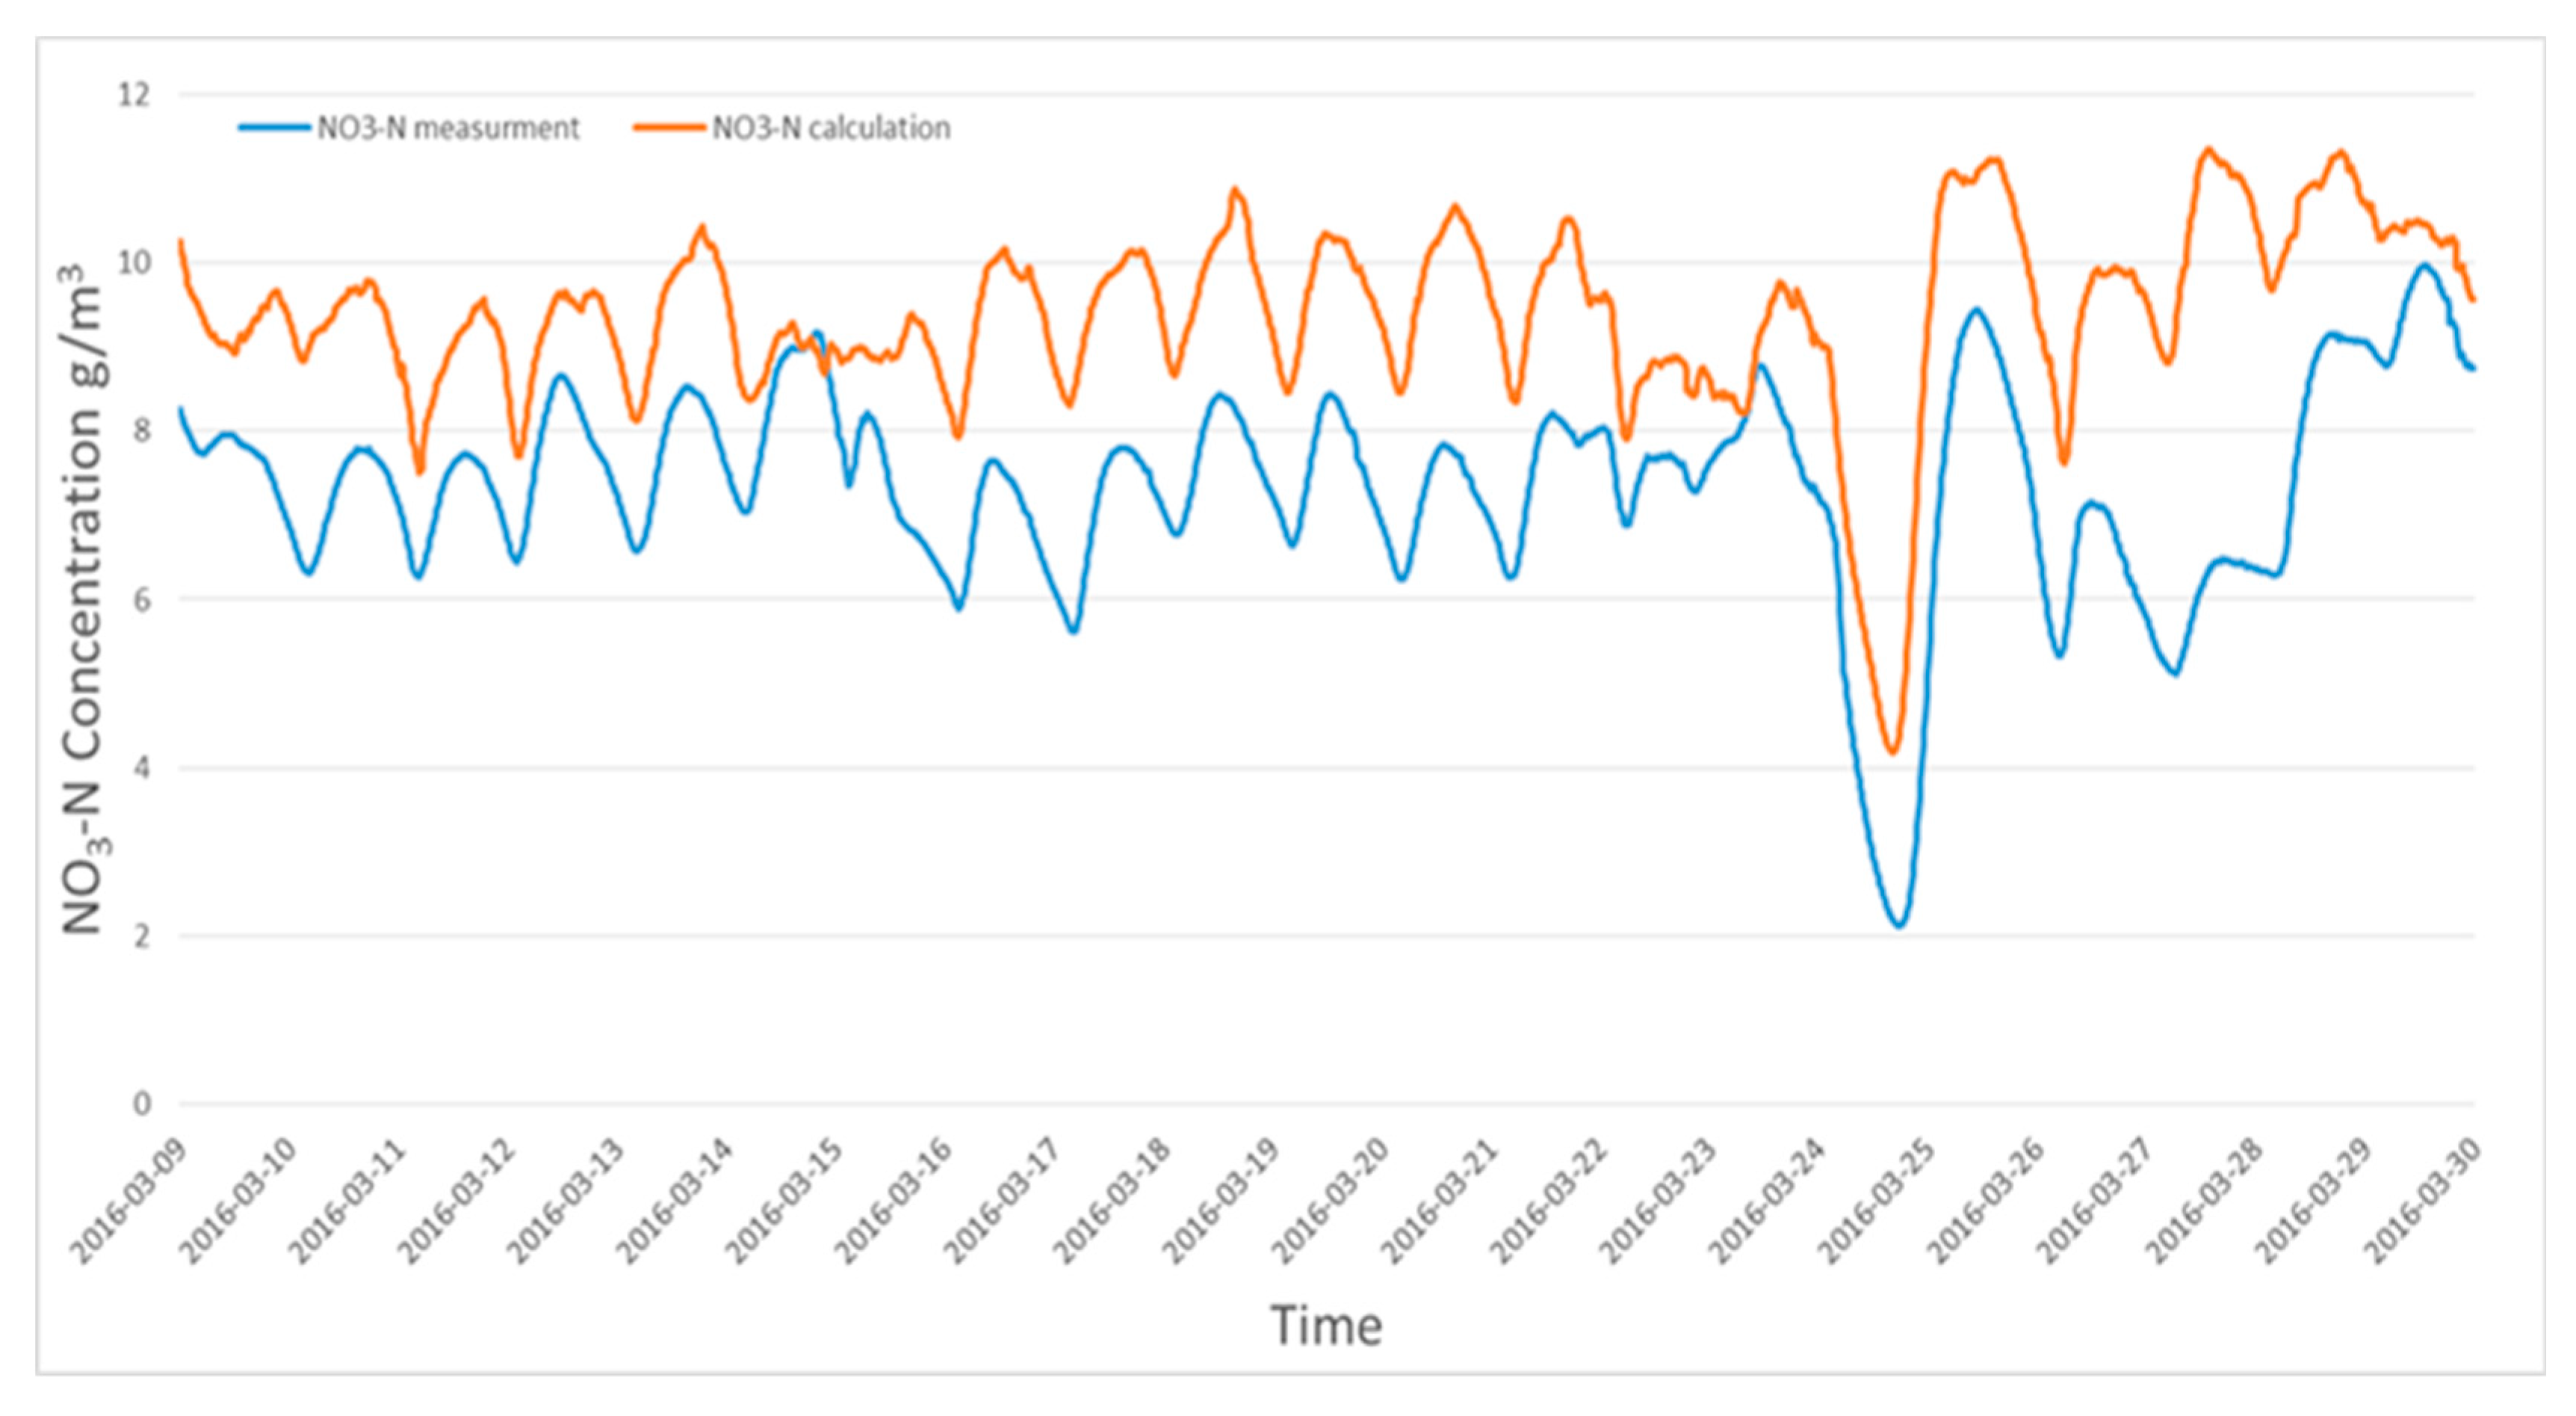
One of the reasons that ASCS has still been limited in practical use could be the lack of a proper approach and procedures to simulate biochemical processes. The optimization based on the physiology of ASM will be the next level of system operations, which are required to use advanced tools (such as, e.g., MATLAB®/Simulink®, C++ Generator) as well as additional support model calculations and/or sensitive analysis (SA) in order to minimize existing factors at the studied plant. The SA calculation gives a parameter significance ranking that could reduce the number of iterations required and the calibration process could be determined interactively [41,42,49,50]. In this study, ASM2d was calibrated using an identifiability method to describe the N and P removal in the “Haaren” and “Haarlem” WWTPs [37,46] as well as the “Debogorze” WWTP [2]. The data in Figure 4 were collected from a period of 21 days: 9 March 2016 to 30 March 2016. The results of the NO3-N data which have been derived from the model predictions at the “Klimzowiec” WWTP were marked in orange, while the online NO3-N measurements data which were derived from the real sensor were marked in blue. Both results showed similar trends in the plant operation change. The biggest difference between the measurement data and model predictions occurring in the sixteenth day of the simulation, which was probably caused by the inflow of unusual pollutants to the WWTP. It caused the performance blowers to be insufficient to remove the entire load of NH4-N, which resulted in the setting the blowers to their maximum performance for the next 3 days (during the weekend). Further investigation on this specific aspect should be performed in the next set of studies in order to find potential threats and consequences to the long-term virtual sensors’ (e.g., NO3-N, NH4-N) application as well as MMCS for obtaining more stable and predictive conditions at the biological part of the WWTP.
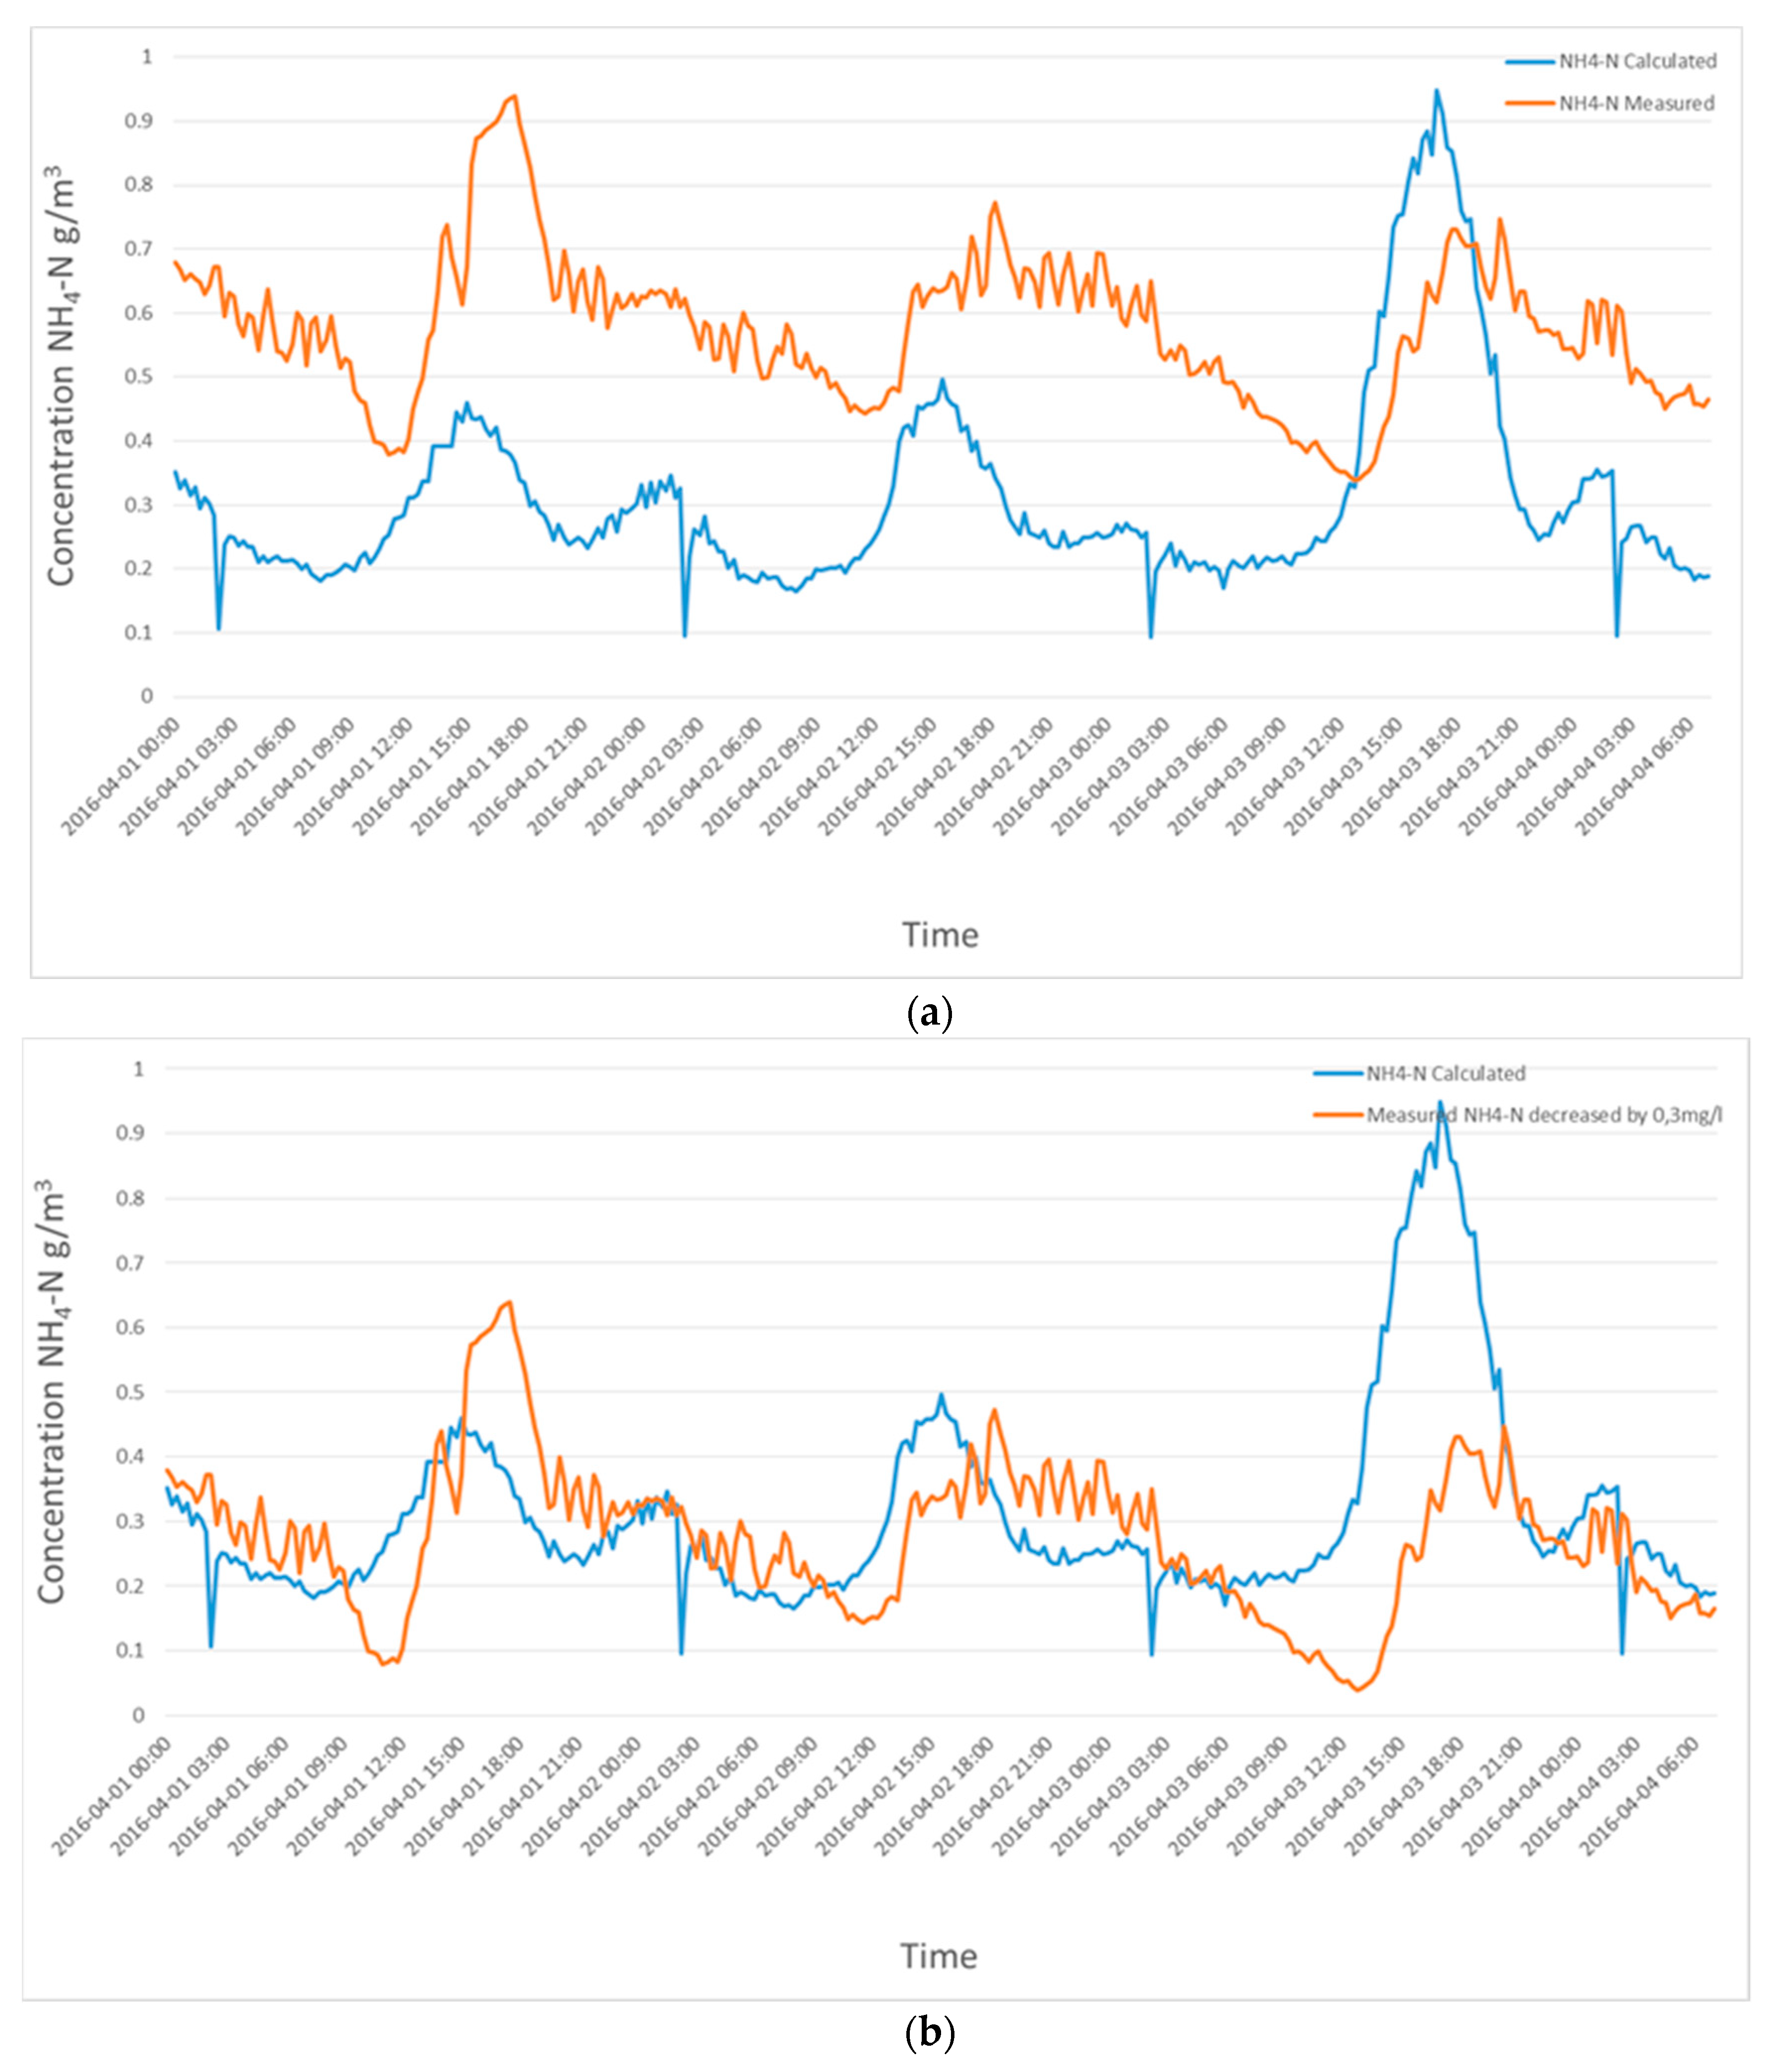
Different types of nutrients measuring the sensors are currently in use at WWTPs which have a TN removal requirement. Modern online nutrient sensors or analyzers could be automatically calibrated at the plants. The general locations for the nutrient sensors/analyzers are the AS bioreactor and/or effluent, but the NH4-N analyzers could be also used in other parts of the process, e.g., the primary clarifiers as well as influent at the WWTP. In this study, the results of the calibration model were presented as an example of comparing the modeling results of NH4-N at the outlet of the “Klimzowiec” WWTP with real measurements. The calculated NH4-N measured data were very small (usually less than 1 mg/L) and the range of the probe was large (up to 1000 mg/L), which, in case of long term use, could not be applied to the measurement control unit. The measurements in the biological part of the “Klimzowiec” WWTP were used to control the third block of aeration zones by the NH4 sensor. The comparison between the measured and calculated NH4-N values by the model was achieved and discrepancies were showed in Figure 5a. The data from the period of 1 April 2016 to 4 April 2016 showed the measured versus simulated (calculated by model) levels of NH4-N. The real measurements carried out by the sensor were higher than 0.3 mg/L compared to the value calculated by the model. This situation was probably due to the technical problem of the NH4 sensor calibration with a higher range of measurements used in this case.
Figure 5b showed the measured NH4-N results reducing values by 0.3 mg/L in the biological part of the aerobic zone in the “Klimzowiec” WWTP. The blue trend represents the data from the model while the orange trend is the data from the measurements reduced by 0.3 mg/L. In Figure 5b, it is noted that the modeling values and the online measurement results from the real object were very similar, except for certain shifts on the time axis which was most probably caused by sensor faults. This situation also shows that the installed NH4 sensor in the bioreactor to control the aeration system might have faults in the measurements due to different reasons (attached sludge flocs and/or air bubbles could block the measuring surface of the sensor, calibration may be needed again after a long time and/or the intensive use of the sensor, the imprecise installation of the sensor in the bioreactor and/or a broken sensor, etc.). In this study, the computer simulation WEST platform and proposed added control PreviSys using virtual NH4-N computer simulation results were found as useful tools in the control of aeration systems because this kind of prediction allowed for faster responses to make changes in the operation of the “Klimzowiec” WWTP system. The biochemical processes (denitrification-nitrification) are more stable and predictable due to the fact that the measurement by a real NH4 sensor many times generates picks and/or gives improper responses to the actual changes in the bioreactor (Figure 5a,b), which might directly hit the energy consumption as presented in Table 6. This was also confirmed in a previous study by Drewnowski and Zmarzly [15] at the “Klimzowiec” WWTP which detected that the irregularities in the unit work/operation by computer simulation is an innovative method allowing for us to simplify and accelerate the diagnosis of sensor measurement faults and to avoid the risk in overestimated aeration in the bioreactor.

3.4. PreviSys Platform at the “Klimzowiec” WWTP

Energy consumption is crucial in determining the WWTP operating costs and energy balance for aeration systems. Computer simulations enabled us to make biological treatment processes and estimate the WWTP energy output for different aeration system strategies. The results showed that the WEST–MMCS platform [29] can be used for the design and implementation of the ammonia, nitrates (Figure 4 and Figure 5) and MLSS (not shown) controllers at the full-scale BNR treatment of the “Klimzowiec” WWTP. Before implementation of the PreviSys in a real plant, an MMCS study of the control solution performance was done by the design model in terms of the water quality and energy costs for which air blowers, sensor models, and pumps, as well as cost functions, were defined and incorporated in the WEST. The scope of the study was to create a model for the most faithful simulation of a real object and then use the calculated measurement model to control the third block of biological aerobic zones of the nitrification process. The well-designed aeration systems ensure that the mixing of the wastewater and oxygen needs of the biological treatment process are met. The PreviSys could be used to control the operation of the wastewater treatment and allows, in contrast to the SCADA software, for using advanced control algorithms such as MPC (e.g., the updated aeration model provides powerful new features by the NH4 sensor virtualization and computer simulation in the operation strategies of aeration systems at WWTP). The implementation of the PreviSys at the “Klimzowiec” WWTP clearly showed that the potential benefits of the automatic control application for operational strategies in optimizing costs and wastewater treatment quality. The process of the MMCS was necessary in order to evaluate the performance of the “Klimzowiec” WWTP in terms of a more effective aeration system (QAIR) and internal recirculation (QIR), as was shown in Table 6. Changes in the operation strategy not only demonstrated energy consumption savings, but also showed that the biochemical process performance had no impact on pollution removal and effluent quality. Moreover, it could be seen from the data presented in this study that the performance of the biochemical process was more stable and predictable according to the model NH4 virtualization strategy when compared with the real NH4 sensor measurements reported in the literature [15]. The lower energy consumption and optimization step at the “Klimzowiec full-scale WWTP did not affect the AS conditions or the main biochemical processes, which were confirmed by high quality treated wastewater.
This study demonstrated that the implementation of an innovative PreviSys solution integrated with the continuous computer simulation in the control and operational strategies of aeration system might reduce more than 16% of the energy costs, only by a support system with NH4 sensor data virtualization by a model at the WWTP (Table 6). It was confirmed that by using sophisticated PreviSys technology in this case study, a better understanding, as well as a more accurate optimization and sustainability operation of biochemical processes at the WWTP, can be achieved. Other studies, e.g., References [11,51,52], also confirm that MMCS could considerably reduce the operational costs. According to this study, the calculations of yearly operating savings could be realized from $20,000 to $100,000 by using a dynamic model to evaluate the current and proposed operational strategies dependent on the operational system, installing sensors/probes and the size of the WWTP.
4. Discussion

In accordance with the worldwide tendency to decrease energy consumption and the number of pollutants discharged from industrial facilities, strict requirements have been introduced in Poland since the last few years. The green certificates support scheme has been worked out in Polish WWTPs by the adoption of the Energy and Effluent Quality Regulations since Poland become a member of the European Union (EU). It has been recognized from different studies [3,6,15,50,51,52] that a more extensive use of instrumentation, control and automation (ICA) integrated with MMCS in WWTPs could significantly improve both the energy consumption as well as the stability of the biochemical process and the quality of the effluent. At the same time, WWTPs were forced to achieve a simultaneous reduction in running costs and an improved infrastructure in Poland in accordance with the policy of EU under the Innovate Economy Founds to improve the infrastructure in Water Utilities. Moreover, in the last decade, a combination of factors could be seen that made progress in the implementation of ICA and MMCS technology to WWTPs possible: low prices of computers, improvements in monitoring and process control systems, advances in plant modeling, more advanced controllers and actuators, as well as better trained and qualified operators [6]. However, from many solutions that have been proposed for ICA in WWTPs improvement process [2,6,53], only a few of them have been implemented and verified in full-scale applications, e.g., References [15,54]. While accurate models and various systems were developed to optimize the BNR process of the AS system in the EU, most of them have not been applied yet by the managers and operators at WWTPs in Poland. Generally, however, in the maintenance of consistently good-in-quality or reliable instrumentation for biological wastewater treatment, the effluent quality remains uncertain. Therefore, until now, most of Water Utilities ignored novel solutions and had a fear in applying advanced techniques at WWTPs. Summarizing the founding of this study, it was shown that the ASCS as PreviSys could work towards the industrialization of automatic control strategies for WWTPs, which should surely be promoted for the adoption of advanced control solutions in Water Utilities and the other utilities connected with the Water Sector Industry in Poland and the EU as well as worldwide.

4.1. Advances in the Supervisory Control System Supported by Models for Cost-Effective WWTPs

Nowadays, the use of MMCS and computational hardware control allows us to study many different analysis and technological solutions in a very short time and with a low investigation budget, besides carrying out various scenarios and control strategies in reality. Modeling has become an integral part of the design and control of WWTPs in gaining more knowledge of the mechanisms and operational strategies playing an important role in the process of ICA [4]. Opposite to pure mathematical models based on activated sludge such as ASM [36], the ASCS supported by extended ASM and/or data-driven models as well as virtualization by computer simulations could describe the process dynamics effect from diverse sources at the same time [3,55]. Till now, such advanced technology was successfully been tested in different solutions. For example, in control pumping stations, the data mining integrated with an artificial immuno-neural network was verified [56,57] and the neural network-particle swarm optimization was used to maximize the methane production in an anaerobic digester [58]. Moreover, soft-sensors, e.g., BOD, were also developed using advanced data mining models to avoid aeration absence in bioreactors [59]. The presented ASCS models and data-driven techniques by virtualization in this study might be useful in predicting the effluent water quality, illustrating the trends of the time-series variables and suggesting the optimal operation conditions at WWTPs. The advanced technology integrated with model prediction process optimization and control at full-scale plants is a still novel and imperfect solution. So, without further development, risks or faults could also be seen in the wastewater treatment process from improper sensor measurements and/or records in the database [60]. The ASMs themselves had been used for plant-wide modeling mostly in steady-state conditions, free of the implementation of a real WWTP. The challenge is a lack of general description to integrate the model dynamics procedure with the application process. As was examined at two full-scale WWTPs in 2002, the description of the biochemical processes might be more robust and accurate by using an integral system rather than individual techniques [61].
By this study, an urgent need of human expert integration with supervisory control systems supported by a model mechanism and data-driven techniques in WWTP showed. Therefore, the last few years showed more progress in this area since the authors [3,10,13,27,60] investigated relevant energy savings potentials (up to 25%) in WWTPs. In the past, the main factor was the lack of good-in-quality performance measuring instruments for control purposes [62] but, nowadays, reliable online probes and sensors are available, so the technical limitation to set ICA and MMCS applications in practice is no longer the main issue. In summary, the fusion of different techniques and technology is a promising direction to develop and explore novel solutions to optimize and sustainably conduct the biochemical processes in WWTPs. More advanced control systems supported by models and computer simulations at WWTPs should be developed in the future, in Poland, but also in other EU countries in which most facilities are not energy-efficient enough. An interesting attempt supported by a human expert to deal with this challenge was carried out in the Strass WWTP (Austria), where a higher electrical energy production was shown in comparison to energy consumption. Almost 108% of the energy recovery efficiency in 2005 from that study was achieved [63]. From that moment, the WWTP should be not only considered as treating pollutants but also as an energy recovery and other resources plant, e.g., the Water Environmental Research Federation in the USA stated that the current name of WWTP should be changed in the near future into Water Resource Recovery Facility (WRRF).

4.2. Perspectives and Challenges

Considering the advanced technology at full-scale WWTPs such as energy-neutral or even recovery resources and energy in the future, more valuable and high-quality data should be included in the mathematical models, computer simulations and computational hardware control in order to achieve multiple suggestions and solid analyses [64,65]. An interesting solution to apply the multi-agent algorithm was proposed by Hernandez del Olmo et al. [64] in order to extract data from the database and generate autonomous real-time decisions. In fact, it was an innovative idea to deal with the challenge, but still, it was necessary to be online 24 h/7 d for an expert system to supervise the decision-making process. Another important point is energy balance, process parameters control (internal/external recirculation rate, SRT, DO, etc.) as well as the environmental effects (different kinds of gas emissions, e.g., CO2, N2O, and biogas production), that should be integrated and considered as a novel approach in the optimal conditions studies for WWTPs. That is why, in this study, the open structure of the database in PreviSys and the mechanisms of the model developer is an innovative solution that allows new variable extensions and/or modifications of equations in the model as a port of ASCS, depending on the individual needs. Therefore, as far as the data outputs are strongly related to the structure of the added system control, the uncertainty of the model predictions data should be clarified and concerned in future research. For example, the noise that often might occur in the process data such as operational faults, sensor/probe problems and improper model decisions may introduce disturbances into the operation strategy without careful identification of the problem control system in the WWTPs. The quality of the data in the system should also be a concern, regarding novel examination techniques for better quality and quantity, especially in cases of a large amount of data. Currently, the expansion of data volume had to be compromised with a limited budget in practical applications as shown through the experience of this and other author studies [3]. Of course, increasing the data quality and volume is now a big challenge, but with advanced technology, these might be more reliable and accurate in the future.
Summarizing the advanced supervisory control system should be targeted to process operators and, together with the engineers’ experience collaboration developed, as WWTPs are complicated facilities to control because of the processes dynamic and significant delay features. Moreover, current technology and techniques are not smart enough in order to deal with abnormal situations that can occur at WWTPs. For example, to extract the influent seasonal variation, it is quite easy to do by cluster analysis [63], but it is difficult to identify the process malfunction as well as to detect the wrong process operation and/or any kind of problem for data-driven models at WWTPs [59,66]. From engineers’ experience and regarding future perspectives, it is necessarily urgent to find out a reasonable solution which could be accepted by both sides in order to link a gap between the practical demands and scientific knowledge [67]. The development of smart technology and novel techniques as well as the integration of different research disciplines in this area could help in building the trust of operators and managers of WWTPs and making the supervisory control systems more applicable in practice.

5. Conclusions

In this study, the influence of aeration systems and internal recirculation were a critical element of the wastewater treatment based on the classical nitrification/denitrification process and the most energy-intensive “Klimzowiec” WWTP. Costs savings from the PreviSys project application were realized as an innovative concept of the virtualization data driven (e.g., NO3, NH4) from the calibrated/validated ASM2d model predicted by computer simulation. Moreover, a support operator system (SOS) with a double-checking technique was implemented in order to identify the process malfunction and detect incorrect operations or any additional problem, e.g., instrumentation faults: online checked measurements of the data of installed NO3/NH4 sensors by model predictions. The modeling has been successfully introduced to evaluate the facilities upgrade and optimize the operation strategies as well as to support the operators in the control of aeration systems at the study plant. The conclusions are as follows:
(1)
The importance of MMCS and ICA at municipal WWTPs increased with the development of technology and tightening the wastewater treatment requirements.
(2)
PreviSys include devices and software for communicating with SCADA systems and runs the mathematical model with certain parameters. Moreover, the PreviSCADA software which, in fact, acts as a data logger object, could be used as a useful tool in operation management and improvement as well as in technical advisement and scientific research in WWTPs.
(3)
The WEST platform integrated with PreviSys was found as useful tools for MMCS in the upgrade and operation strategies of aeration systems at the full-scale plant. The dynamic simulation as an element of a real-time control system of the plant performance was applied.
(4)
As much as 40%–60% of the power consumed at a wastewater facility is related to the aeration system. Optimizing the aeration system is essential for achieving robust biological treatment, as well as reducing energy costs. As it was previously indicated in this study, the energy consumption was significantly reduced (more than 16 %) at the “Klimzowiec” WWTP.
(5)
Further investigation and development of PreviSys as well as an intensive modeling study with virtual sensors e.g., NO3-N, NH4-N is required to obtain more cost-effective aeration systems.

Funding

This work was partly financially supported by Ministry of Science and Higher Education in Poland, within the statutory research by Faculty of Civil and Environmental Engineering, Gdansk University of Technology and by Shanghai international collaboration project (17230741000) as well as ZAPSOFT Ltd.

Acknowledgments

The participation of the “Klimzowiec” WWTP’s staff and M. Zmarzly from ZAPSOFT Ltd. is gratefully acknowledged.

Conflicts of Interest

The author declares no conflict of interest.

Abbreviations

WWTPwastewater treatment plant
OURoxygen uptake rate
OURHnetoxygen uptake rate ‘net–without endogenous stage’
CODdegrchemical oxygen demand degradable
ASCSadvanced supervisory control system
ASMactivated sludge model
YHyield heterotrophic biomass coefficient
YPO4Poly-phosphate PHA requirement storage
ICAinstrumentation, control and automation
MMCSmathematical modeling and computer simulation

References

  1. Swinarski, M.; Mąkinia, J.; Czerwionka, K.; Chrzanowska, M.; Drewnowski, J. Modeling external carbon addition in combined N-P activated sludge systems with an extension of the IWA activated sludge models. Water Environ. Res. 2012, 84, 646–655. [Google Scholar] [CrossRef] [PubMed]
  2. Drewnowski, J.; Remiszewska-Skwarek, A.; Fernandez-Morales, F.J. Model based evaluation of plant improvement at a large wastewater treatment plant (WWTP). J. Environ. Sci. Health Part A. 2018, 53, 669–675. [Google Scholar] [CrossRef]
  3. Qiu, Y.; Li, J.; Huang, X.; Shi, H. A Feasible Data-Driven Mining System to Optimize Wastewater Treatment Process Design and Operation. Water 2018, 10, 1342. [Google Scholar] [CrossRef]
  4. Gujer, W. Activated sludge modelling: Past, present and future. Water Sci. Technol. 2006, 53, 111–119. [Google Scholar] [CrossRef] [PubMed]
  5. Zarrad, W.; Harmand, J.; Devisscher, M.; Steyer, J.P. Comparison of advanced control strategies for improving the monitoring of activated sludge processes. Control Eng. Pract. 2004, 12, 323–333. [Google Scholar] [CrossRef]
  6. Olsson, G.; Nielses, M.K.; Yuan, Z.; Lynggaard-Jensen, A.; Steyer, J.P. Adding realism to simulated sensors and actuators. Water Sci. Technol. 2008, 57, 337–344. [Google Scholar]
  7. Yong, M.; Yong-Zhen, P.; Jeppsson, U. Dynamic evaluation of integrated control strategies for enhanced nitrogen removal in activated sludge process. Control Eng. Pract. 2006, 14, 1269–1278. [Google Scholar] [CrossRef]
  8. Yong, M.; Yong-Zhen, P.; Xiao-Lian, W.; Shu-Ying, W. Intelligent control aeration and external carbon addition for improving nitrogen removal. Environ. Model. Softw. 2006, 21, 821–828. [Google Scholar] [CrossRef]
  9. Holenda, B.; Domokos, E.; Rédey, Á.; Fazakas, J. Dissolved oxygen control of the activated sludge wastewater treatment process using model predictive control. Comput. Chem. Eng. 2008, 32, 1270–1278. [Google Scholar] [CrossRef]
  10. Stare, A.; Vrecko, D.; Hvala, N.; Strmcnik, S. Comparison of control strategies for nitrogen removal in an activated sludge process in terms of operating costs: A simulation study. Water Res. 2007, 41, 2004–2014. [Google Scholar] [CrossRef]
  11. Ayesa, E.; De la Sota, A.; Grau, P.; Sagarna, J.M.; Salterain, A.; Suescun, J. Supervisory control strategies for the new WWTP of Galindo-Bilbao: The long run from the conceptual design to the full-scale experimental validation. Water Sci. Technol. 2006, 53, 193–201. [Google Scholar] [CrossRef] [PubMed]
  12. Grau, P.; de Gracia, M.; Vanrolleghem, P.A.; Ayesa, E. A new plant-wide modelling methodology for WWTPs. Water Res. 2007, 41, 4357–4372. [Google Scholar] [CrossRef] [PubMed]
  13. Szaja, A.; Aguilar, J.A.; Łagód, G. Estimation of chemical oxygen demand fractions of municipal wastewater by respirometric method—Case study. Annual Set the Environment Protection/Rocznik Ochrona Środowiska 2015, 17, 289–299. [Google Scholar]
  14. Desjardins, M.-A.; Belanger, G.; Elmonayiri, D.S.; Stephenson, J. Wastewater Treatment Plant Optimization Using a Dynamic Model Approach. In Proceedings of the Sixth International Water Technology Conference, IWTC 2001, Alexandria, Egypt, 23–25 March 2001; pp. 370–377. [Google Scholar]
  15. Drewnowski, J.; Zmarzły, M. The use of mathematical models for diagnosis of activated sludge systems in WWTP. E3S Web Conf. 2017, 22, 00037. [Google Scholar] [CrossRef] [Green Version]
  16. Longo, S.; Mirko d’Antoni, B.; Bongards, M.; Chaparro, A.; Cronrath, A.; Fatone, F.; Lema, J.M.; Mauricio-Iglesias, M.; Soares, A.; Hospido, A. Monitoring and diagnosis of energy consumption in wastewater treatment plants. A state of the art and proposals for improvement. Appl. Energy 2016, 179, 1251–1268. [Google Scholar] [CrossRef]
  17. Krampe, J. Energy benchmarking of South Australian WWTPs. Water Sci. Technol. 2013, 67, 2059–2066. [Google Scholar] [CrossRef]
  18. Bodik, I.; Kubaská, M. Energy and sustainability of operation of a wastewater treatment plant. Environ. Prot. Eng. 2013, 39, 15–24. [Google Scholar]
  19. Pan, T.; Zhu, X.; Ye, Y. Estimate of life-cycle greenhouse gas emissions from a vertical subsurface flow constructed wetland and conventional wastewater treatment plants: A case study in China. Ecol. Eng. 2011, 37, 248–254. [Google Scholar] [CrossRef]
  20. Lackner, S.; Gilbert, E.M.; Vlaeminck, S.E.; Joss, A.; Horn, H.; van Loosdrecht, M.C. Full-scale partial nitritation/anammox experiences–an application survey. Water Res. 2014, 55, 292–303. [Google Scholar] [CrossRef]
  21. Rodriguez-Garcia, G.; Molinos-Senante, M.; Hospido, A.; Hernández-Sancho, F.; Moreira, M.T.; Feijoo, G. Environmental and economic profile of six typologies of wastewater treatment plants. Water Res. 2011, 45, 5997–6010. [Google Scholar] [CrossRef]
  22. Stamm, C.; Eggen, R.I.; Hering, J.G.; Hollender, J.; Joss, A.; Schärer, M. Micropollutant Removal from Wastewater: Facts and Decision-Making Despite Uncertainty. Environ. Sci. Technol. 2015, 49, 6374–6375. [Google Scholar] [CrossRef] [Green Version]
  23. Gori, R.; Jiang, L.-M.; Sobhani, R.; Rosso, D. Effects of soluble and particulate substrate on the carbon and energy footprint of wastewater treatment processes. Water Res. 2011, 45, 5858–5872. [Google Scholar] [CrossRef] [PubMed]
  24. Gao, H.; Scherson, Y.D.; Wells, G.F. Towards energy neutral wastewater treatment: methodology and state of the art. Environ. Sci. Process. Impacts 2014, 16, 1223–1246. [Google Scholar] [CrossRef] [PubMed]
  25. Zhou, X.; Wu, Y.; Shi, H.; Song, Y. Evaluation of oxygen transfer parameters of fine-bubble aeration system in plug flow aeration tank of wastewater treatment plant. J. Environ. Sci. 2014, 25, 295–301. [Google Scholar] [CrossRef]
  26. Rieger, L.; Gillot, S.; Langergraber, G.; Ohtsuki, T.; Shaw, A.; Takacs, I.; Winkler, S. Guidelines for Using Activated Sludge Models; IWA Publishing: London, UK, 2012. [Google Scholar]
  27. Nelder, J.A.; Mead, R.A. A simplex method for function minimization. Comput. J. 1965, 7, 308–313. [Google Scholar] [CrossRef]
  28. Banaszek, P. Klimzowiec według algorytmu. Kierunek WOD-KAN 2014, 3, 26–29. [Google Scholar]
  29. APHA; AWWA; WEF. Standard Methods for the Examination of Water and Wastewater, 22nd ed.; American Public Health Association: Washington, DC, USA, 2012; ISBN 978-087553-013-0. [Google Scholar]
  30. WEST—Modelling Wastewater Treatment Plants: Short Description; Mike by DHI: Hørsholm, Denmark, 2012.
  31. Vangheluwe, H.L.; Claeys, F.; Vansteenkiste, G.C. The WEST++ wastewater treatment plant modelling and simulation environment. In 10th European Simulation Symposium, Nottingham, UK, 26–28 October 1998; Bergiela, A., Kerckhoffs, E., Eds.; Society for Computer Simulation (SCS): Nottingham, UK, 1998. [Google Scholar]
  32. Vanhooren, H.; Meirlaen, J.; Amerlinck, Y.; Claeys, F.; Vangheluwe, H.; Vanrolleghem, P.A. WEST: Modelling biological wastewater treatment. J. Hydroinform. 2003, 5, 27–50. [Google Scholar] [CrossRef]
  33. Henze, M.; Gujer, W.; Mino, T.; Matsuo, T.; Wentzel, M.C.; Marais, G.v.R.; Van Loosdrecht, M.C.M. Activated sludge model No.2d, ASM2D. Water Sci. Technol. 1999, 39, 165–182. [Google Scholar] [CrossRef]
  34. Henze, M.; Grady, C.P.L., Jr.; Gujer, W.; Marais, G.V.R.; Matsuo, T. Activated Sludge Model No 1; IAWPRC Scientific and Technical Reports, No 1; IAWPRC: London, UK, 1987. [Google Scholar]
  35. Henze, M.; Gujer, W.; Mino, T.; Matsuo, T.; Wentzel, M.C.; Marais, G.V.R. Activated Sludge Model No. 2; IAWPRC Scientific and Technical Reports, No 3; IAWPRC: London, UK, 1995. [Google Scholar]
  36. Henze, M.; Gujer, W.; Mino, T.; Matsuo, T.; Wentzel, M.C.; Marais, G.V.R. Wastewater and biomass characterization for the activated sludge model No. 2: Biological phosphorus removal. Water Sci. Technol. 1995, 31, 13–23. [Google Scholar] [CrossRef]
  37. Henze, M.; Gujer, W.; Mino, T.; van Loosdrecht, M.C.M. Activated Sludge Models ASM1, ASM2, ASM2d and ASM3; IWA Scientific and Technical Report No. 9; IWA Publishing: London, UK, 2000. [Google Scholar]
  38. Ruano, M.V.; Ribes, J.; De Pauw, D.J.W.; Sin, G. Parameter subset selection for the dynamic calibration of activated sludge models (ASMs): Experience versus systems analysis. Water Sci. Technol. 2007, 56, 107–115. [Google Scholar] [CrossRef]
  39. Manga, J.; Ferrer, J.; Seco, A.; Garcia-Usach, F. Design of nutrient removal activated sludge systems. Water Sci. Technol. 2003, 47, 115–122. [Google Scholar] [CrossRef] [PubMed]
  40. Boontian, N. A calibration approach towards reducing ASM2d parameter subsets in phosphorus removal processes. World Acad. Sci. Eng. Technol. 2012, 64, 984–990. [Google Scholar]
  41. Machado, V.C.; Tapia, G.; Gabriel, D.; Lafuente, J.; Baeza, J.A. Systematic identifiability study based on the Fisher Information Matrix for reducing the number of parameters calibration of an activated sludge model. Environ. Model. Softw 2009, 24, 1274–1284. [Google Scholar] [CrossRef]
  42. Brun, R.; Kühni, M.; Siegrist, H.; Gujer, W.; Reichert, P. Practical identifiability of ASM2d parameters—Systematic selection and tuning of parameter subsets. Water Res. 2002, 36, 4113–4127. [Google Scholar] [CrossRef]
  43. Yagci, N.; Insel, G.; Tasli, R.; Artan, N.; Randall, C.W.; Orhon, D. A new interpretation of ASM2d for modeling of SBR performance for enhanced biological phosphorus removal under different P/HAc ratios. Biotechnol. Bioeng. 2003, 93, 258–270. [Google Scholar] [CrossRef] [PubMed]
  44. Meijer, S.C.F.; van Loosdrecht, M.C.M.; Heijnen, J.J. Metabolic Modeling of Full-Scale Biological Nitrogen and Phosphorus Removing WWTP’s. Water Res. 2001, 35, 2711–2733. [Google Scholar] [CrossRef]
  45. Makinia, J.; Drewnowski, J.; Swinarski, M.; Czerwionka, K. Internal vs. External (Alternative) Carbon Sources for Denitrification and EBPR Accomplished by a Full-Scale Biomass. In Proceedings of the Water Environment Federation/International Water Association 2nd Nutrient Removal, Specialty Conference, Washington, DC, USA, 28 June–1 July 2009; Water Environment Federation: Alexandria, VA, USA, 2009; pp. 16–30. [Google Scholar]
  46. Makinia, J. Performance Prediction of Full-Scale Biological Nutrient Removal Systems Using Complex Activated Sludge Models. In Veröffentlichungen des Institutes für Siedlungswasser-wirtschaft und Abfalltechnik der Universität Hannover; Unidruck of Leibniz, Universität Hannover: Hannover, Germany, 2006. [Google Scholar]
  47. Brdjanovic, D.; van Loosdrecht, M.C.M.; Versteeg, P.; Hooijmans, C.M.; Alaerts, G.J.; Heijnen, J.J. Modeling COD, N and P Removal in a Full Scale WWTP Haarlem Waarderpolder. Water Res. 2000, 34, 846–858. [Google Scholar] [CrossRef]
  48. Drewnowski, J.; Makinia, J. The role of biodegradable particulate and colloidal organic compounds in biological nutrient removal activated sludge systems. Int. J. Environ. Sci. Technol. 2014, 11, 1973–1988. [Google Scholar] [CrossRef]
  49. Weijers, S.R.; Vanrolleghem, P.A. A procedure for selecting best identifiable parameters in calibrating Activated Sludge Model No. 1 to full-scale plant data. Water Sci. Technol. 1997, 36, 69–79. [Google Scholar] [CrossRef]
  50. Brun, R.; Reichert, P.; Künsch, H.R. Practical identifiability analysis of large environmental simulation models. Water Resour. Res. 2001, 37, 1015–1030. [Google Scholar] [CrossRef] [Green Version]
  51. Ferrer, J.; Morenilla, J.J.; Bouzas, A.; García-Usach, F. Calibration and simulation of two large wastewater treatment plants operated for nutrient removal. Water Sci. Technol. 2004, 50, 87–94. [Google Scholar] [CrossRef] [PubMed]
  52. Penya-Roja, J.M.; Seco, A.; Ferrer, J.; Serralta, J. Calibration and validation of activated sludge model No. 2d for Spanish municipal wastewater. Environ. Technol. 2002, 23, 849–862. [Google Scholar] [CrossRef] [PubMed]
  53. Vrečko, D.; Hvala, N.; Carlsson, B. Feedforward-feedback control of an activated sludge process: A simulation study. Water Sci. Technol. 2003, 47, 19–26. [Google Scholar] [CrossRef] [PubMed]
  54. Ingildson, P. Realising Full-Scale Control in Wastewater Treatment Systems Using In-Situ Nutrient Sensors. Ph.D. Thesis, Lund University, Lund, Sweden, 2002. [Google Scholar]
  55. Qiu, Y.; Shi, H.; He, M. Nitrogen and Phosphorous Removal in Municipal Wastewater Treatment Plants in China: A Review. Int. J. Chem. Eng. 2010, 2010, 914159. [Google Scholar] [CrossRef]
  56. Zhang, Z.; Kusiak, A.; Zeng, Y.; Wei, X. Modeling and optimization of a wastewater pumping system with data-mining methods. Appl. Energy 2016, 164, 303–311. [Google Scholar] [CrossRef]
  57. Kusiak, A.; Zeng, Y.; Zhang, Z. Modeling and analysis of pumps in a wastewater treatment plant: A data-mining approach. Eng. Appl. Artif. Intell. 2013, 26, 1643–1651. [Google Scholar] [CrossRef]
  58. Kusiak, A.; Wei, X. A data-driven model for maximization of methane production in a wastewater treatment plant. Water Sci. Technol. 2012, 65, 1116–1122. [Google Scholar] [CrossRef] [PubMed]
  59. Zhu, J.; Kang, L.; Anderson, P.R. Predicting influent biochemical oxygen demand: Balancing energy demand and risk management. Water Res. 2018, 128, 304–313. [Google Scholar] [CrossRef] [PubMed]
  60. Haimi, H.; Mulas, M.; Corona, F.; Vahala, R. Data-derived soft-sensors for biological wastewater treatment plants: An overview. Environ. Model. Softw. 2013, 47, 88–107. [Google Scholar] [CrossRef]
  61. Duerrenmatt, D.J.; Gujer, W. Data-driven modeling approaches to support wastewater treatment plant operation. Environ. Model. Softw. 2012, 30, 47–56. [Google Scholar] [CrossRef]
  62. Jeppsson, U.; Rosen, C.; Alex, J.; Copp, J.; Gernaey, K.V.; Pons, M.-N.; Vanrolleghem, P.A. Towards a benchmark simulation model for plant-wide control strategy performance evaluation of WWTPs. In Proceedings of the 6th International Symposium on Systems Analysis and Integration Assessment, Beijing, China, 3–5 November 2004. [Google Scholar]
  63. Kroiss, H.; Cao, Y. Energy considerations. In Activated Sludge—100 Years and Counting; Jenkins, D., Wanner, J., Eds.; IWA Publishing: London, UK, 2014; pp. 221–244. [Google Scholar]
  64. Hernandez-del-Olmo, F.; Llanes, F.H.; Gaudioso, E. An emergent approach for the control of wastewater treatment plants by means of reinforcement learning techniques. Exp. Syst. Appl. 2012, 39, 2355–2360. [Google Scholar] [CrossRef]
  65. Zhao, Y.; Guo, L.; Liang, J.; Zhang, M. Seasonal artificial neural network model for water quality prediction via a clustering analysis method in a wastewater treatment plant of China. Desalin. Water Treat. 2016, 57, 3452–3465. [Google Scholar] [CrossRef]
  66. Guerrini, A.; Romano, G.; Indipendenza, A. Energy Efficiency Drivers in Wastewater Treatment Plants: A Double Bootstrap DEA Analysis. Sustainability 2017, 9, 1126. [Google Scholar] [CrossRef]
  67. Turunen, V.; Sorvari, J.; Mikola, A. A decision support tool for selecting the optimal sewage sludge treatment. Chemosphere 2018, 193, 521–529. [Google Scholar] [CrossRef]
Figure 1. The architecture technology process scheme (a) with the measuring/operating PreviSys communication system and (b) sample results of the key parameters display (COD, TSS, TP and TKN data were shown) relating to the quality of the wastewater inflow for the operation/control of the “Klimzowiec” WWTP.
Water 11 01218 g001
Figure 2. The scheme of the advanced supervisory control system PreviSys with the monitoring/controlling process technology (adapted from Drewnowski and Zmarzly [15]).
Water 11 01218 g002
Figure 3. The comparison of (a) the classic control of aeration system at a Wastewater Treatment Plant (WWTP) and (b) the advanced PreviSys control system using a virtual NH4 data-driven simulation by model prediction.
Water 11 01218 g003
Figure 4. The comparison between the measured versus calculated “virtual” NO3-N data by model predictions at the “Klimzowiec” WWTP.
Water 11 01218 g004
Figure 5. The comparison between (a) the measured versus calculated “virtual” NH4-N data by model predictions at the “Klimzowiec” WWTP (b) the measured NH4-N results reducing the values by 0.3 mg/L compared to model predictions.
Water 11 01218 g005
Table 1. The sample characteristics of the wastewater composition at the “Klimzowiec” Wastewater Treatment Plant (WWTP).
ParameterUnitMean Value ± Standard Deviation
Chemical oxygen demand (COD)mg∙dm−3779 ± 68.0
Total nitrogen (TN)mg∙dm−398.6 ± 7.8
Ammonia nitrogen (N-NH4+)mg∙dm−385.1 ± 2.2
Total phosphorus (TP)mg∙dm−312.8 ± 1.7
Total suspended solids (TSS)mg∙dm−3267 ± 21.8
Table 2. The links between the experimental and modeling procedure at the “Klimzowiec” WWTP.
Source of DataModeling Procedure
Laboratory-scale (batch tests) and full-scale measurement campaign (tracer test)Biological reactor model calibration (summer conditions) and validation (winter conditions) under dynamic conditions
Historical operational data and additional laboratory experimentsSimulation of the strategies for optimization and energy balance improvement at the plant-wide model
Table 3. The sample results of the tracer test between the denitrification zones in the bioreactors of the “Klimzowiec” WWTP.
Tracer Test in “Klimzowiec” WWTPTimeDenitrification Bioreactors
(h:min)14/114/214/3
Lithium chloride concentration (mg∙dm−3)09:10<0.03<0.03<0.03
09:450.0360.0380.055
10:200.0760.0750.091
10:540.1060.1030.114
12:250.1300.1280.131
Table 4. The ASM2d default values of stoichiometric and kinetic parameters according to Henze et al. [33] and the values adjusted during model calibration and sensitivity analysis (SA) ranking.
ParameterSymbolUnitDefault Value [33]Calibrated ValueRanking of SA
Autotrophic (Nitrifying) Organisms:
Saturation coefficient for the phosphate of XAKPO4,AUTg P/m30.010.00114.15
Saturation coefficient for the ammonium of XAKNH4,AUTg N/m31.01.311.47
Maximum growth rate of XAμAUTd−11.01.357.89
Heterotrophic Organisms:
Maximum growth rate on substrate of XHμHd−16.03.01.11
Yield coefficient heterotrophic biomassYHg COD/g COD0.630.65<0.01
Hydrolysis:
Hydrolysis rate constantKhd−13.02.5<0.05
Anaerobic hydrolysis reduction factorηfe-0.40.1<0.01
Saturation coefficient for particulate CODKx-0.10.2<0.01
Phosphate Accumulating Organisms:
Poly-phosphate PHA requirement storageYPO4g P/g COD0.40.3212.23
Rate for lysis of XPPqPPd−11.54.58.43
Rate for lysis of XPHAqPHAd−13.06.02.56
Saturation coefficient for XPP storage of XPAOKIPP,PAOg P/g COD0.020.11.39
Reduction factor anoxic activity of XPAOηNO3,PAO-0.60.5<1.0
Saturation coefficient for SA of XPAOKSA,PAOg COD/m34.01.0<0.5
Saturation coefficient for XPP of XPAOKPP,PAOg COD/g COD0.010.02<0.5
Saturation coefficient for XPHA of XPAOKPHA,PAOg COD/g COD0.010.2<0.05
Saturation coefficient for the ammonium of XPAOKNH4,PAOg N/m30.050.01<0.05
Saturation coefficient for for the phosphate of XPAOKP,PAOg P/m30.010.001<0.01
Table 5. The comparative quality of model calibration based on the computer simulation results and online measurements by NH4 sensors at the “Klimzowiec” WWTP.
“Klimzowiec”ControlEffluent NH4‑NaAverage Deviations
WWTPStrategies(g N/m3)(%)
Online measurementsNH4 sensor0.28 (+/−0.12)(reference point)
Computer simulationsNH4 virtualization0.31 (+/−0.15)9.68
a Average values (standard deviation in parenthesis).
Table 6. The comparative energy consumption results of both NH4 measurements/virtualization in operation strategies at the “Klimzowiec” WWTP.
Operation Strategies atQAIR EnergyQIR EnergyEnergy Total Cost Savings a
“Klimzowiec” WWTP(kWh)(kWh)(kWh)(%)
NH4 measurements by sensor143 835181 197325 032(reference point)
NH4 virtualization by model128 939143 182272 12116.3
a Average values relative to the one month study of both NH4 sensor measurements/virtualization in operation strategies at the “Klimzowiec” WWTP.