Article

Performance Evaluation of Version 5 (V05) of Integrated Multi-Satellite Retrievals for Global Precipitation Measurement (IMERG) over the Tianshan Mountains of China

1
State Key Laboratory of Cryospheric Science, Northwest Institute of Eco-Environment and Resources, Chinese Academy of Sciences, Lanzhou 730000, China
2
University of Chinese Academy of Sciences, Beijing 100049, China
*
Authors to whom correspondence should be addressed.
Water 2019, 11(6), 1139; https://doi.org/10.3390/w11061139
Submission received: 15 April 2019 / Revised: 19 May 2019 / Accepted: 27 May 2019 / Published: 30 May 2019
(This article belongs to the Section Hydrology)

Abstract

:
This study evaluated the performance of the Integrated Multi-satellite Retrievals for Global Precipitation Measurement (IMERG) version 5 (V05) Early-run and Final-run (IMERG-E and IMERG-F, respectively) products over the Tianshan Mountains. For comparison, the accuracies of two Tropical Rainfall Measuring Mission (TRMM) products (3B42RT and 3B42V7) were also analyzed. Performance of the satellite-based precipitation products (SPPs) was analyzed at daily to annual scales from April 2014 to October 2017. Results showed that: (1) IMERG-F and 3B42V7 performed better than IMERG-E and 3B42RT in the characterization of spatiotemporal variability of precipitation; (2) Precipitation estimates from IMERG-F were in the best overall agreement with the gauge-based data, followed by IMERG-E and 3B42V7 on all temporal scales; (3) IMERG-E and 3B42RT products were failed to provide accurate precipitation amounts, whereas IMERG-F and 3B42V7 were able to provide accurate precipitation estimates with the lowest relative biases (4.98% and −1.71%, respectively) and RMSE (0.58 mm/day and 0.76 mm/day, respectively); (4) The enhancement from the IMERG Early-run to the Final-run to capture the moderate to heavy precipitation events was not evident; (5) On seasonal scale, IMEGR-F performed better than all other SPPs, particularly during the spring season with negligible bias (0.28%). It was deduced that IMERG-F was capable of replacing TRMM products.

1. Introduction

Precipitation is a well-known physical phenomenon that has vast influences on water availability, glacier mass balance, environment, ecosystem, crop yield, and our livelihoods. Availability of high-quality precipitation records on fine spatiotemporal resolutions is thus crucial for related research and applications. Ground-based meteorological instruments (rain gauges and weather radars) are generally regarded as the most intuitive and accurate sources of precipitation data [1]. However, in developing countries and in physically inaccessible regions of the world, these ground-based meteorological instruments are often sparse or unavailable, leading to the poor representation of spatial and temporal characteristics of precipitation [2,3,4]. In such regions, satellite-based precipitation products (SPPs) could provide uninterrupted information on occurrence, distribution and amount of precipitation at fine spatiotemporal resolutions [5,6,7] and, therefore, could be employed for climatological, hydrological, meteorological, and cryospheric studies [8,9,10,11].
The satellite-based precipitation information is generally derived either from the infrared (IR), microwave (MW) or from the conjunction of both IR and MW fields [12,13]. Several algorithms have been developed to estimate the precipitation information from IR sensors onboard Geosynchronous orbit (GEO) satellites [12]. Such algorithms consider perceptible water and cloud-top temperature to derive precipitation information. Likewise, several algorithms have also been developed to convert the MW imageries, which are generally obtained from the passive microwave sensors onboard the Low-earth orbiting (LEO) satellites, to precipitation rates using the information of cloud profile and atmospheric constituents [14]. Precipitation information derived from IR (with high spatiotemporal resolution) and MW (with high precision and relation with rainfall) satellite imageries are often blended to provide improved information of precipitation [15]. Several SPPs have been developed by combining both IR and MW fields, for instance, the Tropical Rainfall Measurement Mission (TRMM) Multi-Satellite Precipitation Analysis (TMPA) [12], Global Satellite Mapping of Precipitation (GSMaP) [16], National Oceanic and Atmospheric Administration/Climate Prediction Centre (NOAA/CPC) Morphing technique (CMORPH) [17], and Precipitation Estimation from Remotely Sensed Information using Artificial Neural Network (PERSIANN) [18]. Among these SPPs, the precipitation estimates from TRMM products have been widely used for hydro-climatic and related applications in different tropical and subtropical regions of the world [19,20,21,22,23]. The TRMM was jointly initiated by the National Aeronautics and Space Administration (NASA) and the Japanese Aerospace Exploration Agency (JAXA) in 1997. In TRMM, NASA and JAXA have incorporated the world’s first spaceborne precipitation radar (PR-Ku band) to provide the direct precipitation information from space. This satellite was specifically launched to monitor the precipitation over the tropical and subtropical regions (50° N to 50° S). The TMPA algorithm is capable of generating near-real-time (3B42RT) and post real-time (3B42) precipitation estimates at fine spatial and temporal resolutions (0.25° spatial resolution and three-hour temporal resolution). The performance of TMPA-based precipitation products has been widely investigated in different regions and has been accepted for different applications such as hydrological modelling [24,25,26], agriculture [27], drought monitoring [28], flood simulation [29], and prediction of soil moisture content [30].
After the notable success of TRMM, its successor, the Global Precipitation Measurement (GPM) Mission, was launched by NASA and JAXA in February 2014. The GPM core observatory has used the world’s first spaceborne dual-frequency precipitation radar (DPR-Ku and Ka bands). It provides the Integrated Multi-satellite Retrievals for GPM (IMERG) precipitation estimates at 0.1°× 0.1° spatial and 30-min temporal resolutions. The IMERG system is designed to quantify precipitation after uniting, interpolating, and intercalibrating passive microwave (PWM) and IR information from CMORPH-Kalman Filter (CMORPH-KF), TRMM, and PERSIANN. The first version of the IMERG, Version 3 (V03), was released in March 2014 for research purposes. Many researchers have reported the errors and uncertainties of IMERG-V03 in different topographic and climatic regions [2,8,13,31,32]. Based on the documented performance of IMERG-V03 product in different regions of the world, its precipitation retrieval algorithm was modified. After improvements in IMERG-V03, the NASA Goddard Space Flight Center (GSFC) introduced Version 04 (V04) of IMERG on March 22, 2017. Likewise V03, precipitation estimates from the IMERG-V04 were also assessed worldwide and the uncertainties and errors in the precipitation retrieval algorithms were identified over the diverse landscapes and climate systems [4,33,34,35,36,37]. After modification in the precipitation retrieval algorithm of IMERG-V04, the version 5 (V05) was launched on November 20, 2017. The main purpose of such improvements in precipitation retrieval algorithms of GPM-based products is to provide the best replacement of Tropical Rainfall Measurement Mission (TRMM).
Since the release of Version 5 of IMERG products, several researchers have evaluated the improvements and weaknesses of its near real-time and post real-time precipitation estimates in different regions and climatic conditions with reference to ground-based or other prevailing remotely sensed precipitation products [23,38,39,40,41,42,43,44,45,46]. For instance, Yuan et al. [41] concluded that the IMERG-V05 Final run product is an adequate replacement for the post-real-time TMPA-3B42 precipitation product in Myanmar. Similarly, Ur Rahman et al. [43] established that the precipitation estimates derived from the final run product of IMERG-V05 are more reliable than that of the TMPA-3B42 product in Pakistan. Based on the performance of near real-time (IMERG-E) and post real-time (IMERG-F) products of IMERG over the lower Colorado River basin of US, Omranian and Sharif [45] recommended the use of post real-time product (IMERG-F) for hydro-meteorological application for their study area. Nevertheless, further comprehensive investigations in different regions, climatic conditions, and landscapes are critical to better understand the uncertainties and error characteristics of this version of GPM. Such investigations could be helpful for further modifications in satellite-based precipitation retrieval algorithms as well as for climatological, meteorological, environmental, cryospheric, and hydrological applications [4,23,40,41,44].
In this study, we have investigated the errors and uncertainties associated with the IMERG-V05 near real-time (IMERG Early-run) and post real-time (IMERG Final-run) precipitation products with reference to the precipitation observations obtained from the in situ rain gauges and two TMPA (near real-time (3B42RT) and post real-time (3B42V7)) precipitation products over the Tianshan Mountains in northwestern China. This is the first comprehensive study which strives to investigate the capability of IMERG-V05 Early-run and Final-run products (hereafter, IMERG-E and IMERG-F, respectively) to substitute the ground-based and TRMM-based precipitation data in the Tianshan Mountains. Whereby, the performance of TRMM products (3B42RT and 3B42V7) was also analyzed to provide a better perspective of the similarities, improvements, and shortcomings of the IMERG-V05 precipitation products. The precipitation data of 39 in situ rain gauges for the period of April 2014 to October 2017 were used to evaluate the performance of the SPPs.

2. Materials and Methods

2.1. Study Area

The Tianshan Mountains are the largest mountainous range in Central Asia, which covers a total area of about 800,000 km2 [47]. These mountains are experiencing a temperate continental climate system with scarce precipitation [48]. Considering the data availability of reference gauging stations, the present assessment of the satellite-derived precipitation products was conducted only in the Chinese part of the Tianshan Mountains which covers a spatial domain between 39°–46° N and 74°–96° E (Figure 1). The elevation in the study domain ranges between 7094 m and −180 m. The westerly atmospheric circulation system and moisture laden arctic air masses are the main sources of precipitation over the Tianshan Mountains [49]. The Intermountain areas receive less precipitation compared to the mountainous areas [50]. In general, the windward (northern) slopes are wetter than leeward (southern) slopes.

2.2. Datasets

The observed daily precipitation records from a total of 39 in situ gauging stations (Figure 1) were obtained from China Meteorological Administration (CMA, http://data.cma.cn/) for the time period of April 2014 to October 2017. The high quality of the meteorological gauging stations used in this study was already ensured by the National Meteorological Information Centre (NMIC) of China [40]. Moreover, several recent studies have successfully used the daily precipitation data of selected gauges in different hydro-climatological investigations [14,51,52,53].
The GPM is actually a successor of TRMM project which provides precipitation estimates on fine spatiotemporal resolutions with broader spatial coverage (65° N to 65° S) by combining information from infra-red (IR) and passive microwave (PMW) sensors onboard Geostationary (GEO) and Low-earth orbiting (LEO) satellites, respectively. The GPM is providing precipitation estimates at 30 min time interval by processing the information from IR and PMW sensors through CMORPH–Kalman Filter Lagrangian time interpolation. The Global Precipitation Climatology Centre (GPCC) is responsible to provide monthly precipitation estimates to the GPM for the calibration of the global precipitation retrievals. The GPM has developed different precipitation retrieval algorithms to provide IMERG-based precipitation information on early-run, late-run and final-run stages. Only final-run IMERG precipitation estimates are calibrated with monthly precipitation data provided by GPCC. Currently, version 5 (V05) of IMERG is available for the research community. In this study, we have assessed the performance of the IMERG (V05) Early-run and Final-run products in an arid climate over the mountainous region. The precipitation estimates from IMERG with a spatial resolution of 0.1° and temporal resolution of 30 min were downloaded from the website of GPM (https://pmm.nasa.gov/GPM) over the period of April 2014 to October 2017. These 48 half-hourly precipitation estimates were then accumulated to obtain daily precipitation estimates. To convert the half-hourly precipitation estimates (mm/0.5H) to hourly estimates (mm/h), the daily accumulated estimates were multiplied by 0.5 (by following Tan and Duan [36]). Monthly, seasonal and annual precipitation estimates were then obtained from the daily data.
To compare the improvements and weaknesses of precipitation retrieval algorithms of GPM-based latest precipitation products, the performance of its predecessors real-time and post real-time TRMM-based precipitation products (3B42RT and 3B42V7, respectively) were also assessed in the present study. The precipitation retrieval algorithms used in the TRMM-based products are capable of providing precipitation information at three-hour time interval by processing information from precipitation radar (PR), Visible and Infrared Sensor (VIRS), and TRMM Microwave Imager (TMI) onboard LEO satellite [12]. These TRMM products are available at 0.25° grid resolution.
Currently, version 7 (V7) of TMPA products is available. For the present investigation, the near real-time (3B42RT) and post-real-time (3B42V7) products of TMPA (V7) at three hour time interval and 0.25° × 0.25° spatial resolution were downloaded from the website of TRMM (http://disc2.nascom.nasa.gov/tovas/). The three-hourly precipitation estimates were first multiplied by a factor of 3 (by following Wang et al. [40] and then accumulated to obtain daily, monthly, seasonal, and annual precipitation estimates. For the comparison purpose, the TMPA products were downloaded for the same study duration (April 2014 to October 2017). All of the satellite products (IMERG-E, IMERG-F, 3B42V7, and 3B42RT) are available at UTC 0, whereas in situ precipitation observations are available at UTC 8. Therefore, precipitation estimates obtained from all of these products were converted to UTC 8 by following Cai et al. [54].

2.3. Methods

The performance of IMERG-E, IMERG-F, 3B42V7, and 3B42RT products was assessed with reference to the precipitation data obtained from the in situ gauging stations. The evaluation was based on the ability of the SPPs to monitor the spatiotemporal variation of the precipitation over the Tianshan Mountains and by analyzing discrepancies, correlations, and the precision to detect precipitation occurrence over the study domain. For the assessment of SPPs, ground-based stations and their corresponding grids of IMERG-E, IMERG-F, 3B42V7, and 3B42RT products were selected only, whereas the grids of SPPs without any gauging station were omitted from the investigation, by following Palomino-Ángel et al. [42]. To compare the spatial patterns of error characteristics of SPPs in the entire study domain, the maps of spatial distribution of errors associated with four SPPs were interpolating (using Inverse Distance Weight (IDW) interpolation technique) by considering error characteristics of SPPs at considered gauging stations.
To investigate the performance of the SPPs with reference to the ground-based observations, three error metrics (Bias, relative Bias (rBias), and Root Mean Square Error (RMSE)), three contingency evaluation metrics (Probability of Detection (POD), False Alarm Ratio (FAR) and Critical Success Index (CSI)), and a correlation metric (Pearson Correlation Coefficient (CC)) were computed. Several researchers have used these metrics for the performance evaluation of satellite precipitation products [14,29,52,55,56,57,58,59]. The error evaluation indices were used to assess the accuracy of the SPPs for estimating precipitation amounts. Bias was used to assess the systematic bias (overestimation or underestimation) in satellite-based precipitation amounts with reference to the gauge-based observations. The rBias was estimated to quantify the relative difference (%) between two data sources. The RMSE was calculated to measure the average magnitude of error (mm/time) between gauge-based observations and satellite-based estimates. The dimensionless correlation metric (CC) was used to describe the consistency between the gauge-based observations and satellite-based estimates. The correlation metric and error metrics were computed as follows:
CC = i = 1 n ( G P i G P ¯ ) ( S P i S P ¯ ) i = 1 n ( G P i G P ¯ ) 2 × i = 1 n ( S P i S P ¯ ) 2
B i a s = i = 1 n ( S P i G P i ) n
r B i a s = i = 1 n ( S P i G P i ) i = 1 n G P i × 100
RMSE = 1 n i = 1 n ( S P i G P i ) 2
In the above equations, G P i is the gauge-based precipitation; G P ¯ is the mean of gauge-based precipitation; SPi is the satellite-based precipitation; S P ¯ is the mean of satellite precipitation; and n is the total number of gauge-based or satellite-based precipitation data. A SPP is considered a perfect product if the values of error metrics are zero and the correlation metric is 1. According to the [60,61] criteria, the performance of a satellite product is acceptable if the value of correlation metric is higher than 0.7 (CC > 0.7) and relative bias is between −10% to 10%. A positive value of Bias (rBias) indicates the overestimation of precipitation amount and vice versa.
The performance of all SPPs was also assessed in four different seasons: winter (December–February); spring (March–May); summer (June–September), and: autumn (October–November). The probability density function (PDF) of satellite-based precipitation products was evaluated at seven different precipitation intensities (mm/day): (1) 0.1–1; (2) 1–2; (3) 2–5; (4) 5–10; (5) 10–20; (6) 20–50; and (7); >50. These precipitation thresholds in the Tianshan Mountains were classified by considering the World Meteorological Organization (WMO) standard with small modifications (by considering a threshold of 0.1 instead of 0 in class 1). Previously, several researchers have modified the threshold of low-intensity events (<1 mm/day) by considering the regional precipitation characteristics [36,40].
The contingency metrics were computed to evaluate the precipitation detection skills of SPPs with reference to the gauge-based observations. The POD, FAR, CSI were computed by following [4]. A high value of POD indicates that the satellite product was well trained to capture the precipitation occurrence, high value of FAR shows that most of the precipitation events represented by the satellite were wrong, and high CSI value shows that the ratio of precipitation events retrieved by SPP was high. In this study, the threshold precipitation for the computed contingency metrics was 1 mm/day. These dimensionless contingency metrics were calculated as follows:
POD = H H + M
FAR = F H + F
CSI = H H + F + M
where H is the number of hits when SPP was successful to retrieve the precipitation observed by the gauge; F represents the events when precipitation was falsely detected by the SPP; and M represents the number of events when precipitation events observed by gauge were missed by SPP. The perfect scores for POD and CSI are 1, and 0 for FAR.

3. Results

3.1. Spatiotemporal Distribution of Precipitation

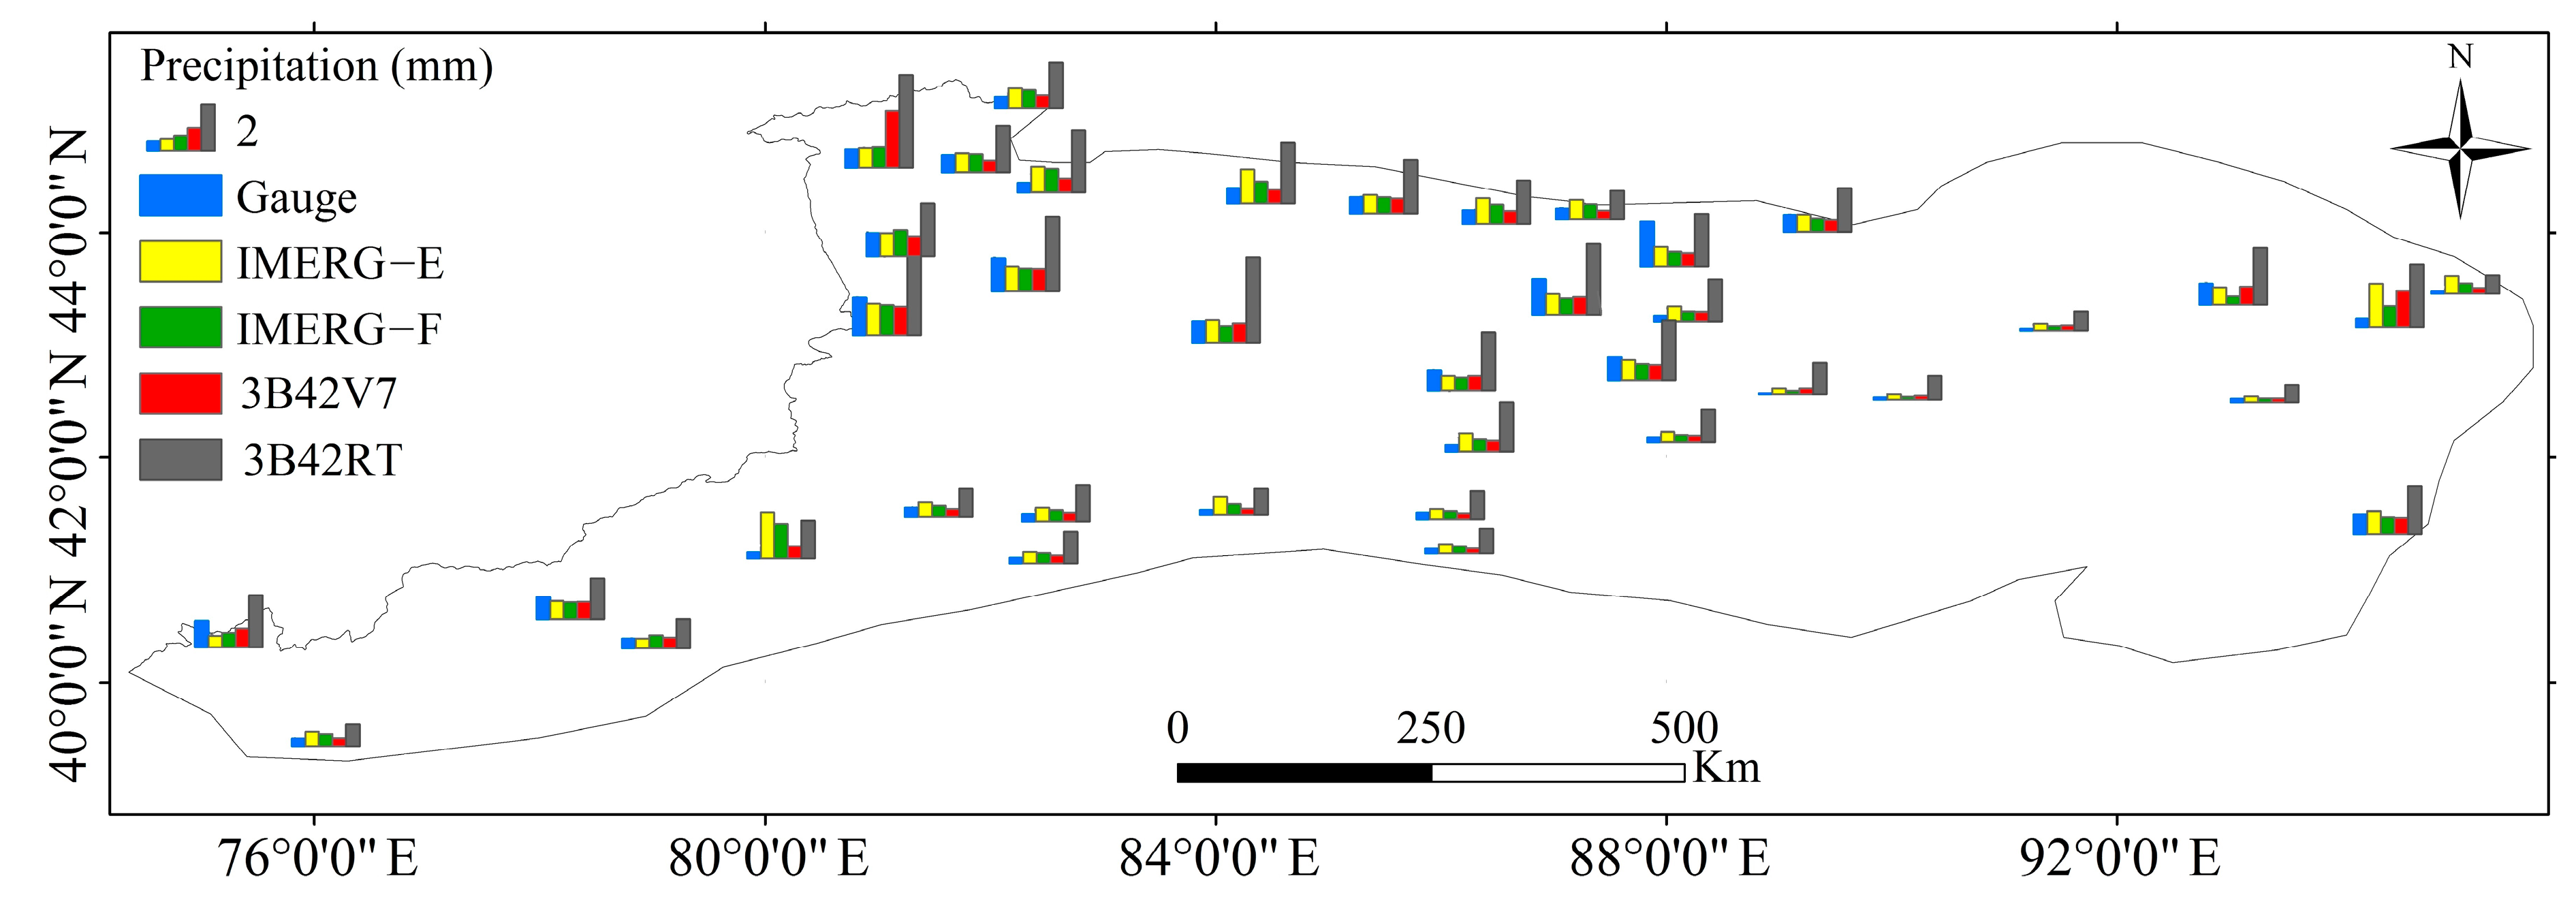
Figure 2 displays the spatial distribution of average daily precipitation derived from the gauges and four SPPs over the Tianshan Mountains from April 2014 to October 2017. The average daily precipitation from the in situ gauging stations displayed an increasing trend with altitude. A considerable longitudinal variation in the precipitation quantity was also found. A gradual increase in average daily precipitation was found from the east to west direction, and from south to north direction. Intermountanious areas received less daily precipitation. Generally, both IMERG products (IMERG-E and IMERG-F) and 3B42V7 were able to represent the spatial distribution of average daily precipitation over the Tianshan Mountains (Figure 2). The 3B42RT product was failed to track the spatial distribution of precipitation over the study domain. Analysis of the spatial distribution of daily precipitation estimates over the Tianshan Mountains showed that the high altitudes in the northwestern parts of the study domain received maximum precipitation during April 2014 to October 2107.
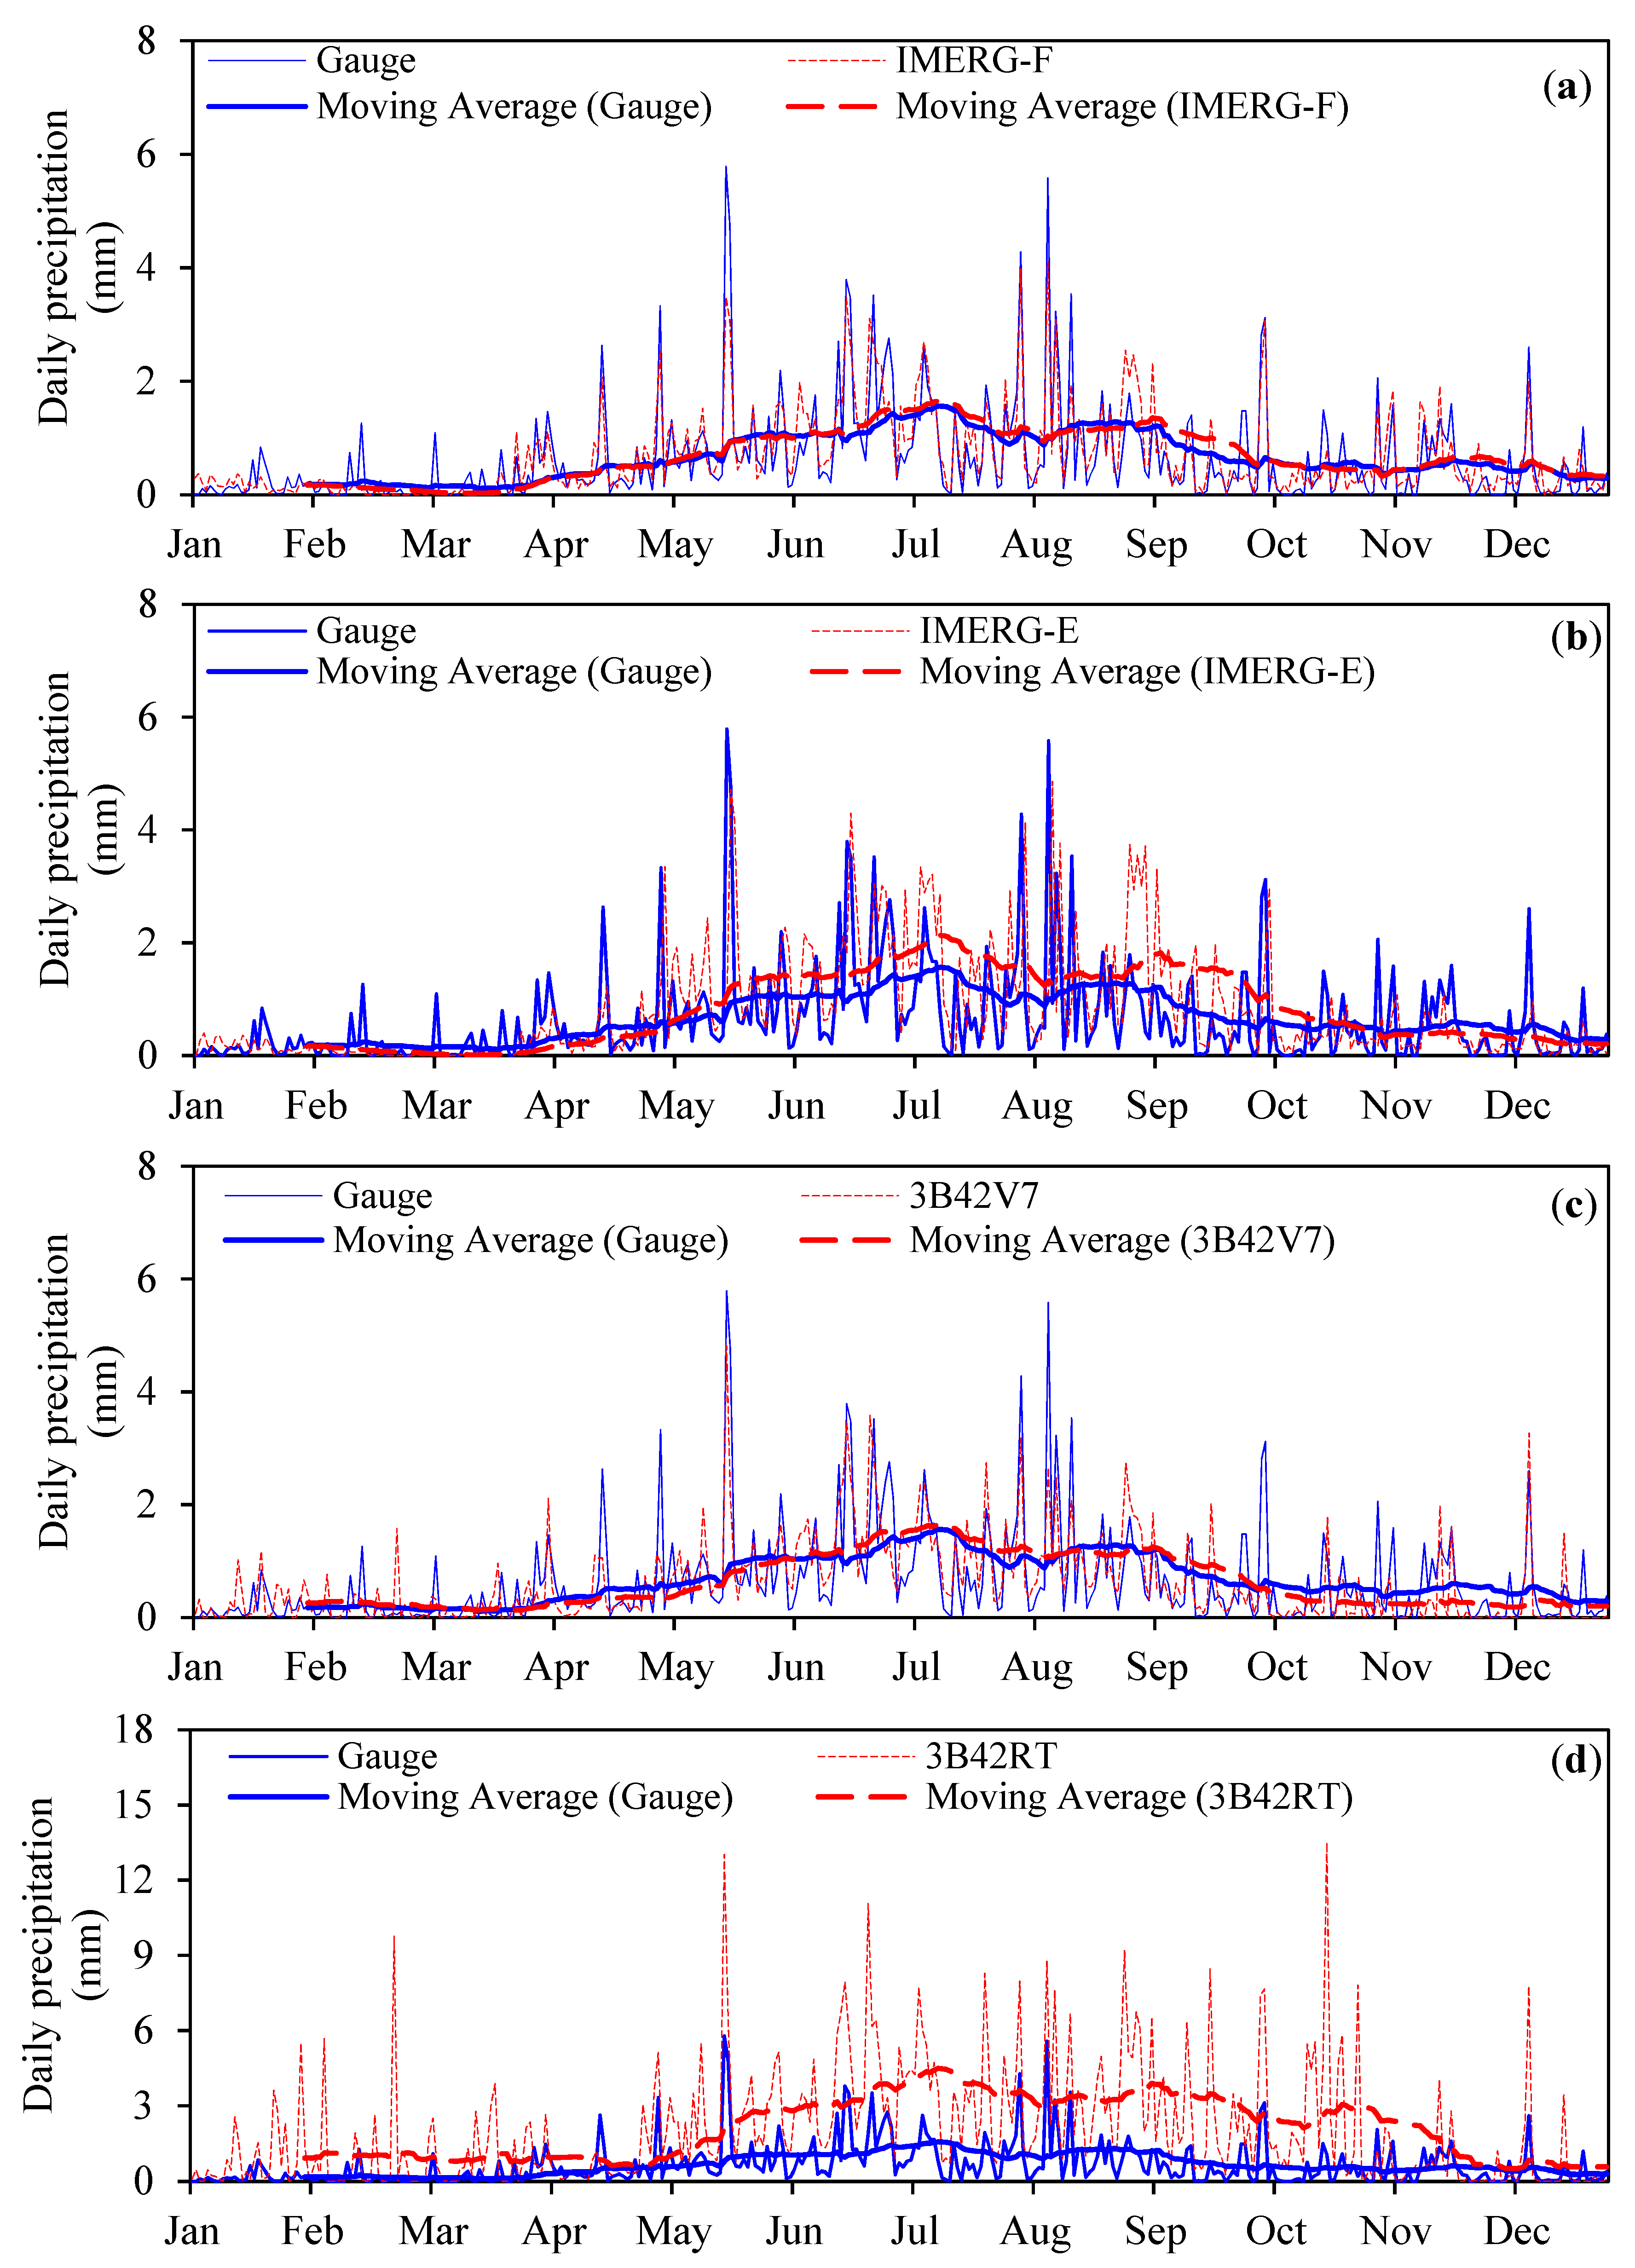
Figure 3 represents the temporal variation of average daily precipitation over the Tianshan Mountains. This time series data was calculated by averaging the daily precipitation estimates from gauges, IMERG-E, IMERG-F, 3B43V7, and 3B42RT products during 2015 and 2016. Graphical comparisons indicate that the post real-time products of GPM and TRMM (IMERG-F and 3B42V7) were capable of tracking the temporal variation of daily precipitation. In case of near real-time precipitation products, IMERG-E and 3B42RT were less accurate to capture the variation of daily observed precipitation over the study domain. The overestimation of precipitation by IMERG-E was significant during the summer season (Figure 3b). Comparatively, 3B42RT product showed the worst performance, it was failed to represent the temporal and quantitative characteristics of observed precipitation over the Tianshan Mountains (Figure 3d).

3.2. Daily Evaluation

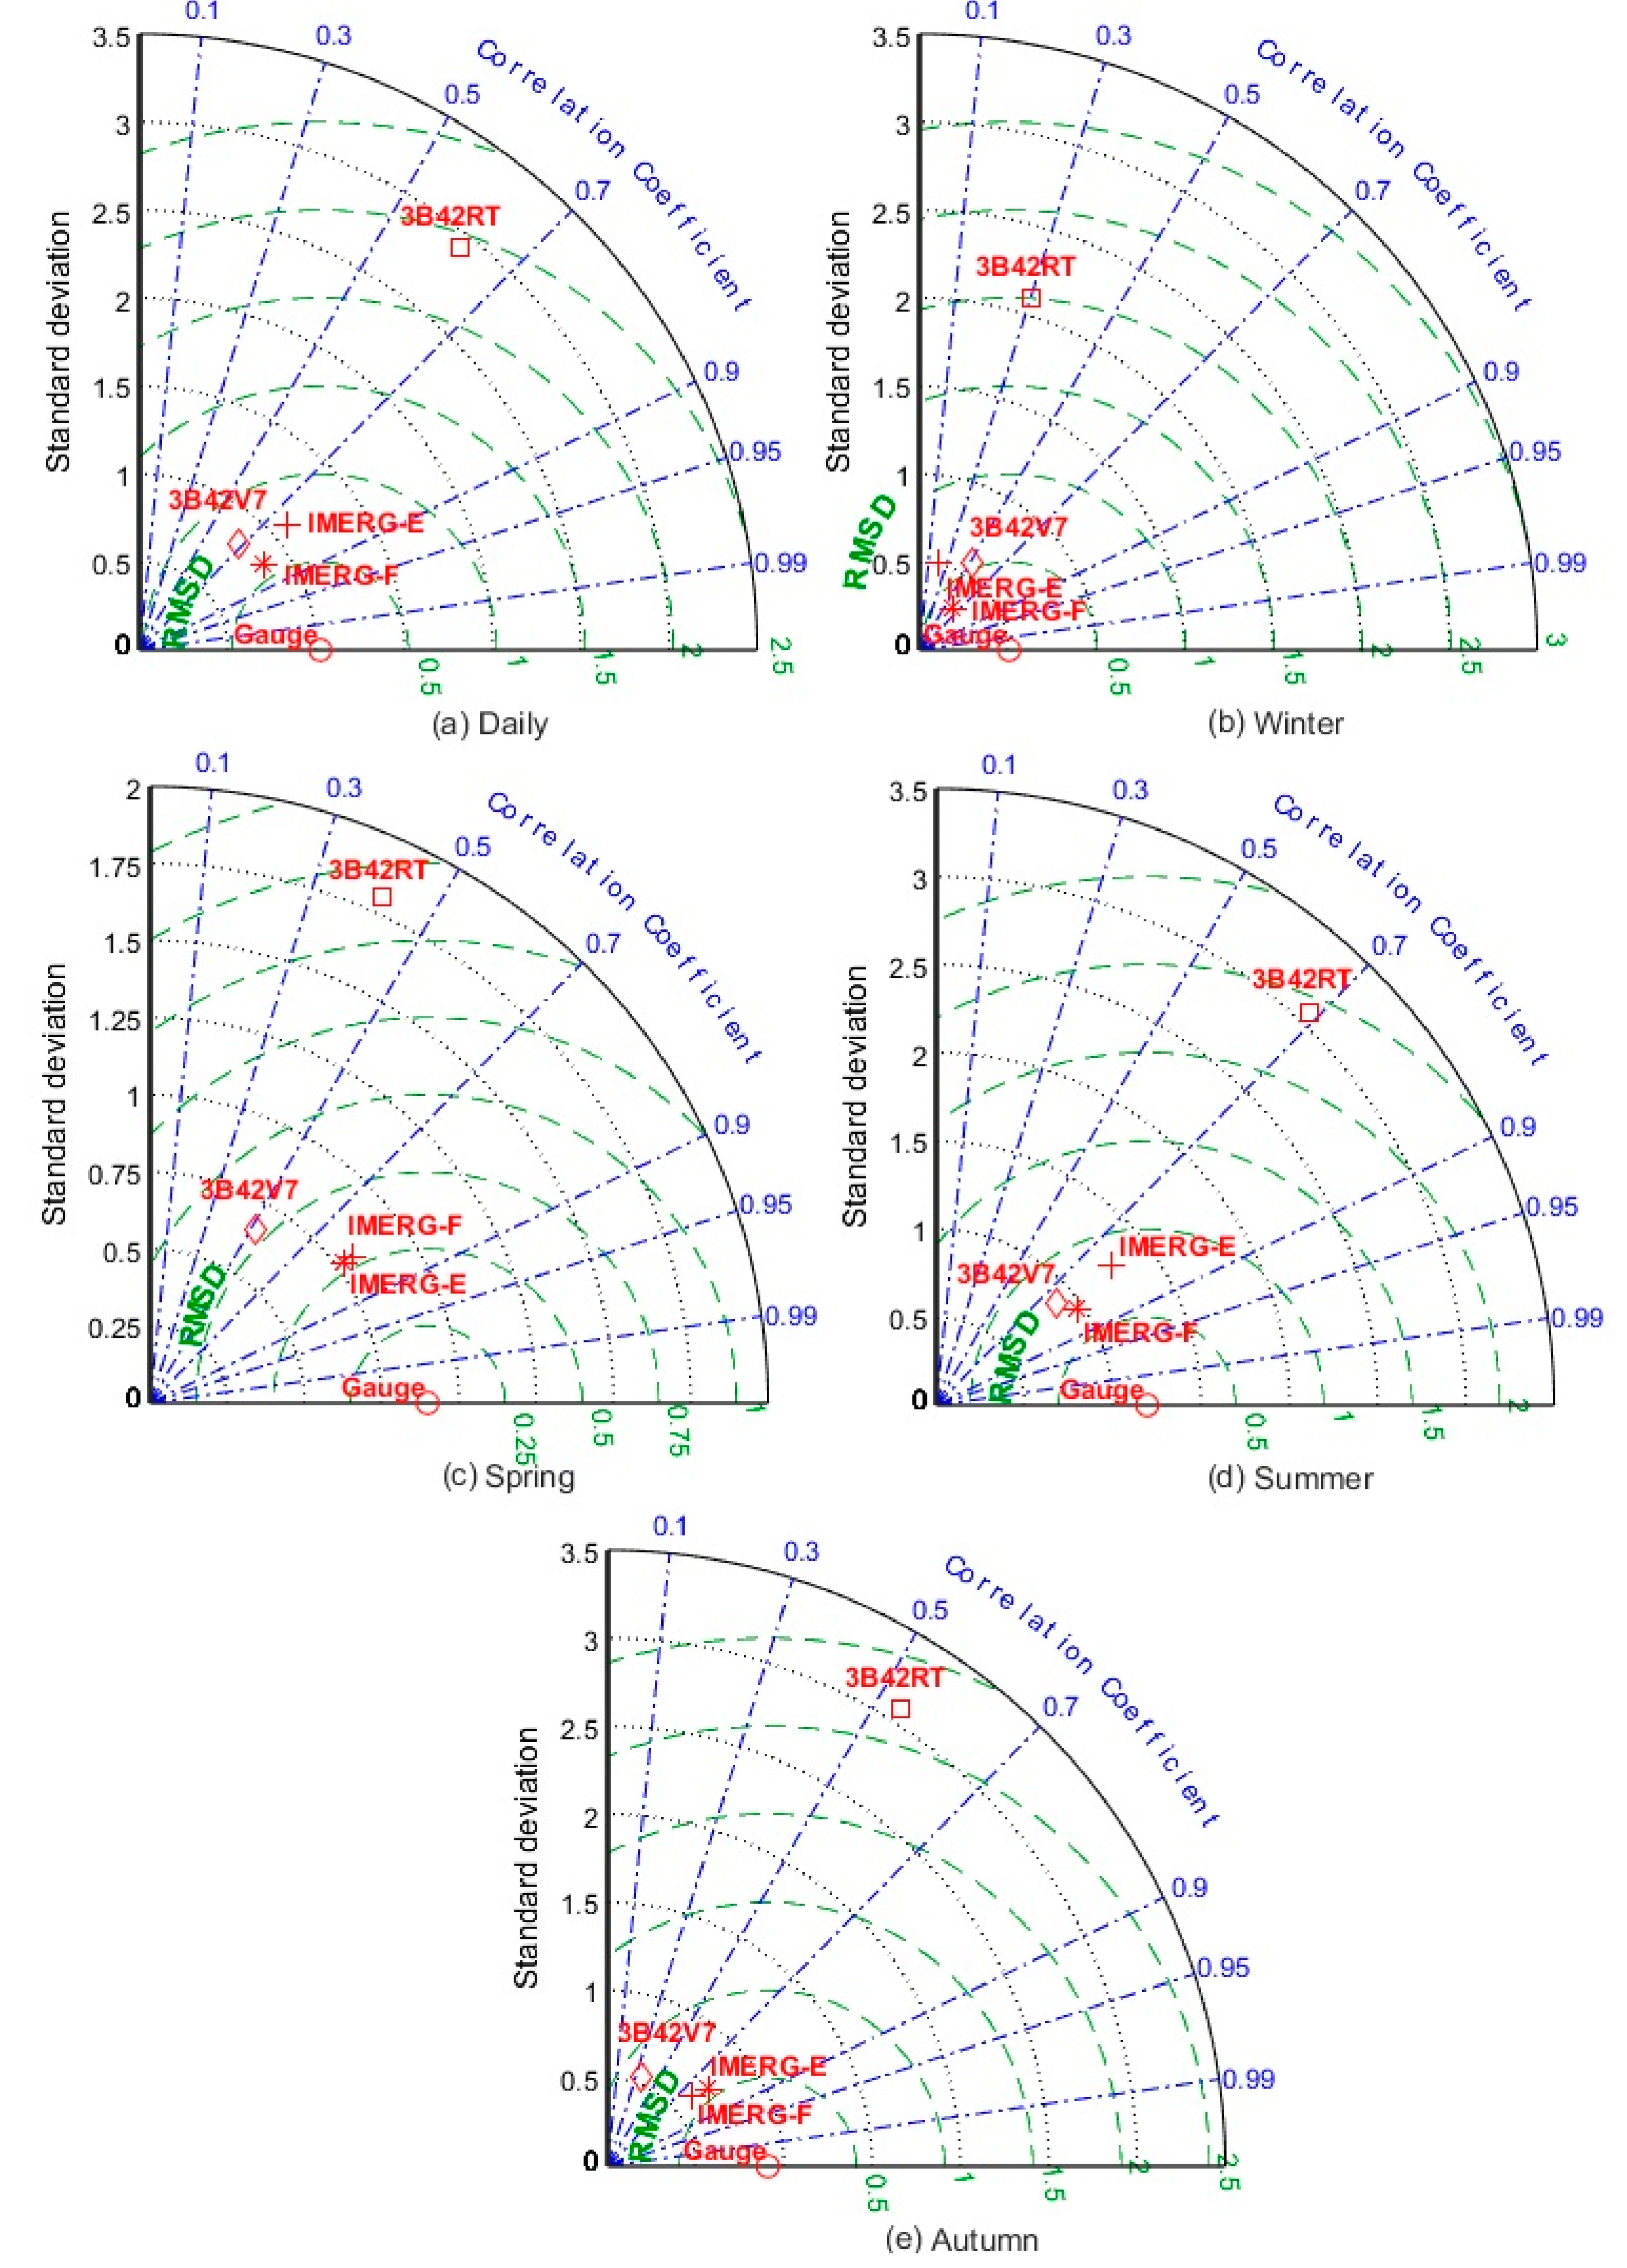
The performance of the daily precipitation estimates from the SPPs was assessed with reference to the gauge-based observations for the period of April 2014 to October 2017. For each day, we estimated the domain-average precipitation from the reference gauges and the satellite-based products. The degree of correspondence between the reference and satellite-based daily precipitation datasets was quantified in terms of the standard deviation (SD), the correlation coefficient (CC), and the root mean square error (RMSE). We used the Taylor Diagram to illustrate the mutual relationship between the computed SD, CC, and RMSE. Previously, various researchers have used this diagram to demonstrate the performance of satellite precipitation products [4]. The Taylor Diagrams are actually fan-shaped mathematical diagrams which are designed to graphically demonstrate the summary of the relative skills of different retrieval products. It is composed of radical coordinates, angular coordinates, and concentric semi-circles that denote the SD, CC, and RMSE, respectively. In Taylor Diagram, if the output of a product is closer to the reference point then that product is regarded as the better one. Figure 4 represents the relative skills of GPM and TRMM precipitation products with reference to the gauge-based datasets on daily and seasonal scales. On all temporal scales, the overall performance of both IMERG products was better than that of TMPA products, as witnessed by their relatively closer position to the gauge point. Both IMERG products showed higher CC and lower RMSD. The post real-time product of TRMM (3B42V7) performed better than its near real-time product (3B42RT). All of the SPPs showed good correlation with the gauge-based observations in the summer season (CC = 0.83, 0.78, 0.76, and 0.69 for IMERG-F, IMERG-E, 3B42V7, and 3B42RT, respectively). The performance of the 3B42RT product was very poor on all time scales, as witnessed by higher values of SD and RMSE (Figure 4a–e).
The summary of overall error characteristics of the daily precipitation estimates derived from the IMERG-E, IMERG-F, 3B42V7, and 3B42RT products with seasonal insight over the entire study domain was presented in Table 1. Daily precipitation estimates derived from SPPs during the entire investigation period showed lower values of RMSE (ranged from 0.58 mm day−1 to 2.81 mm day−1). With reference to the daily gauge-based data during the entire study period (April 2014 to October 2017), the IMERG-F and 3B42V7 products were nearly unbiased and showed slight overestimation (4.98%) and underestimation (−1.71%), respectively. Both near real-time products (IMERG-E and 3B42RT) were positively biased with the gauge-based observations. The IMERG-E showed 31.65% overestimation of daily precipitation amount, whereas 3B42RT showed significant overestimation (238.41%) compared with the observed precipitation. All of the SPPs were well trained to capture the occurrence of precipitation events. Interestingly, the near real-time products of GPM (IMERG-E) and TRMM (3B42RT) showed the higher probability of detection of daily precipitation events compared to their post real-time products (IMERG-F and 3B42V7). 3B42RT showed the highest POD (POD = 0.87), followed by IMERG-E (POD = 0.78), IMERG-F (POD = 0.74), and 3B42V7 (POD = 0.66). Generally, IMERG-F established a better performance in terms of correct detection of precipitation events with low FAR (0.35) and higher CSI (0.53), followed by 3B42V7 (FAR = 0.41 and CSI = 0.45). The performance of the near real-time product of GPM (IMERG-E) was better than that of TRMM product (3B42RT), as witnessed by lower FAR (0.45) and higher CSI (0.48) of IMERG-E compared with the FAR (0.68) and CSI (0.30) of 3B42RT.
The performance of all SPPs was also assessed on seasonal basis. Considerable discrepancies in the accuracies of the SPPs were found in different seasons. In case of comparison of post real-time products, IMERG-F was able to maintain better performance in all seasons compared with the 3B42V7 (Table 1). The IMERG-F showed underestimation (−10.6%) of precipitation amount in the winter season, while slight overestimations in the summer (8.13%) and autumn (4.76%) seasons. IMERG-F was totally unbiased with the gauge-based data in the spring season. Except for winter season, the performance of IMERG-F was within acceptable range on all temporal scales. The performance of 3B42V7 was best during the summer season, with high values of CC (0.76), POD (0.80), and CSI (0.54); and lower values of BIAS (0.09 mm day−1), rBIAS (9.86%), RMSE (0.78 mm day−1), and FAR (0.37). On all temporal scales, the overall performance of IMERG-E was better than that of 3B42RT. However, IMERG-E still showed considerable bias on all temporal scales, albeit bias was lower than that of 3B42RT.

3.3. Spatial Distribution of Evaluation Indices

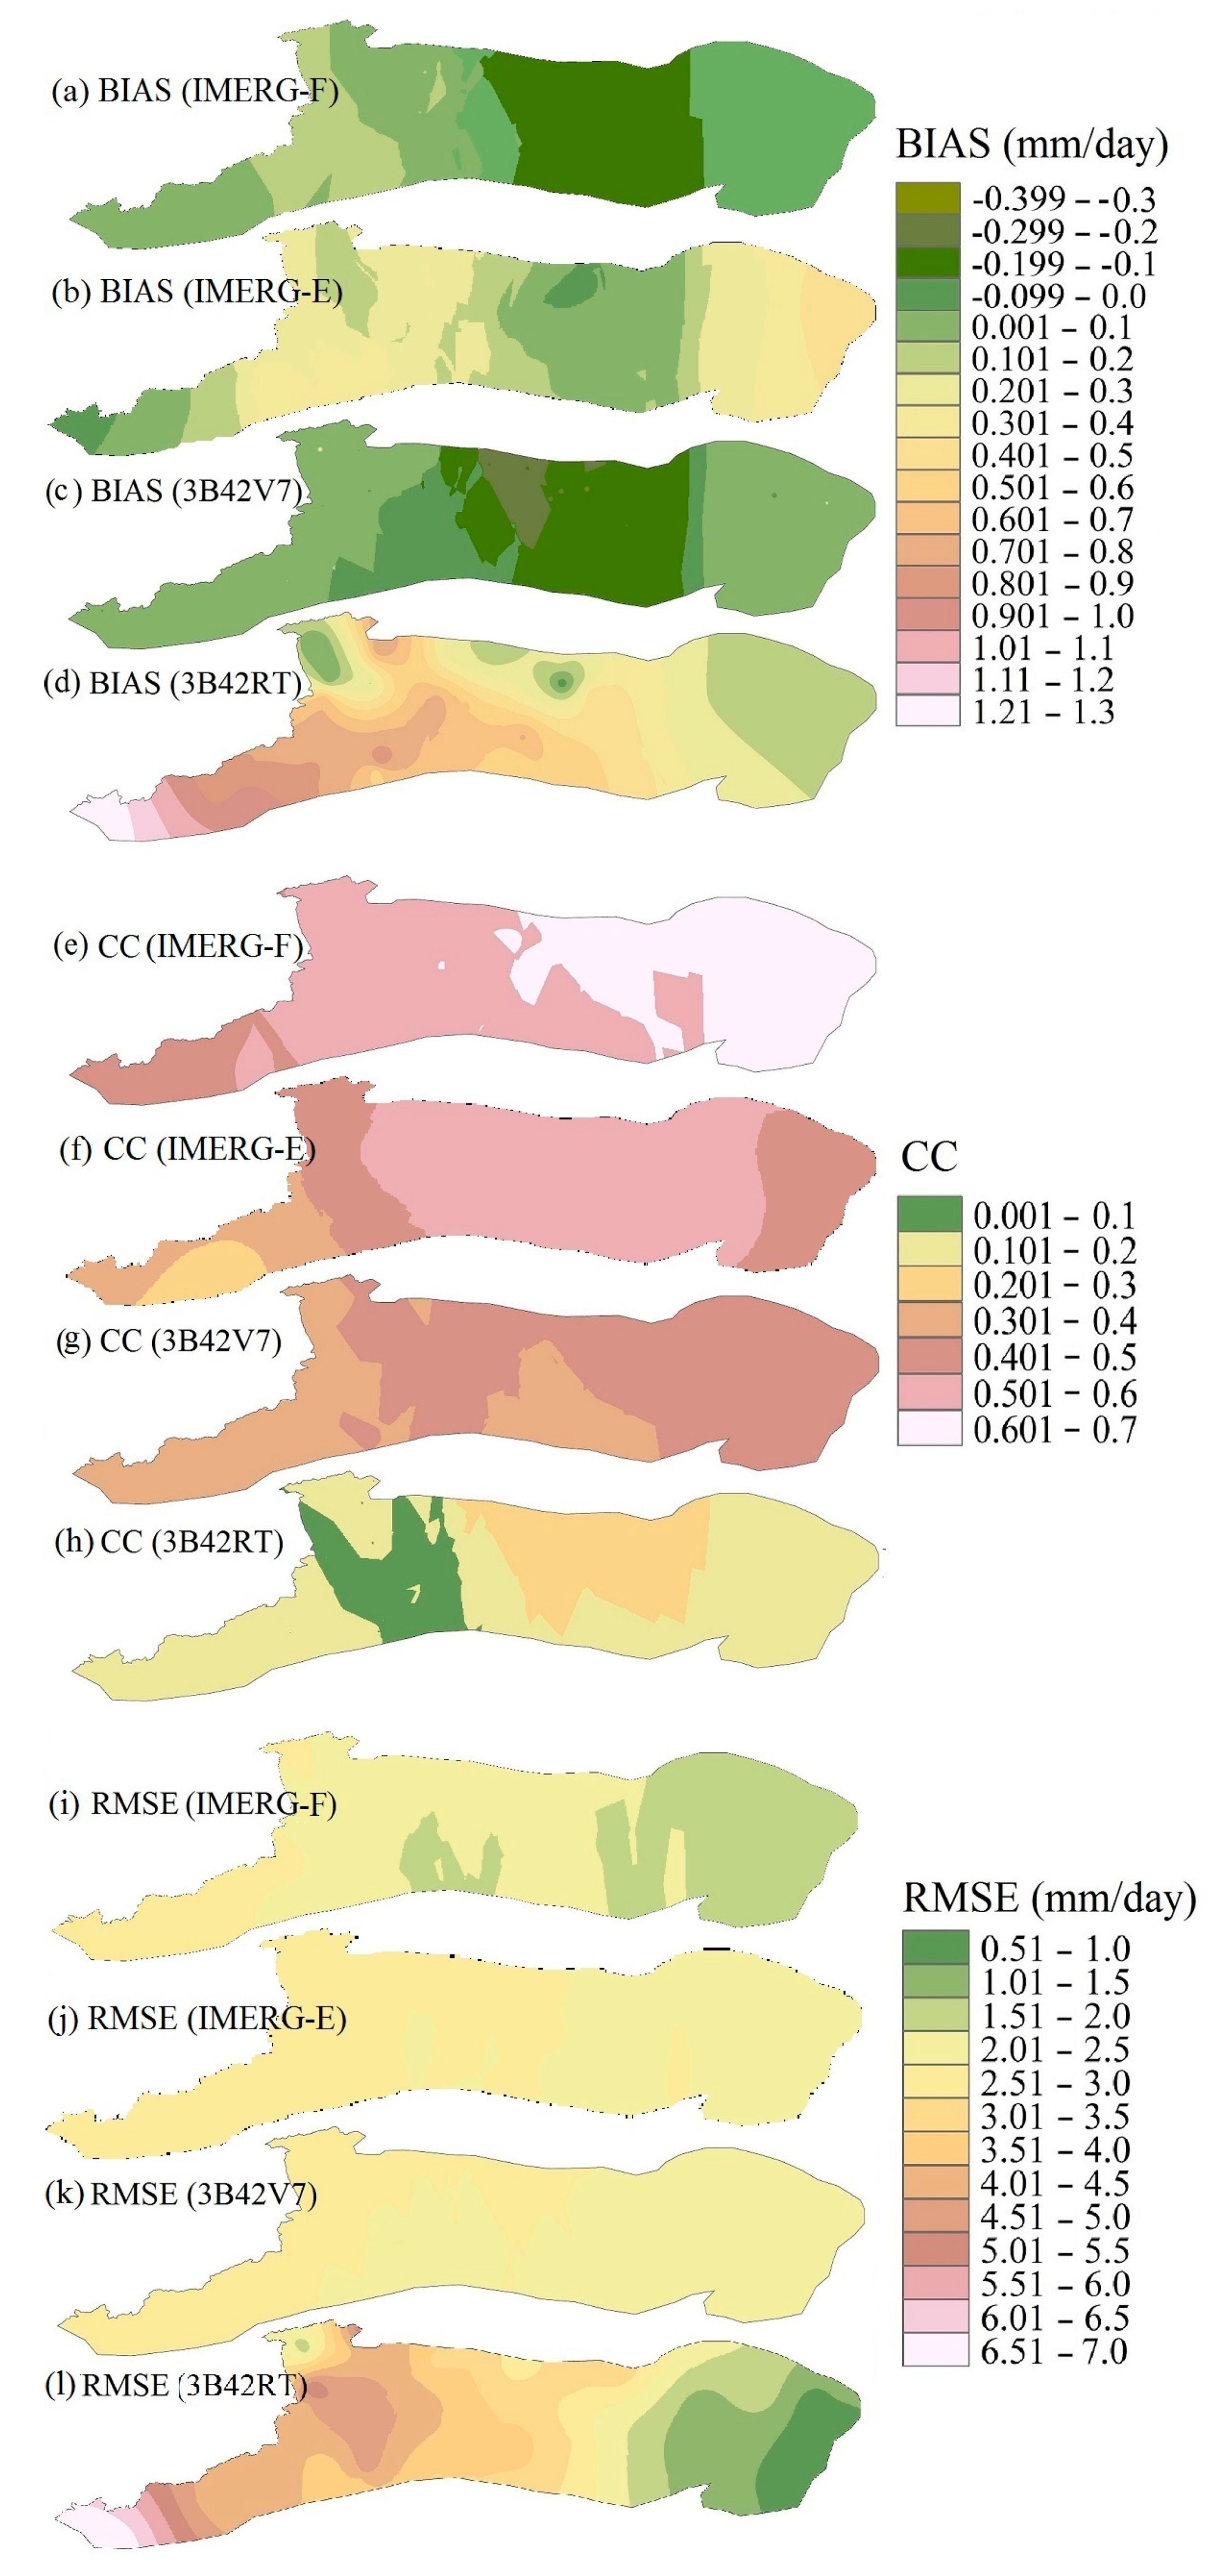
The spatial distribution of evaluation indices of SPPs is very important for many hydrometeorological applications, for instance, flood/drought forecasting, hydrological modeling, and data assimilation [62,63]. Figure 5 illustrates the spatial distribution of evaluation indices for daily precipitation estimates from the selected SPPs over the entire study domain. Indeed all evaluation measures (BIAS, CC, and RMSE) showed substantial spatial variability in the study domain. Generally, the precipitation amounts were underestimated by both post real-time products (IMERG-F and 3B42V7) in the middle parts of the Tianshan Mountains, as indicated by negative values of BIAS in Figure 5a,c. Overall, precipitation amounts were overestimated by IMERG-E and 3B42RT products, as showed by positive values of BIAS over the entire study domain in Figure 5b,d. The overestimation of precipitation amount was more evident in the case of 3B42RT products as compared to the IMERG-E. The IMERG-E and 3B42RT products showed higher values of CC in the middle of the study domain (Figure 5f,h), whereas IMERG-F and 3B42V7 products exhibited an increasing trend of CC from the west to east direction (Figure 5e,g). It indicated that the precipitation estimates from the post real-time products were more consistent with the gauge-based data in the relatively lower altitudes where IMERG-F showed the best correlation and 3B42V7 showed good correlation with the gauge-based data.
The spatial patterns of RMSE for the IMERG-F and 3B42RT were similar with those for the BIAS of both products, whereas IMERG-E and 3B42V7 products showed minimum variation in the RMSE (ranged from 2.00 to 3.00 mm/day) over the entire study domain. Generally, all SPPs showed an increasing trend of RMSE from the east to the west direction which reflects the fact that SPPs were less accurate to capture the accurate amounts of precipitation over the high altitudes, as witnessed by higher values of RMSE over the high altitudes (western parts of the study domain). Spatial patterns of the evaluation indices revealed that the overall performance of the IMERG-F precipitation product was better than other products.

3.4. Annual and Monthly Evaluation

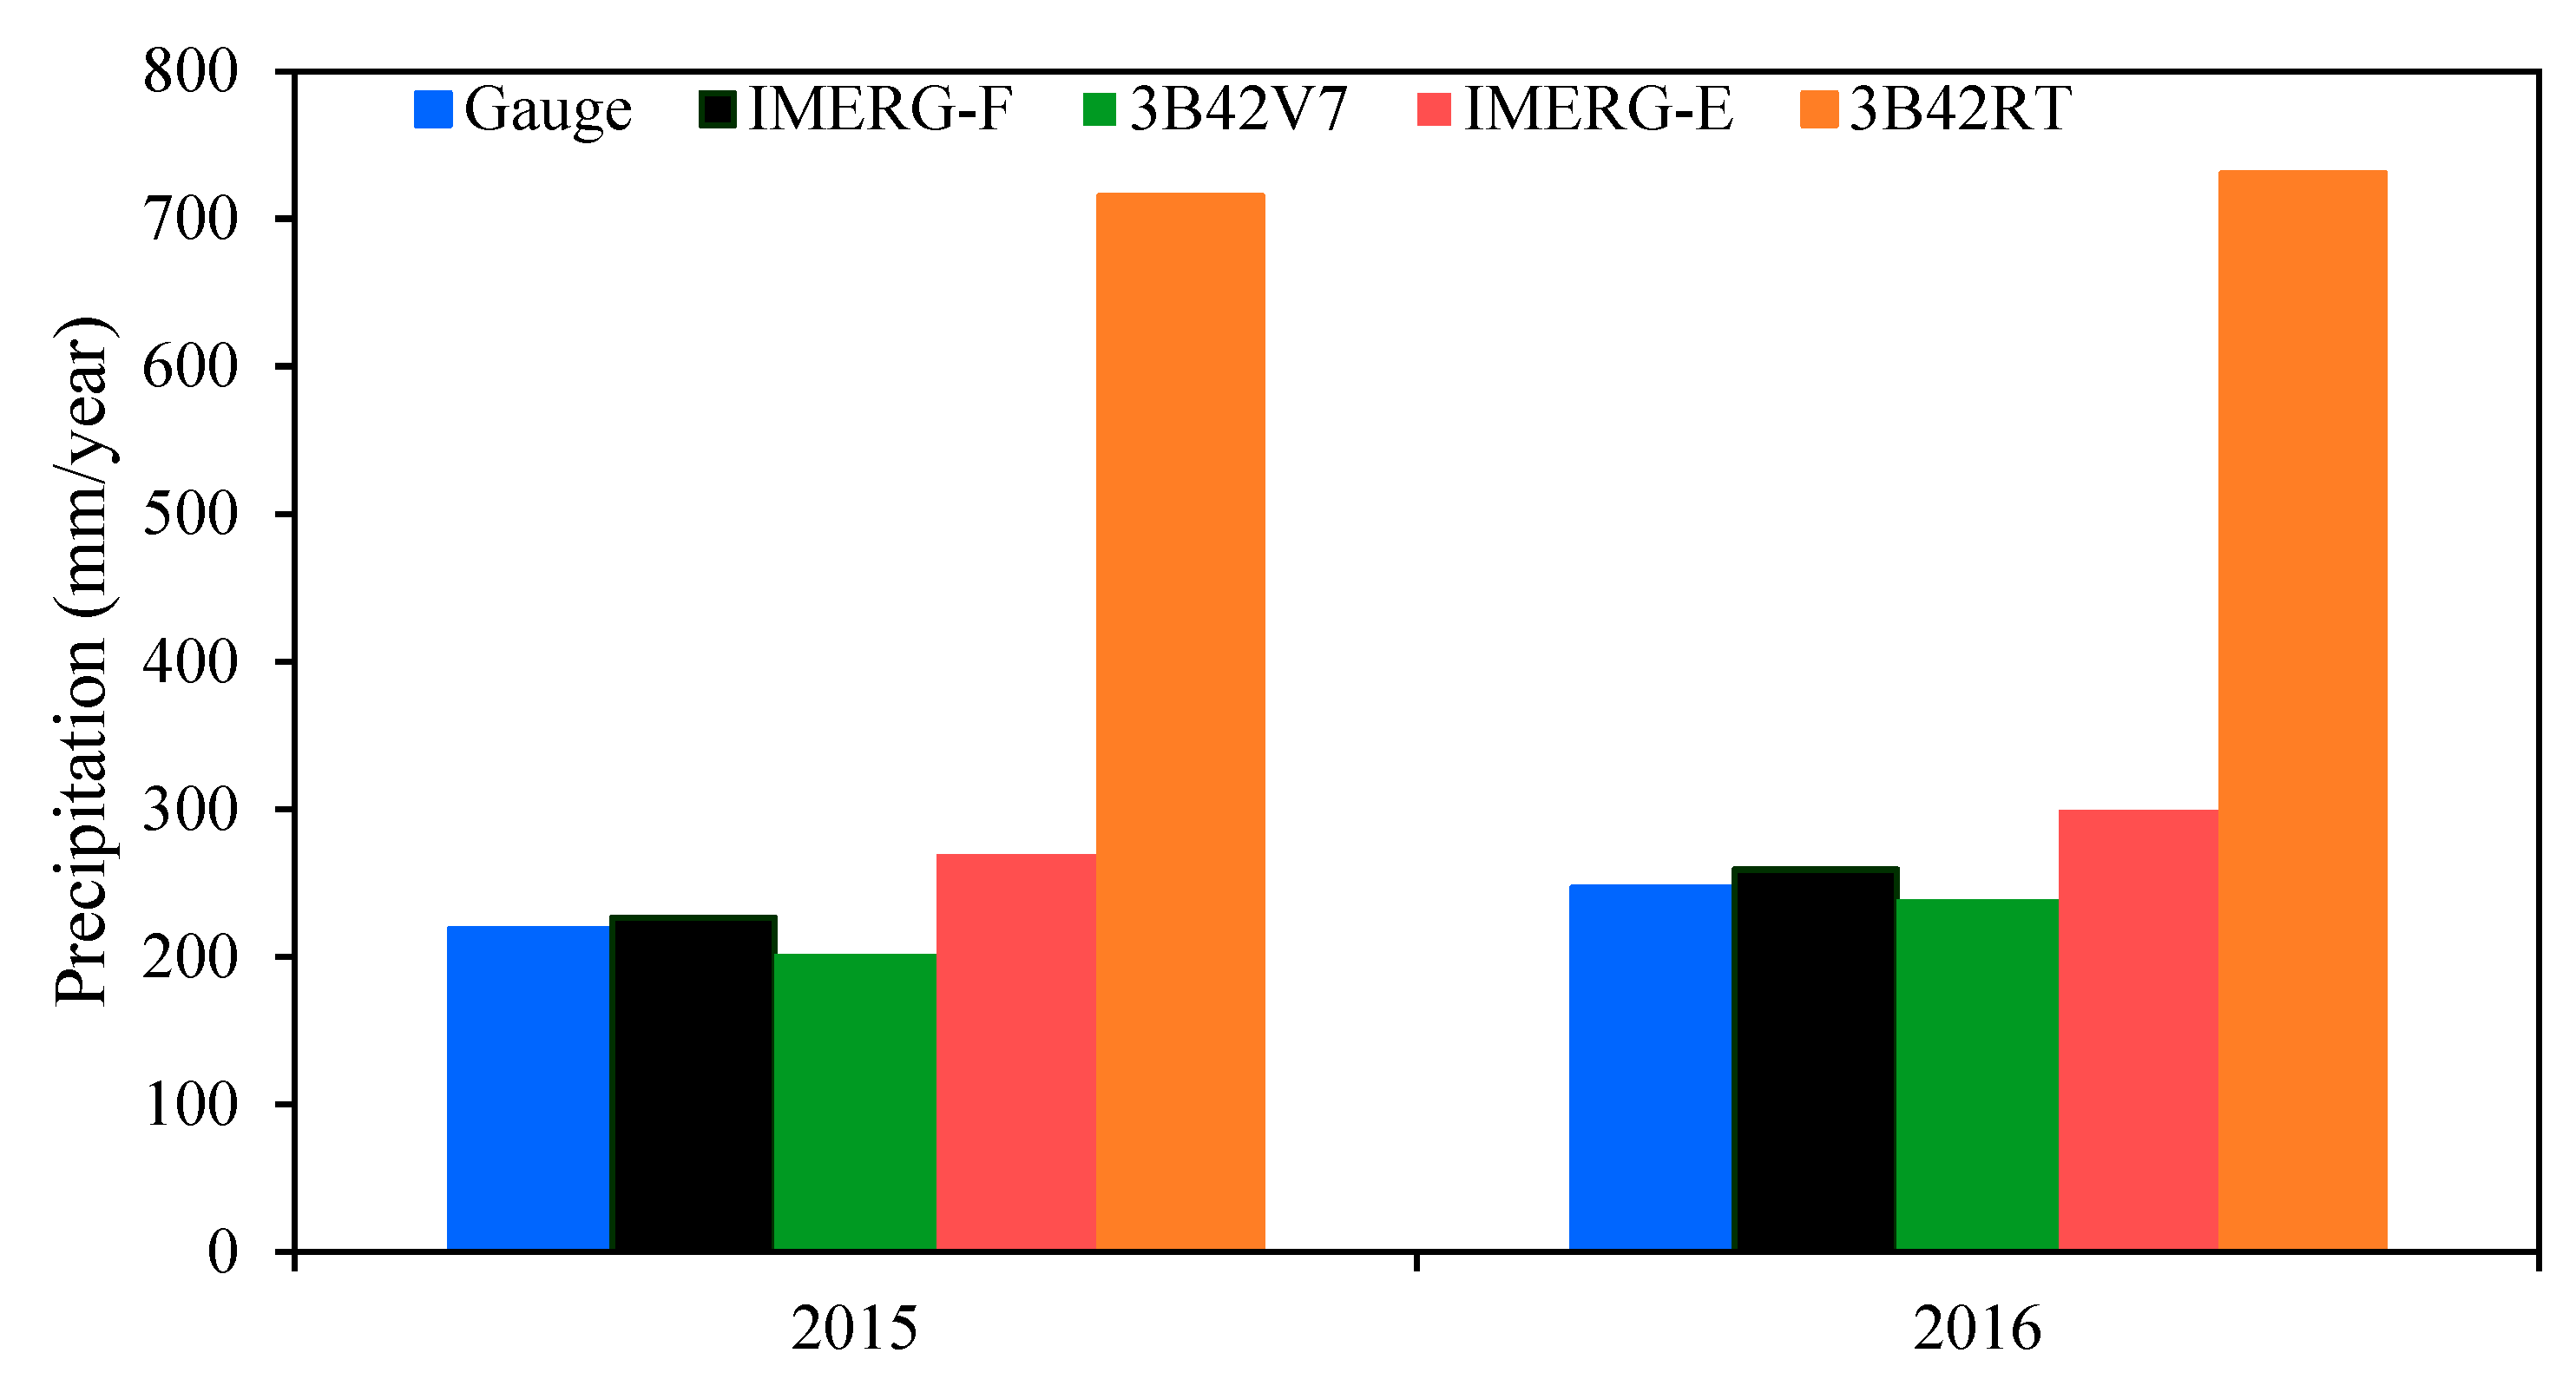
Investigation of the performance of IMERG-E, IMERG-F, 3B42V7, and 3B42RT products on an annual scale was based on the accumulated precipitation amounts of 2015 and 2016. The average annual precipitation over the Tianshan Mountains was 233 mm, based on the records of 2015 and 2016. Figure 6 illustrates the comparison of gauge-based annual observations with the SPPs estimates. In both years, both post real-time products (IMERG-F, and 3B42V7) were able to accurately represent the observed annual precipitation, although both of them showed slight overestimation (4.3%) and underestimation (−5.4%) of average annual precipitation, respectively. The average annual precipitation amount was considerably overestimated by IMERG-E and 3B42RT products (31.4% and 214.2%, respectively). This finding exhibits a significant discrepancy in the estimation of average annual precipitation amount by near real-time and post real-time SPPs over the Tianshan Mountains. The post real-time products showed significant improvements in terms of BIAS adjustment. Comparatively, the performance of the near real-time product of GPM to represent the annual precipitation amount was much better than that of the near real-time product TRMM.
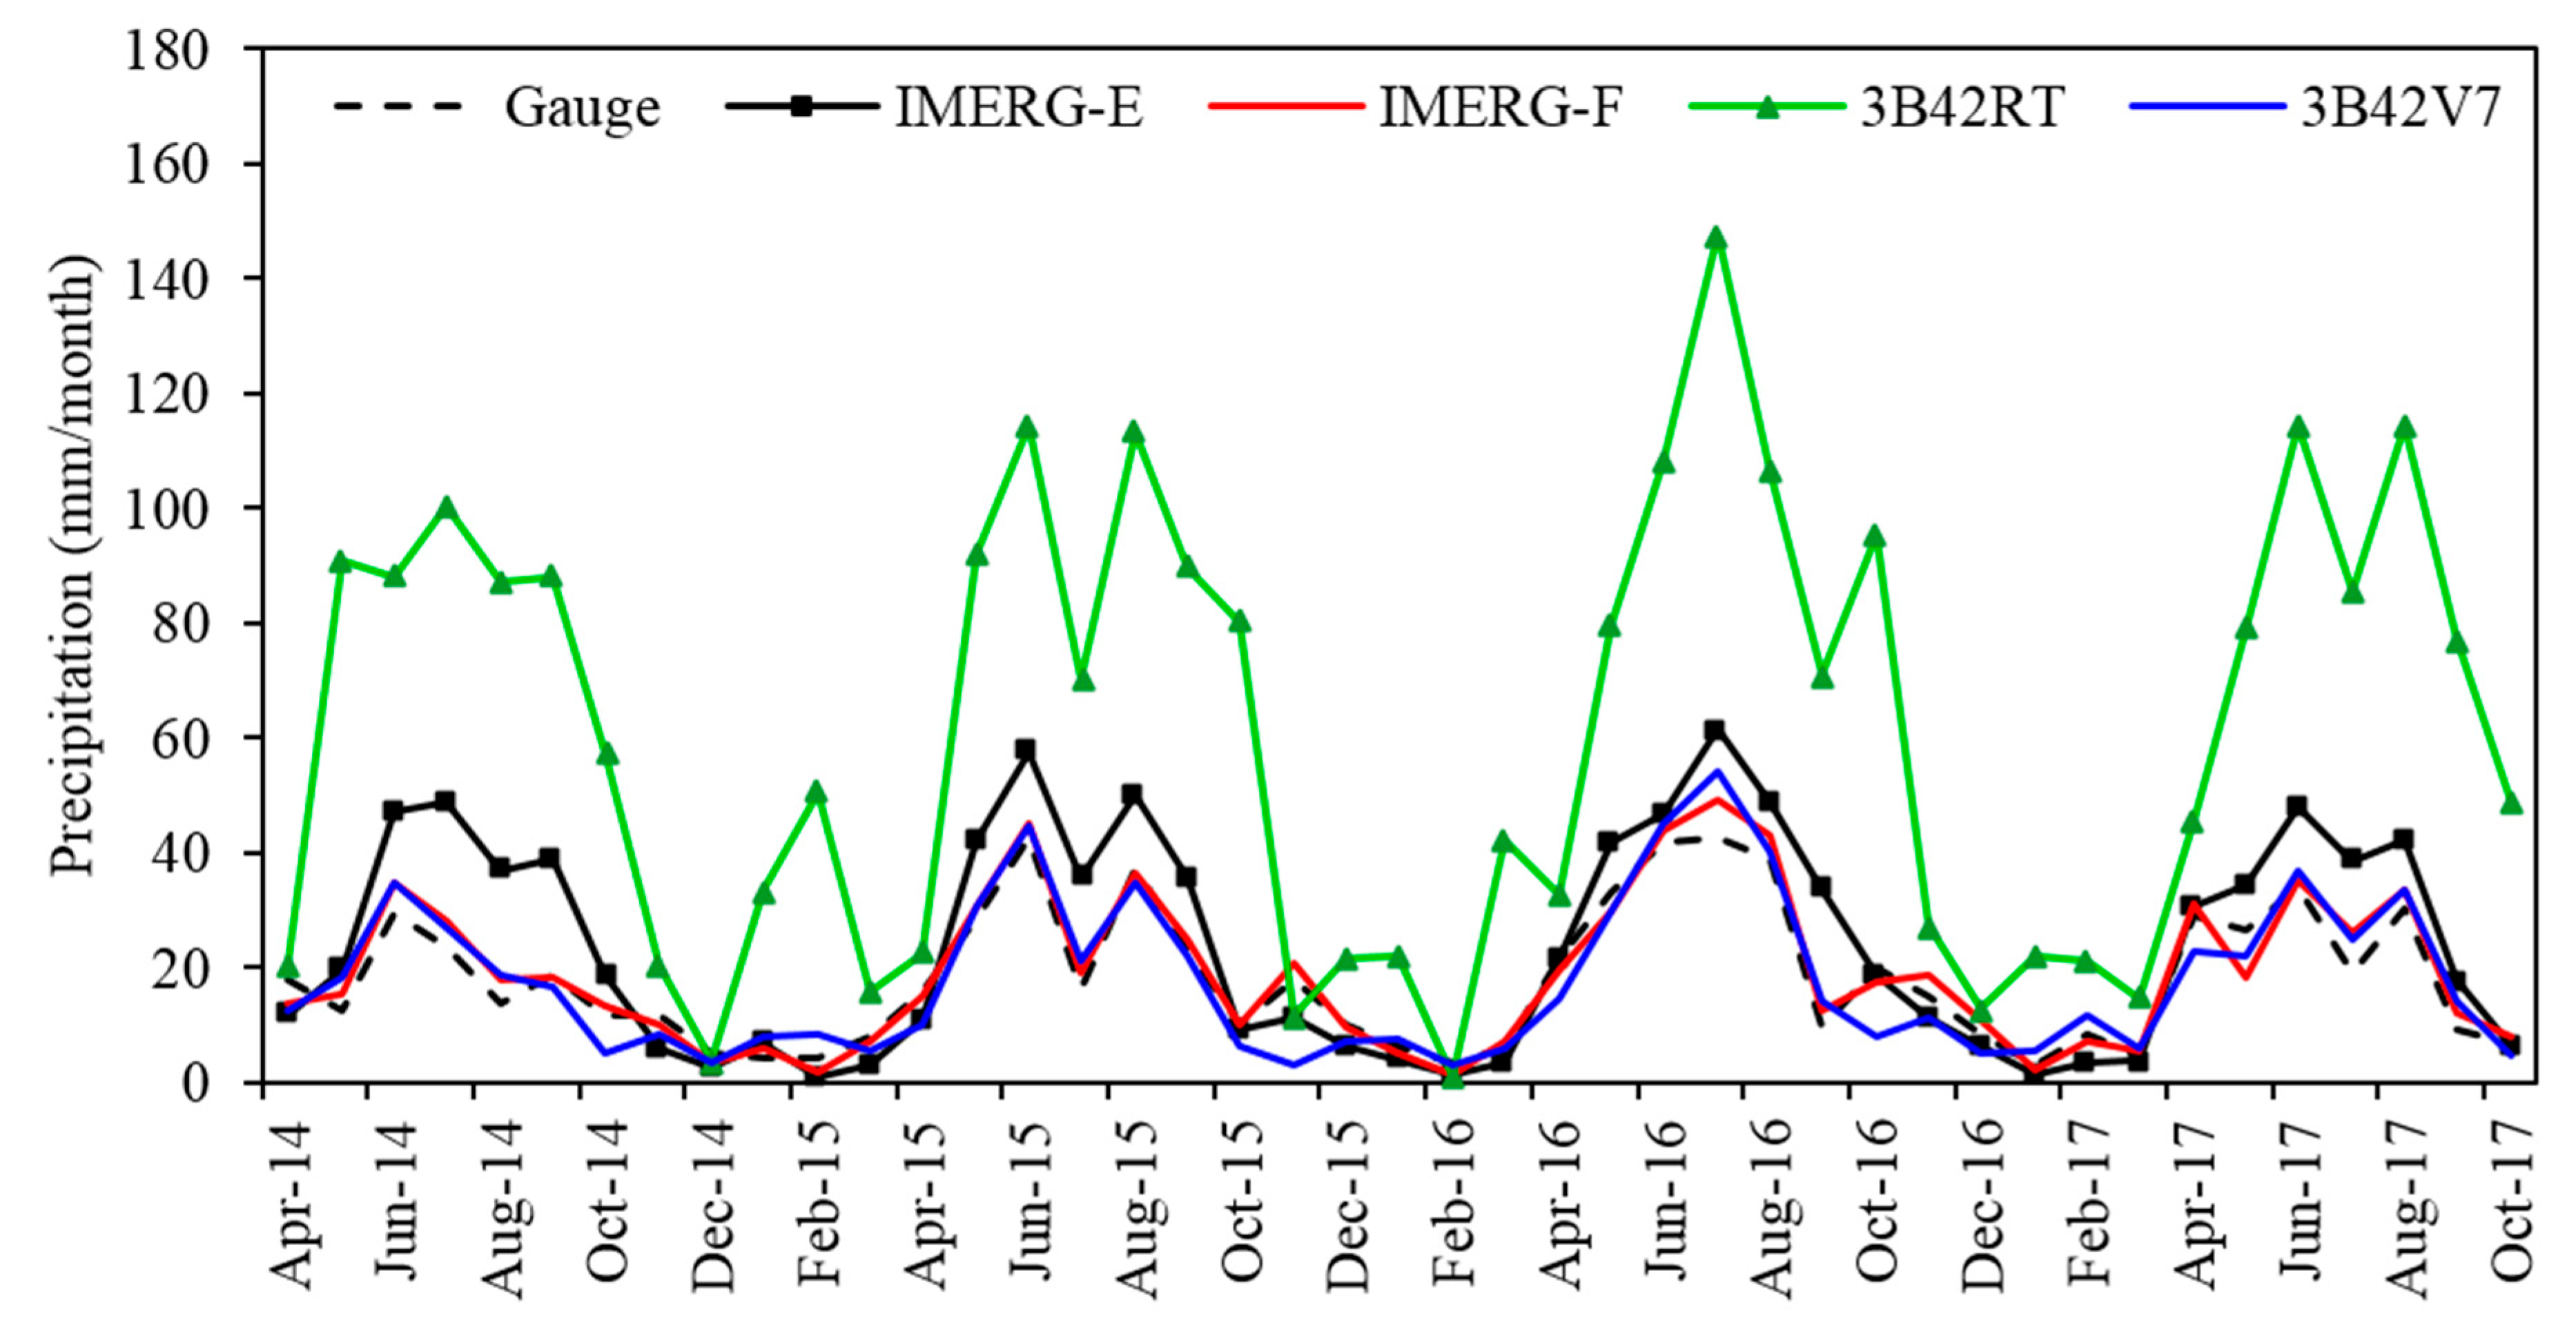
Figure 7 displays the comparisons of distribution of accumulated monthly precipitation amounts derived from the in situ rain gauges and four SPPs (IMERG-E, IMERG-F, 3B42V7, and 3B42RT) during entire investigation period (April 2014 to October 2017). The IMERG-F product exhibited the best performance to replicate the temporal variation of monthly precipitation over the study domain, followed by the 3B42V7 and IMERG-E products. Generally, the 3B42RT product was also able, to some extent, to track the pattern of monthly variation of precipitation; however, it showed significant overestimation of precipitation amounts during the entire study period. The precipitation estimates derived from the rain gauges and SPPs exhibited higher precipitation amounts in June. The monthly precipitation estimates from IMERG-F, 3B42V7, and IMERG-E products showed the best consistency (CC ≥ 0.89) with the gauge-based monthly observations (Table 2). The performance of the monthly precipitation estimates from IMERG-F and 3B42V7 products were comparable, with slightly better performance of the IMERG-F as witnessed by the smallest value of RMSE (3.05 mm/month) and highest value of CC (0.98). The performance of monthly precipitation estimates from the IMERG-E product was unreliable because of considerable overestimation (31.41%) of precipitation amount. Despite the fact that the monthly precipitation estimates derived from the 3B42RT product showed good correlation coefficients (CC = 0.77) with the gauge-based monthly data, its performance was unacceptable because of significant overestimation of the monthly precipitation amount (rBias = 238.41%).

3.5. Precision to Detect Different Precipitation Intensities

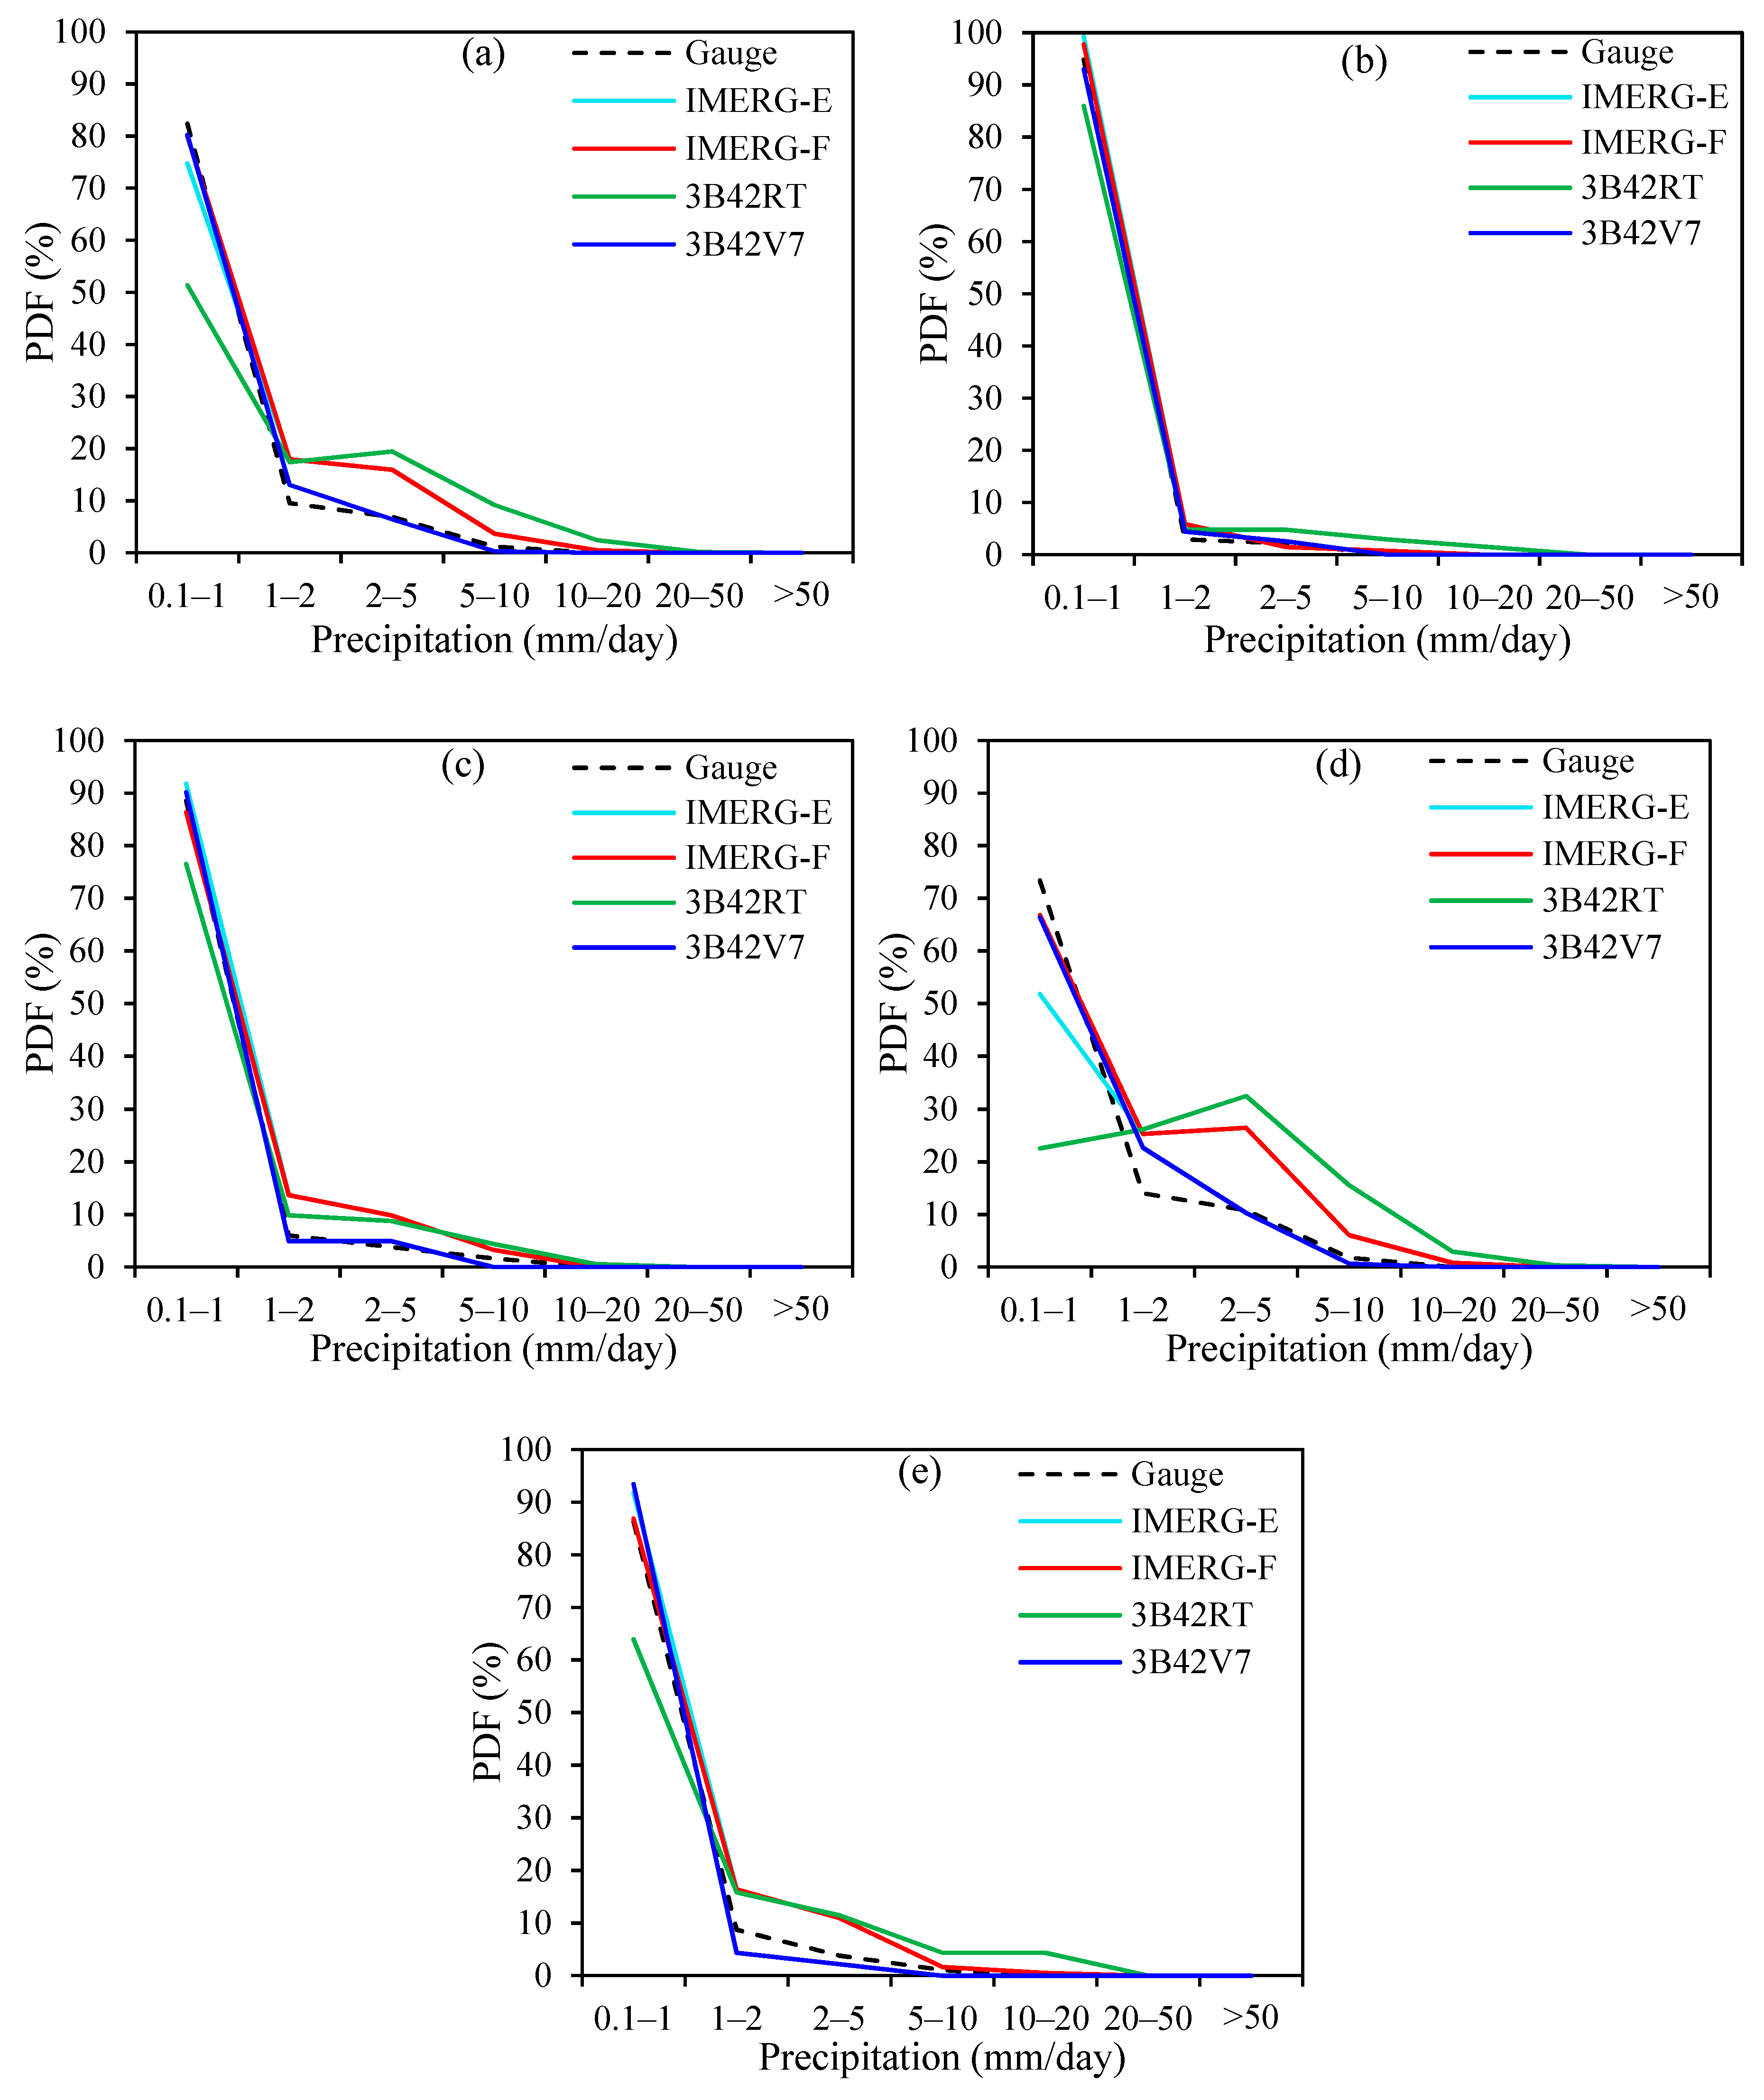
Figure 8 shows the distribution of different frequencies of daily precipitation estimates from gauges and SPPs in the Tianshan Mountains during the entire study duration (April 2014 to October 2017). It was found that the frequency of the low intensity (≤1 mm day−1) precipitation events was very high in the study domain. During the entire study period, about 82.4% of total precipitation events recorded by the in situ rain gauges were categorized as low-intensity events (Figure 8a). Only 17.6% of events were categorized as moderate to heavy precipitation events (ranges from >1 mm day−1 to <20 mm day−1). Generally, the performance of both post real-time products (IMERG-F and 3B42V7) to represent the daily light precipitation events were comparable. Both of them performed well to capture the light precipitation events (<1 mm/day). In case of near real-time products, IMERG-E performed better than 3B42RT. 3B42RT product showed the worst performance in terms of precision to detect the precipitation events at different intensities. The proportions of daily light precipitation events captured by the 3B42V7, IMERG-F, and IMERG-E products were 80.2%, 79.9%, and 74.7%, respectively. The 3B42RT product showed poor performance to capture the low-intensity precipitation events on all temporal scales. It showed considerable (−37.6%) underestimation of daily light intensity precipitation events. IMERG-E, IMERG-F, and 3B42RT products were less skillful to represent the moderate to heavy daily precipitation events, as witnessed by considerable overestimation of moderate to heavy precipitation events by these products. Although IMERG-F performed better than IMERG-E to capture the light precipitation events, the improvement from IMERG-E to IMERG-F in terms of precision to capture moderate to heavy precipitation events was not evident on all temporal scales, as indicated by Figure 8a–e.
Comparatively, all of the SPPs showed the best performance to capture the precipitation events in the winter season (Figure 8b). In all other seasons, 3B42V7 showed relatively best performance to capture the occurrence of precipitation events at different intensities (Figure 8c–e), whereas IMERG-E, IMERG-F, and 3B42RT products tend to overestimate the moderate to heavy precipitation events (Figure 8c–e).

4. Discussion

Some of the recent studies have reported the performance of the precipitation estimates from the V05 IMERG-E and IMERG-F products in different regions of the world [14,23,24,45,46,50,64]. Findings of these studies have advocated that the performance of IMERG products in depicting accurate amounts of precipitation is highly dependent on the regional topography and climatology. For instance, Palomino-Ángel et al. [42] assessed the performance of IMERG-F in northwestern South America and found that IMERG-F overestimated the precipitation in high altitude areas with low precipitation, whereas underestimated the precipitation magnitudes in relatively low altitudes areas with high precipitation. Huang et al. [38] compared the performance of IMERG-E and IMERG-F products during the extreme precipitation events over the southern parts of China and concluded that precipitation estimates from IMERG-F were more accurate than estimates from IMERG-E. Salles et al. [14] investigated the accuracies of IMERG-F, GSMaP, and 3B42V7 products in a mid-altitude region of Brazil and found that the accuracy of satellite products was greatly influenced by seasonal transitions. They reported that the performance of all SPPs was poor during dry seasons as compared to the wet seasons.
In the present study, we analyzed the errors and uncertainties associated with the early and final runs of version 5 (V05) of GPM precipitation products (IMERG-E and IMERG-F, respectively) in the Tianshan Mountains and compared it with TRMM-based real and post real-time precipitation products (3B42RT and 3B42V7, respectively). The performance of the satellite products was evaluated on different temporal scales (daily, monthly, and annual) and seasonal effects on their precipitation estimates were also investigated during April 2014 to October 2017. It was found that the performance of the GPM products in terms of correlation (CC) and the probability of detection (POD) were improved compared to their predecessor TRMM-based real-time and post real-time products on daily to annual scales. This is consistent with the findings in different mountainous regions of the world, for instance, in Pakistan [11], China [40], Brazil [14] and Myanmar [41]. The improved CC and POD of GPM products compared to the TRMM products might be due to the improvements in the spatial and temporal sampling resolutions. The GPM-based product provides precipitation estimates with a time interval of 30 min with the ability to detect short duration events, whereas TRMM-based products are capable of providing estimates at three-hour time period [4]. Detection of precipitation after a shorter period of time is very useful in the retrieval of low precipitation events that are more frequent in the Tianshan Mountains. Because of relatively coarser temporal resolution, the TRMM products tend to miss some of the precipitation events which caused the relatively low CC and POD.
The results of all other evaluation indices (RMSE, BIAS, rBias, FAR, and CSI) showed the overall better performance of IMERG-F compared to its near real-time product (IMERG-E) and both TRMM products (3B42RT and 3B42V7). This finding revealed that the transition from the estimation of precipitation from the TRMM to that from GPM was successful for the Tianshan Mountains. Moreover, the reduction of significant overestimations of precipitation amounts by the near real-time products of GPM and TRMM revealed that the bias adjustment algorithms used in the post real-time products of both missions were reliable for this region. However, the discrepancies in the estimated amounts of precipitation by both GPM products were higher over the high altitudes, indicating that the IMERG runs were relatively less reliable than 3B42V7 over the high altitude of the Tianshan Mountains. These findings are consistent with the performance of precipitation estimates from the GPM and TRMM products in the arid and mountainous region of Hexi River basin of China [40] and semi-arid mountainous region of Pakistan [4].

5. Conclusions

This paper presented a detailed and preliminary analysis of the quality and error characteristics of GPM and TRMM satellite precipitation products over the Tianshan Mountains in northwest China. The performance of IMERG (V05) Early-run and Final-run products and two TRMM (V07) products (3B42RT and 3B42V7) was evaluated at different temporal scales (ranging from daily to annual). The high-quality precipitation observations from 39 in situ gauging stations were used as reference from April 2014 to October 2017. The main findings of the present study are summarized as follows:
  • Both GPM products showed superiority over the TRMM products in terms of CC with the gauge-based data. The IMERG-F, IMERG-E, and 3B42V7 products were able to represent the spatiotemporal variations of precipitation over the study domain, whereas 3B42RT product was less skillful to capture the spatiotemporal variations of precipitation.
  • The IMERG-F and 3B42V7 products were well trained to accurately represent the daily observed precipitation over the study domain. Both of these products showed negligible relative bias compare with the gauge-based data. The estimated relative biases for IMERG-F and 3B42V7 products were 4.98% and −1.71%, respectively. The IMERG-E showed considerable overestimation (31.65%) of daily precipitation. The 3B42RT was failed to accurately represent the precipitation amount over the Tianshan Mountains, as witnessed by the significant overestimation of precipitation amount (rBias = 238.41%).
  • On seasonal basis, performance of near real-time and post real-time products of GPM (IMERG-E and IMERG-F, respectively) was better than the performance of their corresponding near real-time and post real-time products of TRMM (3B42RT and 3B42V7, respectively). Comparatively, the overall performance of the IMERG-F was better during all seasons with the best performance in the spring season, followed by summer, autumn, and winter.
  • IMERG-F was more reliable to accurately represent the occurrence of daily precipitation events than all other SPPs, as indicated by its relatively higher value of critical success index (CSI = 0.53) and smaller value of false alarm ratio (FAR = 0.35). 3B42V7 performed better than 3B42RT. Although the probability of detection of 3B42RT (POD = 0.87) was higher than IMERG-E, IMERG-F, and 3B42V7 products, it was failed to represent the observed precipitation over the Tianshan Mountains, as witnessed by its highest value of FAR (0.68) and smallest value of CSI (0.30).
  • Performance of the IMERG-F and 3B42V7 products to capture the occurrence of light precipitation events (82.4% of total precipitation over the Tianshan Mountains) was better than both near real-time products. The proportions of light precipitation events captured by the IMERG-F and 3B42V7 products were 79.9% and 80.2%, respectively. Hence, both of these products are reliable to be used for understanding the characteristics of light precipitation events over the study area. IMERG-E and IMERG-F products were less accurate to represent the moderate to heavy precipitation events. 3B42RT showed the worst performance to represent the precipitation occurrence at different intensities. It showed significant underestimation of light precipitation events and overestimation of moderate to heavy precipitation events. Comparatively, 3B42V7 performed better than other products to detect the occurrence of precipitation events at different intensities.
Findings of this study revealed that the IMERG (V05) Final run product was able to replace the TRMM products. Despite of higher CC of IMERG-E with the gauge-based observations, it was failed to accurately estimate the precipitation amounts. The performance of the near real-time product of TRMM (3B42RT) was worse on all temporal scales (daily to annual). The seasonality and low precipitation over the Tianshan Mountains directly influenced the accuracy of the IMERG-E, IMERG-F, and 3B42RT products. We recommend the application of precipitation amounts from IMERG-F products for related scientific applications on all temporal scales over the Tianshan Mountains; however, cautions should be considered while using precipitation estimates from this product during the winter season.

Author Contributions

Conceptualization, M.Y., Z.L. and M.N.A., Data acquisition, M.Y., M.N.A. and Y.G.; Funding acquisition, Z.L.; Formal analysis, M.Y. and M.N.A.; Investigation, M.Y. and M.N.A.; Methodology, M.Y., Z.L., M.N.A. and Y.G.; Visualization, M.Y. and M.N.A.; Writing-original draft, M.N.A.; Writing-review and editing, M.Y., Z.L., M.N.A. and Y.G.

Funding

This work was financially supported by the strategic Priority Research Program of Chinese Academy of Sciences (Class A) (XDA20060201), the Strategic Priority Research Program of Chinese Academy of Sciences (Class A) (XDA20020102), the National Natural Science Foundation of China (41761134093), the National Natural Science Foundation of China (41471058), the SKLCS funding (SKLCS-ZZ-2019), and the Innovative Research Group of the National Natural Sciences Foundation (41721091).

Acknowledgments

The authors would like to thank the China Meteorological Administration (CMA) and the National Aeronautics and Space Administration (NASA) for providing climatic data.

Conflicts of Interest

The authors declare no conflict of interest.

References

  1. Tapiador, F.J.; Turk, F.J.; Petersen, W.; Hou, A.Y.; García-Ortega, E.; Machado, L.A.T.; Angelis, C.F.; Salio, P.; Kidd, C.; Huffman, G.J.; de Castro, M. Global precipitation measurement: Methods, datasets and applications. Atmos. Res. 2012, 104–105, 70–97. [Google Scholar] [CrossRef]
  2. Guo, H.; Chen, S.; Bao, A.; Behrangi, A.; Hong, Y.; Ndayisaba, F.; Hu, J.; Stepanian, P.M. Early assessment of Integrated Multi-satellite Retrievals for Global Precipitation Measurement over China. Atmos. Res. 2016, 176–177, 121–133. [Google Scholar] [CrossRef]
  3. Tang, L.; Hossain, F. Investigating the similarity of satellite rainfall error metrics as a function of Köppen climate classification. Atmos. Res. 2012, 104–105, 182–192. [Google Scholar] [CrossRef]
  4. Anjum, M.N.; Ding, Y.; Shangguan, D.; Ahmad, I.; Ijaz, M.W.; Farid, H.U.; Yagoub, Y.E.; Zaman, M.; Adnan, M. Performance evaluation of latest integrated multi-satellite retrievals for Global Precipitation Measurement (IMERG) over the northern highlands of Pakistan. Atmos. Res. 2018, 205, 134–146. [Google Scholar] [CrossRef]
  5. Gebere, S.B.; Alamirew, T.; Merkel, B.J.; Melesse, A.M. Performance of high resolution satellite rainfall products over data scarce parts of eastern ethiopia. Remote Sens. 2015, 7, 11639–11663. [Google Scholar] [CrossRef]
  6. Iqbal, M.F.; Athar, H. Validation of satellite based precipitation over diverse topography of Pakistan. Atmos. Res. 2018, 201, 247–260. [Google Scholar] [CrossRef]
  7. Liu, Z. Comparison of versions 6 and 7 3-hourly TRMM multi-satellite precipitation analysis (TMPA) research products. Atmos. Res. 2015, 163, 91–101. [Google Scholar] [CrossRef] [Green Version]
  8. Chen, F.; Li, X. Evaluation of IMERG and TRMM 3B43 monthly precipitation products over mainland China. Remote Sens. 2016, 8, 1–18. [Google Scholar] [CrossRef]
  9. Tan, M.L.; Santo, H. Comparison of GPM IMERG, TMPA 3B42 and PERSIANN-CDR satellite precipitation products over Malaysia. Atmos. Res. 2018, 202, 63–76. [Google Scholar] [CrossRef]
  10. Mishra, Y.; Nakamura, T.; Babel, M.S.; Ninsawat, S.; Ochi, S. Impact of Climate Change onWater Resources of the Bheri River Basin, Nepal. Water 2018, 10, 1–21. [Google Scholar] [CrossRef]
  11. Satgé, F.; Hussain, Y.; Bonnet, M.P.; Hussain, B.M.; Martinez-Carvajal, H.; Akhter, G.; Uagoda, R. Benefits of the successive GPM based Satellite Precipitation Estimates IMERG-V03, -V04, -V05 and GSMaP-V06, -V07 over diverse geomorphic and meteorological regions of Pakistan. Remote Sens. 2018, 10. [Google Scholar] [CrossRef]
  12. Huffman, G.J.; Bolvin, D.T.; Nelkin, E.J.; Wolff, D.B.; Adler, R.F.; Gu, G.; Hong, Y.; Bowman, K.P.; Stocker, E.F. The TRMM Multisatellite Precipitation Analysis (TMPA): Quasi-Global, Multiyear, Combined-Sensor Precipitation Estimates at Fine Scales. J. Hydrometeorol. 2007, 8, 38–55. [Google Scholar] [CrossRef]
  13. Sungmin, O.; Foelsche, U.; Kirchengast, G.; Fuchsberger, J.; Tan, J.; Petersen, W.A. Evaluation of GPM IMERG Early, Late, and Final rainfall estimates using WegenerNet gauge data in southeastern Austria. Hydrol. Earth Syst. Sci. 2017, 21, 6559–6572. [Google Scholar] [CrossRef] [Green Version]
  14. Salles, L.; Satgé, F.; Roig, H.; Almeida, T.; Olivetti, D. Seasonal Effect on Spatial and Temporal Consistency of the New GPM-Based IMERG-v5 and GSMaP-v7 Seasonal Effect on Spatial and Temporal Consistency of the New GPM-Based IMERG-v5 and GSMaP-v7 Satellite Precipitation Estimates in Brazil’s Central of the New. Water 2019, 11, 668. [Google Scholar] [CrossRef]
  15. Sun, Q.; Miao, C.; Duan, Q.; Ashouri, H.; Sorooshian, S.; Hsu, K.L. A Review of Global Precipitation Data Sets: Data Sources, Estimation, and Intercomparisons. Rev. Geophys. 2018, 56, 79–107. [Google Scholar] [CrossRef] [Green Version]
  16. The Japan Aerospace Exploration Agency (JAXA). USER’ S GUIDE FOR Global Satellite Mapping of Precipitation Microwave-IR Combined Product (GSMaP_MVK), Gauge-Calibrated Rainfall Product (GSMaP_Gauge) Reanalysis Products (GSMaP_RNL), and Gauge-calibrated Reanalysis Product (GSMaP_Gauge_2017, 8); The Japan Aerospace Exploration Agency (JAXA): Tokyo, Japan, 2017.
  17. Joyce, R.J.; Janowiak, J.E.; Arkin, P.A.; Xie, P. CMORPH: A Method that Produces Global Precipitation Estimates from Passive Microwave and Infrared Data at High Spatial and Temporal Resolution. J. Hydrometeorol. 2004, 5, 487–503. [Google Scholar] [CrossRef]
  18. Soroosh, S.; Kuo-Lin, H.; Xiaogang, G.; Hoshin, V.G.; Bisher, I.; Braithwaite, D. Evaluation of PERSIANN System Satellite-Based Estimates of Tropical Rainfall. Bull. Am. Meteorol. Soc. 2000, 477, 2035–2045. [Google Scholar] [CrossRef]
  19. Casse, C.; Gosset, M.; Peugeot, C.; Pedinotti, V.; Boone, A.; Tanimoun, B.A.; Decharme, B. Potential of satellite rainfall products to predict Niger River flood events in Niamey. Atmos. Res. 2015, 163, 162–176. [Google Scholar] [CrossRef]
  20. Immerzeel, W.W.; Droogers, P.; de Jong, S.M.; Bierkens, M.F.P. Large-scale monitoring of snow cover and runoff simulation in Himalayan river basins using remote sensing. Remote Sens. Environ. 2009, 113, 40–49. [Google Scholar] [CrossRef]
  21. Zubieta, R.; Getirana, A.; Espinoza, J.C.; Lavado-Casimiro, W.; Aragon, L. Hydrological modeling of the Peruvian-Ecuadorian Amazon Basin using GPM-IMERG satellite-based precipitation dataset. Hydrol. Earth Syst. Sci. 2017, 21, 3543–3555. [Google Scholar] [CrossRef]
  22. Meng, J.; Li, L.; Hao, Z.; Wang, J.; Shao, Q. Suitability of TRMM satellite rainfall in driving a distributed hydrological model in the source region of Yellow River. J. Hydrol. 2014, 509, 320–332. [Google Scholar] [CrossRef]
  23. Fang, J.; Yang, W.; Luan, Y.; Du, J.; Lin, A.; Zhao, L. Evaluation of the TRMM 3B42 and GPM IMERG products for extreme precipitation analysis over China. Atmos. Res. 2019, 223, 24–38. [Google Scholar] [CrossRef]
  24. Yuan, F.; Zhang, L.; Wah Win, K.W.; Ren, L.; Zhao, C.; Zhu, Y.; Jiang, S.; Liu, Y. Assessment of GPM and TRMM multi-satellite precipitation products in streamflow simulations in a data sparse mountainous watershed in Myanmar. Remote Sens. 2017, 9. [Google Scholar] [CrossRef]
  25. Xue, X.; Hong, Y.; Limaye, A.S.; Gourley, J.J.; Huffman, G.J.; Khan, S.I.; Dorji, C.; Chen, S. Statistical and hydrological evaluation of TRMM-based Multi-satellite Precipitation Analysis over the Wangchu Basin of Bhutan: Are the latest satellite precipitation products 3B42V7 ready for use in ungauged basins? J. Hydrol. 2013, 499, 91–99. [Google Scholar] [CrossRef]
  26. Xuan, W.; Fu, Q.; Qin, G.; Zhu, C.; Pan, S.; Xu, Y.P. Hydrological simulation and runoff component analysis over a cold mountainous River Basin in Southwest China. Water (Switzerland) 2018, 10. [Google Scholar] [CrossRef]
  27. Ramarohetra, J.; Sultan, B.; Baron, C.; Gaiser, T.; Gosset, M. How satellite rainfall estimate errors may impact rainfed cereal yield simulation in West Africa. Agric. For. Meteorol. 2013, 180, 118–131. [Google Scholar] [CrossRef]
  28. Tan, M.L.; Tan, K.C.; Chua, V.P.; Chan, N.W. Evaluation of TRMM product for monitoring drought in the Kelantan River Basin, Malaysia. Water (Switzerland) 2017, 9. [Google Scholar] [CrossRef]
  29. Tekeli, A.E. Exploring Jeddah floods by tropical rainfall measuring mission analysis. Water (Switzerland) 2017, 9. [Google Scholar] [CrossRef]
  30. Gupta, M.; Srivastava, P.K.; Islam, T.; Ishak, A.M. Bin Evaluation of TRMM rainfall for soil moisture prediction in a subtropical climate. Environ. Earth Sci. 2014, 71, 4421–4431. [Google Scholar] [CrossRef]
  31. Gaona, M.F.R.; Overeem, A.; Leijnse, H.; Uijlenhoet, R. First-Year Evaluation of GPM Rainfall over the Netherlands: IMERG Day 1 Final Run (V03D). J. Hydrometeorol. 2016, 17, 2799–2814. [Google Scholar] [CrossRef]
  32. Sharifi, E.; Steinacker, R.; Saghafian, B. Assessment of GPM-IMERG and other precipitation products against gauge data under different topographic and climatic conditions in Iran: Preliminary results. Remote Sens. 2016, 8. [Google Scholar] [CrossRef]
  33. Dezfuli, A.K.; Ichoku, C.M.; Huffman, G.J.; Mohr, K.I.; Selker, J.S.; van de Giesen, N.; Hochreutener, R.; Annor, F.O. Validation of IMERG precipitation in Africa. J. Hydrometeorol. 2017, JHM-D-17-0139.1. [Google Scholar] [CrossRef]
  34. Rios Gaona, M.F.; Villarini, G.; Zhang, W.; Vecchi, G.A. The added value of IMERG in characterizing rainfall in tropical cyclones. Atmos. Res. 2018, 209, 95–102. [Google Scholar] [CrossRef] [Green Version]
  35. Wei, G.; Lü, H.; Crow, W.T.; Zhu, Y.; Wang, J.; Su, J. Evaluation of Satellite-Based Precipitation Products from IMERG V04A and V03D, CMORPH and TMPA with Gauged Rainfall in Three Climatologic Zones in China. Remote Sens. 2017, 10, 30. [Google Scholar] [CrossRef]
  36. Tan, M.; Duan, Z. Assessment of GPM and TRMM Precipitation Products over Singapore. Remote Sens. 2017, 9, 720. [Google Scholar] [CrossRef]
  37. Retalis, A.; Katsanos, D.; Tymvios, F.; Michaelides, S. Validation of the First Years of GPM Operation over Cyprus. Remote Sens. 2018, 10, 1520. [Google Scholar] [CrossRef]
  38. Huang, C.; Hu, J.; Chen, S.; Zhang, A.; Liang, Z.; Tong, X.; Xiao, L.; Min, C.; Zhang, Z. How Well Can IMERG Products Capture Typhoon Extreme Precipitation Events over Southern China? Remote Sens. 2019, 11, 70. [Google Scholar] [CrossRef]
  39. Gadelha, A.N.; Coelho, V.H.R.; Xavier, A.C.; Barbosa, L.R.; Melo, D.C.D.; Xuan, Y.; Huffman, G.J.; Petersen, W.A.; Almeida, C.D. Grid box-level evaluation of IMERG over Brazil at various space and time scales. Atmos. Res. 2019, 218, 231–244. [Google Scholar] [CrossRef]
  40. Wang, X.; Ding, Y.; Zhao, C.; Wang, J. Similarities and improvements of GPM IMERG upon TRMM 3B42 precipitation product under complex topographic and climatic conditions over Hexi region, Northeastern Tibetan Plateau. Atmos. Res. 2019, 218, 347–363. [Google Scholar] [CrossRef]
  41. Yuan, F.; Soe, K.; Jiang, S.; Zhao, C.; Liu, Y.; Ren, L.; Zhu, Y.; Zhang, L. Applications of TRMM- and GPM-Era Multiple-Satellite Precipitation Products for Flood Simulations at Sub-Daily Scales in a Sparsely Gauged Watershed in Myanmar. Remote Sens. 2019, 11, 140. [Google Scholar] [CrossRef]
  42. Palomino-Ángel, S.; Anaya-Acevedo, J.A.; Botero, B.A. Evaluation of 3B42V7 and IMERG daily-precipitation products for a very high-precipitation region in northwestern South America. Atmos. Res. 2019, 217, 37–48. [Google Scholar] [CrossRef]
  43. Ur Rahman, K.; Shang, S.; Shahid, M.; Li, J. Developing an ensemble precipitation algorithm from satellite products and its topographical and seasonal evaluations over Pakistan. Remote Sens. 2018, 10. [Google Scholar] [CrossRef]
  44. Xu, F.; Guo, B.; Ye, B.; Ye, Q.; Chen, H.; Ju, X.; Guo, J.; Wang, Z. Systematical Evaluation of GPM IMERG and TRMM 3B42V7 Precipitation Products in the Huang-Huai-Hai Plain, China. Remote Sens. 2019, 11, 697. [Google Scholar] [CrossRef]
  45. Omranian, E.; Sharif, H.O. Evaluation of the Global Precipitation Measurement (GPM) Satellite Rainfall Products over the Lower Colorado River Basin, Texas. JAWRA J. Am. Water Resour. Assoc. 2018, 54, 882–898. [Google Scholar] [CrossRef]
  46. Lu, D.; Yong, B. Evaluation and Hydrological Utility of the Latest GPM IMERG V5 and GSMaP V7 Precipitation Products over the Tibetan Plateau. Remote Sens. 2018, 10, 2022. [Google Scholar] [CrossRef]
  47. Xu, M.; Kang, S.; Wu, H.; Yuan, X. Detection of spatio-temporal variability of air temperature and precipitation based on long-term meteorological station observations over Tianshan Mountains, Central Asia. Atmos. Res. 2018, 203, 141–163. [Google Scholar] [CrossRef]
  48. Chen, H.; Chen, Y.; Li, W.; Li, Z. Quantifying the contributions of snow/glacier meltwater to river runoff in the Tianshan Mountains, Central Asia. Glob. Planet. Change 2019, 174, 47–57. [Google Scholar] [CrossRef]
  49. Zhang, X.; Li, X.; Li, L.; Zhang, S.; Qin, Q. Environmental factors influencing snowfall and snowfall prediction in the Tianshan Mountains, Northwest China. J. Arid Land 2019, 11, 15–28. [Google Scholar] [CrossRef]
  50. Zhang, C.; Chen, X.; Shao, H.; Chen, S.; Liu, T.; Chen, C.; Ding, Q.; Du, H. Evaluation and intercomparison of high-resolution satellite precipitation estimates-GPM, TRMM, and CMORPH in the Tianshan Mountain Area. Remote Sens. 2018, 10. [Google Scholar] [CrossRef]
  51. Gao, F.; Zhang, Y.; Chen, Q.; Wang, P.; Yang, H.; Yao, Y.; Cai, W. Comparison of two long-term and high-resolution satellite precipitation datasets in Xinjiang, China. Atmos. Res. 2018, 212, 150–157. [Google Scholar] [CrossRef]
  52. Wang, X.; Ding, Y.; Zhao, C.; Wang, J. Validation of TRMM 3B42V7 rainfall product under complex topographic and climatic conditions over Hexi region in the Northwest Arid Region of China. Water (Switzerland) 2018, 10. [Google Scholar] [CrossRef]
  53. Xu, S.; Shen, Y.; Niu, Z. Evaluation of the IMERG version 05B precipitation product and comparison with IMERG version 04A over mainland China at hourly and daily scales. Adv. Sp. Res. 2019, 1–12. [Google Scholar] [CrossRef]
  54. Cai, Y.; Jin, C.; Wang, A.; Guan, D.; Wu, J.; Yuan, F.; Xu, L. Comprehensive precipitation evaluation of TRMM 3B42 with dense rain gauge networks in a mid-latitude basin, northeast, China. Theor. Appl. Climatol. 2016, 126, 659–671. [Google Scholar] [CrossRef]
  55. Wang, X.; Xie, H. A review on applications of remote sensing and geographic information systems (GIS) in water resources and flood risk management. Water (Switzerland) 2018, 10, 1–11. [Google Scholar] [CrossRef]
  56. Vu, T.T.; Li, L.; Jun, K.S. Evaluation of multi-satellite precipitation products for streamflow simulations: A case study for the Han River Basin in the Korean Peninsula, East Asia. Water (Switzerland) 2018, 10. [Google Scholar] [CrossRef]
  57. Wang, R.; Chen, J.; Wang, X. Comparison of IMERG level-3 and TMPA 3B42V7 in estimating typhoon-related heavy rain. Water (Switzerland) 2017, 9, 1–15. [Google Scholar] [CrossRef]
  58. Reggiani, P.; Coccia, G.; Mukhopadhyay, B. Predictive uncertainty estimation on a precipitation and temperature reanalysis ensemble for Shigar Basin, Central Karakoram. Water (Switzerland) 2016, 8. [Google Scholar] [CrossRef]
  59. Chen, C.; Chen, Q.; Duan, Z.; Zhang, J.; Mo, K.; Li, Z.; Tang, G. Multiscale comparative evaluation of the GPM IMERG v5 and TRMM 3B42 v7 precipitation products from 2015 to 2017 over a climate transition area of China. Remote Sens. 2018, 10, 1–18. [Google Scholar] [CrossRef]
  60. Condom, T.; Rau, P.; Espinoza, J.C. Correction of TRMM 3B43 monthly precipitation data over the mountainous areas of Peru during the period 1998–2007. Hydrol. Process. 2011, 25, 1924–1933. [Google Scholar] [CrossRef]
  61. Erfanian1, A.; Wang, G.; Yu, M.; Anyah, R. Variations in tropical cyclone frequency response to solar and CO2 forcing in aquaplanet simulations. J. Adv. Model. Earth Syst. 2016, 1411–1431. [Google Scholar] [CrossRef]
  62. Tavakoly, A.A.; Snow, A.D.; David, C.H.; Follum, M.L.; Maidment, D.R.; Yang, Z.L. Continental-Scale River Flow Modeling of the Mississippi River Basin Using High-Resolution NHDPlus Dataset. J. Am. Water Resour. Assoc. 2017, 53, 258–279. [Google Scholar] [CrossRef]
  63. Su, J.; Lü, H.; Zhu, Y.; Wang, X.; Wei, G. Component analysis of errors in four GPM-based precipitation estimations over mainland China. Remote Sens. 2018, 10. [Google Scholar] [CrossRef]
  64. Guo, X.; Hong, Y.; Tang, G.; Wang, C.; Han, Z. Global intercomparison and regional evaluation of GPM IMERG Version-03, Version-04 and its latest Version-05 precipitation products: Similarity, difference and improvements. J. Hydrol. 2018, 564, 342–356. [Google Scholar] [CrossRef]
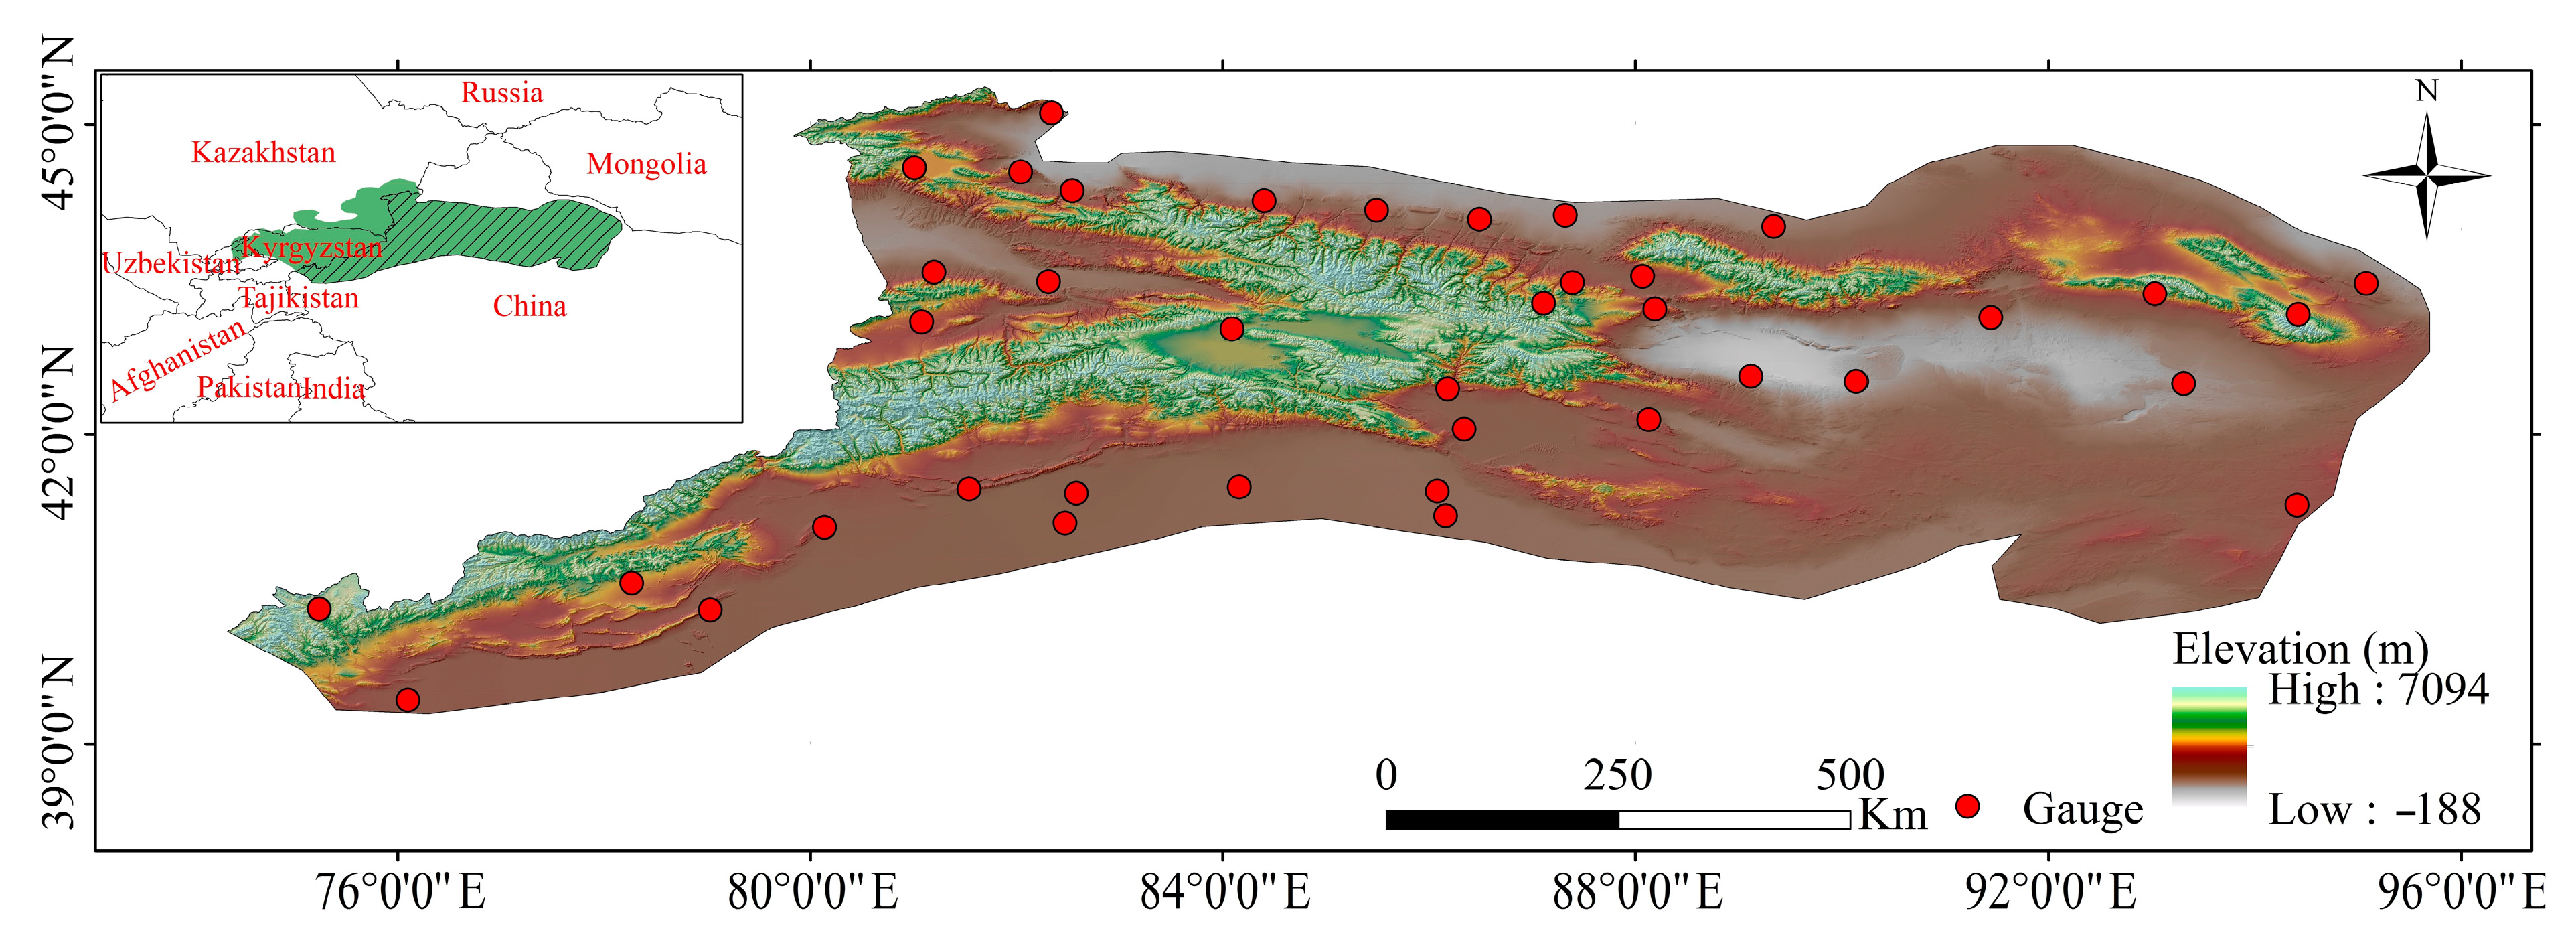
Figure 1. Geographical extents of Tianshan Mountains along with topography and locations of available gauging stations.
Water 11 01139 g001
Figure 2. Spatial distribution of average daily precipitation (from rain gauges and four satellite products) over the Tianshan Mountains for the period of April 2014 to October 2017.
Water 11 01139 g002
Figure 3. Comparison of the gauge-based average daily precipitation (during 2015 and 2016) with the average daily precipitation estimates from (a) IMERG-F, (b) IMERG-E, (c) 3B42V7, and (d) 3B42RT over the Tianshan Mountains. Thick blue and red (dashed) lines show the 30 days moving averages for gauge-based and satellite-based datasets.
Water 11 01139 g003
Figure 4. Taylor Diagrams of IMERG-E, IMERG-F, 3B42V7, and 3B42RT illustrating the statistical comparison with the gauge-based daily data during the entire investigation period and different seasons. (a) Daily; (b) Winter; (c) Spring; (d) Summer; (e) Autumn.
Water 11 01139 g004
Figure 5. Spatial distribution of Bias (ad), CC (eh) and RMSE (il) of IMERG-E, IMERG-F, 3B42V7 and 3B42RT products against the reference data during April 2014 to October 2017.
Water 11 01139 g005
Figure 6. Comparison of average annual gauge-based observations with the IMERG-E, IMERG-F, 3B42V7, and 3B42RT estimates over the Tianshan Mountains during 2015 and 2016.
Water 11 01139 g006
Figure 7. Distribution of monthly precipitation estimates obtained for the in situ rain gauges and four satellite precipitation products (IMERG-E, IMERG-F, 3B42V7, and 3B42RT) over the Tianshan Mountains in the northwestern China.
Water 11 01139 g007
Figure 8. The probability distribution function (PDF) of daily precipitation at different thresholds, as obtained from the in situ gauges, IMERG-E, IMERG-F, 3B42RT, and 3B42V7 products in (a) the entire period, (b) winter, (c) spring, (d) summer and (e) autumn.
Water 11 01139 g008
Table 1. Summary of error characteristics of IMERG-E, IMERG-F, 3B42V7, and 3B42RT precipitation products with reference to the gauge observations on the daily and seasonal scales.
MetricsIMERG-EIMERG-F3B42RT3B42V7
Entire Period
CC0.760.830.620.68
RMSE (mm/day)0.760.582.810.76
BIAS (mm/day)0.190.031.42−0.01
rBias (%)31.654.98238.41−1.71
POD0.780.740.870.66
FAR0.450.350.680.41
CSI0.480.530.300.45
Winter
CC0.490.640.300.51
RMSE (mm/day)0.450.392.060.54
BIAS (mm/day)−0.07−0.020.500.02
rBias (%)−38.03−10.60252.7411.06
POD0.140.290.500.36
FAR0.530.330.820.74
CSI0.140.250.160.18
Spring
CC0.810.810.420.52
RMSE (mm/day)0.530.531.710.80
BIAS (mm/day)−0.060.000.48−0.11
rBias (%)−12.950.28103.90−23.87
POD0.480.670.570.33
FAR0.330.440.720.61
CSI0.380.440.230.22
Summer
CC0.780.830.690.76
RMSE (mm/day)0.950.673.310.78
BIAS (mm/day)0.480.072.270.09
rBias (%)55.548.13261.019.86
POD0.940.820.980.80
FAR0.480.340.660.37
CSI0.510.580.340.54
Autumn
CC0.760.800.540.35
RMSE (mm/day)0.590.552.930.91
BIAS (mm/day)−0.060.021.13−0.24
rBias (%)−11.894.76239.42−50.80
POD0.480.600.680.28
FAR0.200.380.740.42
CSI0.430.440.230.23
Table 2. Summary of performance evaluation metrics of monthly precipitation estimates from IMERG-E, IMERG-F, 3B42V7, and 3B42RT products over the Tianshan Mountains.
Indices IMERG-EIMERG-F3B42RT3B42V7
CC0.890.980.770.93
RMSE11.153.0552.785.02
BIAS5.700.9043.26−0.31
rBias31.414.98238.41−1.71