Climatic Trends of West Virginia: A Representative Appalachian Microcosm


Abstract
1. Introduction
2. Materials and Methods
3. Results
3.1. Climate during Period of Record
3.2. Spatial Climatic Changes
3.2.1. Entire Time Series (1900–2016)
3.2.2. First Half (1900–1958)
3.2.3. Second Half (1959–2016)
3.3. Temporal Trends (1900–2016)
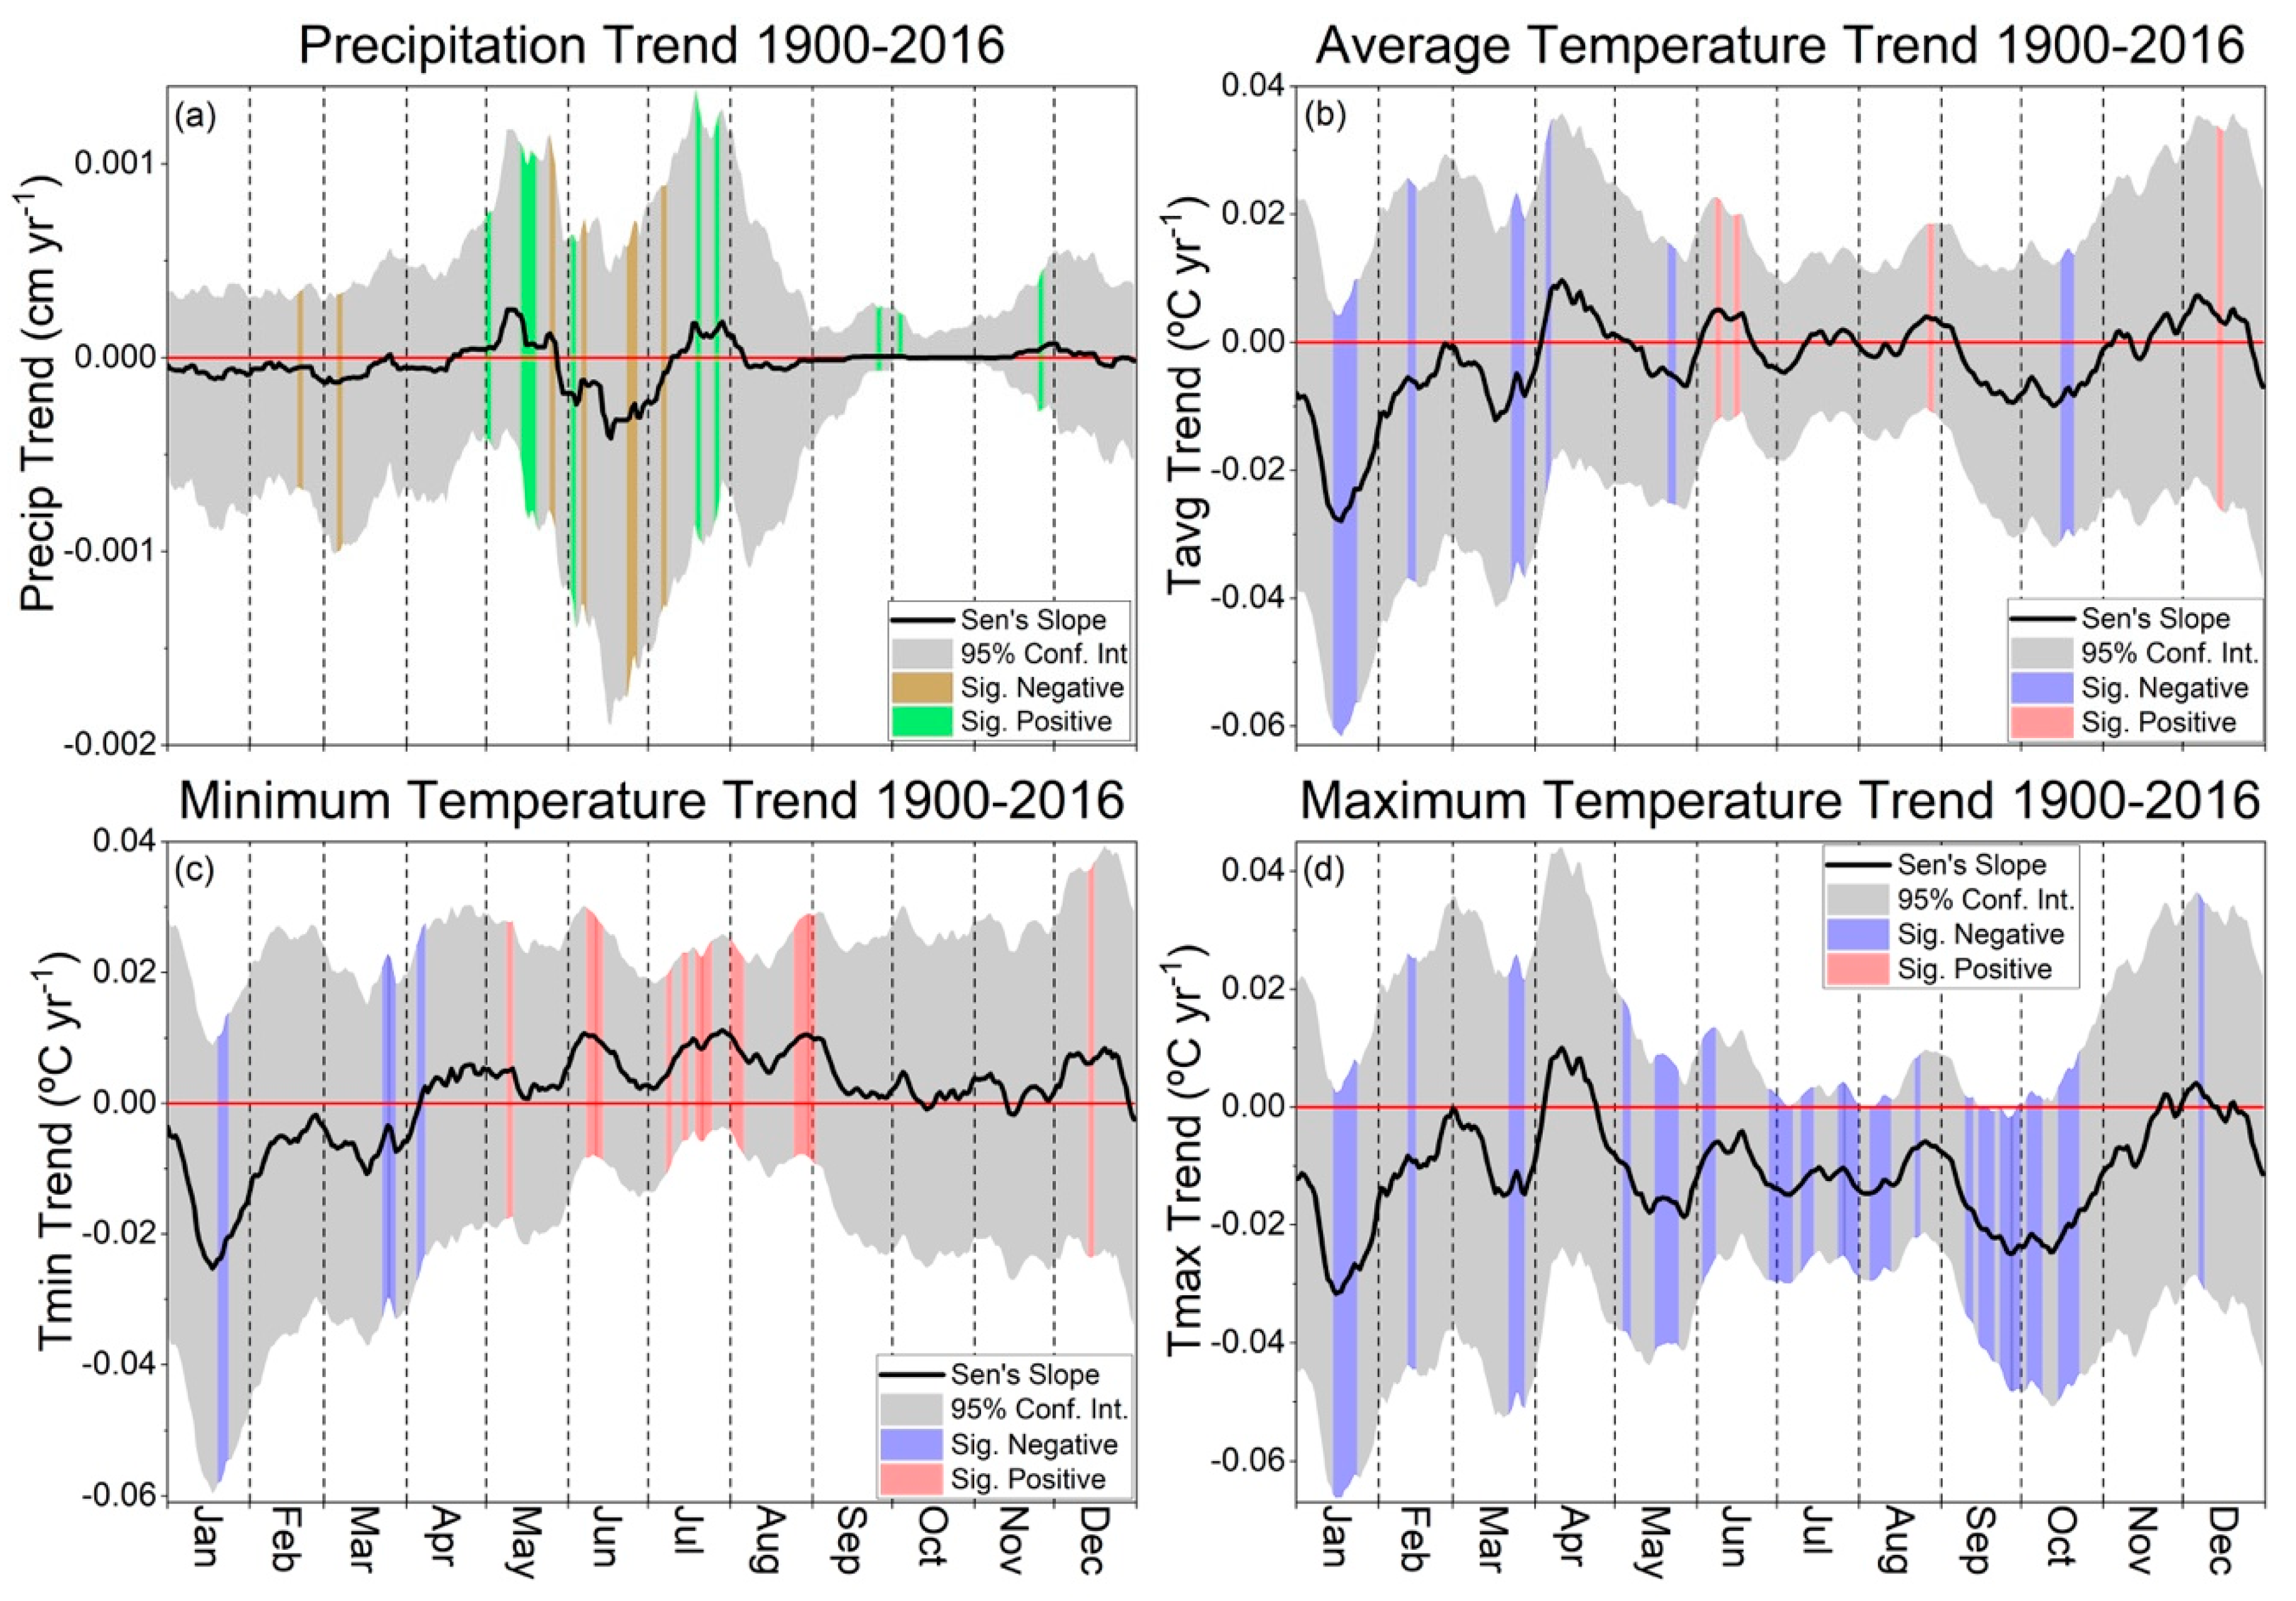
3.3.1. Entire Time Series (1900–2016)
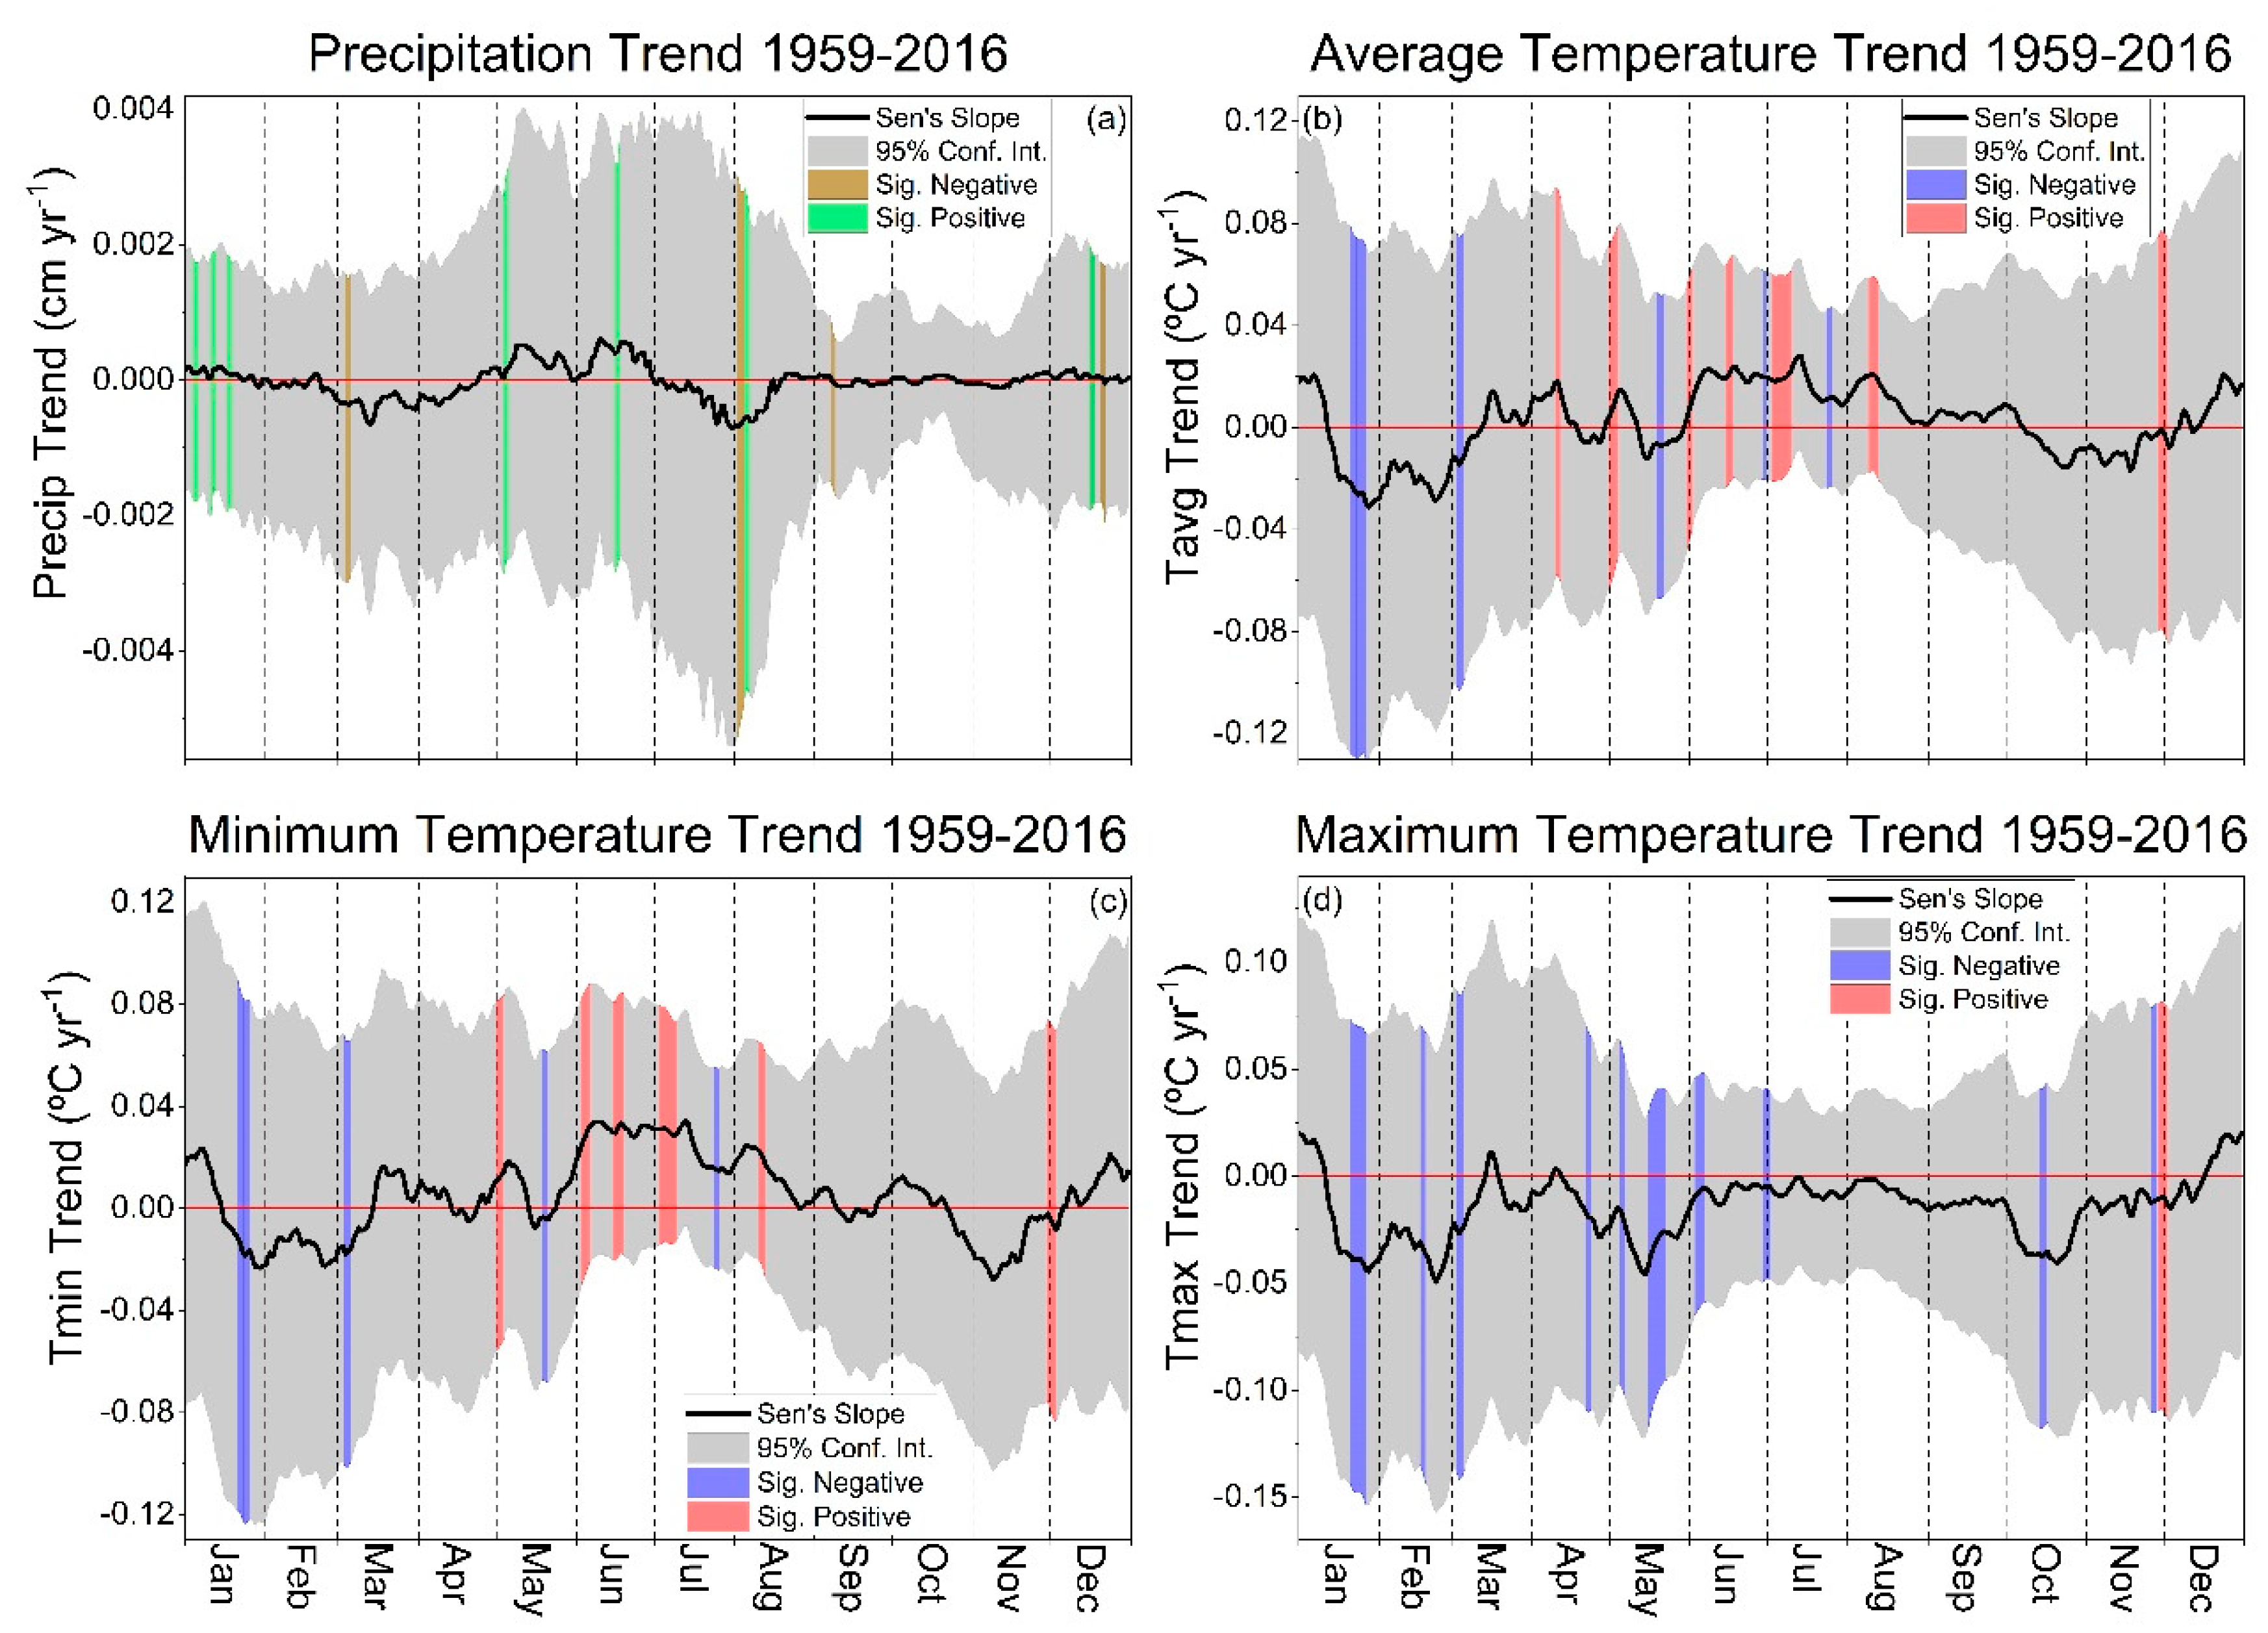
3.3.2. Second Half (1959–2016)
4. Discussion
5. Conclusions
Author Contributions
Funding
Acknowledgments
Conflicts of Interest
References
- Lewis, R.L. Appalachian Restructuring in Historical Perspective: Coal, Culture and Social Change in West Virginia. Urban. Stud. 1993, 30, 299–308. [Google Scholar] [CrossRef]
- Lewis, R.L. Transforming the Appalachian Countryside Railroads, Deforestation, and Social Change in West Virginia; The University of North Carolina Press: Chapel Hill, NC, USA, 1998; ISBN 9780807847060. [Google Scholar]
- Brooks, A.B. West Virginia Geological Survey, Vol. 5: Forestry and Wood Industries; Acme Publishing Co.: Morgantown, WV, USA, 1911. [Google Scholar]
- Brose, P.; Schuler, T.; Van Lear, D.; Berst, J. Bringing fire back: The changing regimes of the Appalachian mixed-oak forests. J. For. 2001, 99, 30–35. [Google Scholar] [CrossRef]
- Bones, J.T. The Forest Resources of West Virginia; Resource Bulletin Me-56; U.S. Department of Agriculture, Forest Service, Northeastern Forest Experiment Station: Broomall, PA, USA, 1978. [CrossRef]
- Morin, R.S.; Cook, G.W.; Barnett, C.J.; Butler, B.J.; Crocker, S.J.; Hatfield, M.A.; Kurtz, C.M.; Lister, T.W.; Luppold, W.G.; McWilliams, W.H.; et al. West Virginia Forests 2013; Resource Bulletin NRS-105; U.S. Department of Agriculture, Forest Service, Northeastern Forest Experiment Station: Newtown Square, PA, USA, 2016. [CrossRef]
- Burakowski, E.A.; Ollinger, S.V.; Bonan, G.B.; Wake, C.P.; Dibb, J.E.; Hollinger, D.Y. Evaluating the climate effects of reforestation in new England using a weather research and forecasting (WRF) model multiphysics ensemble. J. Clim. 2016, 29, 5141–5156. [Google Scholar] [CrossRef]
- Campbell, G.; Norman, J. An. Introduction to Environmental Biophysics; Springer Science & Business Media, Inc.: New York, NY, USA, 1998; ISBN 0-387-94937-2. [Google Scholar]
- Kutta, E.; Hubbart, J.A. Changing climatic averages and variance: Implications for mesophication at the eastern edge of North America’s Eastern deciduous forest. Forests 2018, 9. [Google Scholar] [CrossRef]
- Hoffmann, M.P.; Smith, D.L. Feeding Our Great Cities: Climate Change and Opportunities for Agriculture in Eastern Canada and the Northeastern US. Available online: http://www2.ca.uky.edu/Anr/PDF/US-CanadaClimateChangeWhitePaper.pdf (accessed on 14 December 2018).
- Darvill, R.; Lindo, Z. The inclusion of stakeholders and cultural ecosystem services in land management trade-off decisions using an ecosystem services approach. Landsc. Ecol. 2016, 31, 533–545. [Google Scholar] [CrossRef]
- Gómez-Aíza, L.; Martínez-Ballesté, A.; Álvarez-Balderas, L.; Lombardero-Goldaracena, A.; García-Meneses, P.M.; Caso-Chávez, M.; Conde-Álvarez, C. Can wildlife management units reduce land use/land cover change and climate change vulnerability? Conditions to encourage this capacity in Mexican municipalities. Land Use Policy 2017, 64, 317–326. [Google Scholar] [CrossRef]
- United States Department of Agriculture Food and Nutrition Service. Food Desert Locator: Release No. 0191.11. Available online: https://www.usda.gov/media/blog/2011/05/03/interactive-web-tool-maps-food-deserts-provides-key-data (accessed on 15 January 2018).
- Arguez, A.; Durre, I.; Applequist, S.; Squires, M.; Vose, R.; Yin, X. NOAA’s U.S. Climate Normals (1981–2010). Available online: https://www.ncdc.noaa.gov/cdo-web/datatools/normals (accessed on 14 August 2018).
- United States Department of Agriculture Food and Nutrition Service. Monongahela National Forest Land and Resource Management Plan. Available online: https://www.fs.usda.gov/Internet/FSE_DOCUMENTS/stelprdb5330420.pdf (accessed on February 15 2018).
- Edenborn, H.M.; Sams, J.I.; Kite, J.S. Thermal Regime of a Cold Air Trap in Central Pennsylvania, USA: The Trough Creek Ice Mine. Permafr. Periglac. Process. 2012, 23, 187–195. [Google Scholar] [CrossRef]
- NOAAs NCEI Climate Data Online. Available online: https://www.ncdc.noaa.gov/ghcn-daily-description (accessed on October 6 2017).
- The Role of Climatological Normals in a Changing Climate; World Meteorological Organization (WMO): Geneva, Switzerland, 2007.
- Allen, J. NASA Image based on data from the MODIS Rapid Response Team, Goddard Space Flight Center. Available online: https://earthobservatory.nasa.gov/images/8344/mining-permits-across-west-virginia (accessed on 14 March 2018).
- Lanzante, J.R. Resistant, robust and non-parametric techniques for the analysis of climate data: Theory and examples, including applications to historical radiosonde station data. Int. J. Climatol. 1996, 16, 1197–1226. [Google Scholar] [CrossRef]
- Wilks, D.S. Statistical Methods in the Atmospheric Sciences; Academic Press: Cambridge, MA, USA, 2011; ISBN 9780444515544. [Google Scholar]
- Gocic, M.; Trajkovic, S. Analysis of changes in meteorological variables using Mann-Kendall and Sen’s slope estimator statistical tests in Serbia. Glob. Planet. Chang. 2013, 100, 172–182. [Google Scholar] [CrossRef]
- Hayhoe, K.; Wuebbles, D.J.; Easterling, D.R.; Fahey, D.W.; Doherty, S.; Kossin, J.P.; Sweet, W.V.; Vose, R.S.; Wehner, M.F. Chapter 2: Our Changing Climate. In Impacts, Risks, and Adaptation in the United States: The Fourth National Climate Assessment, Volume II. Available online: https://data.globalchange.gov/report/nca4/chapter/our-changing-climate (accessed on 31 December 2018).
- Kutta, E.; Hubbart, J.A. Reconsidering meteorological seasons in a changing climate. Clim. Chang. 2016, 137, 511–524. [Google Scholar] [CrossRef]
- Peel, M.C.; Finlayson, B.L.; McMahon, T.A. Updated world map of the Köppen-Geiger climate classification. Hydrol. Earth Syst. Sci. 2007, 11, 1633–1644. [Google Scholar] [CrossRef]
- Bonan, G.B. Forests and climate change: Forcings, feedbacks, and the climate benefits of forests. Science 2008, 320, 1444–1449. [Google Scholar] [CrossRef]
- Pitman, A.J. Review the Evolution of and Revolution in Land Surface Schemes. Int. J. Climatol. 2003, 510, 479–510. [Google Scholar] [CrossRef]
- Hubbart, J.A.; Link, T.E.; Gravelle, J.A.; Elliot, W.J. Timber harvest impacts on water yield in the continental/maritime hydroclimatic region of the United States. For. Sci. 2007, 53, 169–180. [Google Scholar]
- Pitman, A.J.; Brovkin, V.; van den Hurk, B.J.J.M.; Strengers, B.J.; Ganzeveld, L.; Gayler, V.; Claussen, M.; Müller, C.; Seneviratne, S.I.; Bonan, G.B.; et al. Uncertainties in climate responses to past land cover change: First results from the LUCID intercomparison study. Geophys. Res. Lett. 2009, 36. [Google Scholar] [CrossRef]
- Juang, J.-Y.; Stoy, P.; Novick, K.; Katul, G.; Siqueira, M. Separating the effects of albedo from eco-physiological changes on surface temperature along a successional chronosequence in the southeastern United States. Geophys. Res. Lett. 2007, 34. [Google Scholar] [CrossRef]
- U.S. Global Change Research Program—Executive summary. In Climate Science Special Report: Fourth National Climate Assessment, Volume I. Available online: https://science2017.globalchange.gov/ (accessed on 14 December 2018).
- Richards, K. Urban and rural dewfall, surface moisture, and associated canopy-level air temperature and humidity measurements for Vancouver, Canada. Boundary-Layer Meteorol. 2005, 114, 143–163. [Google Scholar] [CrossRef]
- Jr Houze, R.A. Orographic effects on precipitating clouds. Rev. Geophys. 2012, 50, 1–47. [Google Scholar] [CrossRef]
- Zheng, D.; Chen, J.; Song, B.; Xu, M.; Sneed, P.; Jensen, R. Effects of silvicultural treatments on summer forest microclimate in southeastern Missouri Ozarks. Clim. Res. 2000, 15, 45–59. [Google Scholar] [CrossRef]
- Dai, A.; Trenberth, K.E.; Karl, T.R. Effects of clouds, soil moisture, precipitation, and water vapor on diurnal temperature range. J. Clim. 1999, 12, 2451–2473. [Google Scholar] [CrossRef]
- Mueller, N.D.; Butler, E.E.; Mckinnon, K.A.; Rhines, A.; Tingley, M.; Holbrook, N.M.; Huybers, P. Cooling of US Midwest summer temperature extremes from cropland intensification. Nat. Clim. Chang. 2016, 6, 317–322. [Google Scholar] [CrossRef]
- Kutta, E.; Hubbart, J.A. Observed climatic changes in West Virginia and opportunities for agriculture. Reg. Environ. Chang. 2019. [Google Scholar] [CrossRef]
- Held, I.M.; Soden, B.J. Robust responses of the hydrological cycle to global warming. J. Clim. 2006, 19, 5686–5699. [Google Scholar] [CrossRef]
- Dirmeyer, P.A.; Brubaker, K.L. Characterization of the Global Hydrologic Cycle from a Back-Trajectory Analysis of Atmospheric Water Vapor. J. Hydrometeorol. 2007, 8, 20–37. [Google Scholar] [CrossRef]
- Deser, C.; Phillips, A.S.; Alexander, M.A.; Smoliak, B.V. Projecting North American climate over the next 50 years: Uncertainty due to internal variability. J. Clim. 2014, 27, 2271–2296. [Google Scholar] [CrossRef]
- Kevin, E.T.; Aiguo, D.; Roy, M.R.; David, B.P. The Changing Character of Precipitation. Bull. Am. Meteorol. Soc. 2003, 84, 1205–1218. [Google Scholar] [CrossRef]
- Lenderink, G.; Barbero, R.; Loriaux, J.M.; Fowler, H.J. Super-Clausius-Clapeyron scaling of extreme hourly convective precipitation and its relation to large-scale atmospheric conditions. J. Clim. 2017, 30, 6037–6052. [Google Scholar] [CrossRef]
- Alkama, R.; Cescatti, A. Climate change: Biophysical climate impacts of recent changes in global forest cover. Science 2016, 351, 600–604. [Google Scholar] [CrossRef] [PubMed]
- Villarini, G.; Steiner, M.; Smith, J.A.; Ntelekos, A.A.; Baeck, M.L. Extreme rainfall and flooding from orographic thunderstorms in the central Appalachians. Water Resour. Res. 2011, 47, 1–24. [Google Scholar] [CrossRef]
- Kellner, E.; Hubbart, J.A. Flow class analyses of suspended sediment concentration and particle size in a mixed-land-use watershed. Sci. Total Environ. 2019, 648, 973–983. [Google Scholar] [CrossRef]
- Zipper, C.E.; Barton, C.B.; Davis, V.; Franklin, J.A.; Burger, J.A.; Skousen, J.G.; Angel, P.N. Restoring Forests and Associated Ecosystem Services on Appalachian Coal Surface Mines [electronic resource]. Environ. Manage. 2011, 47, 751–765. [Google Scholar] [CrossRef]
- Petersen, F.; Hubbart, J.A.; Kellner, E.; Kutta, E. Land-use-mediated Escherichia coli concentrations in a contemporary Appalachian watershed. Environ. Earth Sci. 2018, 77. [Google Scholar] [CrossRef]
- Hubbart, J.A.; Guyette, R.; Muzika, R.M. More than Drought: Precipitation Variance, Excessive Wetness, Pathogens and the Future of the Western Edge of the Eastern Deciduous Forest. Sci. Total Environ. 2016, 566, 463–467. [Google Scholar] [CrossRef]
- Anagnostakis, S.L. Chestnut Blight: The Classical Problem of an Introduced Pathogen. Mycologia 1987, 79, 23. [Google Scholar] [CrossRef]
- Cale, J.A.; Teale, S.A.; Johnston, M.T.; Boyer, G.L.; Perri, K.A.; Castello, J.D. New ecological and physiological dimensions of beech bark disease development in aftermath forests. For. Ecol. Manage. 2015, 336, 99–108. [Google Scholar] [CrossRef]
- Kauffman, B.W.; Clatterbuck, W.K.; Liebhold, A.M.; Coyle, D.R. Gypsy Moth in the Southeastern U.S.: Biology, Ecology, and Forest Management Strategies; SREF-FH-008; Southern Regional Extension Forestry: Athens, GA, USA, 2017. [Google Scholar]
- Herms, D.A.; McCullough, D.G. Emerald Ash Borer Invasion of North America: History, Biology, Ecology, Impacts, and Management. Annu. Rev. Entomol. 2014, 59, 13–30. [Google Scholar] [CrossRef]
- Kim, J.; Hwang, T.; Schaaf, C.L.; Orwig, D.A.; Boose, E.; Munger, J.W. Increased water yield due to the hemlock woolly adelgid infestation in New England. Geophys. Res. Lett. 2017, 44, 2327–2335. [Google Scholar] [CrossRef]
- Greenland, D.; Goodin, D.G.; Smith, R.C. Climate Variability and Ecosystem Response at Long-Term Ecological Research Sites; Oxford University Press, Inc.: Oxford, UK, 2003; ISBN 0195150597. [Google Scholar]
- United States Department of Agriculture. High Tunnel System Initiative. Available online: https://www.nrcs.usda.gov/wps/portal/nrcs/detailfull/national/programs/?cid=stelprdb1046250 (accessed on March 14 2018).
- Raitz, K.B.; Ulack, R. Appalachia A regional geography Land, People, and Development; Westview Press, Inc.: Boulder, CO, USA, 1984. [Google Scholar]


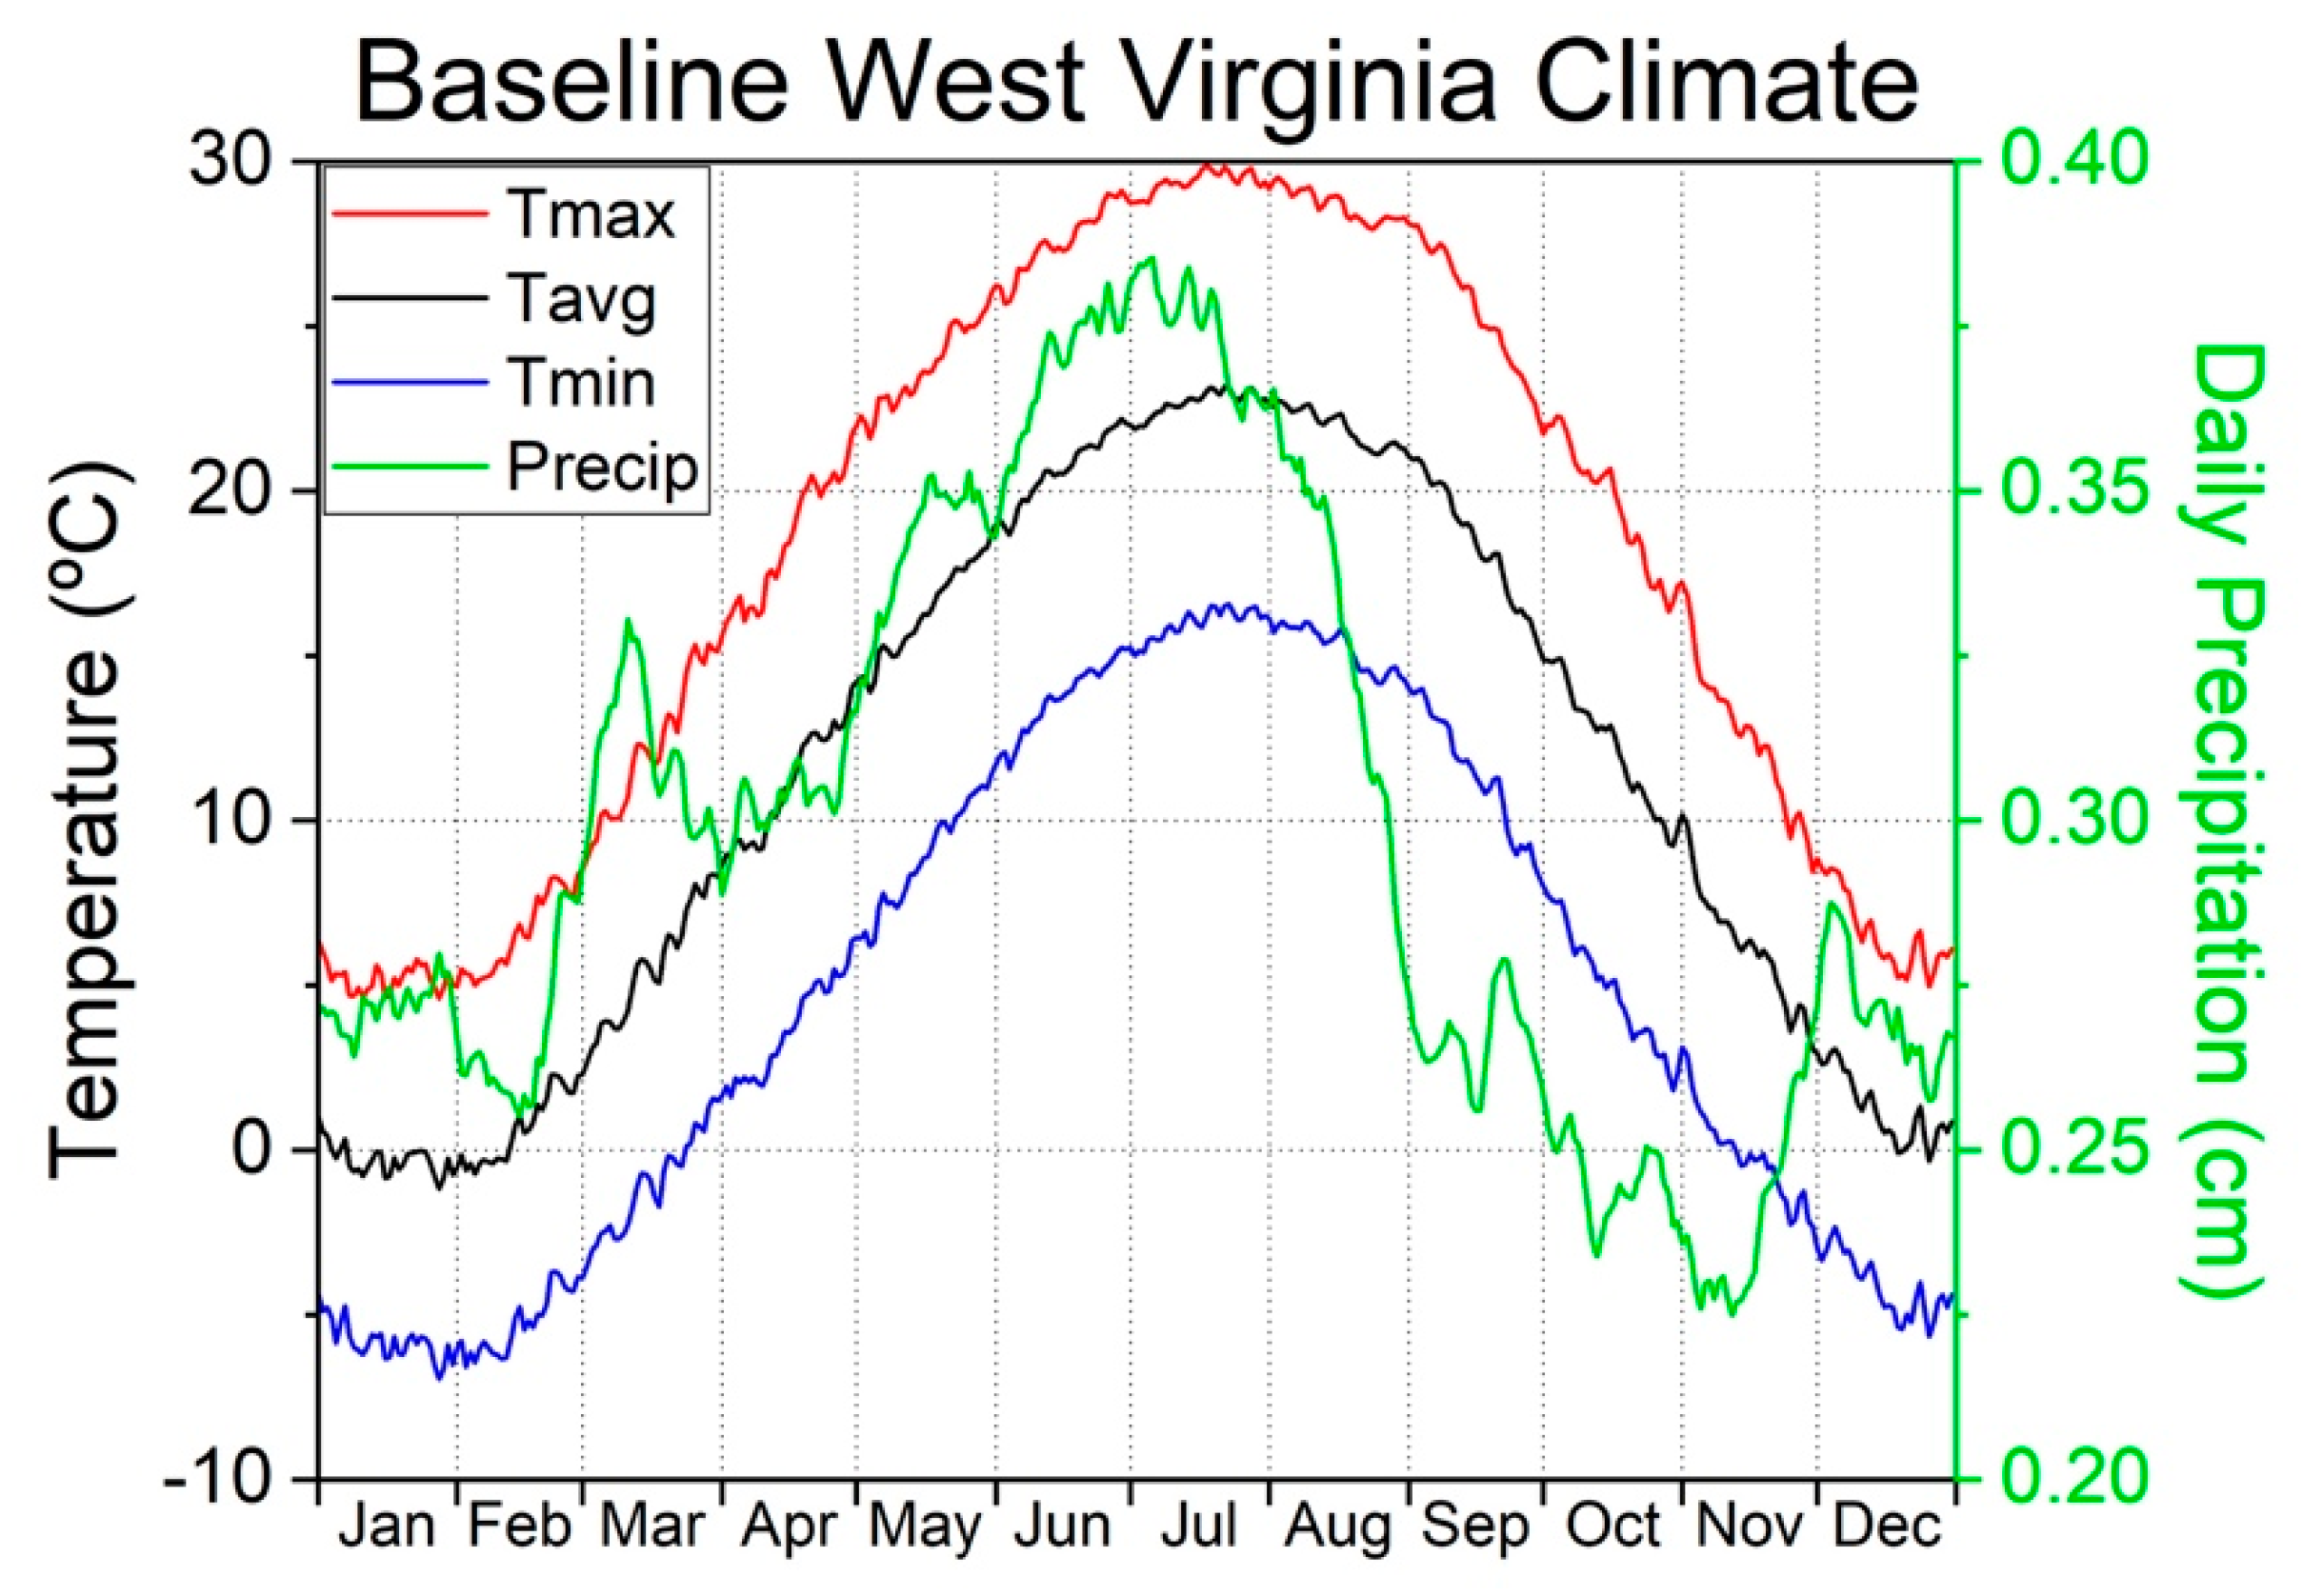
| Jan | Feb | Mar | Apr | May | Jun | Jul | Aug | Sep | Oct | Nov | Dec | |
|---|---|---|---|---|---|---|---|---|---|---|---|---|
| Precip | 8.5 | 7.4 | 9.7 | 9.1 | 10.5 | 11.1 | 11.7 | 10.1 | 8.2 | 7.4 | 7.3 | 8.3 |
| Tmax | 5.2 | 6.6 | 12.2 | 18.4 | 23.7 | 27.5 | 29.4 | 28.7 | 25.6 | 19.6 | 12.6 | 6.6 |
| Tavg | −0.3 | 0.7 | 5.5 | 11.0 | 16.3 | 20.6 | 22.7 | 22.0 | 18.5 | 12.3 | 6.2 | 1.3 |
| Tmin | −5.8 | −5.3 | −1.1 | 3.6 | 8.8 | 13.6 | 16.0 | 15.2 | 11.4 | 4.9 | −0.1 | −4.1 |
| Minimum | Maximum | Precipitation | |||||||||
|---|---|---|---|---|---|---|---|---|---|---|---|
| City | Elev | Period of Record | 1900–2016 | 1900–1958 | 1959–2016 | 1900–2016 | 1900–1958 | 1959–2016 | 1900–2016 | 1900–1958 | 1959–2016 |
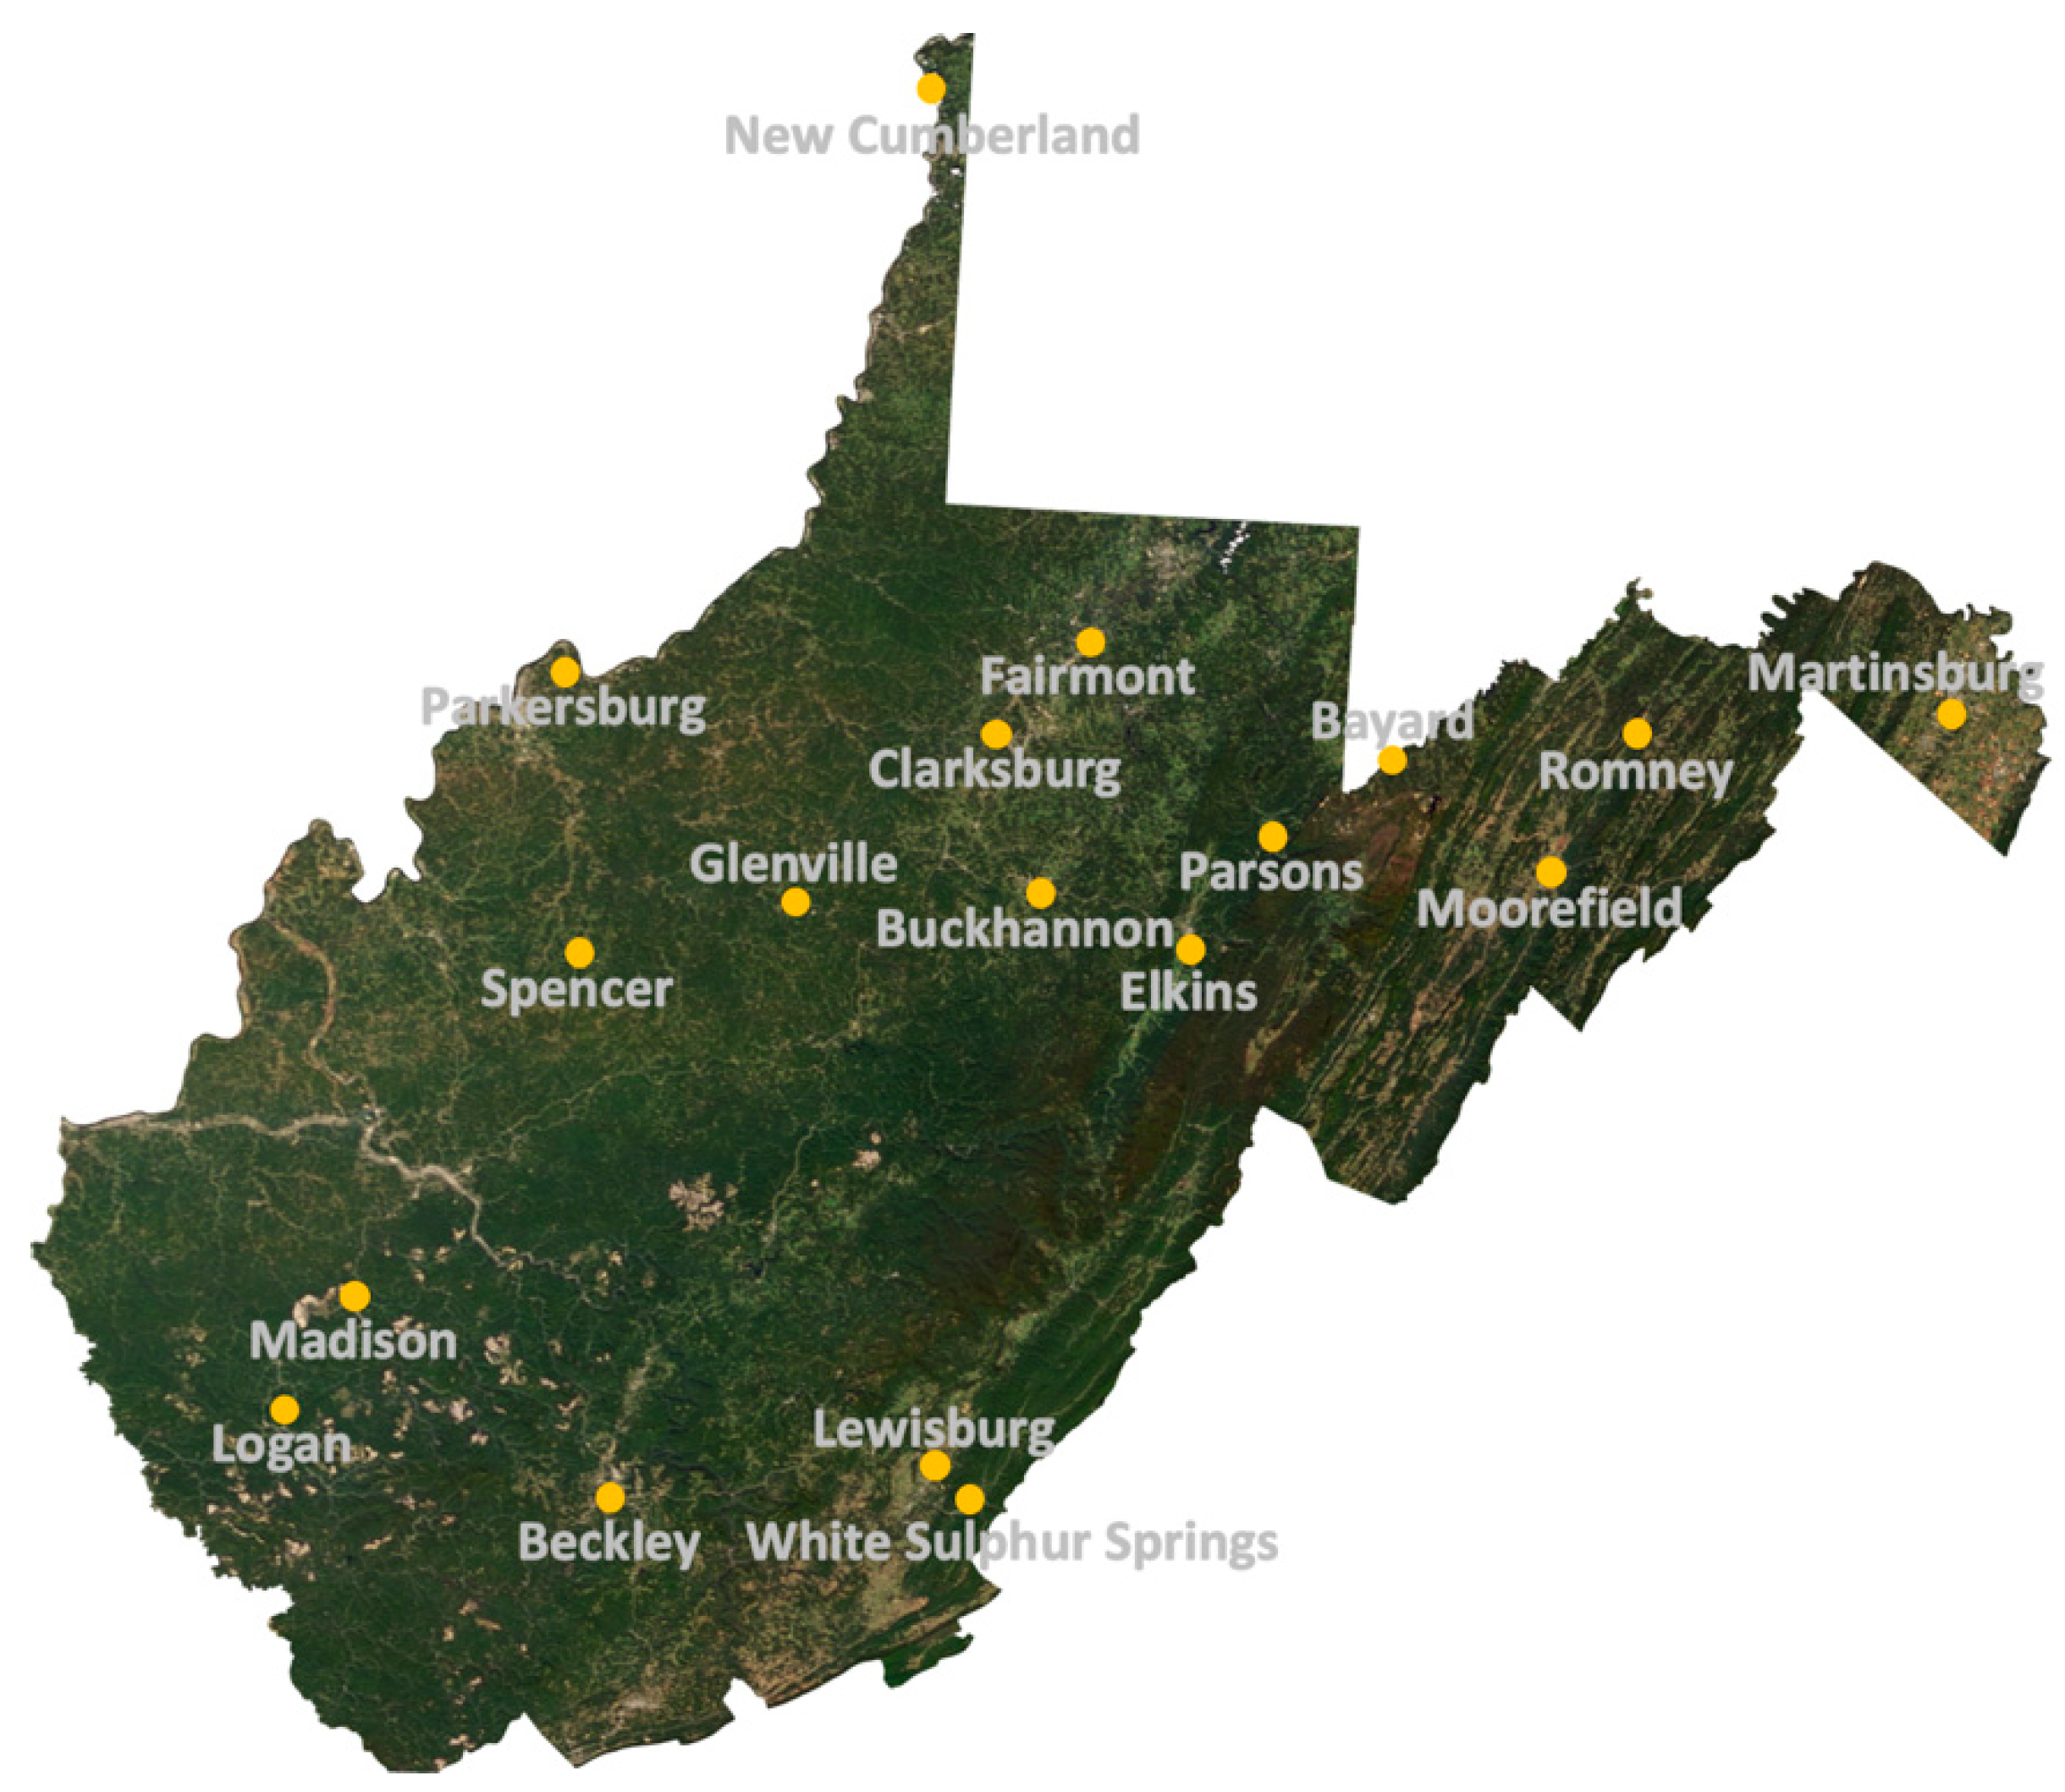
| Martinsburg | 165 | 1926–2016 | 0.12 | 0.01 | 0.32 | −0.06 | −0.40 | 0.12 | −0.30 | −5.10 | 1.20 |
| New Cumb. | 205 | 1902–2016 | 0.17 | 0.30 | 0.22 | 0.02 | 0.50 | −0.29 | 0.49 | 1.34 | 3.21 |
| Romney | 206 | 1900–2016 | −0.02 | 0.08 | 0.05 | −0.06 | 0.16 | −0.09 | −0.05 | −0.89 | 1.30 |
| Madison | 208 | 1909–2016 | 0.04 | 0.03 | 0.31 | 0.04 | −0.07 | 0.24 | 3.05 | 3.03 | 4.44 |
| Glenville | 229 | 1900–2016 | −0.02 | 0.15 | 0.42 | −0.21 | 0.00 | 0.15 | −0.54 | 1.44 | 2.83 |
| Moorefield | 254 | 1901–2016 | 0.01 | 0.29 | −0.23 | −0.12 | 0.15 | −0.12 | 0.30 | −1.56 | 1.90 |
| Parkerburg | 254 | 1926–2016 | −0.09 | −0.03 | 0.05 | 0.01 | 0.17 | 0.19 | 1.52 | 3.19 | 3.71 |
| Spencer | 294 | 1906–2016 | −0.07 | 0.40 | −0.07 | −0.10 | −0.01 | −0.13 | 0.36 | −0.77 | 4.48 |
| Clarksburg | 302 | 1923–2016 | 0.11 | −0.05 | 0.30 | −0.10 | −0.04 | −0.03 | 1.42 | −2.20 | 4.30 |
| Fairmont | 345 | 1906–2016 | 0.10 | 0.32 | 0.27 | −0.21 | −0.24 | 0.11 | 0.79 | 0.28 | 2.16 |
| Logan | 367 | 1902–2016 | 0.11 | 0.00 | 0.52 | −0.09 | −0.10 | 0.16 | 0.18 | −3.01 | 3.66 |
| Buckhannon | 433 | 1909–2016 | −0.09 | −0.07 | 0.14 | −0.30 | 0.15 | 0.02 | −1.17 | −1.50 | 0.69 |
| Parsons | 543 | 1900–2016 | 0.06 | 0.39 | 0.07 | −0.15 | 0.23 | −0.05 | 0.94 | 0.86 | 1.23 |
| White SS | 597 | 1921–2016 | −0.01 | 0.17 | −0.04 | −0.16 | 0.29 | −0.40 | 1.15 | 2.84 | 2.14 |
| Elkins | 604 | 1926–2016 | −0.07 | −0.31 | 0.31 | 0.04 | 0.14 | 0.21 | −0.51 | −8.34 | 1.33 |
| Lewisburg | 696 | 1901–2016 | −0.04 | 0.07 | −0.06 | −0.06 | 0.20 | −0.29 | 0.19 | −3.17 | 2.38 |
| Beckley | 711 | 1907–2016 | −0.03 | 0.03 | 0.02 | 0.01 | −0.16 | −0.24 | −1.77 | −1.37 | 1.62 |
| Bayard | 722 | 1903–2016 | 0.02 | −0.14 | 0.06 | −0.20 | −0.17 | −0.07 | 0.06 | −1.84 | 2.33 |
| Lower Elevation Average | 0.03 | 0.13 | 0.15 | −0.06 | 0.05 | 0.00 | 0.69 | −0.17 | 3.04 | ||
| Higher Elevation Average | 0.01 | 0.05 | 0.14 | −0.12 | 0.04 | −0.06 | −0.02 | −1.69 | 1.95 | ||
| Average | 0.02 | 0.09 | 0.15 | −0.09 | 0.04 | −0.03 | 0.34 | −0.93 | 2.50 | ||
© 2019 by the authors. Licensee MDPI, Basel, Switzerland. This article is an open access article distributed under the terms and conditions of the Creative Commons Attribution (CC BY) license (http://creativecommons.org/licenses/by/4.0/).
Share and Cite
Kutta, E.; Hubbart, J. Climatic Trends of West Virginia: A Representative Appalachian Microcosm. Water 2019, 11, 1117. https://doi.org/10.3390/w11061117
Kutta E, Hubbart J. Climatic Trends of West Virginia: A Representative Appalachian Microcosm. Water. 2019; 11(6):1117. https://doi.org/10.3390/w11061117
Chicago/Turabian StyleKutta, Evan, and Jason Hubbart. 2019. "Climatic Trends of West Virginia: A Representative Appalachian Microcosm" Water 11, no. 6: 1117. https://doi.org/10.3390/w11061117
APA StyleKutta, E., & Hubbart, J. (2019). Climatic Trends of West Virginia: A Representative Appalachian Microcosm. Water, 11(6), 1117. https://doi.org/10.3390/w11061117