A Complicated Karst Spring System: Identified by Karst Springs Using Water Level, Hydrogeochemical, and Isotopic Data in Jinan, China


Abstract
1. Introduction
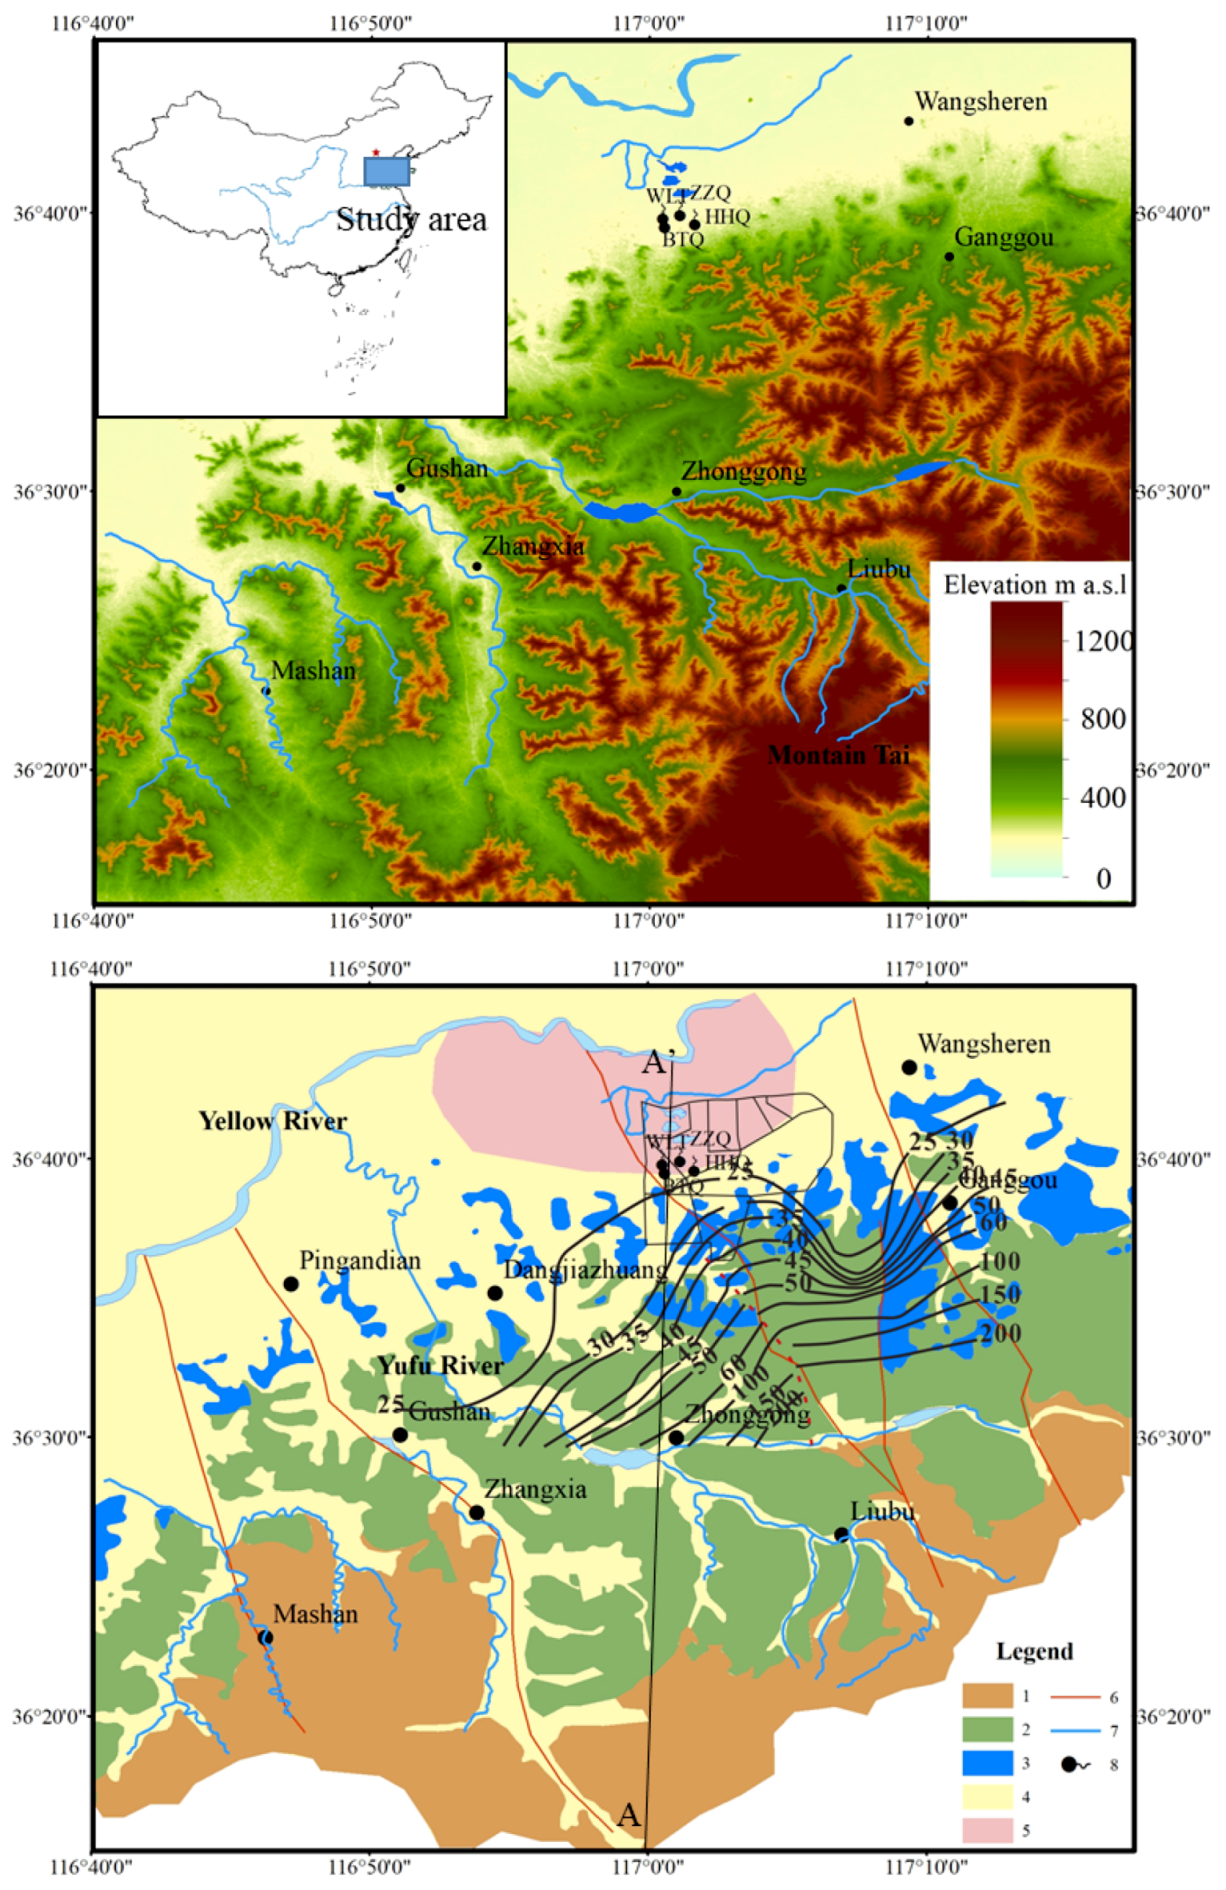
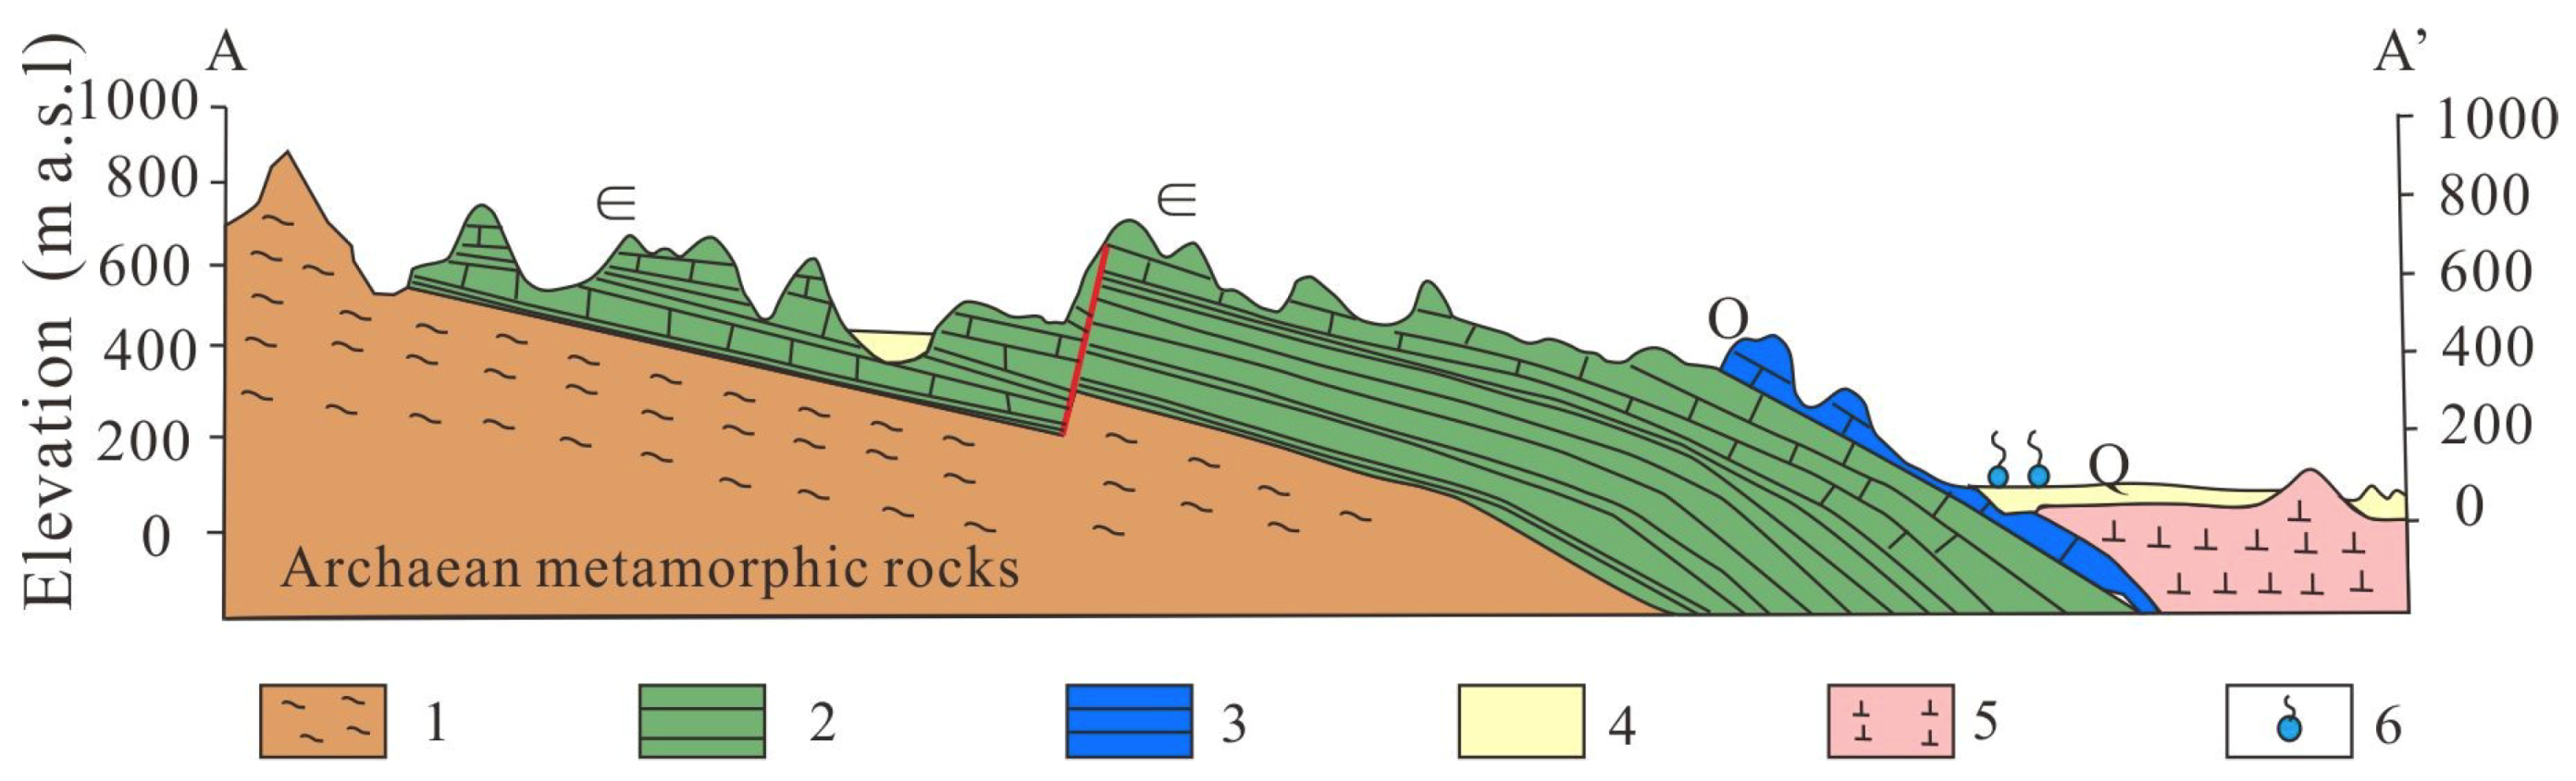
2. Study Area
3. Materials and Methods
4. Results
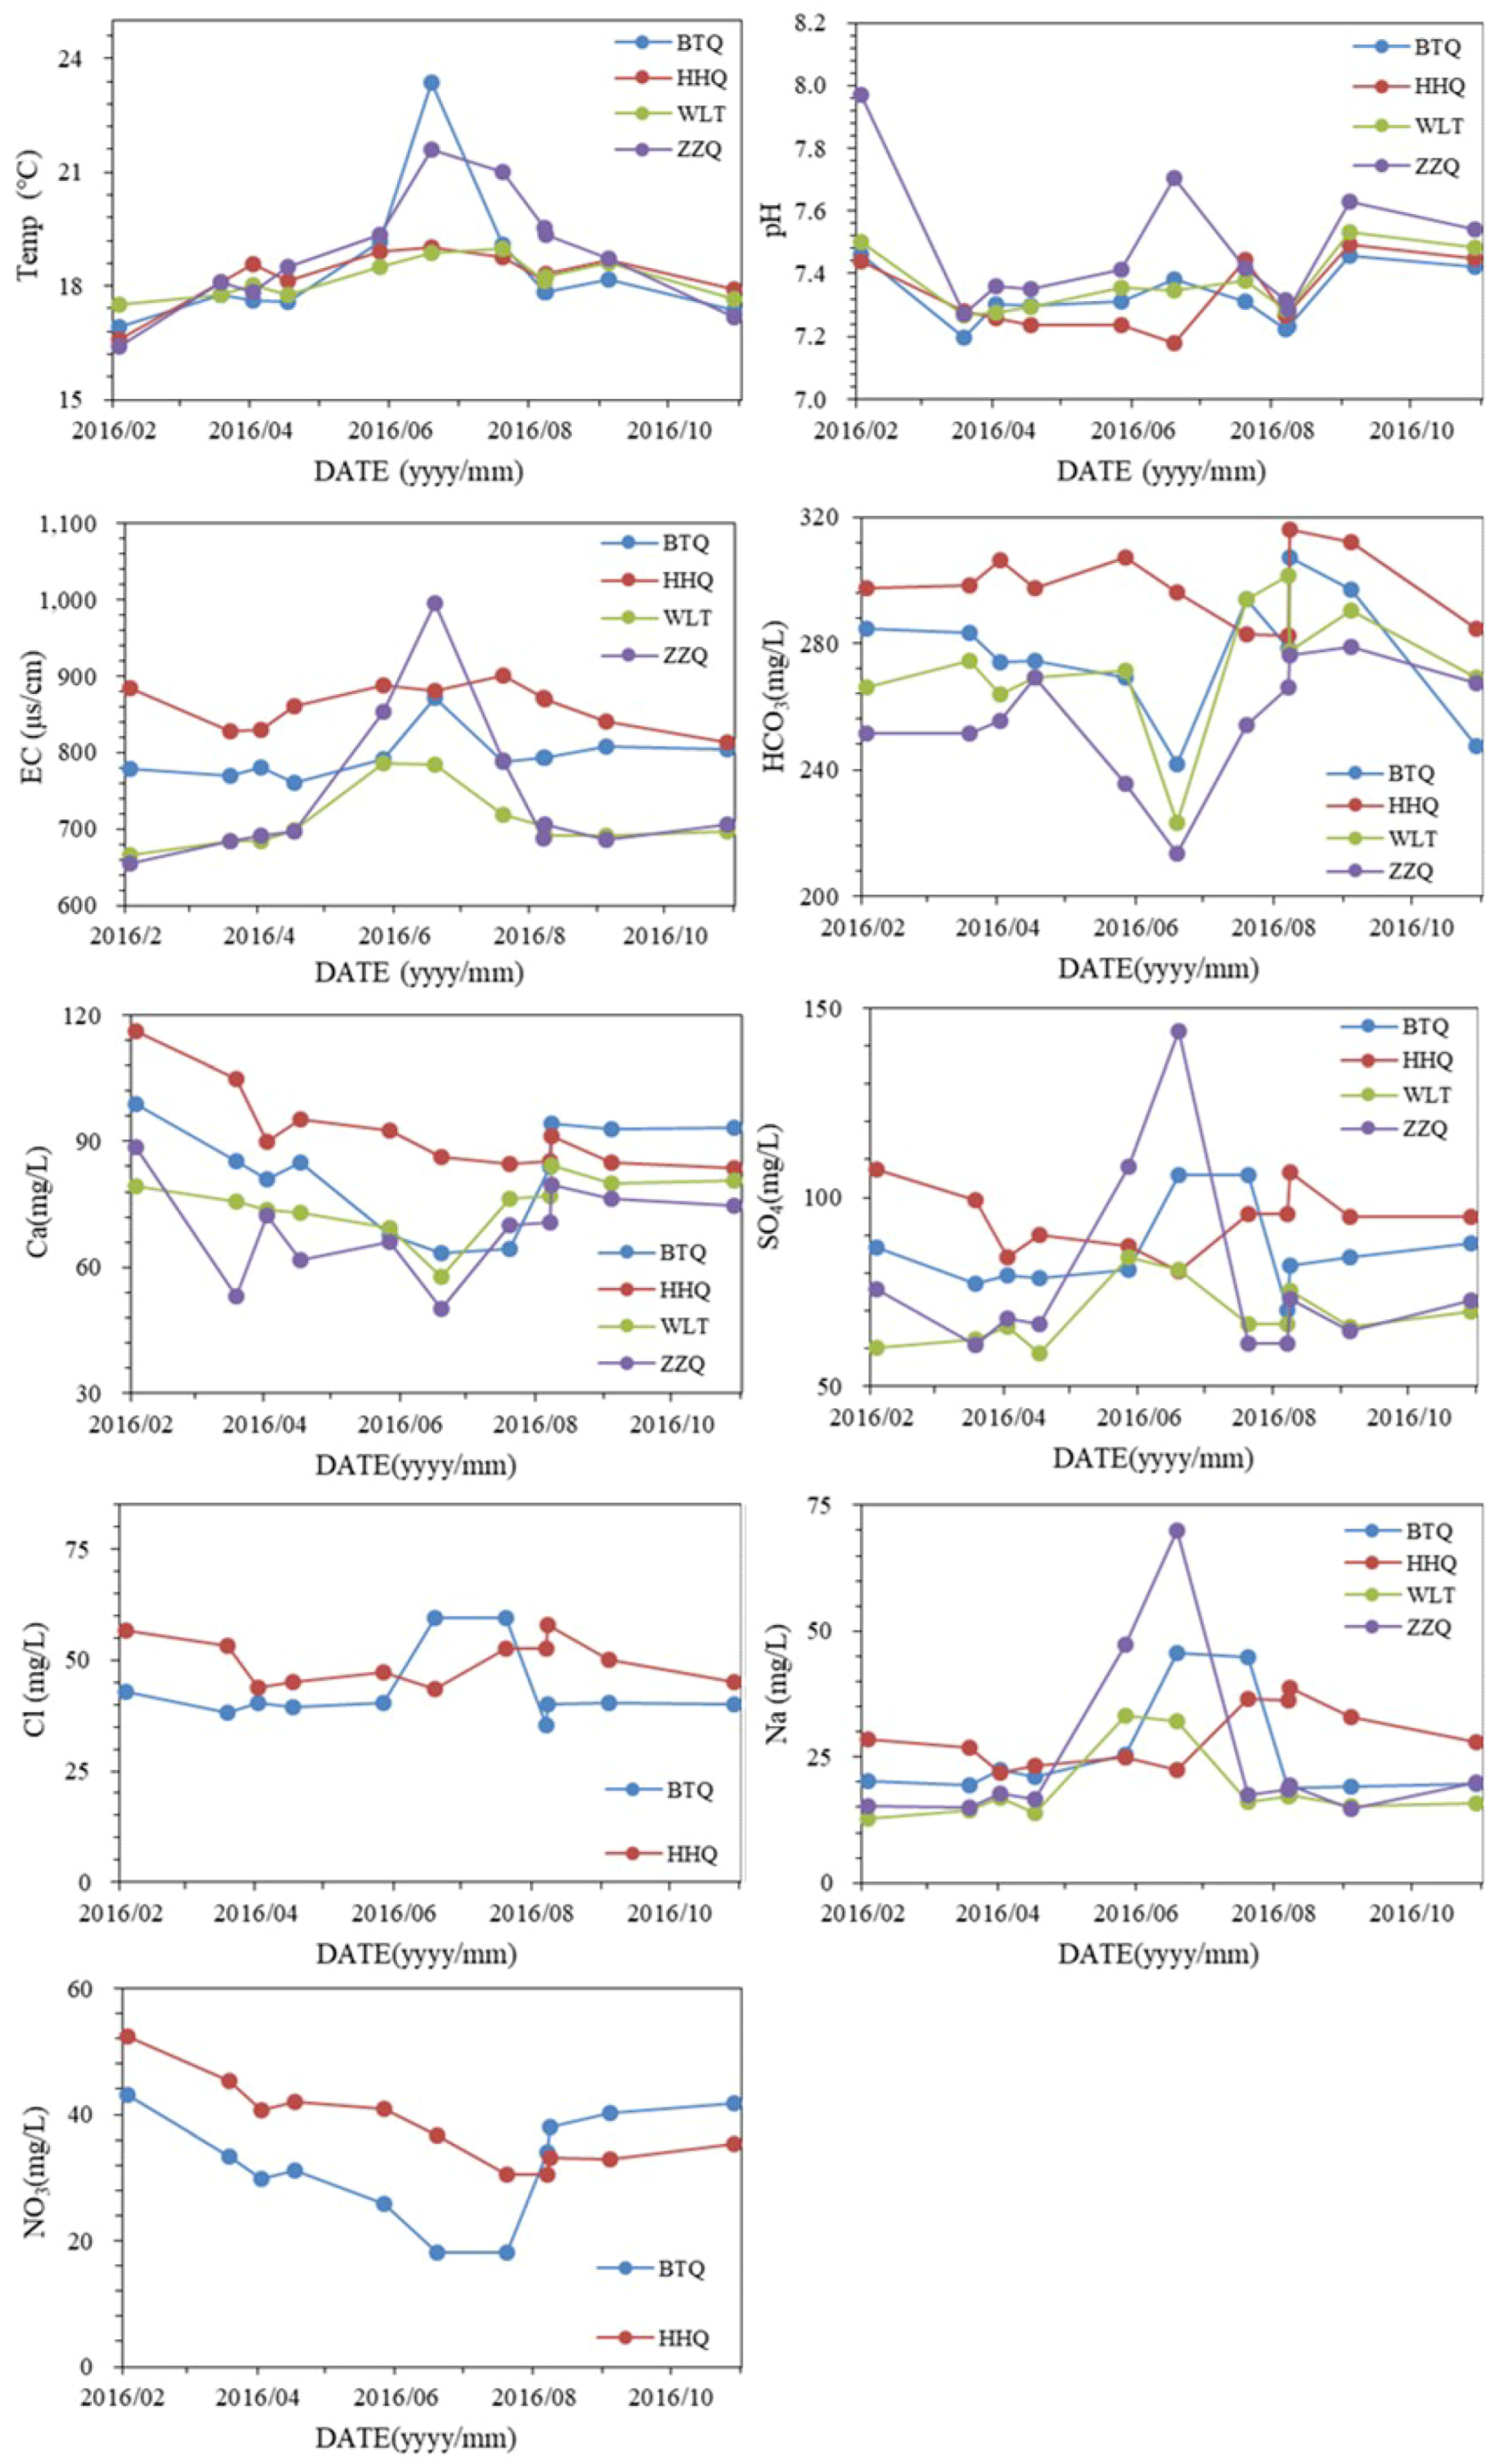
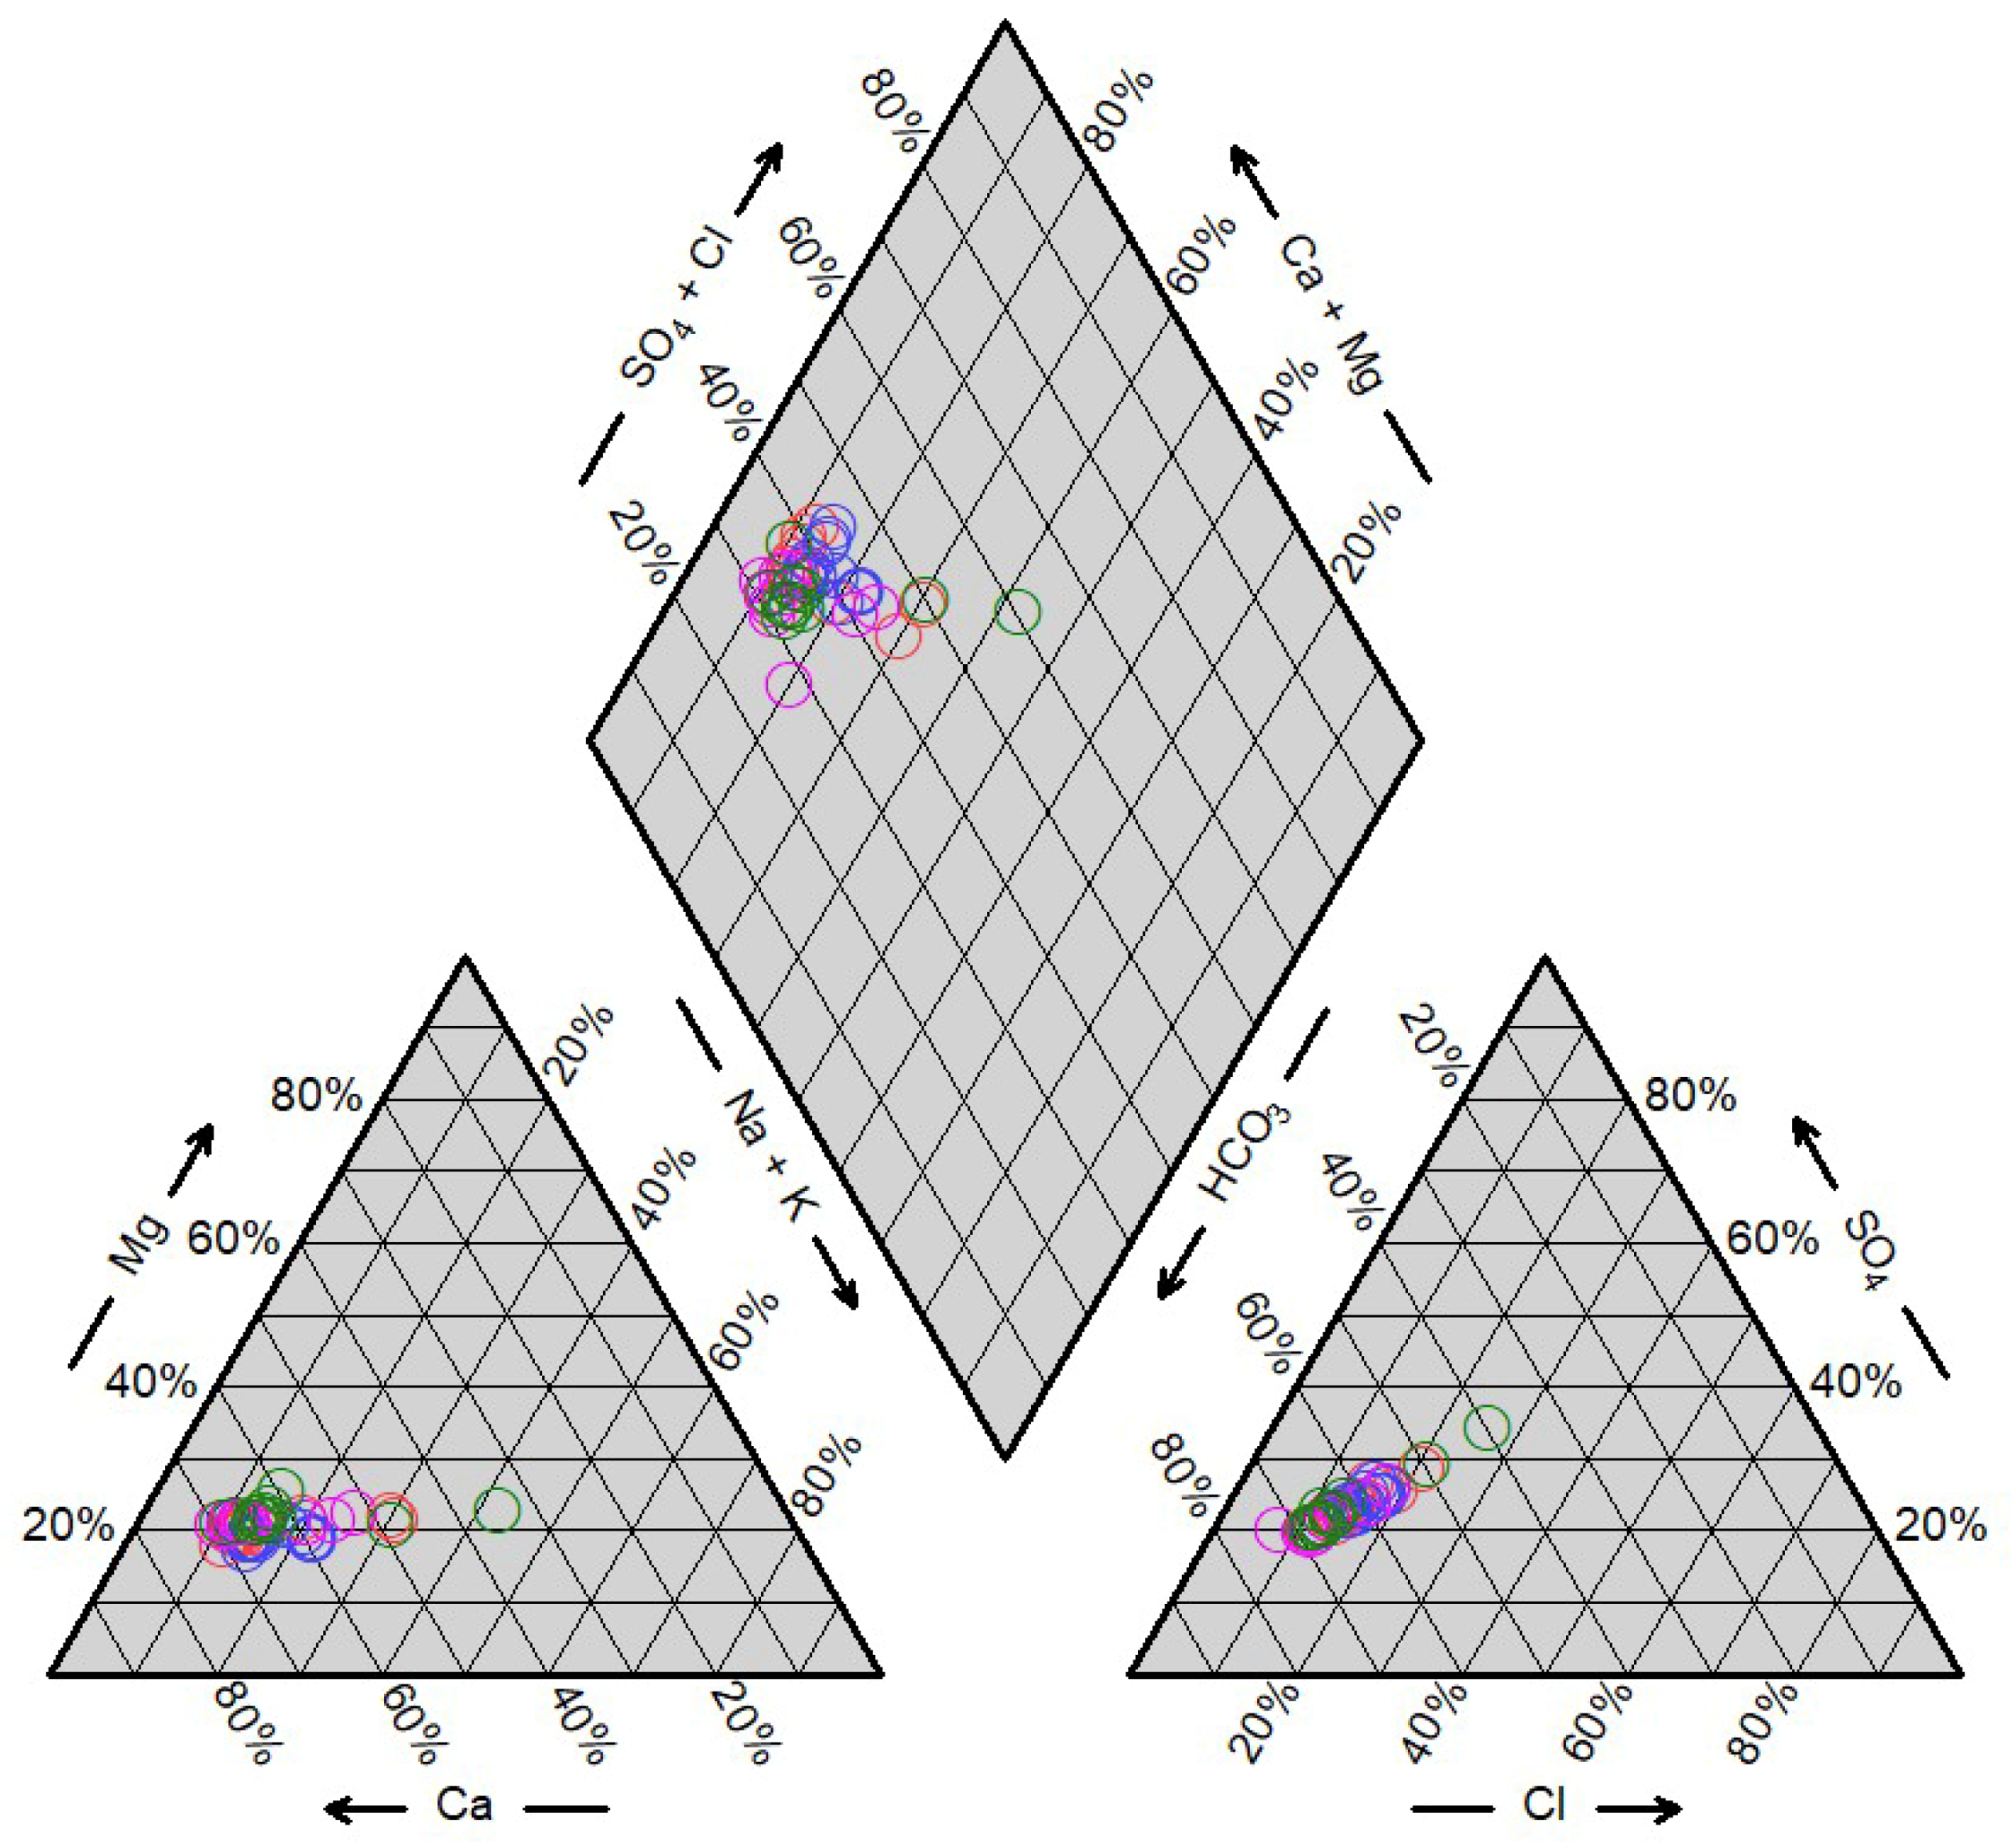
4.1. Hydrogeochemistry
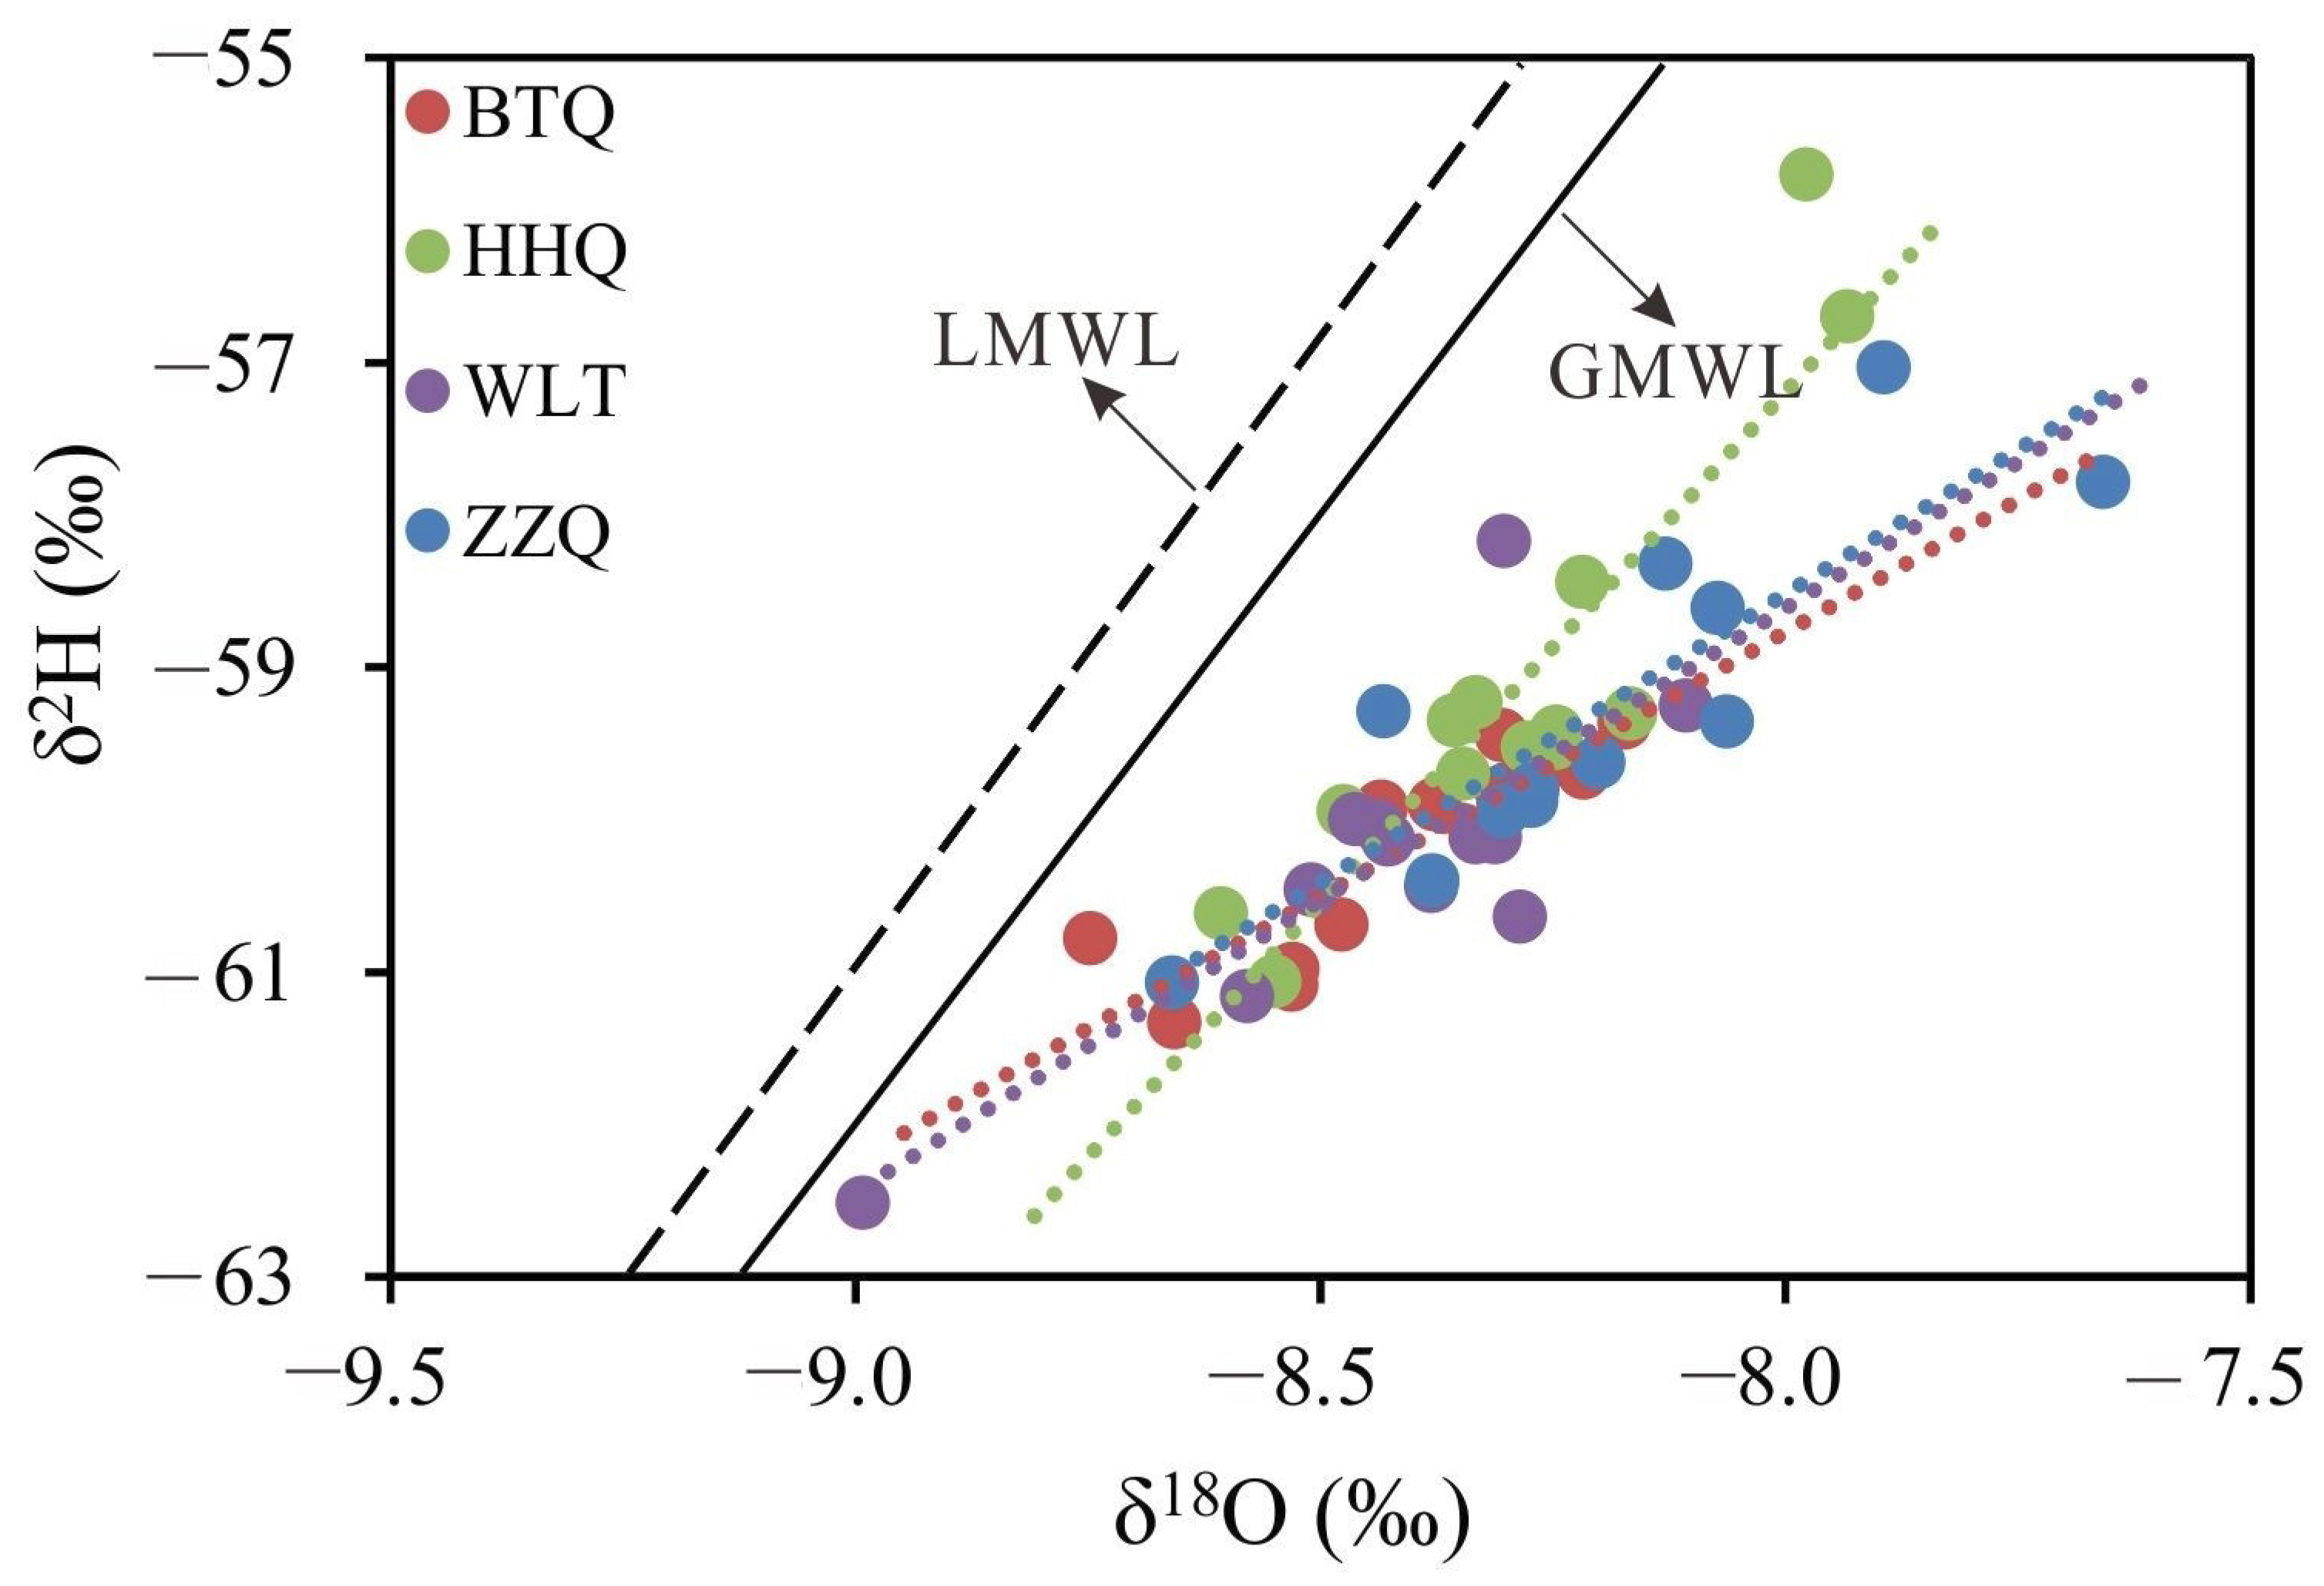
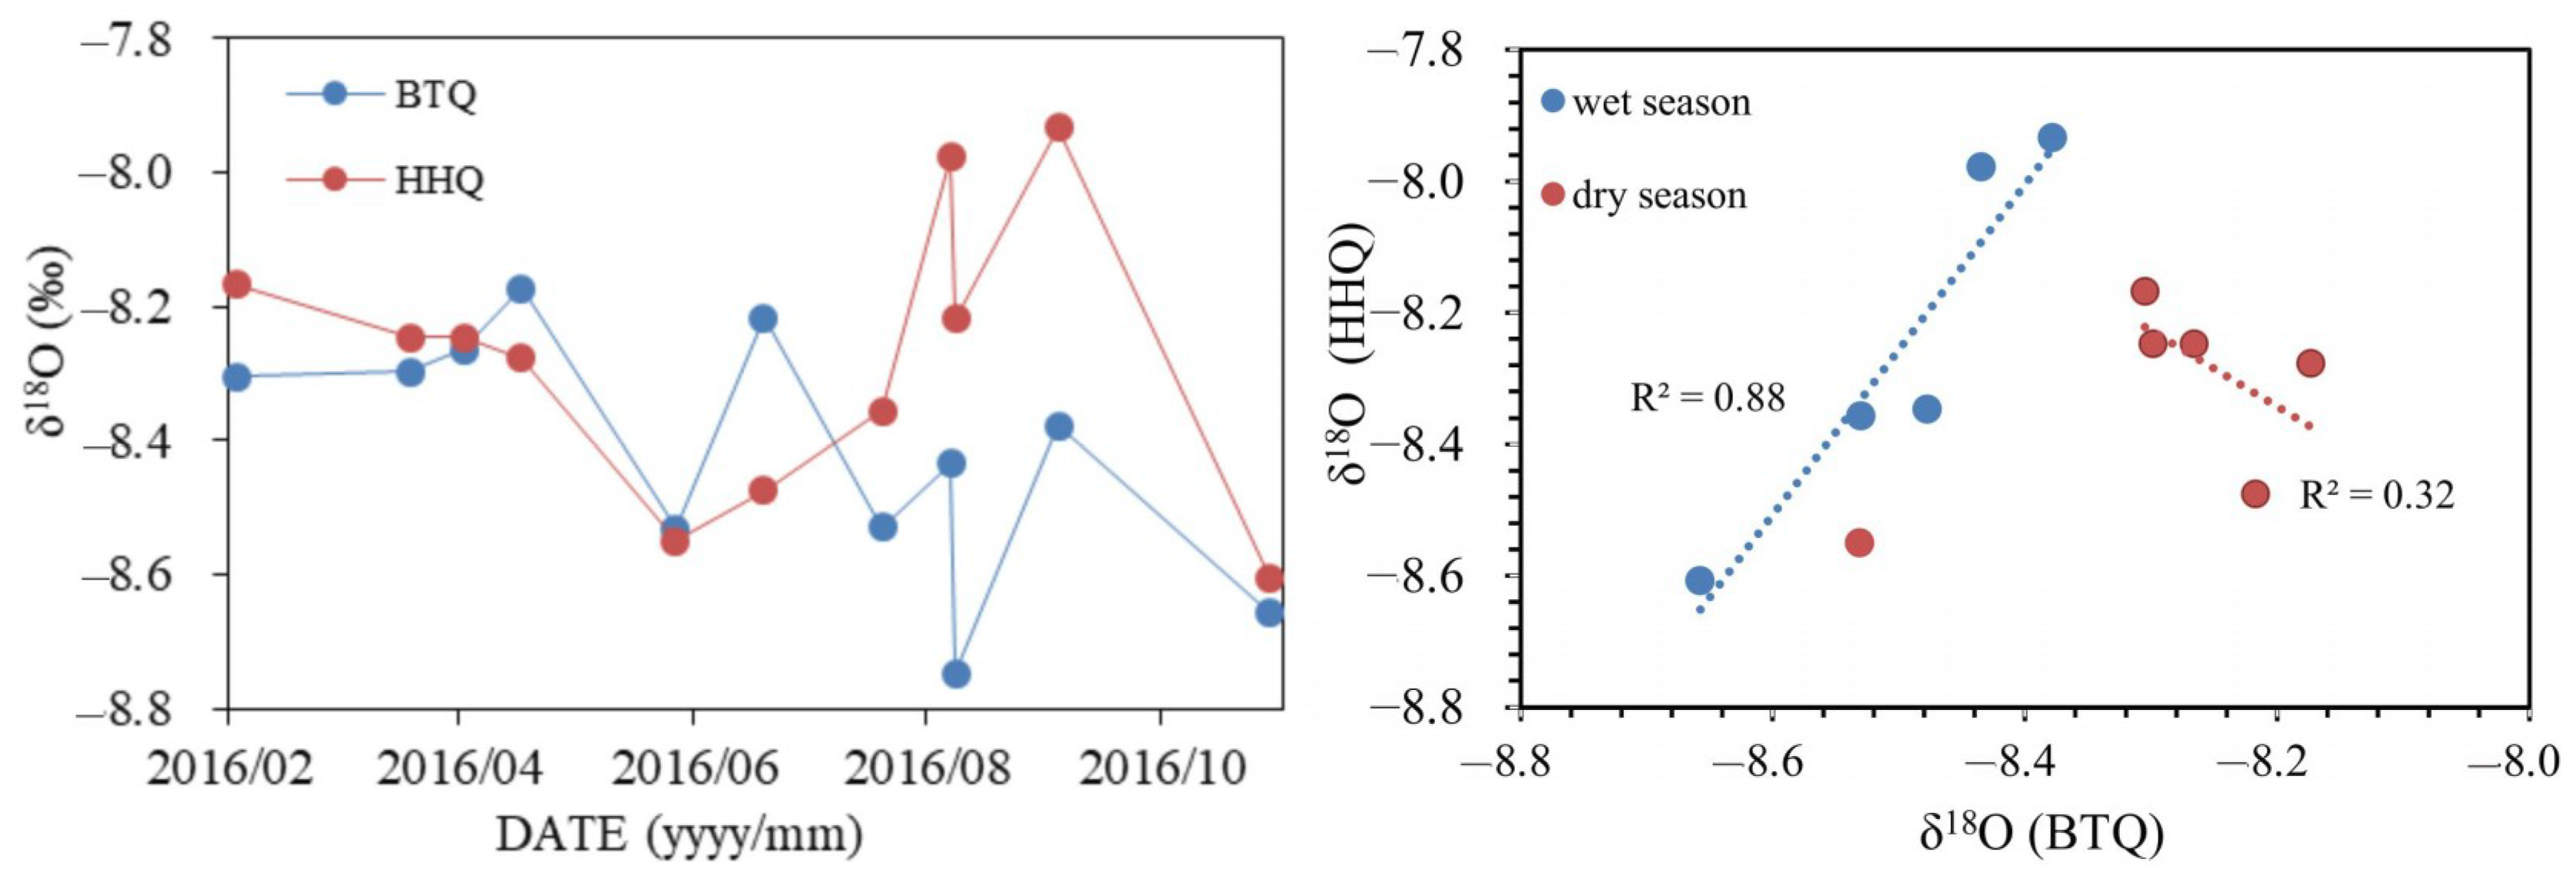
4.2. Stable Isotopes
5. Discussion
5.1. Recharge Sources
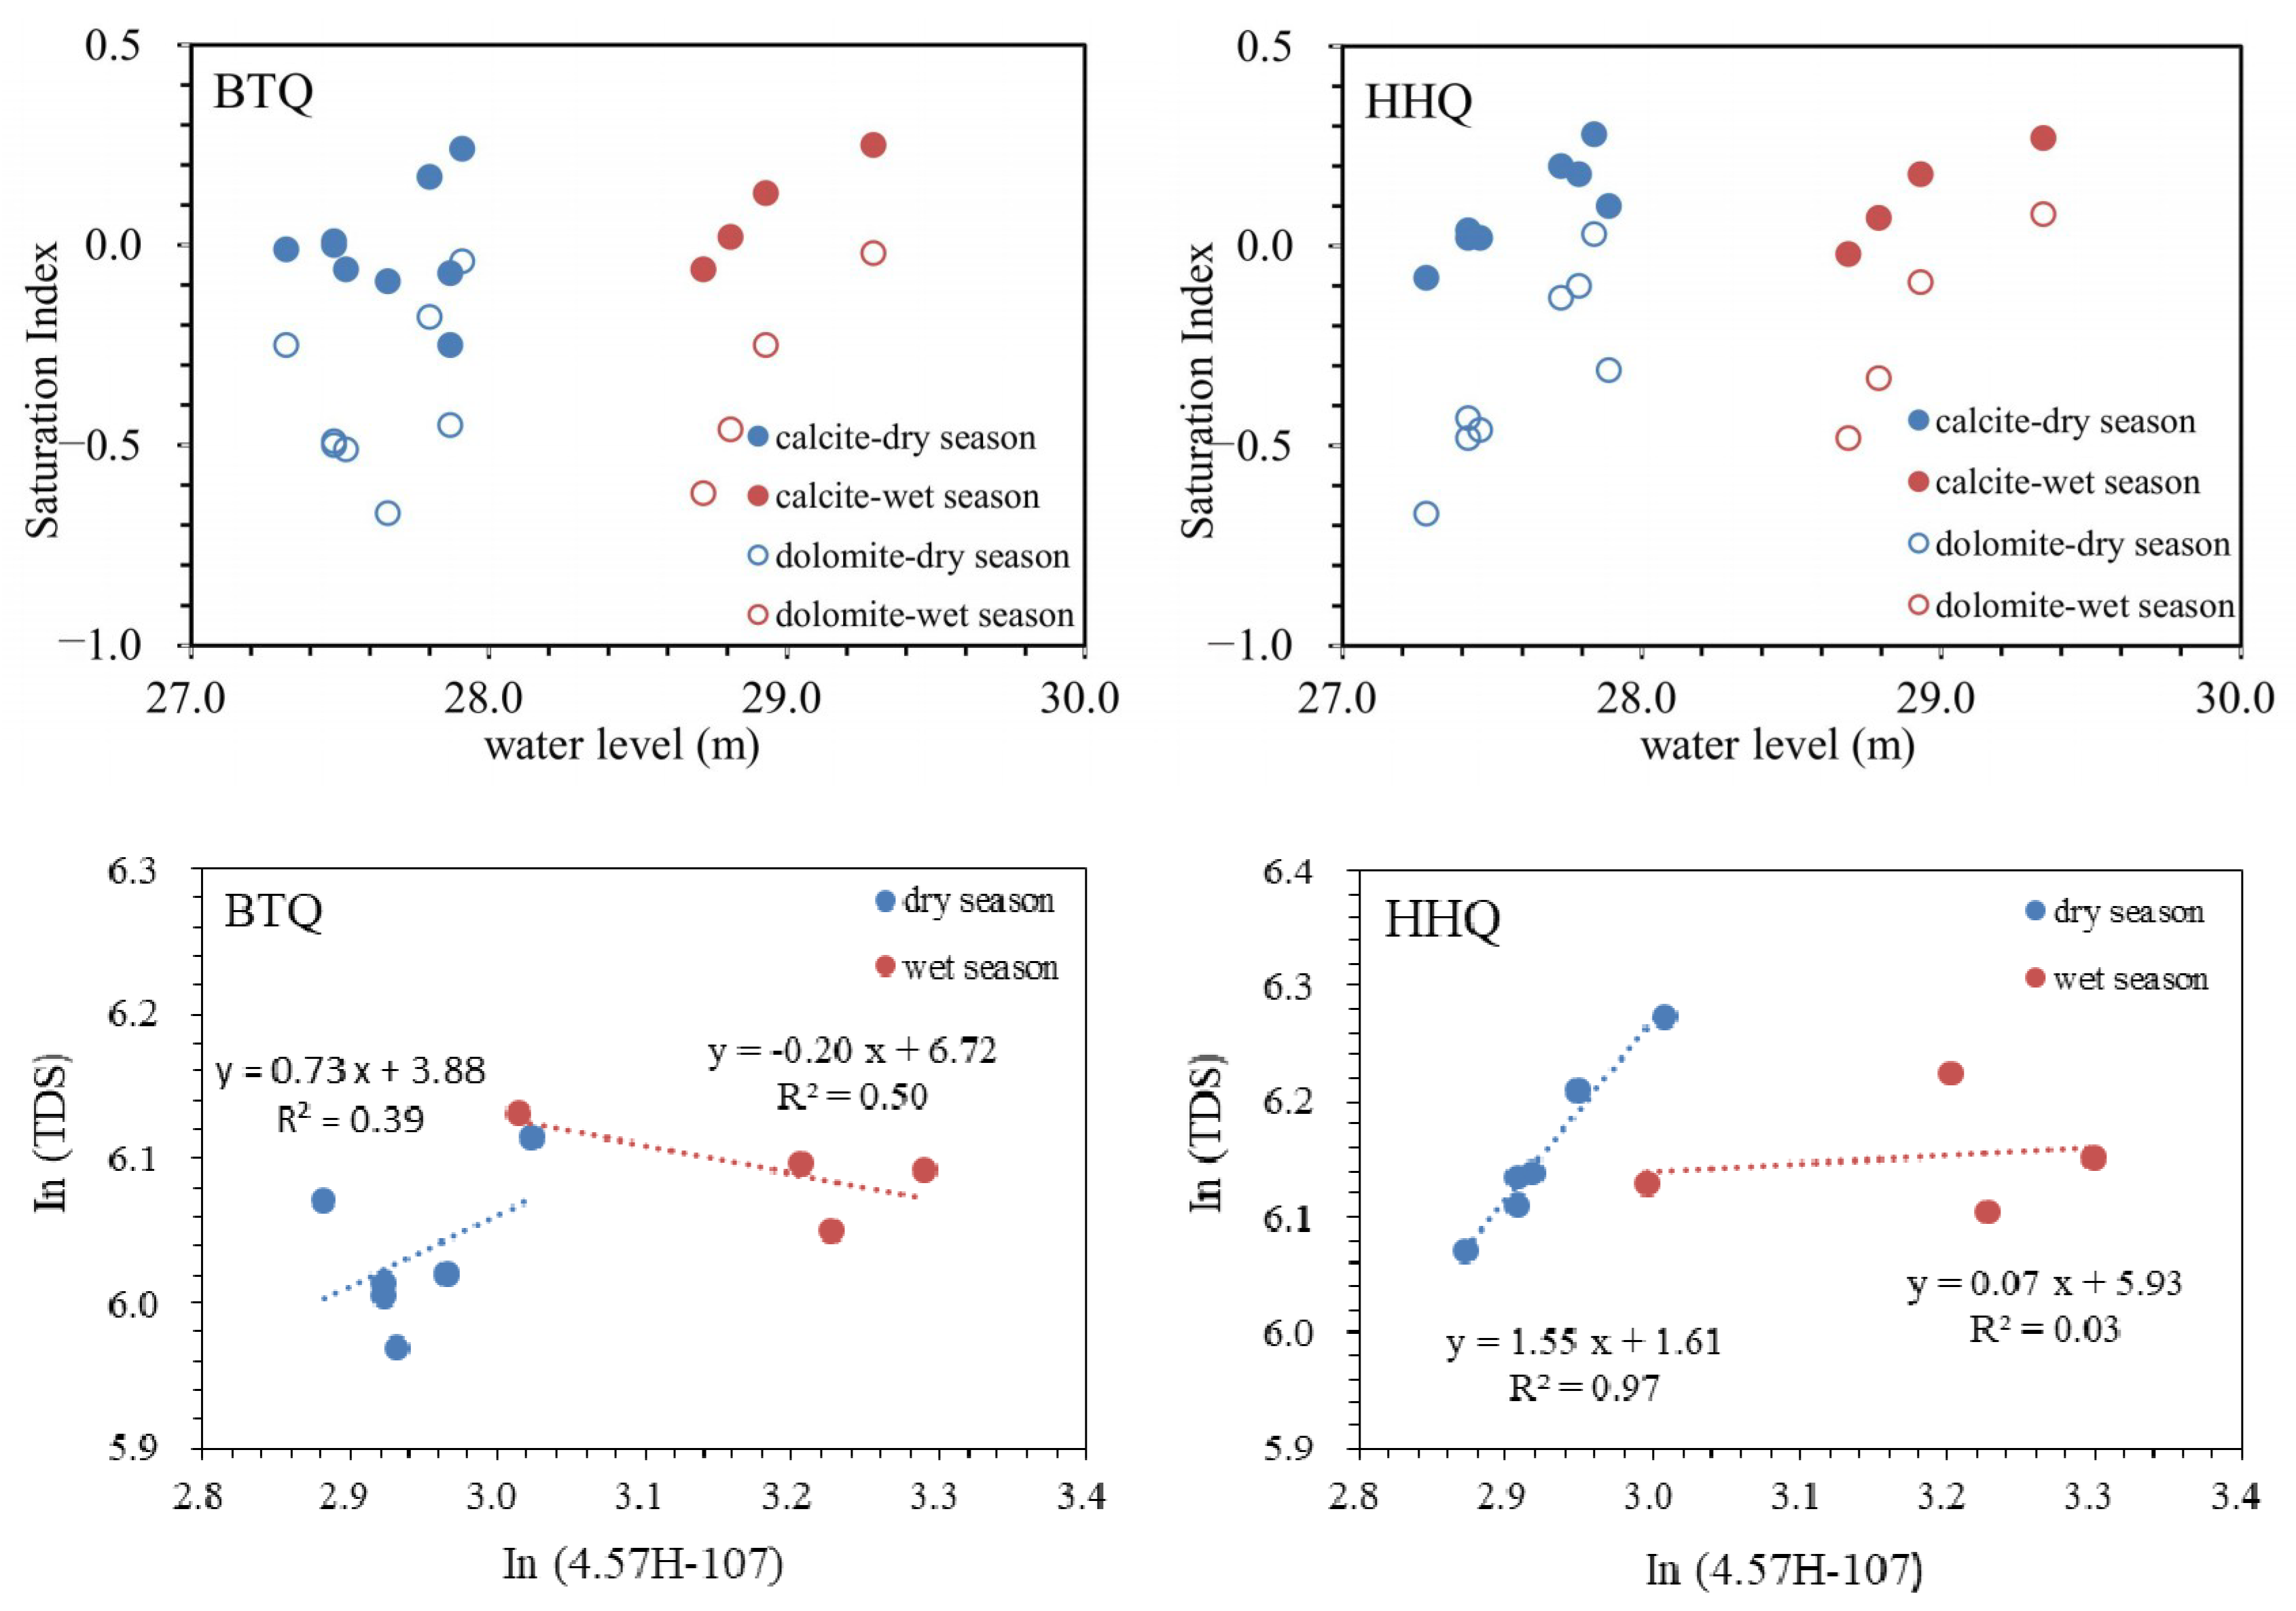
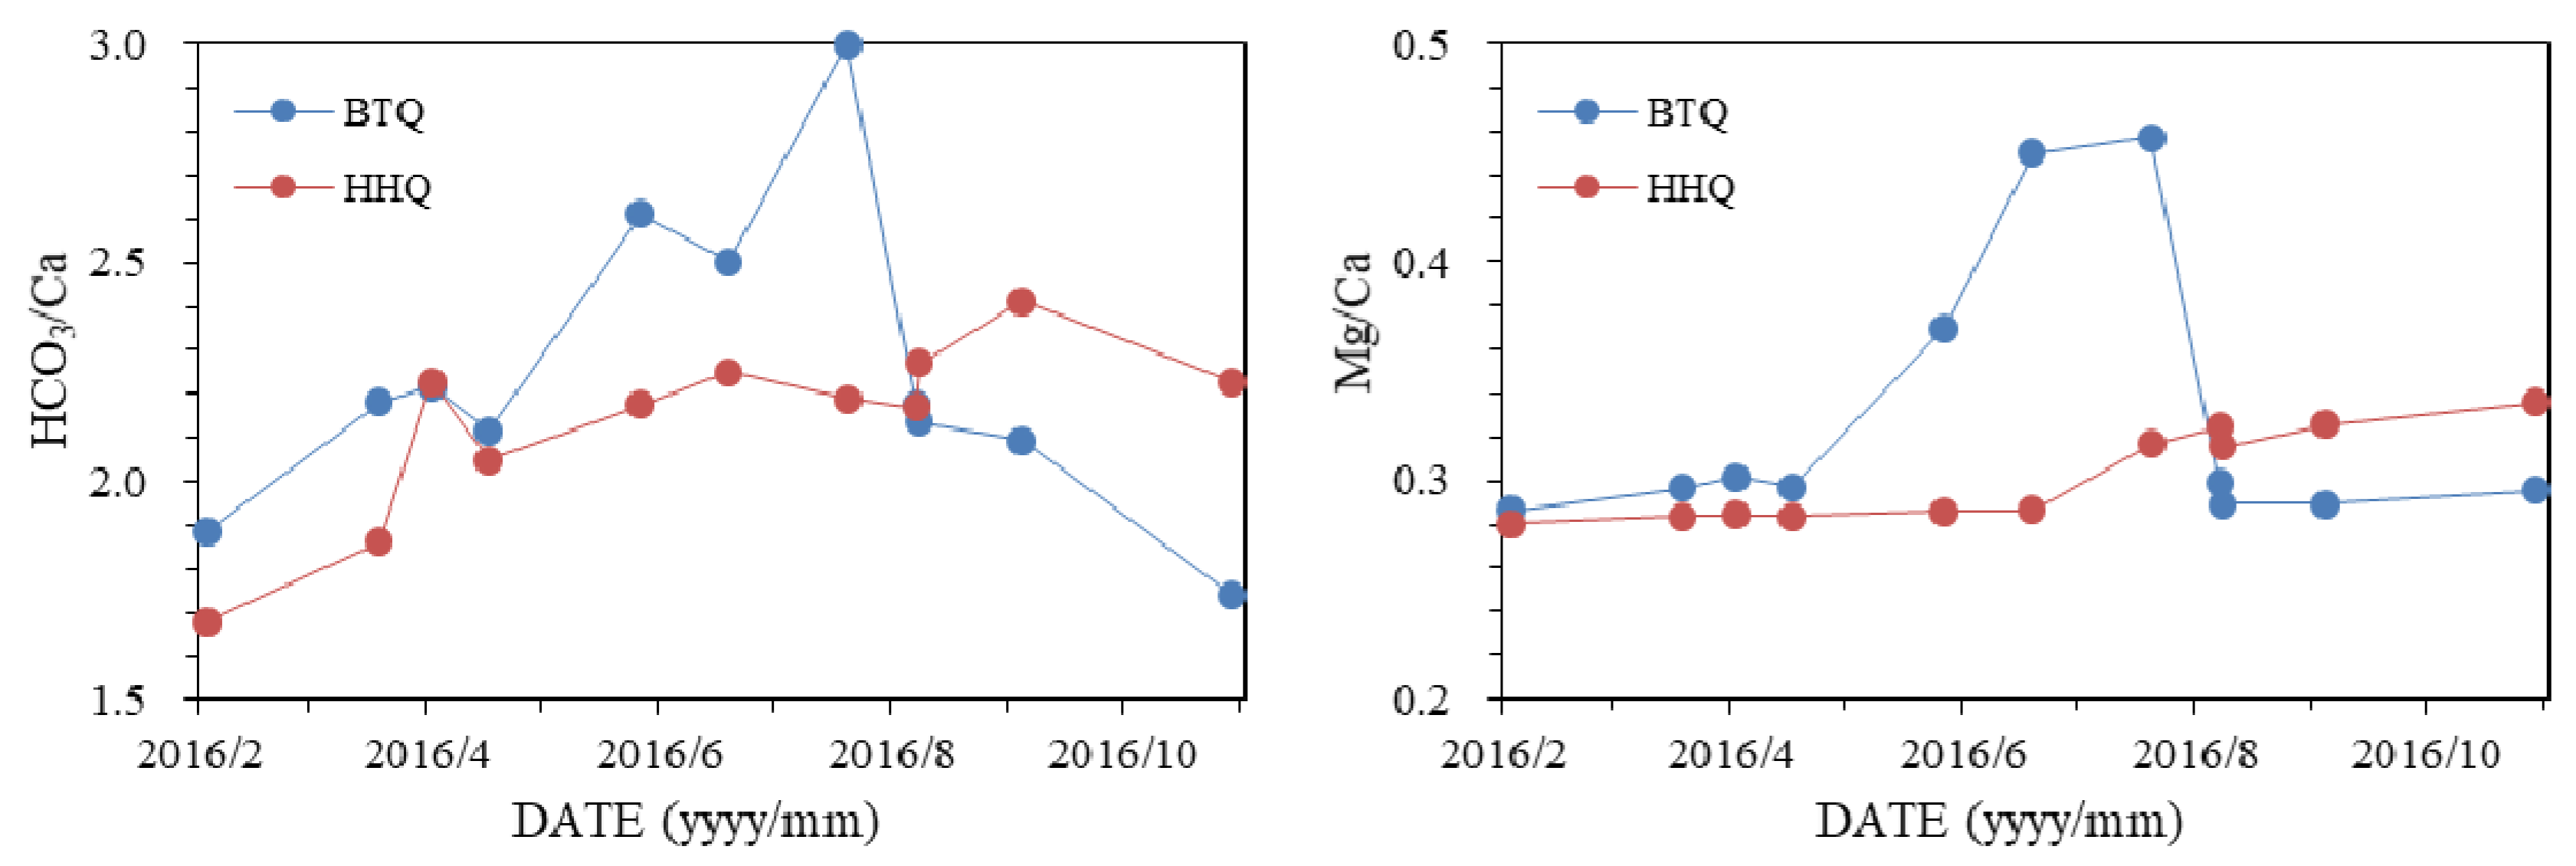
5.2. Hydrogeochemical Processes
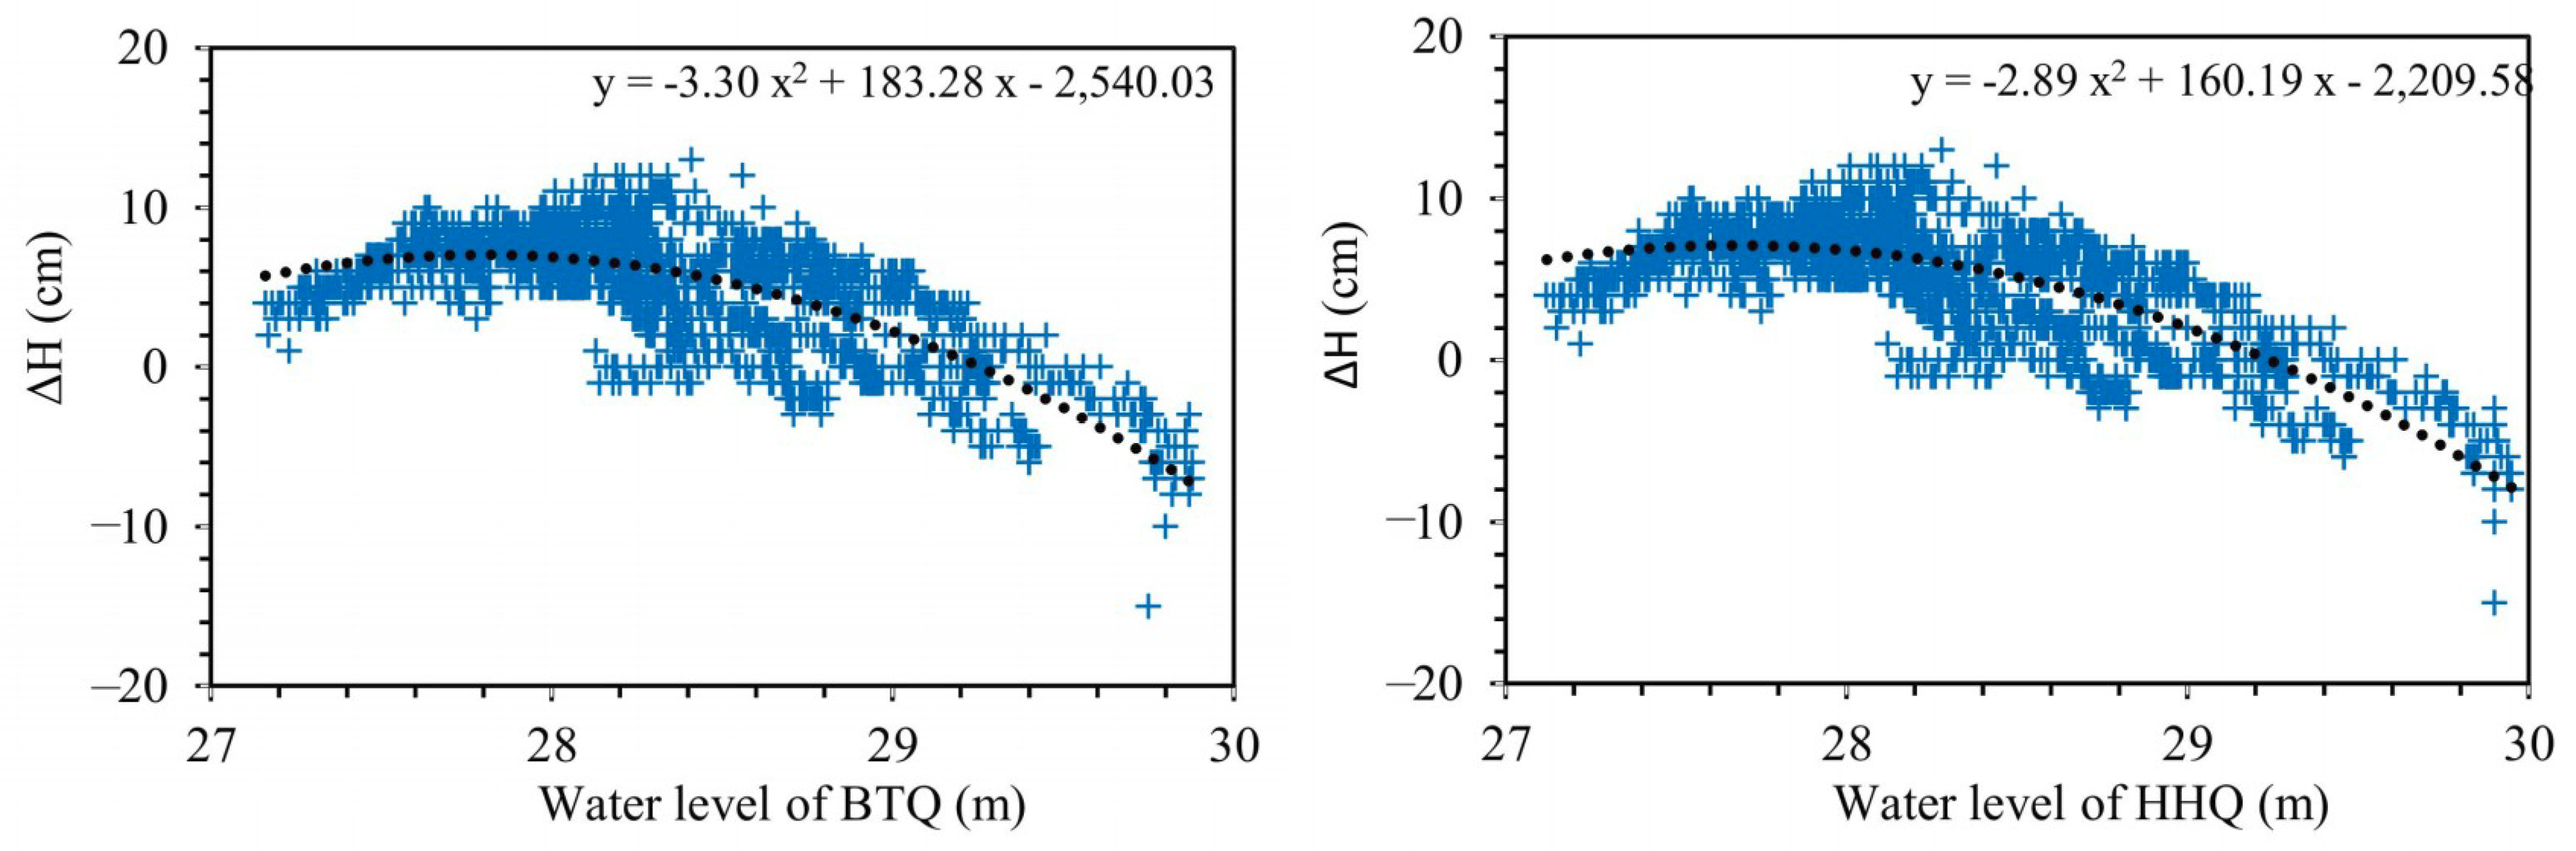
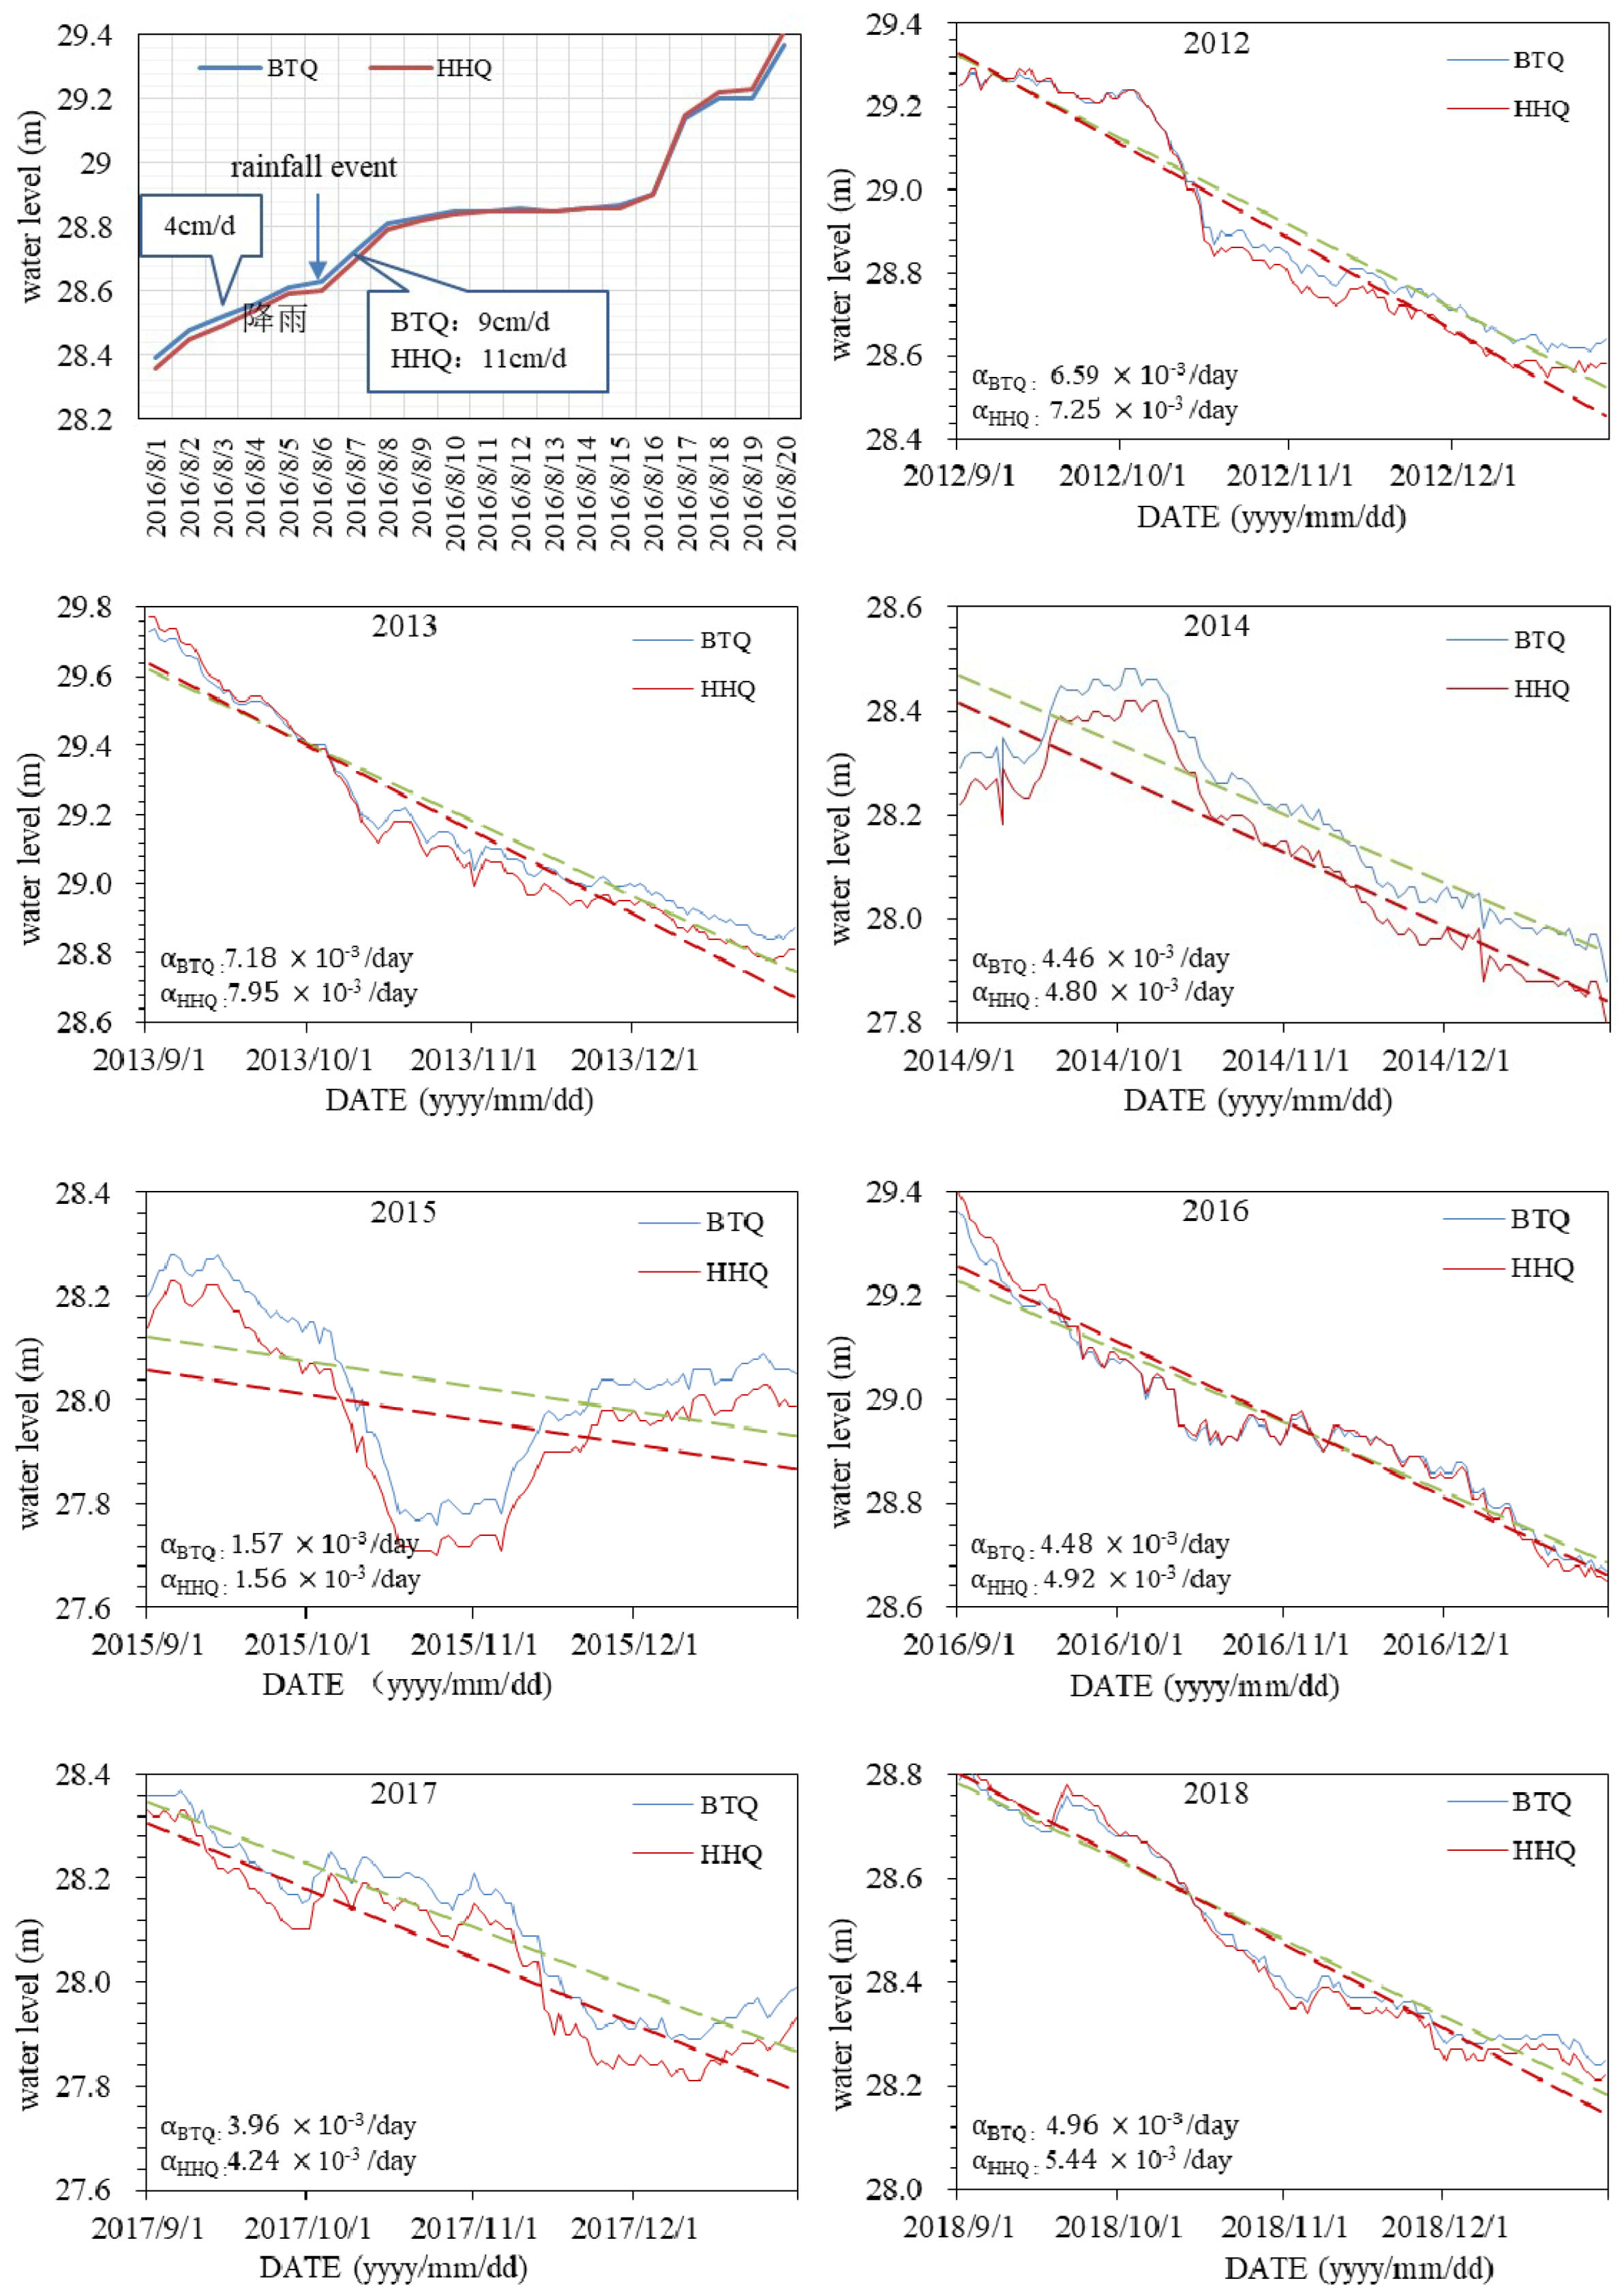
5.3. Spring Water Level Hydrodynamic Processes
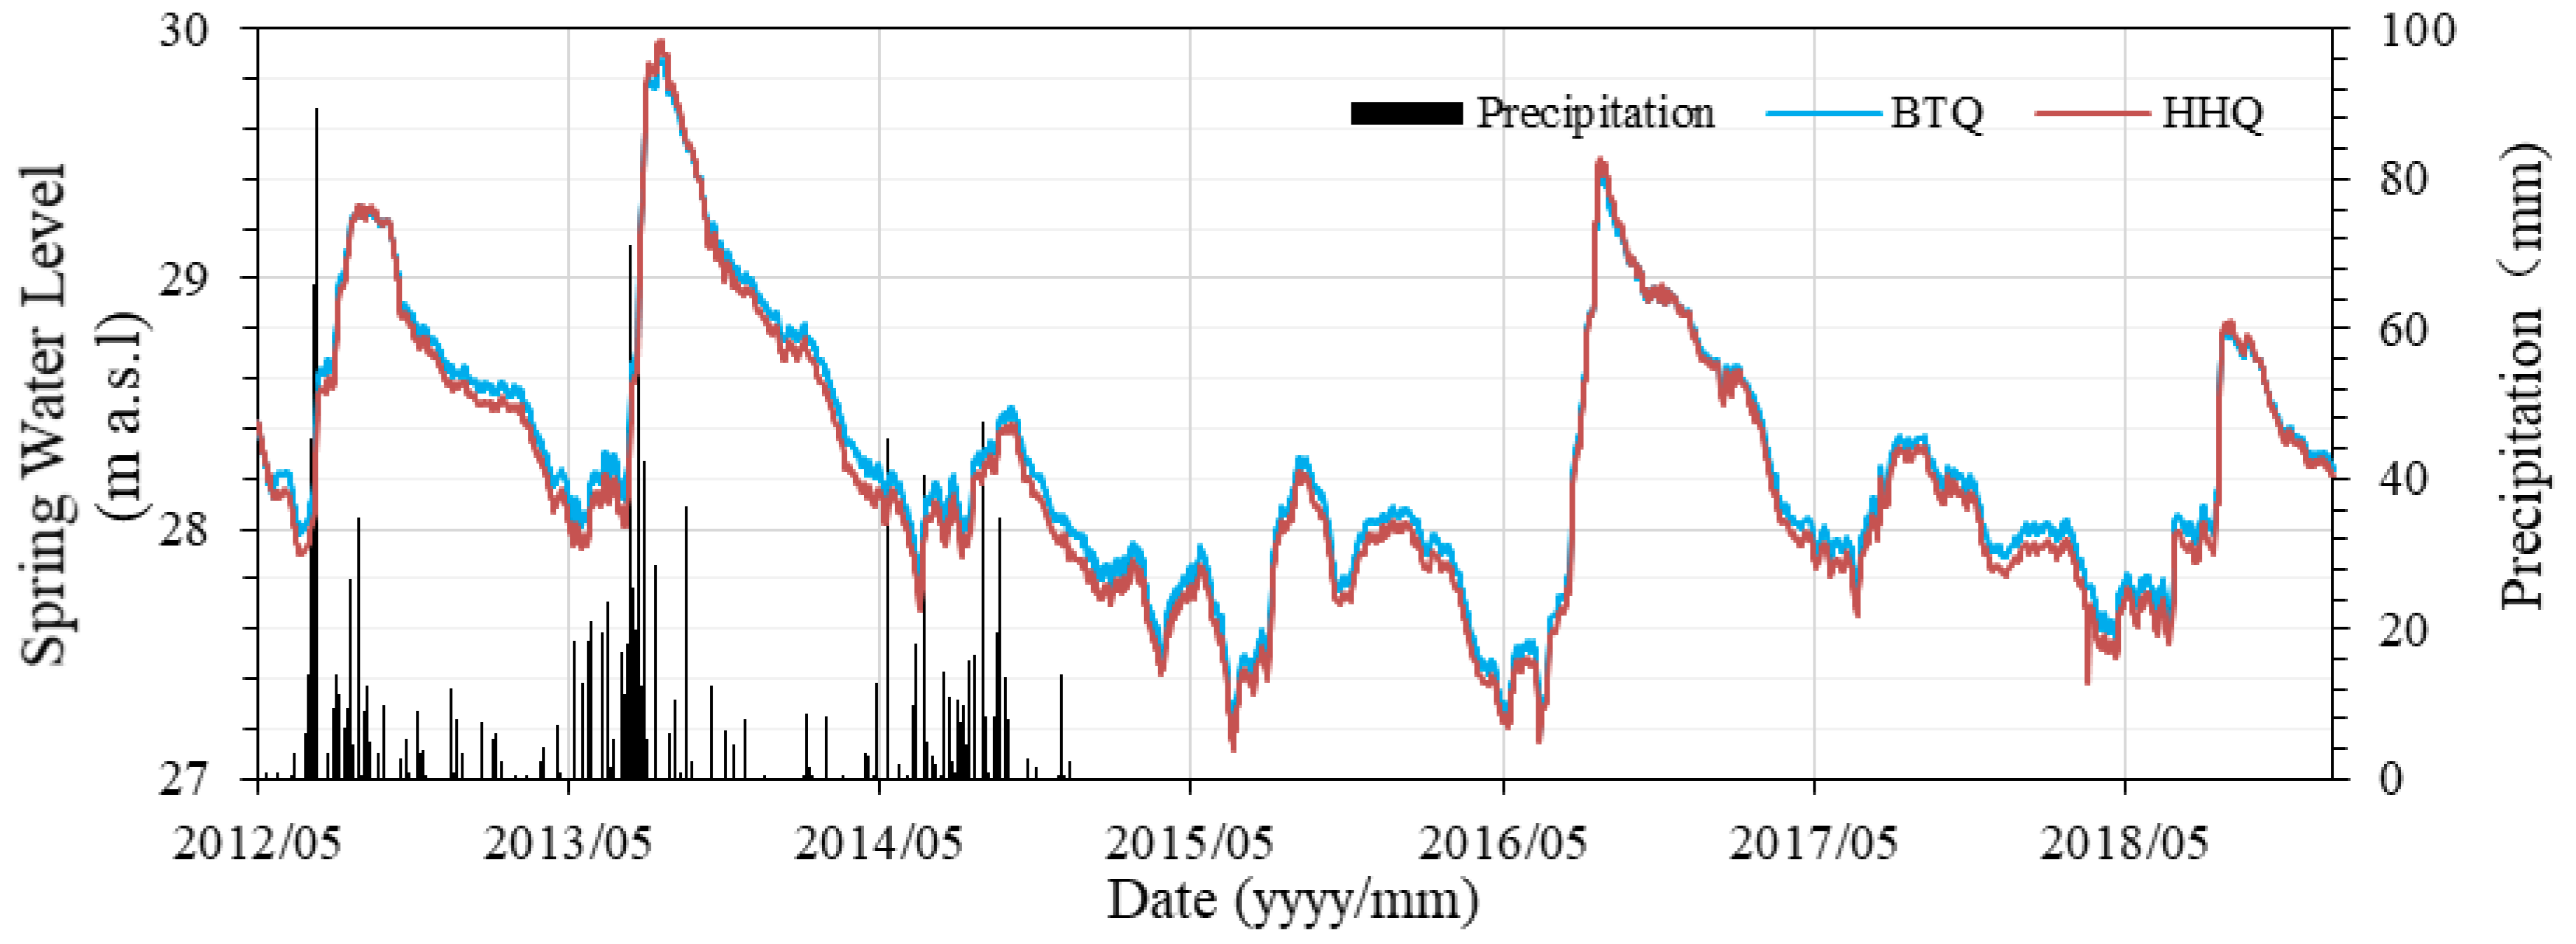
- At the water level between 27 m and 27.9 m, the water level of BTQ is higher than that of HHQ, and the water level difference (ΔH > 0) increases with the spring water level.
- At the water level between 27.9 m and 29 m, the water level of BTQ is also higher than that of HHQ, while the water level difference (ΔH > 0) decreases with the increase of spring water level.
- At the water level higher than 29 m, the water level of BTQ is lower than that of HHQ. At the same time the water level difference (ΔH < 0) increases with the increase of spring water level.
6. Conclusions
- The different temporal variations of hydrogeochemistry and stable isotope prove BTQ and HHQ have different recharge sources. BTQ is mainly recharged by precipitation and river water, while HHQ is mainly recharged by precipitation.
- The different relationship between spring water level and hydrogeochemistry reflect the different hydrogeochemical processes of BTQ and HHQ. Based on the ion ratios, the two springs experience different seasonal hydrogeochemical processes, more dolomite dissolution in the dry season and less dolomite dissolution in the wet season in BTQ compared to HHQ. In addition, the different seasonal variations of nitrate show BTQ is more sensitive to agriculture activities than HHQ.
- The two springs have different hydrodynamic conditions, caused by the vertical zoning of karstification. HHQ responses more quickly to a rainfall event and drains more quickly than BTQ, which results in the water level of BTQ being higher than HHQ in the dry season and lower in the wet season.
Author Contributions
Funding
Acknowledgments
Conflicts of Interest
References
- Ford, D.C.; Williams, P.W. Karst Hydrogeology and Geomorphology; John Wiley & Sons: Hoboken, NJ, USA, 2007. [Google Scholar]
- Hartmann, A.; Goldscheider, N.; Wagener, T.; Lange, J.; Weiler, M. Karst water resources in a changing world: Review of hydrological modeling approaches. Rev. Geophys. 2014, 52, 218–242. [Google Scholar] [CrossRef]
- Bakalowicz, M. Karst groundwater: A challenge for new resources. Hydrogeol. J. 2005, 13, 148–160. [Google Scholar] [CrossRef]
- White, W.B. Karst hydrology recent developments and open questions. Eng. Geol. 2002, 65, 85–105. [Google Scholar] [CrossRef]
- Smart, C.C. Artificial tracer techniques for the determination of the structure of conduit aquifers. Ground Water 1988, 26, 445–453. [Google Scholar] [CrossRef]
- Williams, P.W. The Role of the Subcutaneous Zone in Karst Hydrology. J. Hydrol. 1983, 61, 45–67. [Google Scholar] [CrossRef]
- Zeng, C.; Liu, Z.H.; Yang, J.W.; Yang, R. A groundwater conceptual model and karst-related carbon sink for a glacierized alpine karst aquifer, Southwestern China. J. Hydrol. 2015, 529, 120–133. [Google Scholar] [CrossRef]
- Jones, I.C.; Banner, J.L.; Humphrey, J.D. Estimating recharge in a tropical karst aquifer. Water Resour. Res. 2000, 36, 1289–1299. [Google Scholar] [CrossRef]
- Lee, J.-Y.; Lee, K.-K. Use of hydrologic time series data for identification of recharge mechanism in a fracture bedrock aquifer system. J. Hydrol. 2000, 229, 190–201. [Google Scholar] [CrossRef]
- Guo, Y.; Qin, D.; Sun, J.; Li, L.; Li, F.; Huang, J. Recharge of River Water to Karst Aquifer Determined by Hydrogeochemistry and Stable Isotopes. Water 2019, 11, 479. [Google Scholar] [CrossRef]
- Martin, J.B.; Dean, R.W. Exchange of water between conduits and matrix in the Floridan aquifer. Chem. Geol. 2001, 179, 145–165. [Google Scholar] [CrossRef]
- Massei, N.; Mahler, B.J.; Bakalowicz, M.; Fournier, M.; Dupont, J.P. Quantitative interpretation of specific conductance frequency distributions in karst. Ground Water 2007, 45, 288–293. [Google Scholar] [CrossRef]
- Aquilina, L.; Ladouche, B.; Doerfliger, N.; Bakalowicz, M. Deep water circulation, residence time, and chemistry in a karst complex. Ground Water 2003, 41, 790–805. [Google Scholar] [CrossRef] [PubMed]
- Wong, C.I.; Mahler, B.J.; Musgrove, M.; Banner, J.L. Changes in sources and storage in a karst aquifer during a transition from drought to wet conditions. J. Hydrol. 2012, 468, 159–172. [Google Scholar] [CrossRef]
- Hanshaw, B.B.; Back, W. Major Geochemical Processes in the Evolution of Carbonate-Aquifer Systems. J. Hydrol. 1979, 43, 287–312. [Google Scholar] [CrossRef]
- Marfia, A.M.; Krishnamurthy, R.V.; Atekwana, E.A.; Panton, W.F. Isotopic and geochemical evolution of ground and surface waters in a karst dominated geological setting: A case study from Belize, Central America. Appl. Geochem. 2004, 19, 937–946. [Google Scholar] [CrossRef]
- Ma, R.; Wang, Y.X.; Sun, Z.Y.; Zheng, C.M.; Ma, T.; Prommer, H. Geochemical evolution of groundwater in carbonate aquifers in Taiyuan, northern China. Appl. Geochem. 2011, 26, 884–897. [Google Scholar] [CrossRef]
- Katz, B.G.; Coplen, T.B.; Bullen, T.D.; Davis, J.H. Use of chemical and isotopic tracers to characterize the interactions between ground water and surface water in mantled karst. Ground Water 1997, 35, 1014–1028. [Google Scholar] [CrossRef]
- Katz, B.G.; Catches, J.S.; Bullen, T.D.; Michel, R.L. Changes in the isotopic and chemical composition of ground water resulting from a recharge pulse from a sinking stream. J. Hydrol. 1998, 211, 178–207. [Google Scholar] [CrossRef]
- Wang, Y.; Ma, T.; Luo, Z. Geostatistical and geochemical analysis of surface water leakage into groundwater on a regional scale: A case study in the Liulin karst system, northwestern China. J. Hydrol. 2001, 246, 223–234. [Google Scholar] [CrossRef]
- Zheng, X.Q.; Zang, H.F.; Zhang, Y.B.; Chen, J.F.; Zhang, F.; Shen, Y. A Study of Hydrogeochemical Processes on Karst Groundwater Using a Mass Balance Model in the Liulin Spring Area, North China. Water 2018, 10, 903. [Google Scholar] [CrossRef]
- Barbieri, M.; Boschetti, T.; Petitta, M.; Tallini, M. Stable isotope (H-2, O-18 and Sr-87/Sr-86) and hydrochemistry monitoring for groundwater hydrodynamics analysis in a karst aquifer (Gran Sasso, Central Italy). Appl. Geochem. 2005, 20, 2063–2081. [Google Scholar] [CrossRef]
- Panagopoulos, G.; Lambrakis, N. The contribution of time series analysis to the study of the hydrodynamic characteristics of the karst systems: Application on two typical karst aquifers of Greece (Trifilia, Almyros Crete). J. Hydrol. 2006, 329, 368–376. [Google Scholar] [CrossRef]
- Qin, D.J.; Zhao, Z.F.; Guo, Y.; Liu, W.C.; Haji, M.; Wang, X.H.; Xin, B.D.; Li, Y.; Yang, Y. Using hydrochemical, stable isotope, and river water recharge data to identify groundwater flow paths in a deeply buried karst system. Hydrol. Process. 2017, 31, 4297–4314. [Google Scholar] [CrossRef]
- Ma, T.; Wang, Y.; Guo, Q. Response of carbonate aquifer to climate change in northern China: A case study at the Shentou karst springs. J. Hydrol. 2004, 297, 274–284. [Google Scholar] [CrossRef]
- Zhang, J.; Hao, Y.H.; Hu, B.X.; Huo, X.L.; Hao, P.M.; Liu, Z.F. The effects of monsoons and climate teleconnections on the Niangziguan Karst Spring discharge in North China. Clim. Dyn. 2017, 48, 53–70. [Google Scholar] [CrossRef]
- Neilson, B.T.; Tennant, H.; Stout, T.L.; Miller, M.P.; Gabor, R.S.; Jameel, Y.; Millington, M.; Gelderloos, A.; Bowen, G.J.; Brooks, P.D. Stream Centric Methods for Determining Groundwater Contributions in Karst Mountain Watersheds. Water Resour. Res. 2018, 54, 6708–6724. [Google Scholar] [CrossRef]
- Hartmann, A.; Weiler, M.; Wagener, T.; Lange, J.; Kralik, M.; Humer, F.; Mizyed, N.; Rimmer, A.; Barbera, J.A.; Andreo, B.; et al. Process-based karst modelling to relate hydrodynamic and hydrochemical characteristics to system properties. Hydrol. Earth Syst. Sci. 2013, 17, 3305–3321. [Google Scholar] [CrossRef]
- Qiao, X.J.; Li, G.M.; Li, Y.P.; Liu, K. Influences of heterogeneity on three-dimensional groundwater flow simulation and wellhead protection area delineation in karst groundwater system, Taiyuan City, Northern China. Environ. Earth Sci. 2015, 73, 6705–6717. [Google Scholar] [CrossRef]
- De Rooij, R.; Graham, W. Generation of complex karstic conduit networks with a hydrochemical model. Water Resour. Res. 2017, 53, 6993–7011. [Google Scholar] [CrossRef]
- Scanlon, B.R.; Mace, R.E.; Barrett, M.E.; Smith, B. Can we simulate regional groundwater flow in a karst system using equivalent porous media models? Case study, Barton Springs Edwards aquifer, USA. J. Hydrol. 2003, 276, 137–158. [Google Scholar] [CrossRef]
- Aquilina, L.; Ladouche, B.; Dorfliger, N. Water storage and transfer in the epikarst of karstic systems during high flow periods. J. Hydrol. 2006, 327, 472–485. [Google Scholar] [CrossRef]
- Vardanjani, H.K.; Chitsazan, M.; Ford, D.; Karimi, H.; Charchi, A. Initial assessment of recharge areas for large karst springs: A case study from the central Zagros Mountains, Iran. Hydrogeol. J. 2018, 26, 57–70. [Google Scholar] [CrossRef]
- Moral, F.; Cruz-Sanjulian, J.J.; Olias, M. Geochemical evolution of groundwater in the carbonate aquifers of Sierra de Segura (Betic Cordillera, southern Spain). J. Hydrol. 2008, 360, 281–296. [Google Scholar] [CrossRef]
- Raeisi, E.; Karami, G. The governing factors of the physicochemical characteristics of Sheshpeer karst springs, Iran. Carbonate Evaporite 1996, 11, 162–168. [Google Scholar] [CrossRef]
- Aquilina, L.; Ladouche, B.; Dorfliger, N. Recharge processes in karstic systems investigated through the correlation of chemical and isotopic composition of rain and spring-waters. Appl. Geochem. 2005, 20, 2189–2206. [Google Scholar] [CrossRef]
- Mudarra, M.; Andreo, B.; Baker, A. Characterisation of dissolved organic matter in karst spring waters using intrinsic fluorescence: Relationship with infiltration processes. Sci. Total Environ. 2011, 409, 3448–3462. [Google Scholar] [CrossRef] [PubMed]
- Luo, M.M.; Chen, Z.H.; Zhou, H.; Zhang, L.; Han, Z.F. Hydrological response and thermal effect of karst springs linked to aquifer geometry and recharge processes. Hydrogeol. J. 2018, 26, 629–639. [Google Scholar] [CrossRef]
- Shuster, E.T.; White, W.B. Seasonal fluctuations in the chemistry of limestone springs: A possible means for characterizing carbonate aquifers. J. Hydrol. 1971, 14, 93–128. [Google Scholar] [CrossRef]
- Kingsbury, J.A. Relation between flow and temporal variations of nitrate and pesticides in two karst springs in northern Alabama. J. Am. Water Resour. Assoc. 2008, 44, 478–488. [Google Scholar] [CrossRef]
- Atkinson, T.C. Diffuseflow and conduit flow in limestone terrain in the Mendip Hills, Somerset (Great Britain). J. Hydrol. 1977, 35, 93–110. [Google Scholar] [CrossRef]
- Petelet-Giraud, E.; Luck, J.M.; Ben Othman, D.; Negrel, P. Dynamic scheme of water circulation in karstic aquifers as constrained by Sr and Pb isotopes. Application to the Herault watershed, Southern France. Hydrogeol. J. 2003, 11, 560–573. [Google Scholar] [CrossRef]
- Filippini, M.; Squarzoni, G.; De Waele, J.; Fiorucci, A.; Vigna, B.; Grillo, B.; Riva, A.; Rossetti, S.; Zini, L.; Casagrande, G.; et al. Differentiated spring behavior under changing hydrological conditions in an alpine karst aquifer. J. Hydrol. 2018, 556, 572–584. [Google Scholar] [CrossRef]
- Mudarra, M.; Andreo, B. Relative importance of the saturated and the unsaturated zones in the hydrogeological functioning of karst aquifers: The case of Alta Cadena (Southern Spain). J. Hydrol. 2011, 397, 263–280. [Google Scholar] [CrossRef]
- Bonacci, O. Karst Springs Hydrographs as Indicators of Karst Aquifers. Hydrol. Sci. J. 1993, 38, 51–62. [Google Scholar] [CrossRef]
- Padilla, A.; Pulidobosch, A.; Mangin, A. Relative Importance of Baseflow and Quickflow from Hydrographs of Karst Spring. Ground Water 1994, 32, 267–277. [Google Scholar] [CrossRef]
- Dreiss, S.J. Regional Scale Transport in a Karst Aquifer.1. Component Separation of Spring Flow Hydrographs. Water Resour. Res. 1989, 25, 117–125. [Google Scholar] [CrossRef]
- Dreiss, S.J. Linear Kernels for Karst Aquifers. Water Resour. Res. 1982, 18, 865–876. [Google Scholar] [CrossRef]
- Scanlon, B.R.; Thrailkill, J. Chemical Similarities among Physically Distinct Spring Types in a Karst Terrain. J. Hydrol. 1987, 89, 259–279. [Google Scholar] [CrossRef]
- Lakey, B.; Krothe, N.C. Stable isotopic variation of storm discharge from a perennial karst spring, Indiana. Water Resour. Res. 1996, 32, 721–731. [Google Scholar] [CrossRef]
- Kattan, Z. Environmental isotope study of the major karst springs in Damascus limestone aquifer systems: Case of the Figeh and Barada springs. J. Hydrol. 1997, 193, 161–182. [Google Scholar] [CrossRef]
- Koeniger, P.; Margane, A.; Abi-Rizk, J.; Himmelsbach, T. Stable isotope-based mean catchment altitudes of springs in the Lebanon Mountains. Hydrol. Process. 2017, 31, 3708–3718. [Google Scholar] [CrossRef]
- Lamban, L.J.; Jodar, J.; Custodio, E.; Soler, A.; Sapriza, G.; Soto, R. Isotopic and hydrogeochemical characterization of high-altitude karst aquifers in complex geological settings. The Ordesa and Monte Perdido National Park (Northern Spain) case study. Sci. Total Environ. 2015, 506, 466–479. [Google Scholar] [CrossRef]
- Ryan, M.; Meiman, J. An examination of short-term variations in water quality at a karst spring in Kentucky. Ground Water 1996, 34, 23–30. [Google Scholar] [CrossRef]
- Nativ, R.; nay, G.G.; Hotzl, H.; Reichert, B.; Solomon, D.K.; Tezcan, L. Separation of groundwater-flow components in a karstified aquifer using environmental tracers. Appl. Geochem. 1999, 14, 1001–1014. [Google Scholar] [CrossRef]
- Qian, J.Z.; Zhan, H.B.; Wu, Y.F.; Li, F.L.; Wang, J.Q. Fractured-karst spring-flow protections: A case study in Jinan, China. Hydrogeol. J. 2006, 14, 1192–1205. [Google Scholar] [CrossRef]
- Kang, F.X.; Jin, M.G.; Qin, P.R. Sustainable yield of a karst aquifer system: A case study of Jinan springs in northern China. Hydrogeol. J. 2011, 19, 851–863. [Google Scholar] [CrossRef]
- Chi, G.; Xing, L.; Zhu, H. The study of quantitatve relationship between the spring water and the dynamic change of the atmospheric precipitation in Jinan. Ground Water 2017, 39, 8–11. [Google Scholar]
- Qi, X.F.; Wang, Y.S.; Yang, L.Z.; Liu, Z.Y.; Wang, W.; Li, W.P. Time lag variance of groundwater level response to precipitation of Jinan karst spring watershed in recent 50 years. Carsol. Sin. 2016, 35, 384–393. [Google Scholar]
- Xu, H.Z.; Duan, X.M.; Gao, Z.D.; Wang, Q.B.; Li, W.P.; Yin, X.L. Hydrochemical study of karst groundwater in the Jinan spring catchment. Hydrogeol. Eng. Geol. 2007, 3, 15–19. [Google Scholar]
- Sun, B.; Peng, Y. Boundary condition, water cycle and water environment changes in the Jinan spring region. Carsol. Sin. 2014, 33, 272–279. [Google Scholar]
- Wu, X.; Niu, J.; Niu, J. Experimental research on artificial compensation in Yufu River for groundwater to protect springs. Water Resour. Power 2003, 21, 53–55. [Google Scholar]
- Li, B.; Qin, D.; Guo, Y.; Liu, W.; Haji, M.; Lin, L.; Guan, Q. Effect of Yufu River on chemical processes of karst groundwater in Jinan, Shandong Province. J. Eng. Geol. 2017, 25, 190–198. [Google Scholar]
- Zhou, J. Research on Seepage Field Characteristics of Discharge Area in Jinan Karst Springs. Master’s Thesis, University of Jinan, Jinan, China, 2016. [Google Scholar]
- Wang, J.L.; Jin, M.G.; Lu, G.P.; Zhang, D.; Kang, F.X.; Jia, B.J. Investigation of discharge-area groundwaters for recharge source characterization on different scales: The case of Jinan in northern China. Hydrogeol. J. 2016, 24, 1723–1737. [Google Scholar] [CrossRef]
- Partkhurst, D.L.; Appelo, C.A.J. User’s Guide to PHREEQC (Version 2): A Computer Program for Speciation, Batch-Reaction, One-Dimensional Transport and Inverse Geochemical Calculations; United States Geological Survey: Reston, VA, USA, 1999.
- Appelo, C.A.J. Geochemistry, Groundwater and Pollution; CRC Press: Amsterdam, The Netherlands, 2005. [Google Scholar]
- Craig, H. Isotopic Variations in Meteoric Waters. Science 1961, 133, 1702–1703. [Google Scholar] [CrossRef]
- Grasso, D.A.; Jeannin, P.Y. A global experimental system approach of karst springs’ hydrographs and chemographs. Ground Water 2002, 40, 608–617. [Google Scholar] [CrossRef] [PubMed]
- Birk, S.; Hergarten, S. Early recession behaviour of spring hydrographs. J. Hydrol. 2010, 387, 24–32. [Google Scholar] [CrossRef]


| Spring | EC | HCO3− | SO42− | NO3− | Cl− | Ca2+ | Mg2+ | Na+ | K+ | δ18O | δ2H | |
|---|---|---|---|---|---|---|---|---|---|---|---|---|
| BTQ n = 13 | Max | 872.0 | 307.2 | 105.9 | 44.6 | 59.4 | 101.3 | 17.6 | 45.7 | 2.7 | −8.17 | −59.36 |
| Min | 753.0 | 241.7 | 70.4 | 18.2 | 34.5 | 63.3 | 13.3 | 16.3 | 0.9 | −8.75 | −61.33 | |
| Mean | 788.2 | 276.7 | 84.4 | 33.4 | 42.5 | 83.8 | 15.8 | 24.0 | 1.3 | −8.41 | −60.19 | |
| St.D | 29.4 | 17.4 | 10.4 | 8.3 | 7.5 | 12.2 | 1.1 | 9.3 | 0.6 | 0.17 | 0.65 | |
| C.V | 4.0 | 6.0 | 12.0 | 25.0 | 18.0 | 15.0 | 7.0 | 39.0 | 46.0 | 1.98 | 1.08 | |
| HHQ n = 13 | Max | 901.0 | 316.2 | 107.7 | 57.5 | 57.8 | 116.1 | 19.6 | 38.8 | 1.8 | −7.93 | −55.76 |
| Min | 814.0 | 282.4 | 80.7 | 30.5 | 39.7 | 83.7 | 14.8 | 21.7 | 0.9 | −8.61 | −61.06 | |
| Mean | 860.5 | 297.1 | 94.5 | 40.3 | 49.0 | 93.7 | 16.6 | 28.5 | 1.2 | −8.29 | −59.12 | |
| St.D | 3.0 | 4.0 | 9.0 | 20.0 | 11.0 | 11.0 | 7.0 | 20.0 | 29.0 | 0.19 | 1.39 | |
| C.V | 0.0 | 0.0 | 0.1 | 0.2 | 0.1 | 0.1 | 0.1 | 0.2 | 0.3 | 2.27 | 2.35 | |
| WLT n = 12 | Max | 786.0 | 333.2 | 84.1 | 38.8 | 45.9 | 84.3 | 15.9 | 33.1 | 1.3 | −8.11 | −58.17 |
| Min | 665.0 | 223.4 | 58.8 | 23.7 | 22.0 | 57.8 | 13.2 | 12.8 | 0.7 | −8.99 | −62.51 | |
| Mean | 709.3 | 277.9 | 69.1 | 28.9 | 31.5 | 74.0 | 14.6 | 19.1 | 1.0 | −8.43 | −60.25 | |
| St.D | 37.9 | 25.1 | 7.6 | 3.8 | 6.2 | 7.6 | 0.8 | 6.6 | 0.2 | 0.21 | 0.98 | |
| C.V | 5.0 | 9.0 | 11.0 | 13.0 | 20.0 | 10.0 | 5.0 | 35.0 | 20.0 | 2.45 | 1.63 | |
| ZZQ n = 12 | Max | 995.0 | 279.1 | 144.1 | 36.9 | 82.4 | 88.6 | 19.8 | 70.0 | 2.3 | −7.66 | −57.03 |
| Min | 655.0 | 213.6 | 61.1 | 13.7 | 25.5 | 50.1 | 13.7 | 14.8 | 0.9 | −8.66 | −61.06 | |
| Mean | 740.7 | 255.2 | 76.9 | 26.2 | 36.6 | 69.2 | 15.2 | 24.3 | 1.3 | −8.20 | −59.26 | |
| St.D | 96.7 | 17.8 | 23.6 | 5.6 | 16.1 | 10.3 | 1.7 | 16.1 | 0.4 | 0.25 | 1.09 | |
| C.V | 13.0 | 7.0 | 31.0 | 21.0 | 44.0 | 15.0 | 11.0 | 66.0 | 30.0 | 3.04 | 1.84 | |
| YF | Mean | 549 | 112.9 | 134.3 | 8.7 | 38.4 | 51.1 | 18.0 | 25.3 | 2.75 | −6.0 | −10.7 |
| Rain | Mean | - | 39.5 | 2.7 | 1.9 | 6.7 | 0.25 | 2.3 | 3.0 | 3.5 | −46.4 | −73.7 |
© 2019 by the authors. Licensee MDPI, Basel, Switzerland. This article is an open access article distributed under the terms and conditions of the Creative Commons Attribution (CC BY) license (http://creativecommons.org/licenses/by/4.0/).
Share and Cite
Guo, Y.; Qin, D.; Li, L.; Sun, J.; Li, F.; Huang, J. A Complicated Karst Spring System: Identified by Karst Springs Using Water Level, Hydrogeochemical, and Isotopic Data in Jinan, China. Water 2019, 11, 947. https://doi.org/10.3390/w11050947
Guo Y, Qin D, Li L, Sun J, Li F, Huang J. A Complicated Karst Spring System: Identified by Karst Springs Using Water Level, Hydrogeochemical, and Isotopic Data in Jinan, China. Water. 2019; 11(5):947. https://doi.org/10.3390/w11050947
Chicago/Turabian StyleGuo, Yi, Dajun Qin, Lu Li, Jie Sun, Fulin Li, and Jiwen Huang. 2019. "A Complicated Karst Spring System: Identified by Karst Springs Using Water Level, Hydrogeochemical, and Isotopic Data in Jinan, China" Water 11, no. 5: 947. https://doi.org/10.3390/w11050947
APA StyleGuo, Y., Qin, D., Li, L., Sun, J., Li, F., & Huang, J. (2019). A Complicated Karst Spring System: Identified by Karst Springs Using Water Level, Hydrogeochemical, and Isotopic Data in Jinan, China. Water, 11(5), 947. https://doi.org/10.3390/w11050947