Article

Recent and Future Changes in Rainfall Erosivity and Implications for the Soil Erosion Risk in Brandenburg, NE Germany

1
Leibniz-Institute of Freshwater Ecology and Inland Fisheries, 12489 Berlin, Germany
2
Department of Hydrology and Water Resources Management, Christian-Albrechts-University Kiel, 24118 Kiel, Germany
3
Leibniz Centre for Agricultural Landscape Research, 15374 Müncheberg, Germany
4
Department of Geography, Humboldt-University of Berlin, 12489 Berlin, Germany
*
Author to whom correspondence should be addressed.
Water 2019, 11(5), 904; https://doi.org/10.3390/w11050904
Submission received: 15 April 2019 / Revised: 26 April 2019 / Accepted: 26 April 2019 / Published: 29 April 2019
(This article belongs to the Special Issue Soil Hydrology for a Sustainable Land Management: Theory and Practice)

Abstract

:
The universal soil loss equation (USLE) is widely used to identify areas of erosion risk at regional scales. In Brandenburg, USLE R factors are usually estimated from summer rainfall, based on a relationship from the 1990s. We compared estimated and calculated factors of 22 stations with 10-min rainfall data. To obtain more realistic estimations, we regressed the latter to three rainfall indices (total and heavy-rainfall sums). These models were applied to estimate future R factors of 188 climate stations. To assess uncertainties, we derived eight scenarios from 15 climate models and two representative concentration pathways (RCP), and compared the effects of index choice to the choices of climate model, RCP, and bias correction. The existing regression model underestimated the calculated R factors by 40%. Moreover, using heavy-rainfall sums instead of total sums explained the variability of current R factors better, increased their future changes, and reduced the model uncertainty. The impact of index choice on future R factors was similar to the other choices. Despite all uncertainties, the results indicate that average R factors will remain above past values. Instead, the extent of arable land experiencing excessive soil loss might double until the mid-century with RCP 8.5 and unchanged land management.

1. Introduction

Soils are a fundamental resource for life on Earth and provide numerous goods and services for the human society [1]. The degradation of soils poses a global threat to our well-being, mainly due to soil erosion by water [2,3] (henceforth soil erosion) exceeding the ‘tolerable’ natural formation rate of around 1 t ha−1 a−1 [4]. Among other consequences, soil erosion can hamper the sustainable agricultural production [5], impair water quality and habitats [6,7], and reduce the lifetime of reservoirs [8].
Unsustainable agriculture is a key driver of soil erosion, not only in Europe [3,9,10], especially when heavy rainfall meets inappropriate management. To mitigate agricultural impacts on soils, the Common Agricultural Policy (CAP) of the European Union introduced the Good Agricultural and Environmental Conditions (GAEC) in 2003 as a set of environmental standards and rules on cross compliance for financially supported farmers. Accordingly, German laws and regulations on both federal and state levels address soil erosion, not only to implement the GAEC, but also within the European Water Framework Directive.
To estimate potential soil erosion, derivatives of the universal soil loss equation (USLE) are commonly used. For instance, German federal states apply an adapted version of the USLE [11,12] to identify areas prone to soil loss and to impose countermeasures on farmers. The USLE estimates the soil erosion rate from five factors, namely rainfall erosivity (R factor), soil erodibility (K factor), slope length and steepness (LS factor), soil cover (C factor), and soil conservation (P factor).
The R factor of the USLE is the long-term average annual sum of the rainfall erosivity. The erosivity expresses the capacity of a rainfall to induce soil erosion and integrates its duration, amount, and intensity (cf. Appendix A, also for the units of the USLE factors). The calculation of R factors requires long time series of precipitation data at high temporal resolution which are often unavailable. Many studies thus rely on daily to annual data for extrapolation in space and time [13,14,15]. Accordingly, the German industrial norm (DIN) on soil erosion [11] lists linear regression models to estimate R factors from summer or annual rainfall. While they were derived at the state level, the explained variability of the calculated R was unsatisfying in Brandenburg and other federal states in the North German Plain, with Pearson’s r being lower than in other parts of Germany [11]. The DIN models were established during the early 1990s, so they also reflect the climate from the 1960s to the 1980s (cf. [16]). The lack of accuracy and the age raise the question whether the DIN model can be recommended to estimate current and future R factors for land and water management in Brandenburg.
Climate change can exhibit direct effects (changes in the amount, intensity, and distribution of rainfall) and indirect effects on soil erosion (rainfall and temperature changes affect biomass production, soil moisture, and the growing season) [17]. Numerous trend studies have assessed past changes in precipitation, especially changes in extreme precipitation across Europe [18,19,20,21], in (Northeastern, NE) Germany [22,23,24,25] and neighboring countries [23,26,27]. These studies consistently found increasing winter rainfall in Central Europe, while the trends for summer precipitation are less coherent. The latter studies indicate less rainfall and longer dry spells during summer, although this holds not necessarily true for extreme rainfall [23] and when recent data is included [26]. The few regional to national studies on rainfall erosivity in Central/Western Europe show a multi-decadal variability with an increase in erosion risks since the end of the 20th century [28,29], although the strength and direction of regional trends are not necessarily valid everywhere [30].
Additionally, studies on future R factors show contradictory changes for NE Germany. While a European assessment proposed that R factors might approximately double from 2010 to 2050 even under moderate climate change scenarios [31], a German-wide analysis reported an average increase of 10% for 2011 to 2041 and a decline in the same order of magnitude for 2041 to 2071 compared to the reference period 1971–2000 [32]. Both studies did not assess how the choices of their respective climate model and rainfall indices to estimate the R factors affected their scenario results. According to more recent German ensemble studies, there might be a tendency of decreasing summer totals, but increasing summer extremes [33,34]. Thus, different choices of aggregated rainfall indices might change the direction of future R changes, with implications for discussions of a sustainable regional land and water management under climate change.
The main objective of this study is to assess the impact of climate change on rainfall erosivity and, subsequently, on the potential soil erosion risk in Brandenburg, without considering further impacts on land use and vegetation cover. Using an ensemble of climate scenarios, our study addresses the following main questions:
  • Which aggregated rainfall index is best to estimate current R factors and their recent change in NE Germany?
  • How does climate change affect regional R factors and the risk of soil erosion?
  • How does the rainfall index affect future trends and how does the impact compare to other sources of uncertainty such as the choice of climate model, bias correction, and RCP scenario?

2. Materials and Methods

2.1. Study Area

The federal state of Brandenburg is situated in NE Germany. It shares the Eastern border with Poland and encompasses Berlin, Germany’s capital city. Brandenburg covers an area of 30.000 km2, of which one third is arable land. It completely belongs to the European ecoregion “Central Plains” [35]. Shaped during the Pleistocene, the landscape is characterized by flat to undulating terrain, a dense network of streams, many (often shallow) lakes and ponds, as well as sandy soils. The climate is temperate and fully humid (Cfb) according to the Köppen-Geiger classification with an annual mean air temperature of 9.6 °C and an annual precipitation of 560 mm (1996–2015, original data provided by Reference [36]).

2.2. Rainfall Indices and the Variability of Calculated R Factors

We calculated the rainfall erosivity and the R factors in kJ m−2 mm h−1 for 22 stations in and near Brandenburg (Table 1, squares in Figure 1) according to the German Norm DIN ([11,12], Appendix A). The required detailed precipitation data, sampled at 10 min intervals with PLUVIO OTT weighing gauges which partly replaced earlier NG-200 volumetric gauges, was provided by the German Meteorological Service (DWD) for the years 2000 to 2015. Implausible values were corrected (Appendix B). Table 2 provides an overview of the data used in this study.
Three aggregated rainfall indices were derived from daily data and tested to explain the variability of the calculated R factors with linear regression models. We compared the total sum from May to September (Psum) to the total sum of rainfall on heavy rainfall days. As no common criteria for “heavy rainfall day” exists, we considered exemplarily the 10 highest daily values (Pmax10) and daily values above 11.8 mm (the 33th percentile of all calculated erosive rainfall events, which is above the threshold of 10 mm d−1 used for a “heavy rainfall day” e.g., by Reference [37]). In contrast to the DIN and similar empirical models, we excluded the October because rainfalls were less erosive than in summer months (cf. Figure 2 in the Results section). For each climate station, Psum, Pmax10, and P11.8 were calculated as multi-annual means for the years in Table 1.
We applied the new regression models to the German-wide dataset of regionalized daily station data (REGNIE, [36]) to create new state-wide R maps for the years 2001–2015. These maps replaced the fixed R factor of 50 kJ m−2 mm h−1 of the current erosion map [38], e.g., used by the State Office of Environment to identify risk areas, i.e., arable land with erosion rates above 1 t ha−1 a−1. Likewise, we obtained the current extent of risk areas. For this reason, we used the REGNIE data to establish the regression models. As REGNIE is derived from station data, differences between both only occur if stations are not considered for the regionalization.

2.3. Climate Scenarios

We used climate model data from the Coordinated Regional Downscaling Experiment which provides the most recent climate data for Europe (EURO-CORDEX domain, Reference [39]). Harmonized daily datasets of climate parameters are available in high spatial resolution from various GCM (general circulation models), RCM (regional circulation models), and RCP (representative concentration pathways). This combination makes the CORDEX data most suitable for assessing uncertainties related to the selection of climate models and RCP scenarios in regional studies.
The data availability in the CORDEX database differs among the RCP. To obtain a sufficiently large, yet homogeneous ensemble for the uncertainty assessment, we used 15 combinations of GCM and dynamical RCM in the highest possible spatial resolution of 0.11° (approx. 12 km, CORDEX domain EUR-11) available for RCP 4.5 (i.e., moderate climate change) and RCP 8.5 (i.e., extreme climate change) (Table 3).
We downloaded the CORDEX data for the years 1971 to 2100 and extracted the time-series for 188 climate stations in and around Brandenburg (black circles in Figure 1). To reduce the deviations to station data, we applied a bias correction (distribution mapping with linear scaling) to adjust the monthly frequency distributions and means for the period 1971–2015. This period includes hindcasted data where both RCP are similar (1971–2005) and climate change projections where the RCP deviate (2006–2015). We used an adapted version of the software CMHyd (References [40,41], see Reference [42] for the conceptual and methodical background) to perform the bias correction. The software also transformed the 360-days calendar of the GCM MOHC-HadGEM2-ES to a 365-days calendar.
While most stations had sufficiently long time series for the bias correction (Figure 1), we considered additional stations with shorter time series until 2015 to increase the density for the spatial interpolation (Chapter 2.4). Thus, we used again the REGNIE data instead of the station data. Psum, Pmax10, and P11.8 were calculated from the climate model output and the REGNIE data. We used a simple ranking scheme based on the average Kling-Gupta efficiency (KGE, [43]), the absolute percent bias (APB, in %), and the root-mean square error (RMSE) to assess the performance of the bias-corrected climate models for the period 1971–2015. The ranking considered the
  • Spatial rank: For each station, the long-term average rainfall indices were calculated. KGE, APB and RMSE were obtained for each climate model.
  • Trend rank: For each station, we calculated the annual indices from REGNIE and the climate models and determined KGE, APB and RMSE from the linear trend. For each climate model, we averaged KGE, APB, and RMSE for the ranking.
The rank of each climate models was determined with the function rank.avg in MS Excel which returns the average rank for equal values, e.g., eight if all 15 models would perform equally well for an index. To rank almost similar values equally, we rounded the KGE to the nearest 0.05 and APB and RMSE to the nearest integer. The five best-performing climate models were selected (subset) and compared to the whole ensemble of 15 models to evaluate the effect of model choice on R trends.

2.4. Impact of Climate Change on R Factors, Uncertainties, Consequences for the Extent of Erosion-Risk Areas

For all 188 climate stations and the 8 combination of climate models (whole ensemble or subset), bias correction (with or without), RCP (4.5 or 8.5), and index (heavy-rainfall or total sum), we derived the change in R relative to 2001–2015 for other periods of 15 years overlapping by five years (i.e., 2011–2025, 2021–2035, etc.) to assess how modelling choices influenced future trends. Each choice resulted in two different R factors (R and R’) for all the stations and periods. We considered this difference as uncertainty. We averaged the ratios of max(R, R’) and min(R, R’) over four periods in the first and the second half of this century (2011–2055, 2051–2095) to compare the impact of each choice.
Finally, the relative station values were interpolated using thin splines [44] (a) to assess the sub-regional pattern of R changes, and (b) to quantify the change in the extent of arable land [45] at risk of erosion rates exceeding the threshold of 1 t ha−1 a−1. For the latter, we applied the interpolated data as correction factor to the revised state erosion map (Chapter 2.2).

3. Results

3.1. Rainfall Indices and the Spatial Variability of Current R Factors

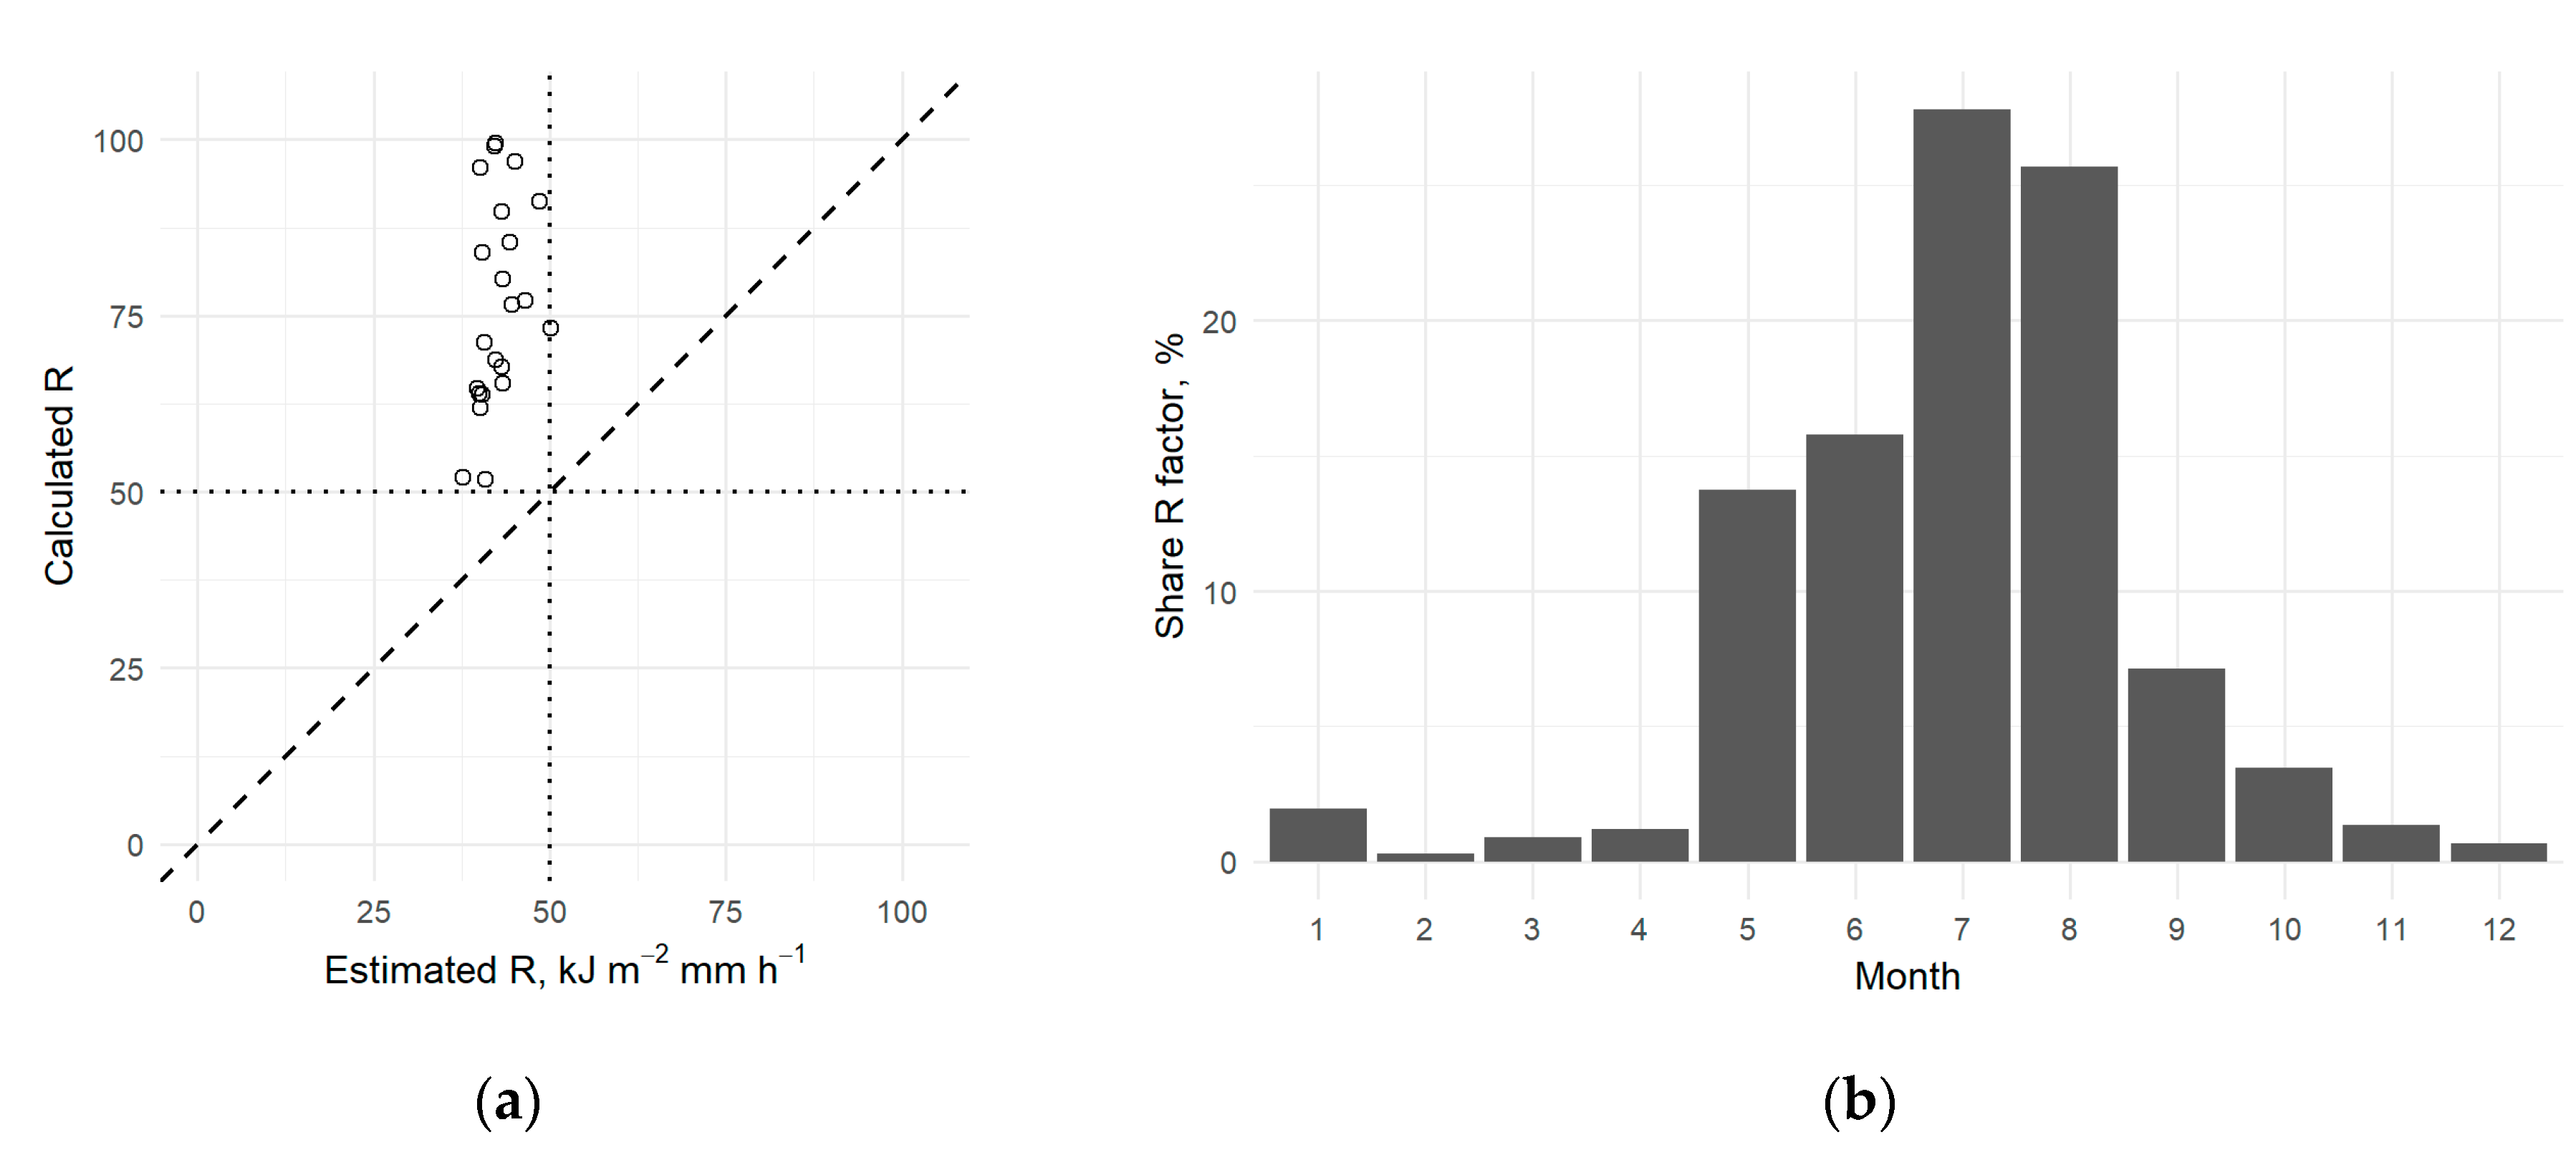
The calculated R factors considerably exceeded the values estimated with the DIN regression model (Figure 2a), especially in the south-eastern part where the highest R factors were calculated. While the average calculated value was 76.8 kJ m−2 mm h−1, the DIN model estimated only 42.7 kJ m−2 mm h−1. The fixed value used for the existing erosion map corresponds to the maximum of the estimated values but to the minimum of the calculated values. In consequence, the current state-wide erosion map underestimates the potential erosion rate and the extent of risk areas.
About 90% of the annual rainfall erosivity occurred between May and September, 50% in July and August (Figure 2b). During the rest of the year, rainfall events were far less erosive. As aggregated rainfall indices cannot capture the lower peak intensities in these months and would overestimate their contribution to R factors, we did not consider these months in our rainfall indices for the regression analyses.
The heavy-rainfall indices Pmax10 and P11.8 explained the variability of the 22 calculated R factors better (r2 = 0.46–0.50) than the total sum Psum (r2 = 0.21, and 0.08 if calculated for May to October as used in the DIN). However, the performance was strongly affected by the most extreme event, its erosivity (EI30 value) being more than twice the second highest value (494 kJ m−2 mm h−1, Appendix C). Without this event, the corresponding R factor (of station 430, Table 1) decreased by 33% resulting in r2 values of around 0.6 (Equations (2) and (3)) and 0.3 (Equation (1)).
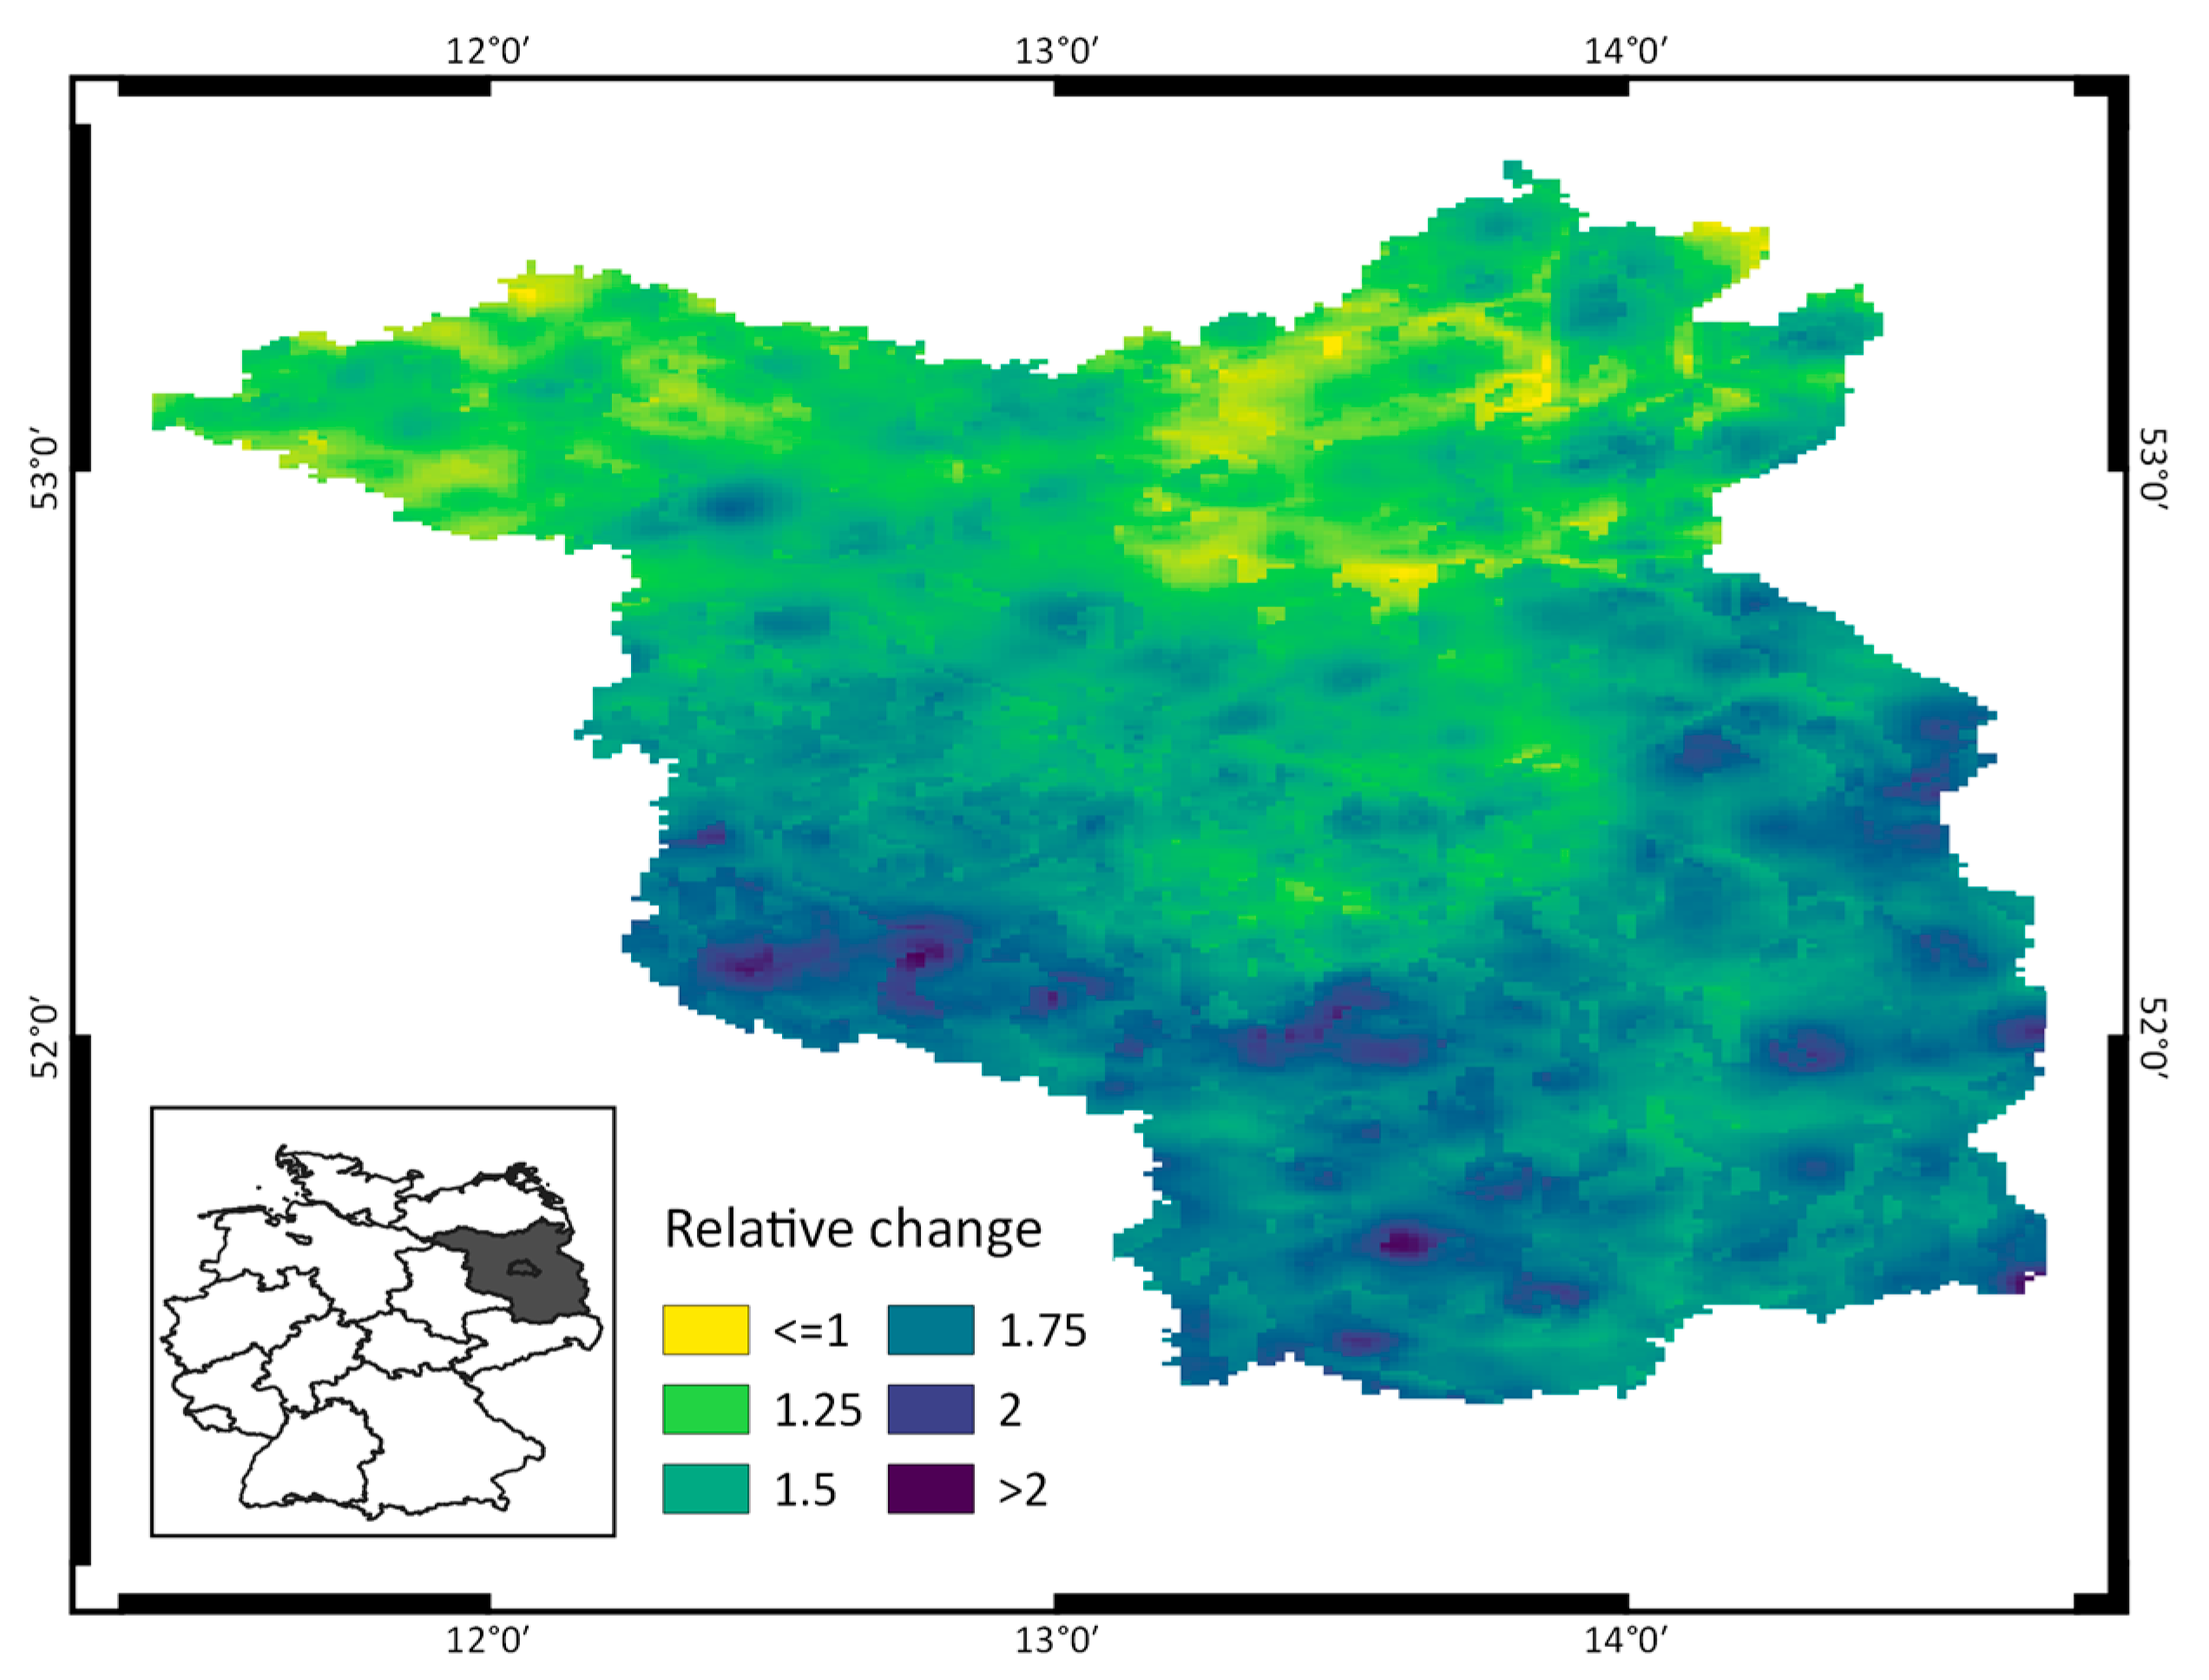
Using heavy-rainfall indices instead of total sums affected the spatial pattern of the estimated R factor (Figure 3). While the outcomes of Equations (1)–(3) and even the DIN model were similar in Northern Brandenburg, the model deviations increased towards the South.
R = 0.541 Psum − 94.24
R = 1.085 Pmax10 − 105.92
R = 0.695 P11.8 − 22.58

3.2. Ranking of Climate Models

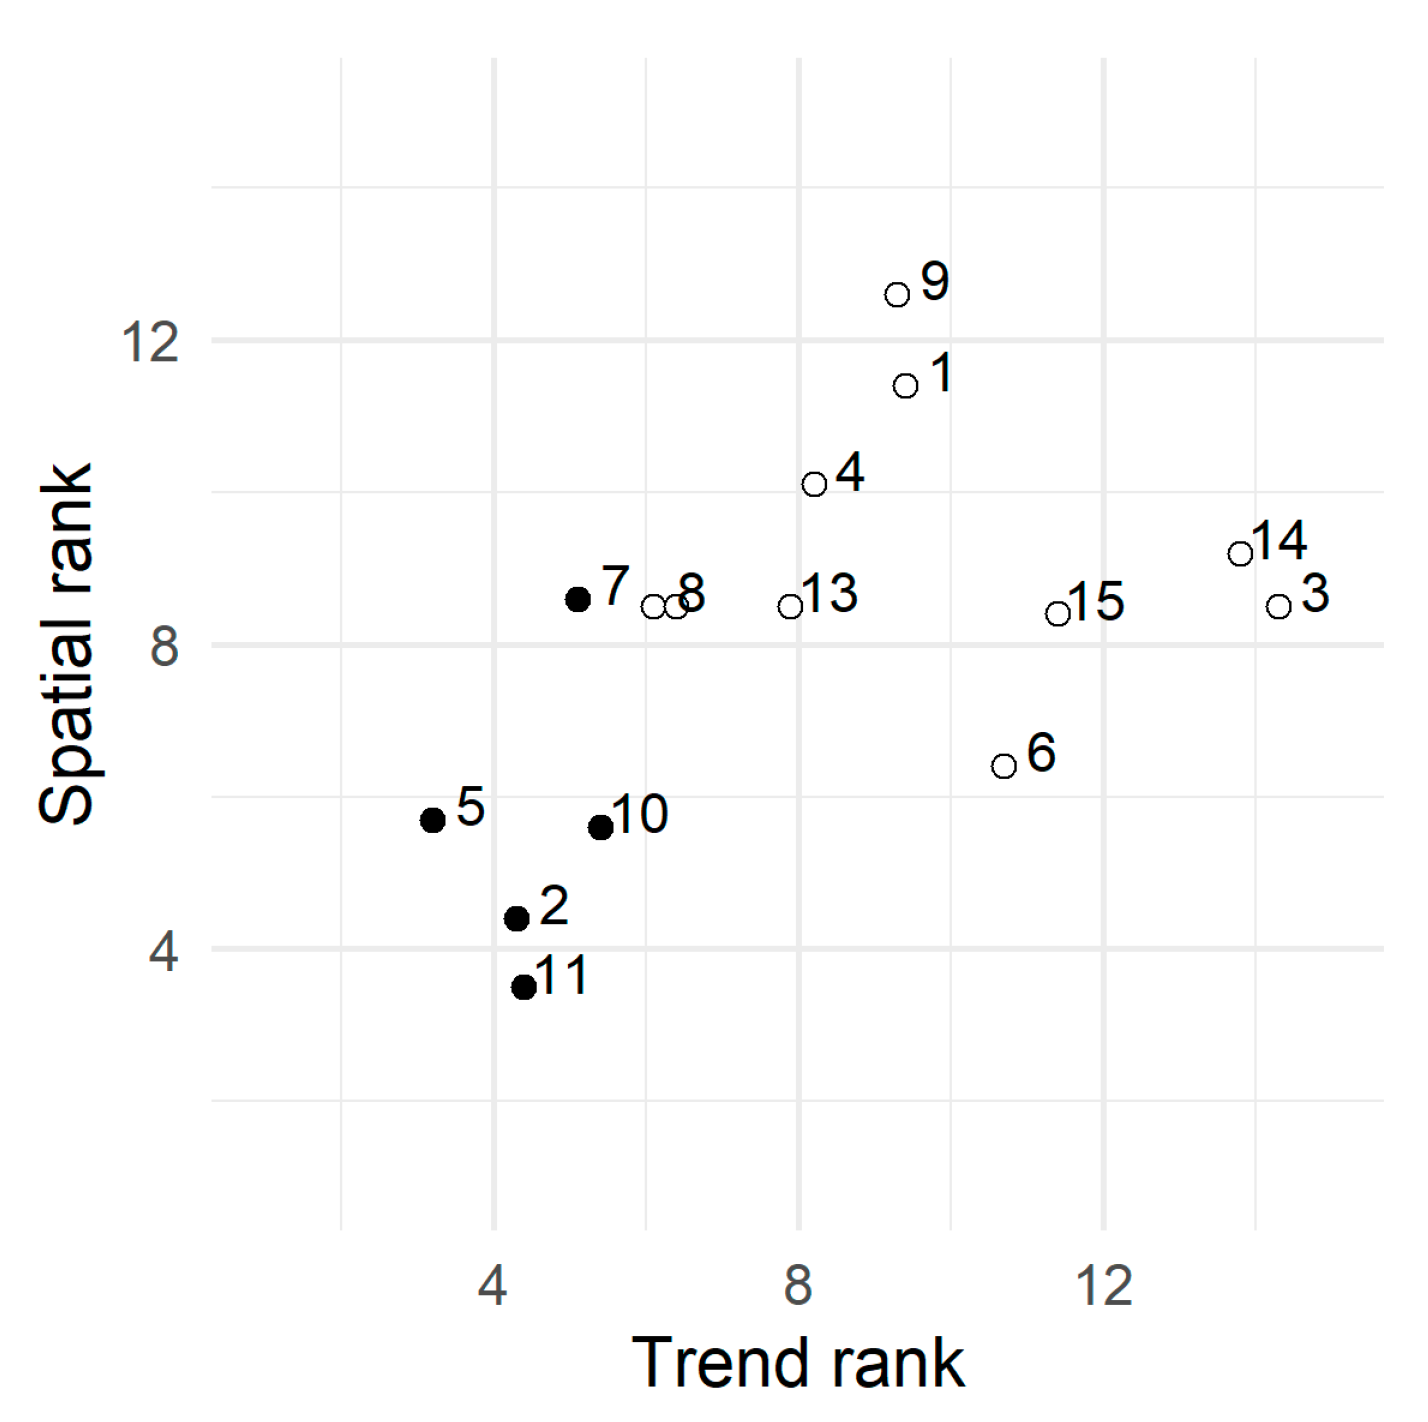
No single GCM or RCM was unanimously ranked as “best matching” (Figure 4, Appendix D), since 4 combinations of GCM and RCM were equally best performing (ID 2, 5, 10, and 11, Table 3). The 5th rank was ambivalent with different results for both RCP. However, with the chosen model 7, the ensemble subset comprised 4 out of the 5 GCM and 3 out of the 6 RCM.

3.3. Climate Scenarios and Soil Erosion Risk

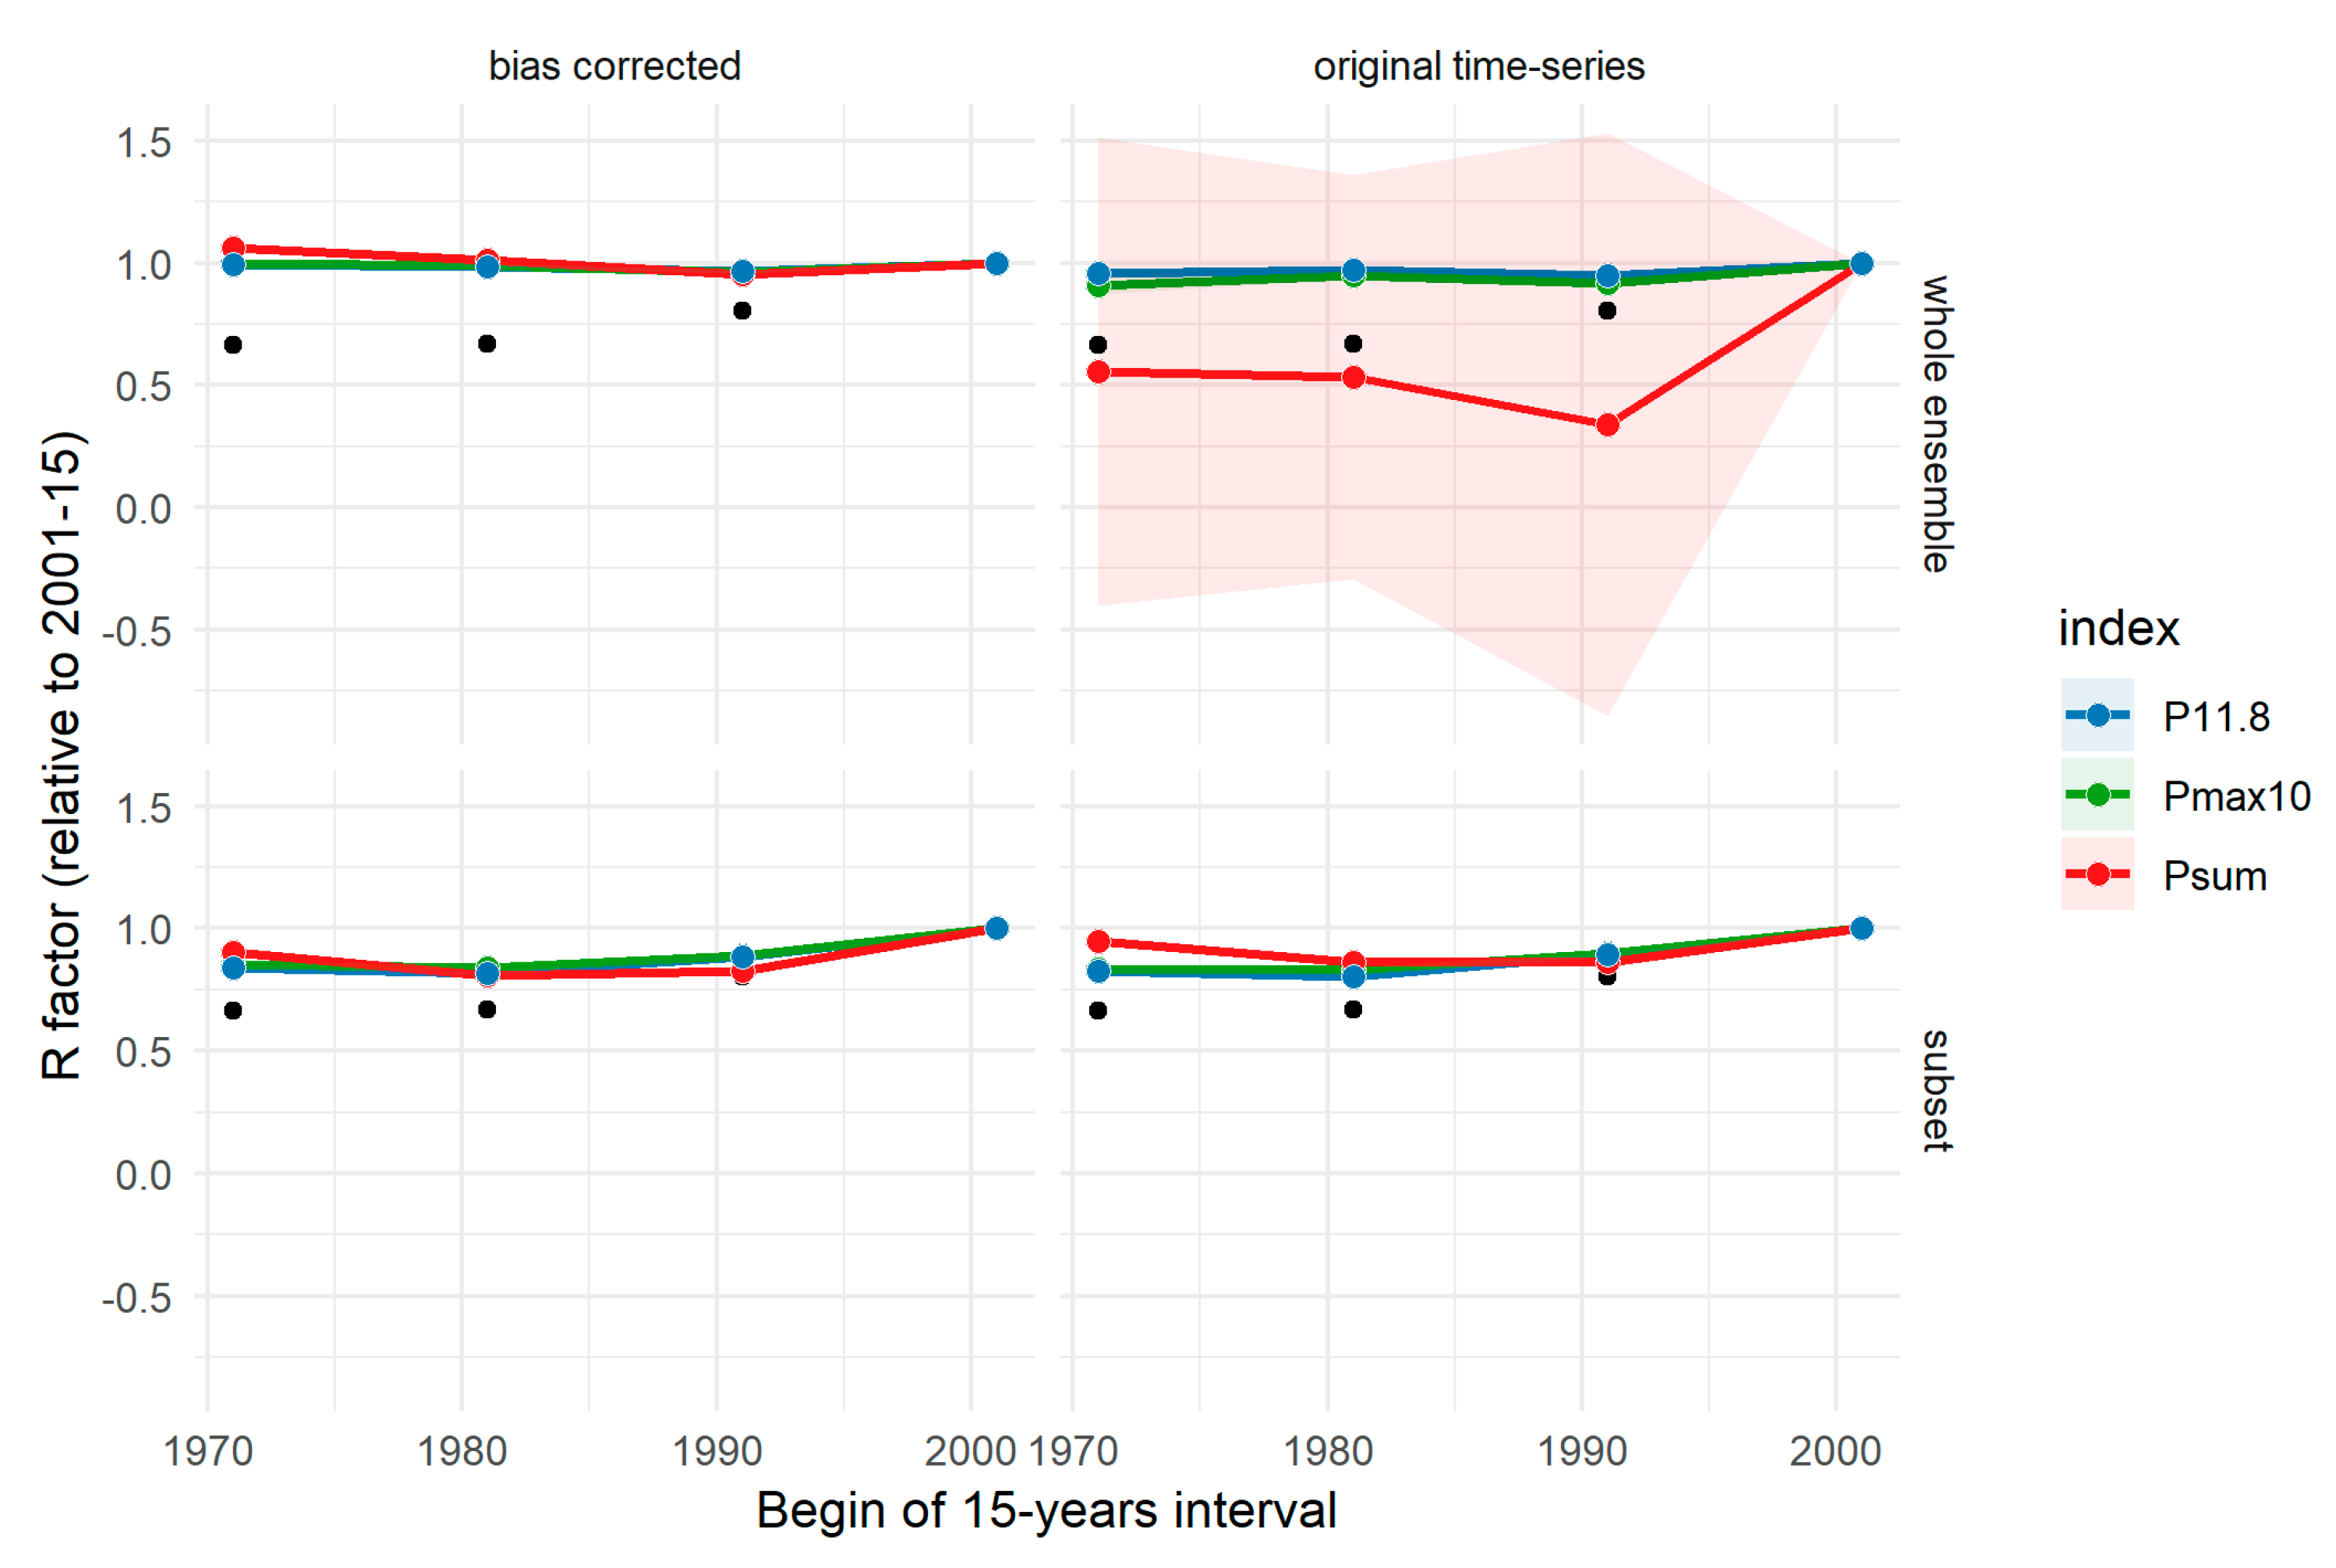
Only the subset of the 5 top-ranked climate models captured, albeit underestimated, the general increase of the R factors during the past four decades (R values relative to 2001-15 below 1.0 in Figure 5). In contrast, the whole ensemble did not reveal this increase (past values ≈ 1.0). On average, the RCP 4.5 values (relative R of 0.81) were closer to the REGNIE data (relative R of 0.71) than the RCP 8.5 values (0.90, RCP not differentiated in Figure 5).
The variability was largest for the whole uncorrected ensemble, partly due to negative regional R factors obtained with the climate model ID 9 and RCP 4.5. For instance, the coefficient of variation (CV) was here above 22,500% for Psum (Equation (1), but 22.9% without the negative values) and above 30% for Pmax10, P11.8, and RCP 8.5. The ranking helped to reduce the CV to 12–19%, which was close to the reference data (11%).
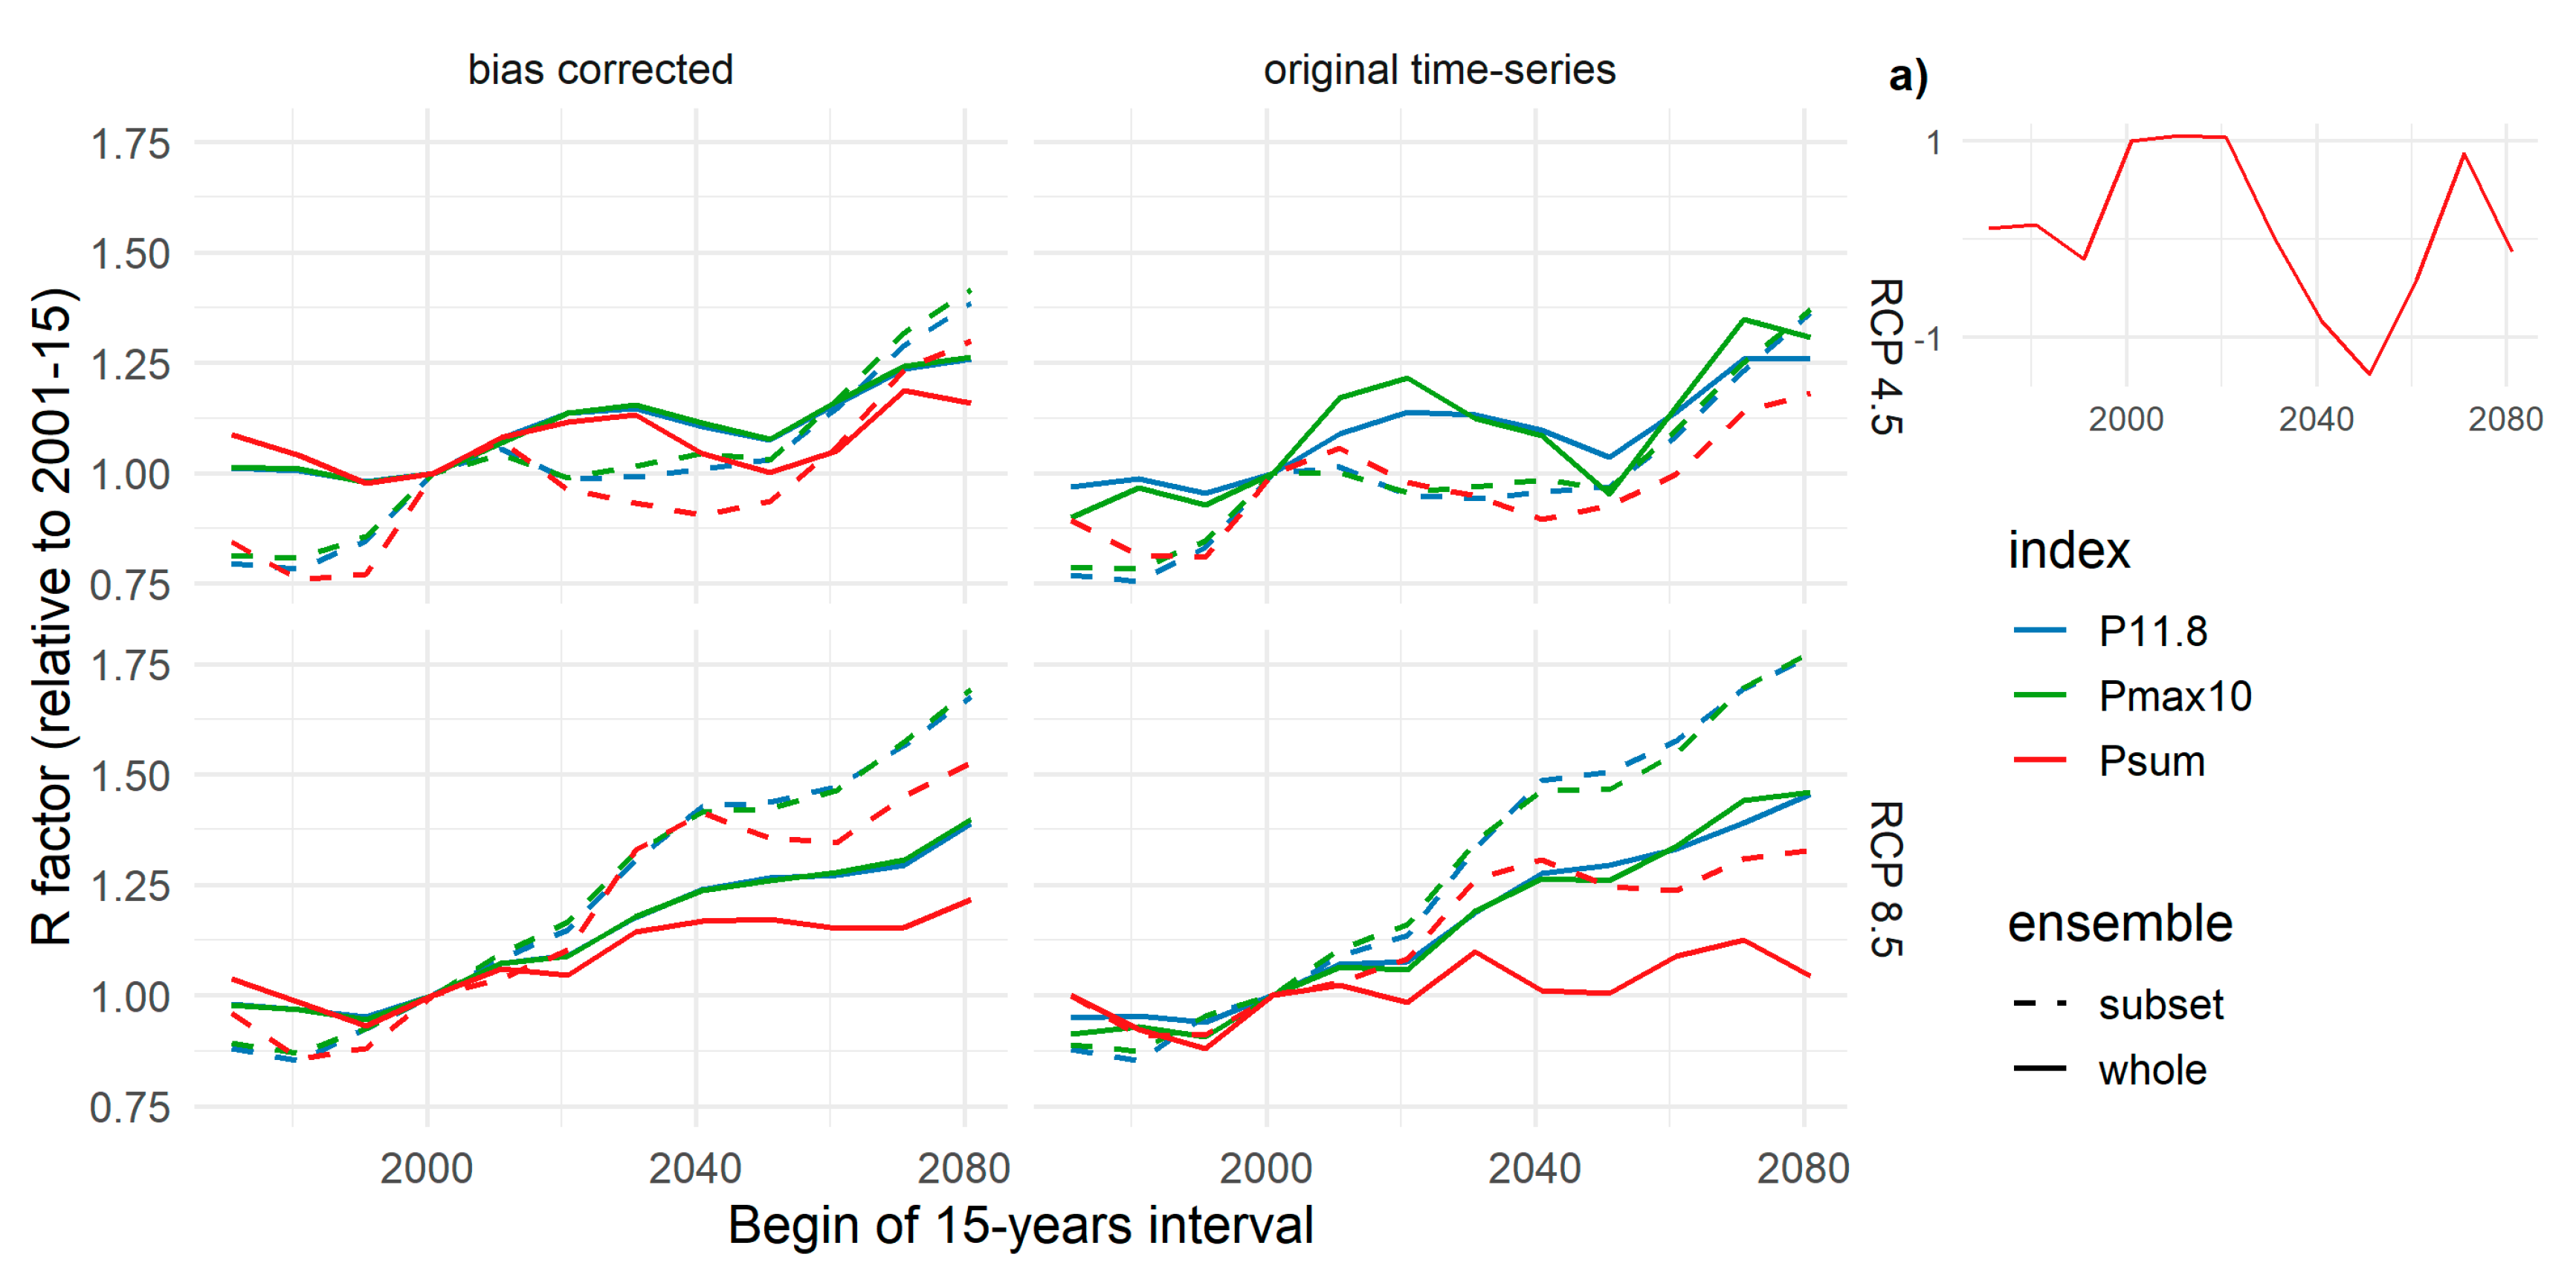
Regarding future trends, all ensembles and regression models predicted increasing R factors towards the end of the 21st century (Figure 6), except for Equation (1) in combination with the whole uncorrected ensemble and RCP 4.5 (Figure 6a). However, this combination was again hampered by negative R factors.
As expected, the model ensemble and the RCP influenced the decadal variability. The ensemble subset amplified the differences between RCP 4.5 and 8.5. Until mid-century, the estimated regional R factors would generally remain above the reference period if the whole ensemble was used (solid lines in Figure 6). With the subset (broken line), the overall changes might be negligible and even negative for RCP 4.5, but increase more strongly for RCP 8.5.
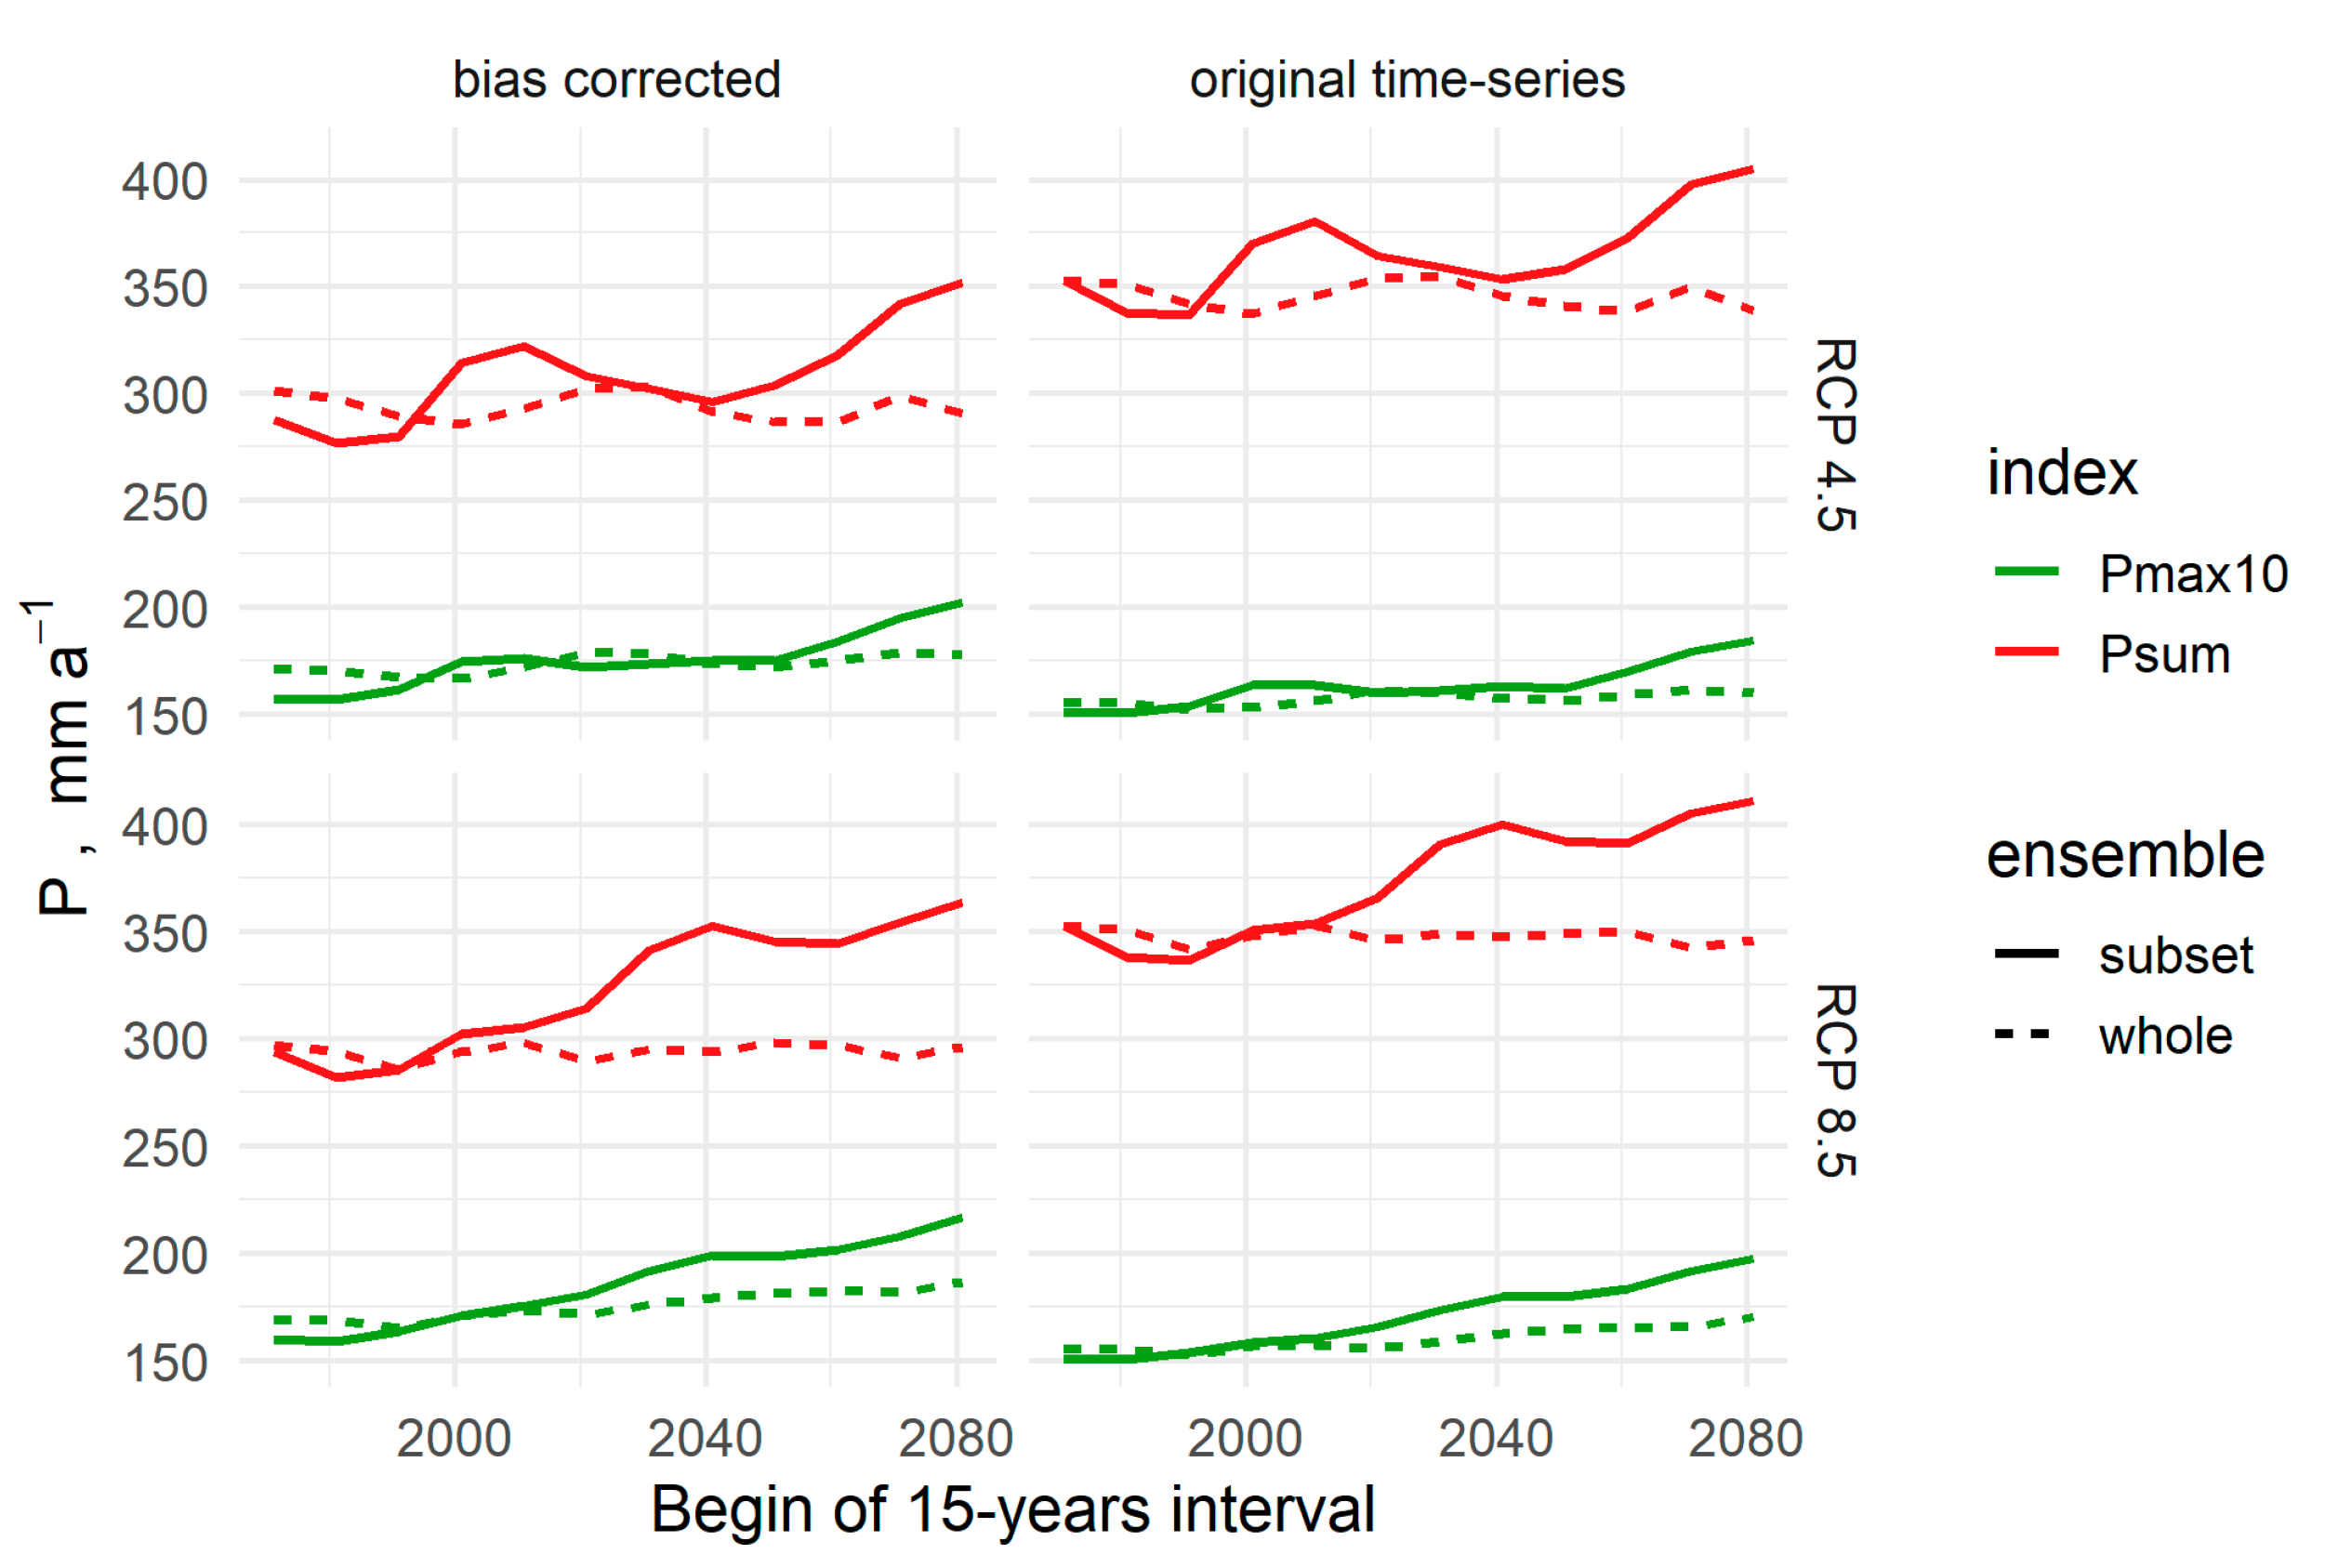
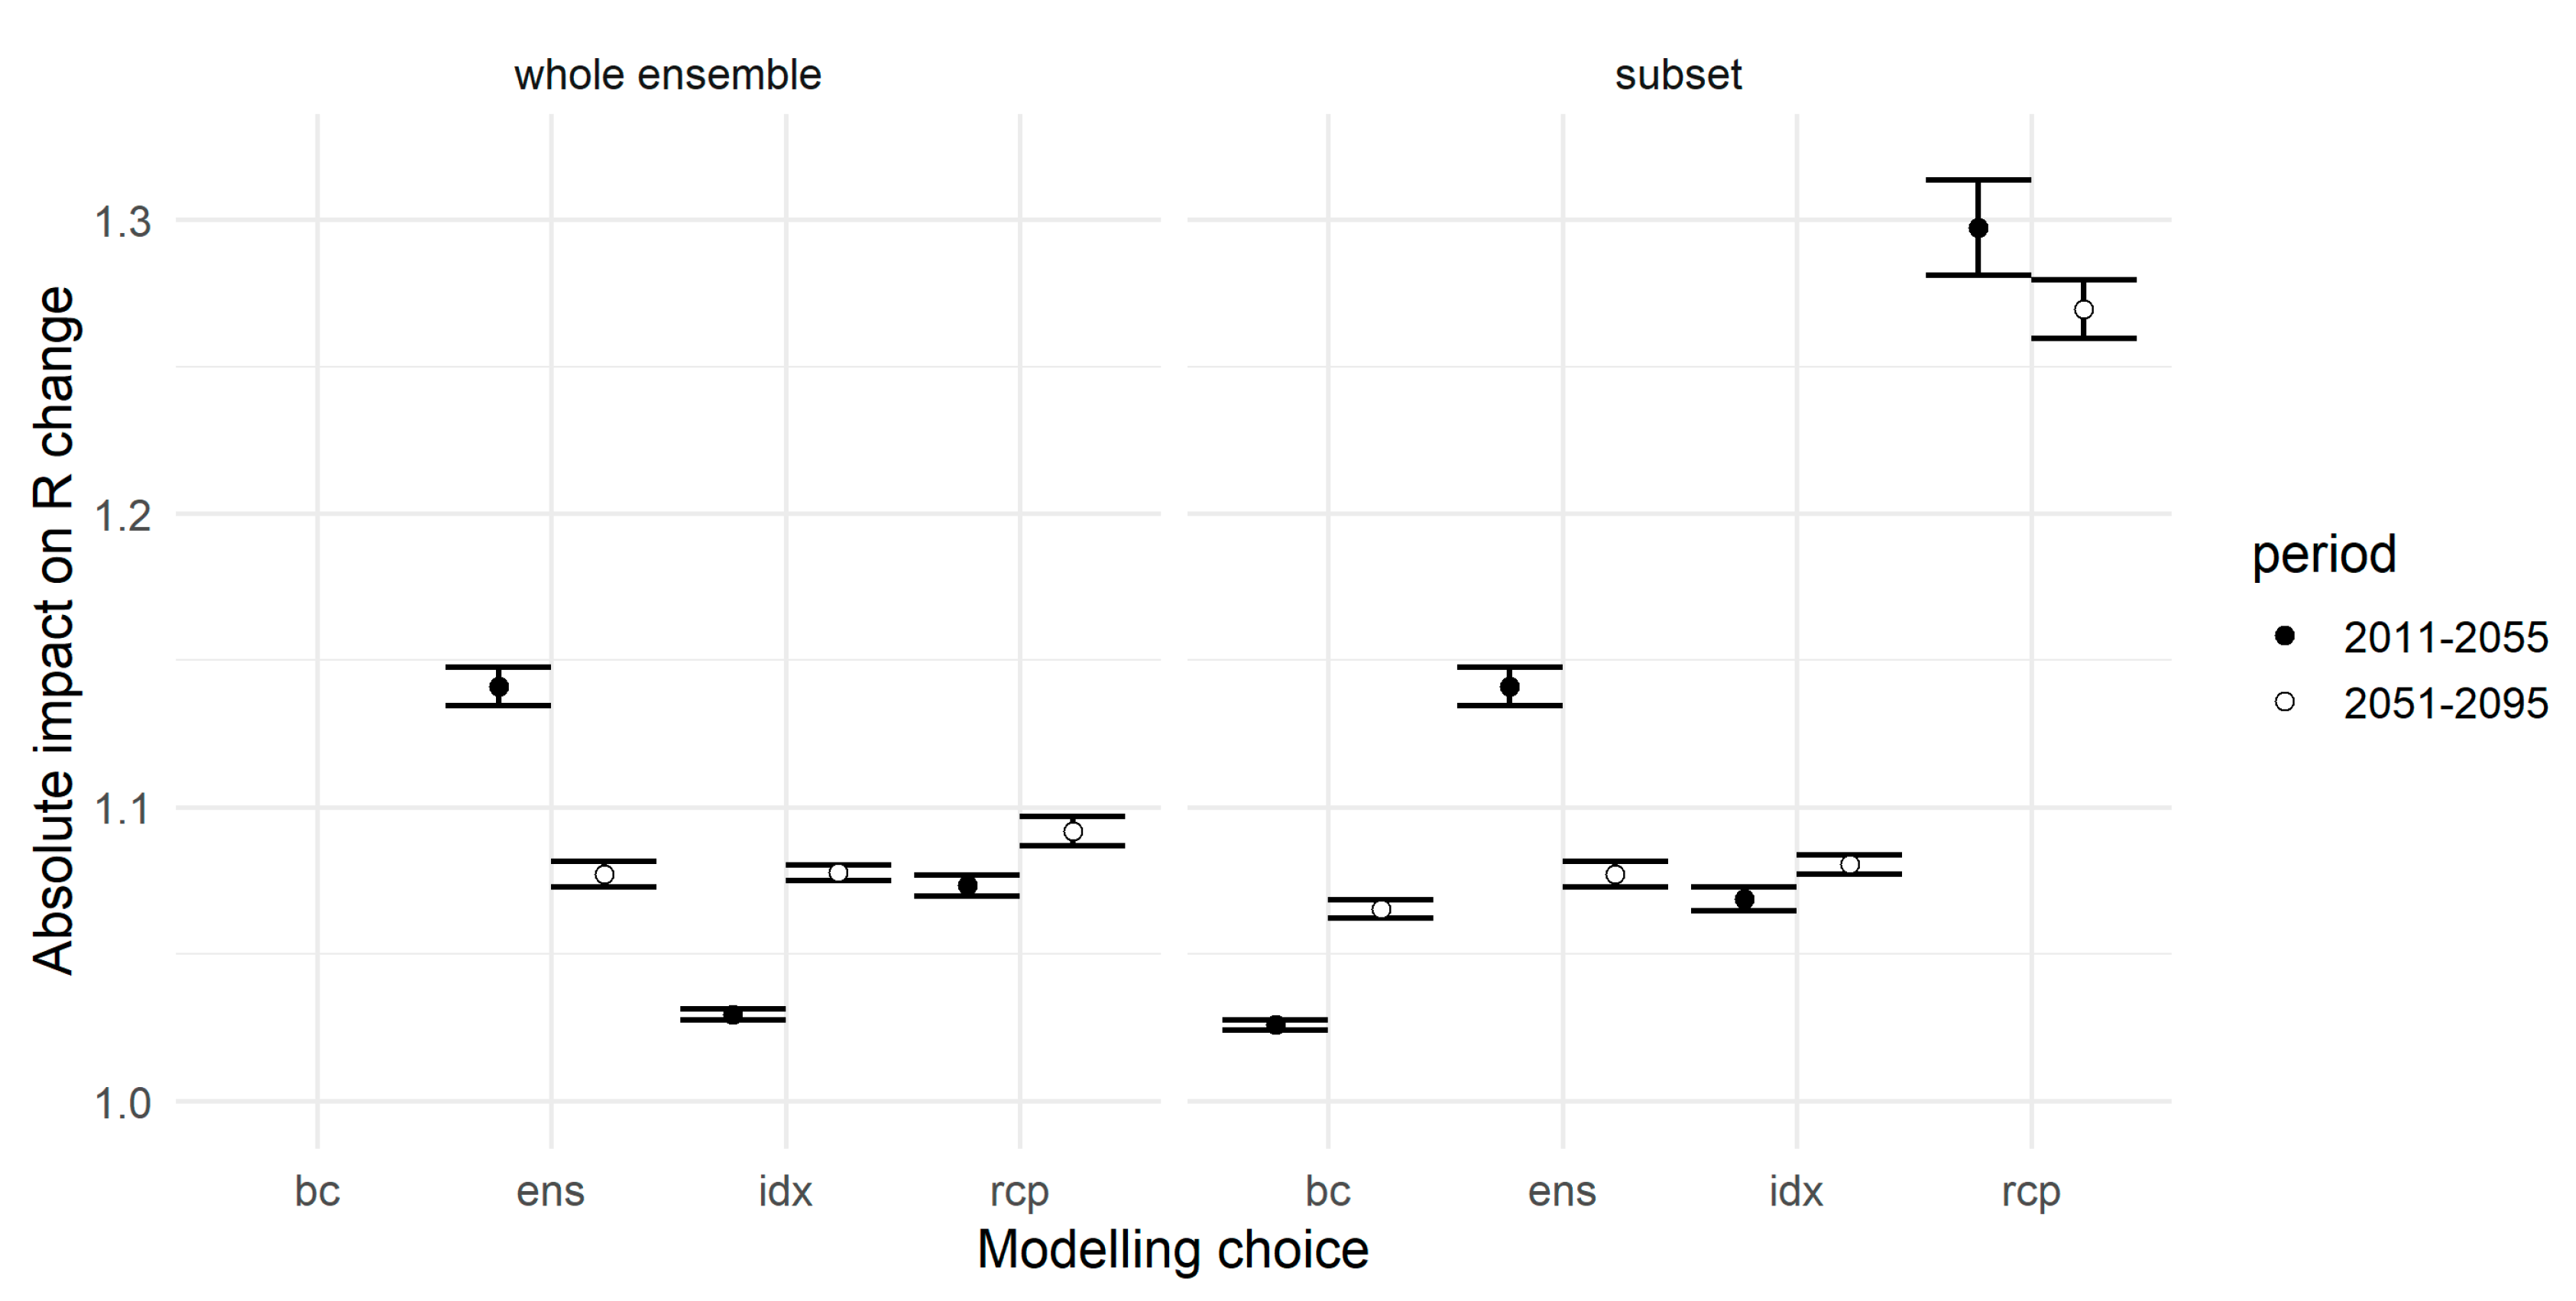
However, switching from Psum to the heavy-rainfall indices also resulted in an increase of future R factors. The effect was larger for the uncorrected than for the bias-corrected climate models because the bias correction raised the ratio of heavy and total rainfall (Figure 7). The impacts of index choice on trends were comparable to the other modelling decisions (Figure 8).
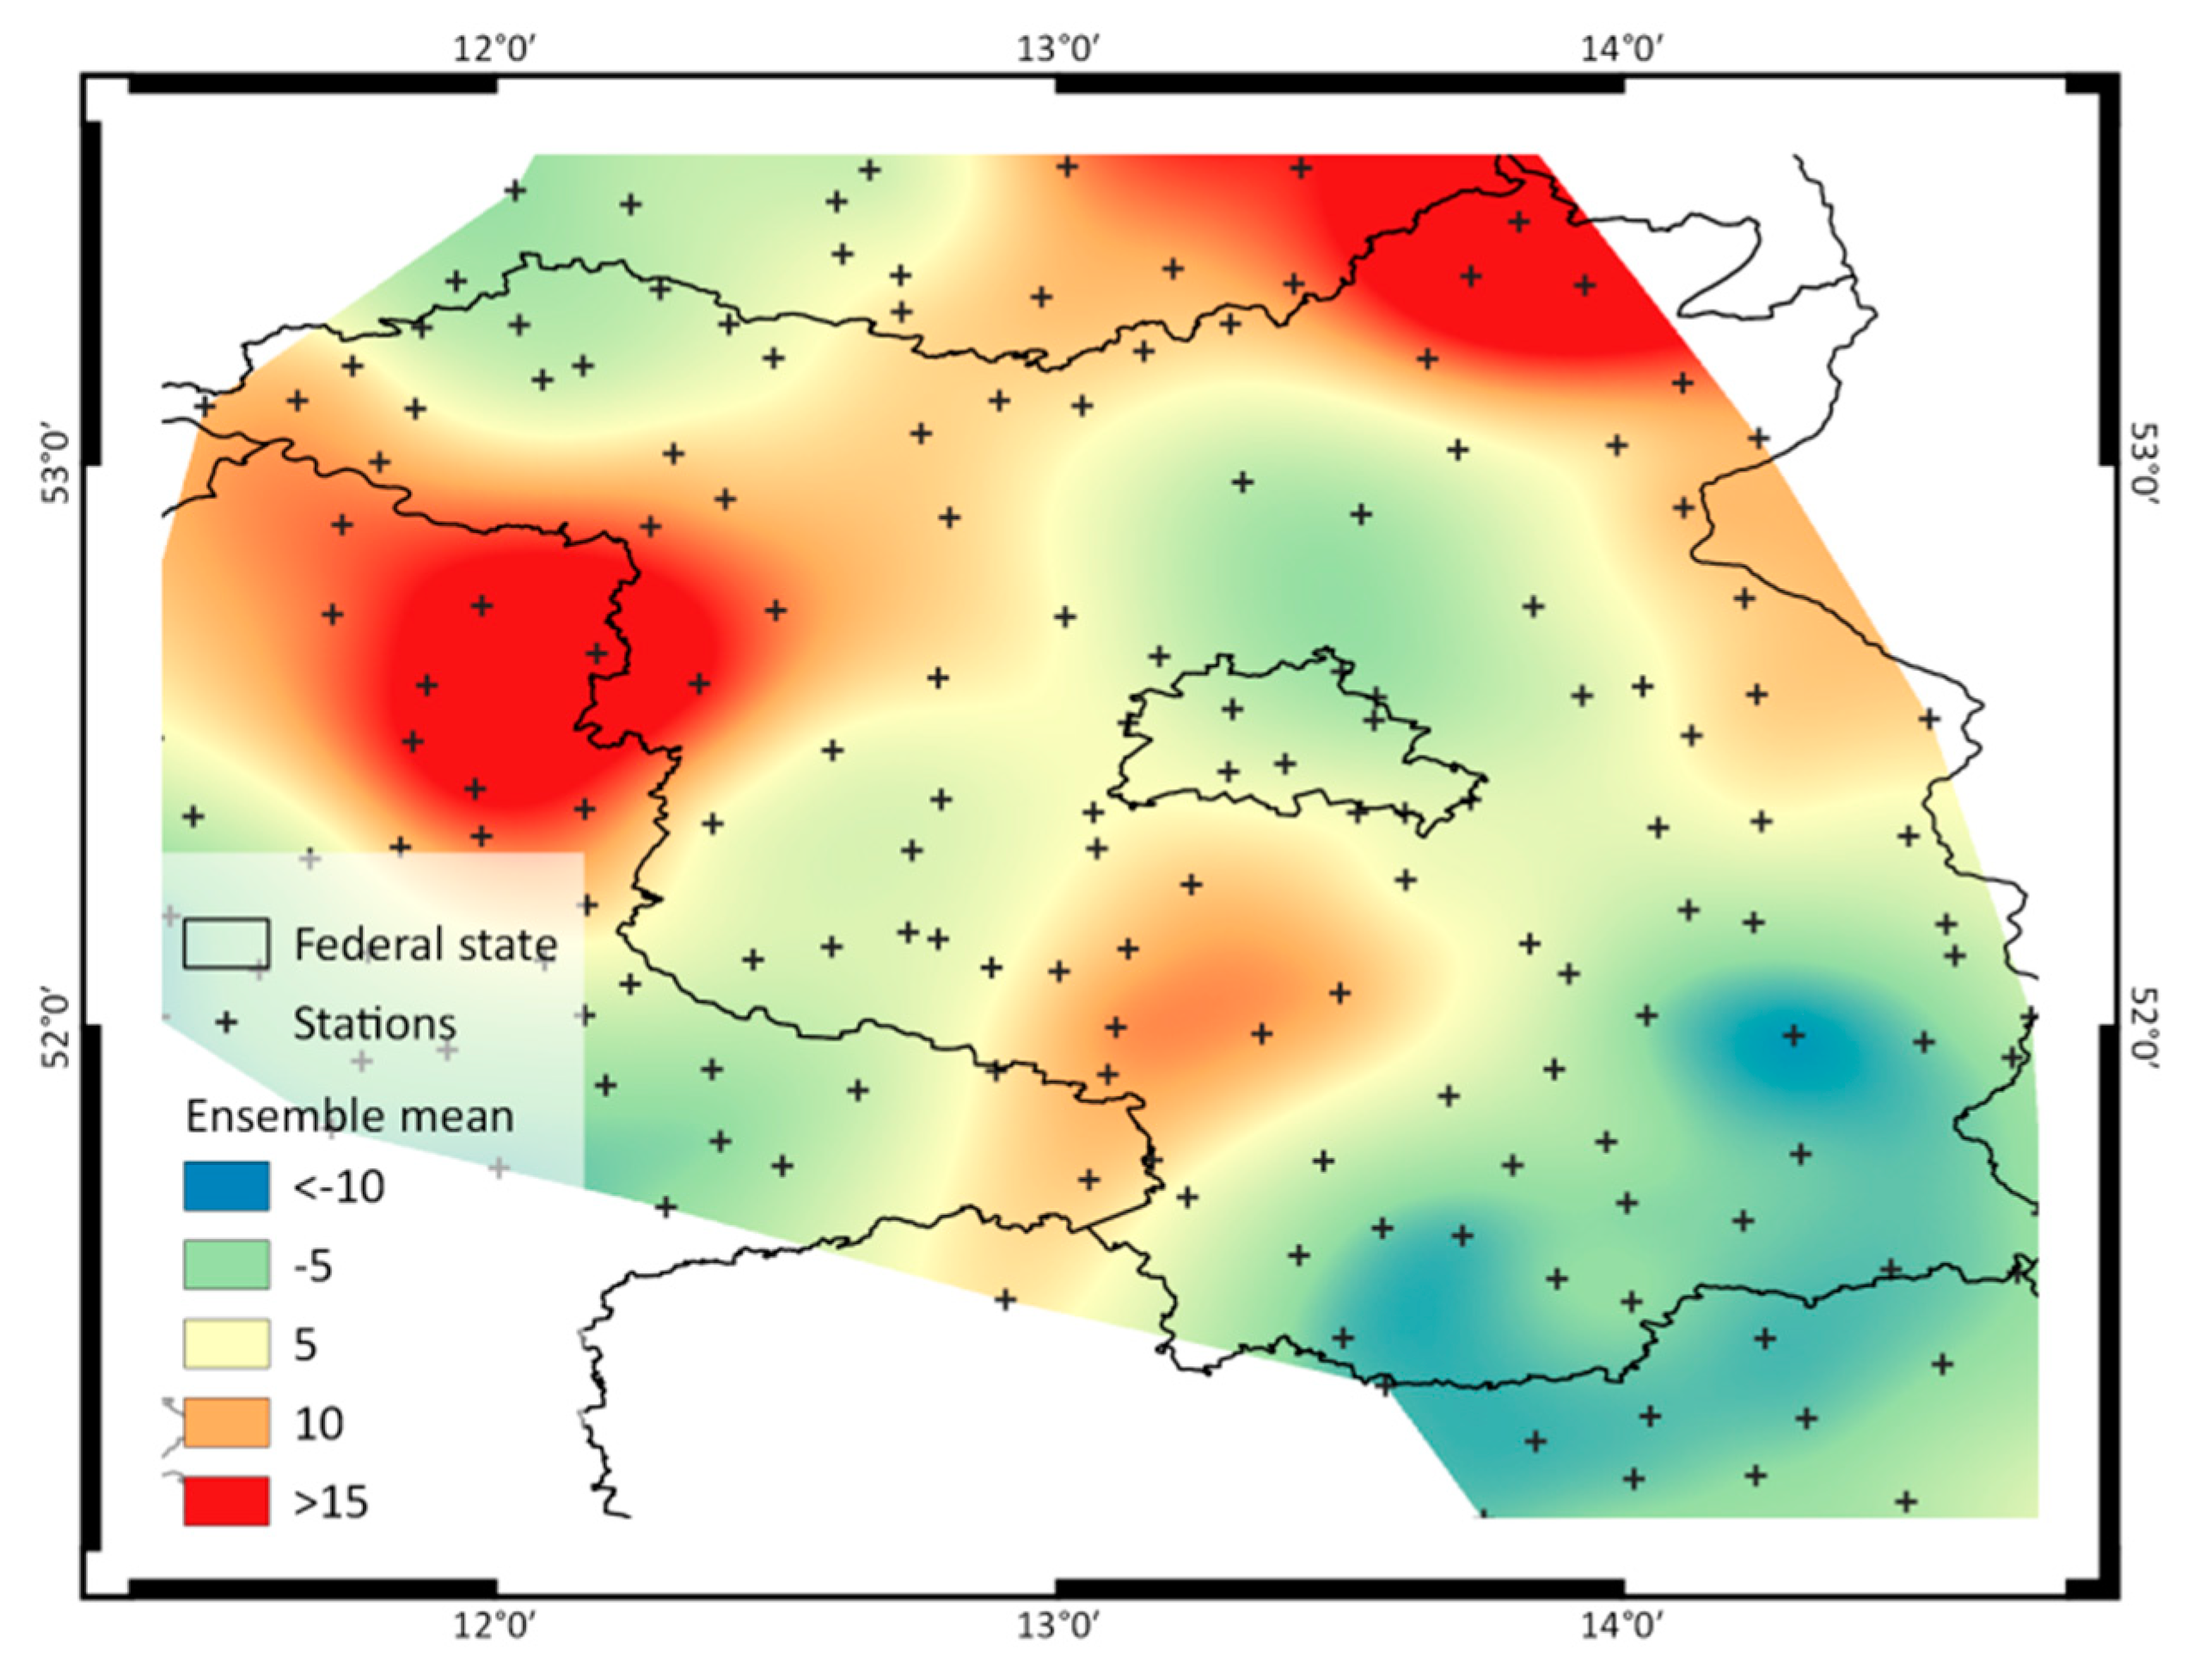
The combination of heavy-rainfall index, RCP 4.5, and ensemble subsetting suggested very low overall changes in R factors around mid-century (2041–2065) compared to 2001–2015 (Figure 6). However, the spatial aggregation masked distinctively opposite trends in different sub-regions. While R factors in some parts of Northern Brandenburg might increase by more than 15%, they can decrease by more than 10% in the South-Eastern part (Figure 9).
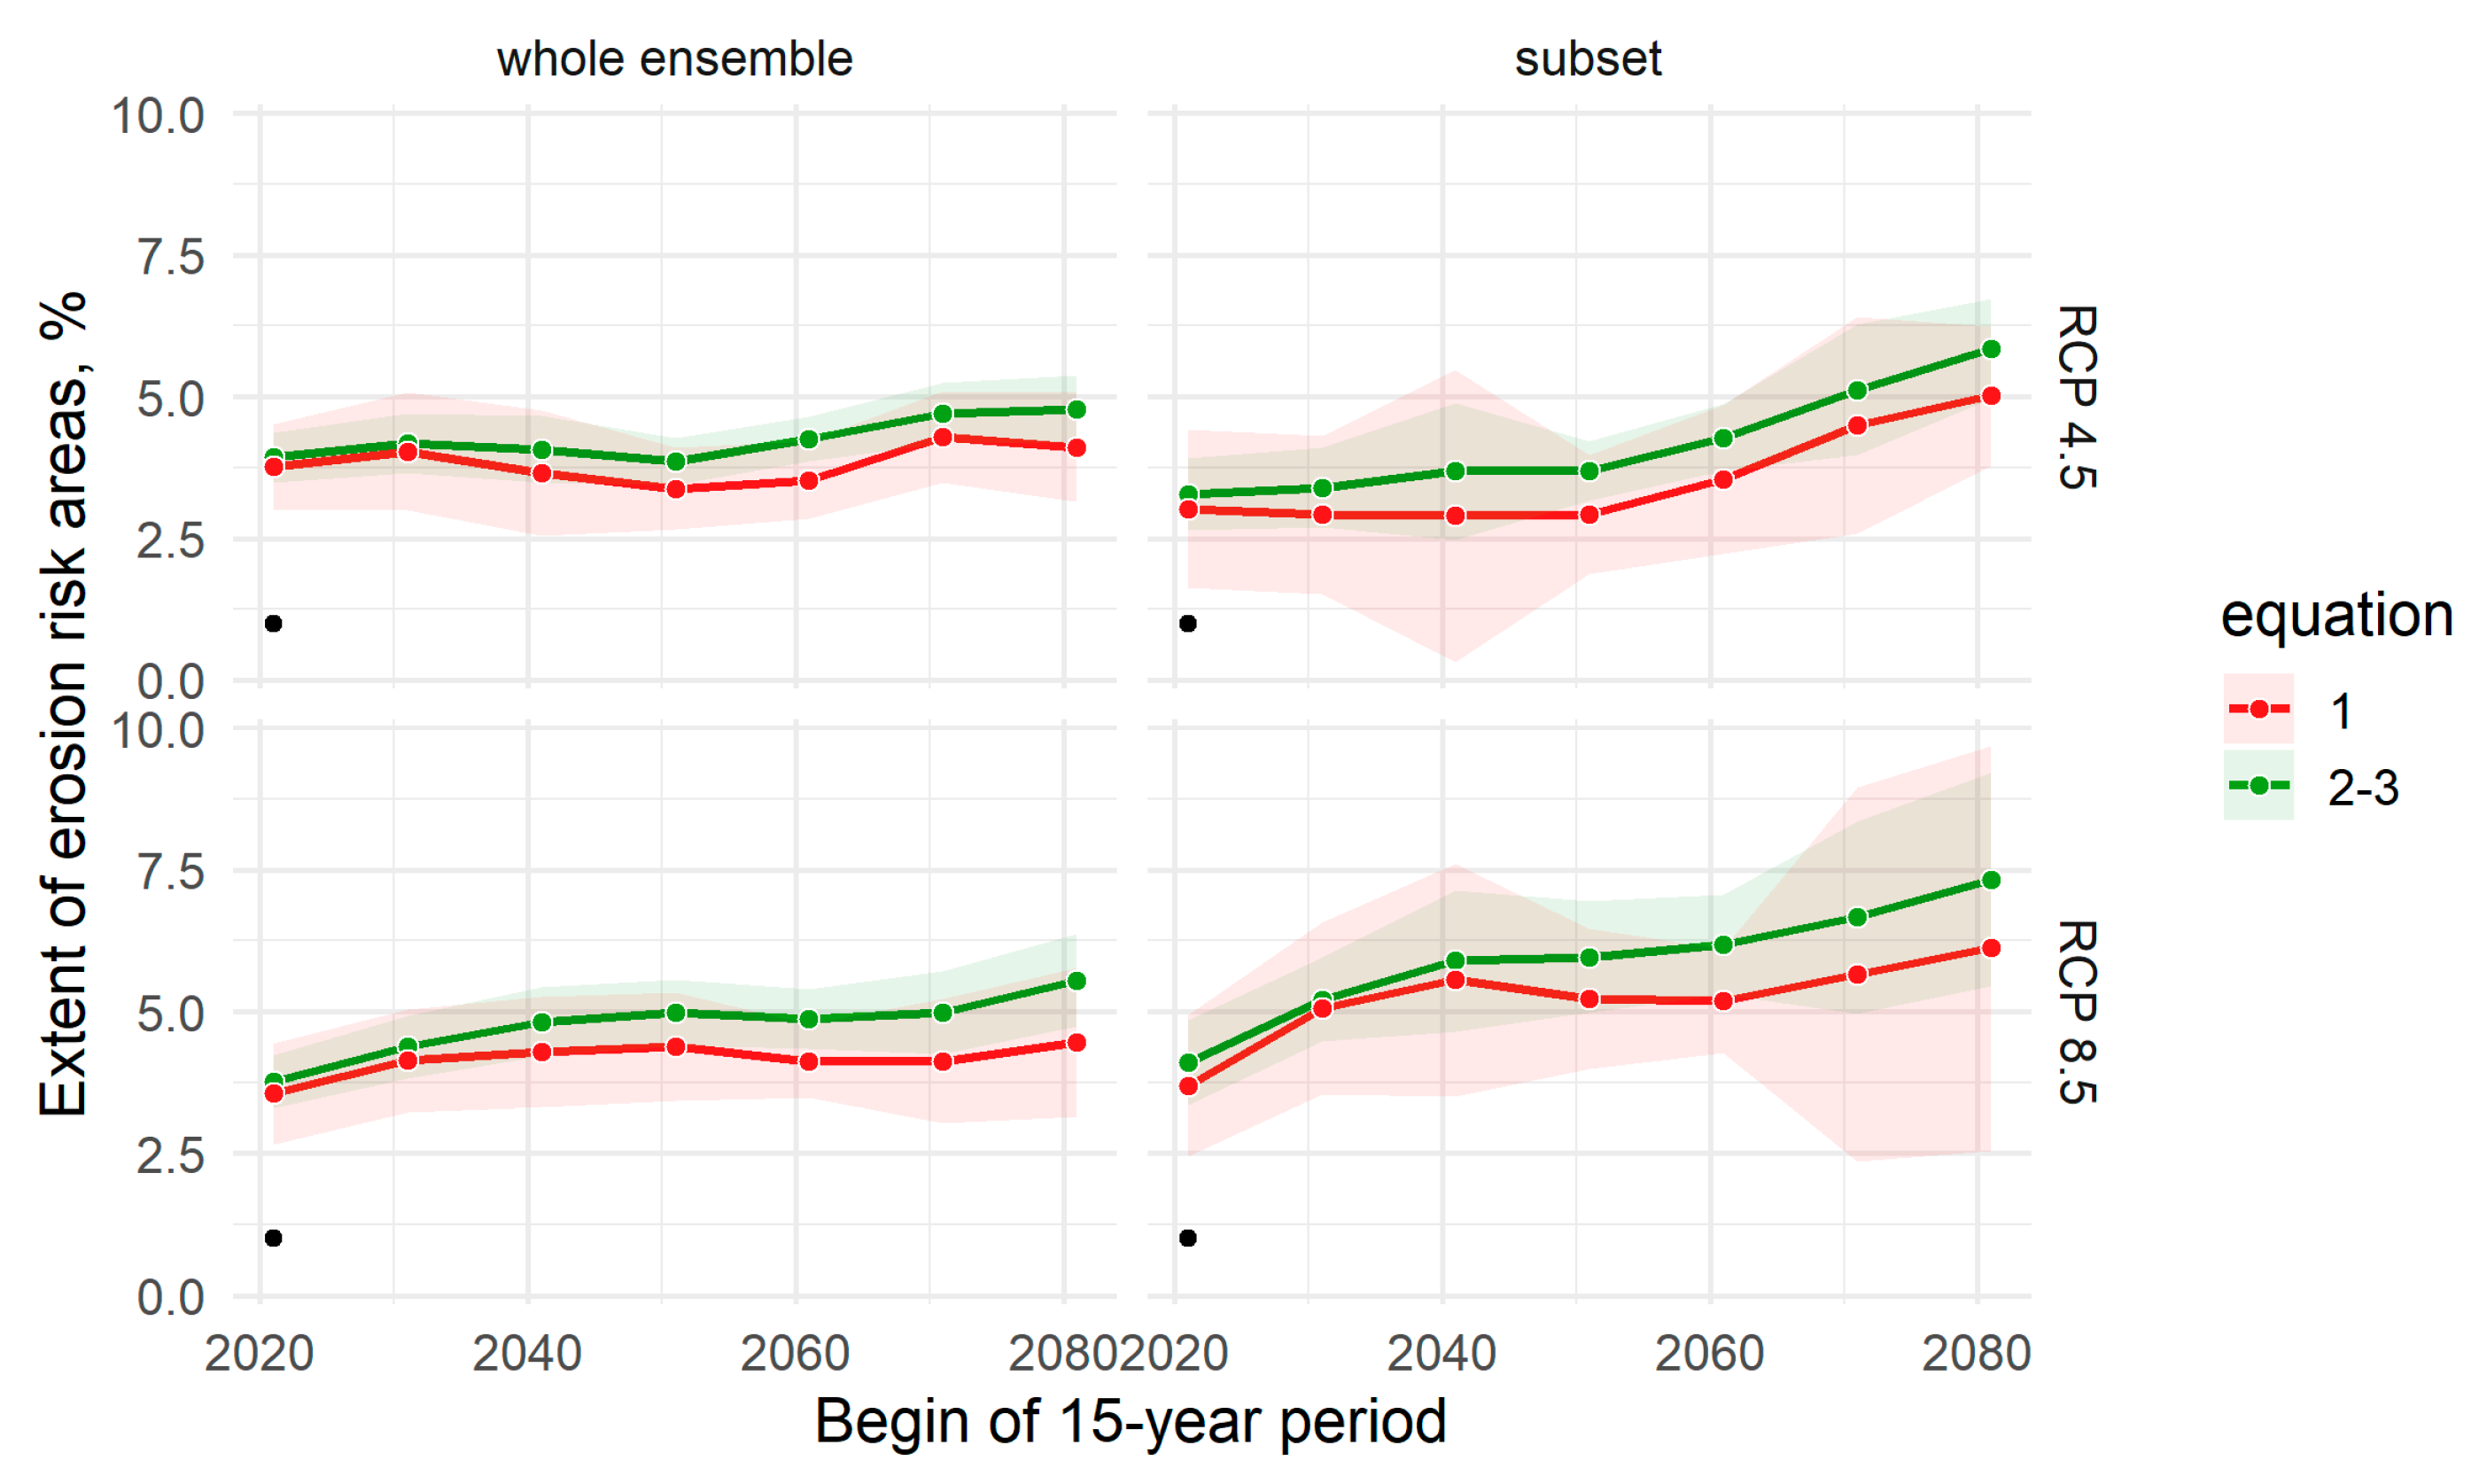
Due to the spatial variability of R changes, of the other USLE factors, and of the distribution of arable land, changes of R and the extent of risk areas on arable land can differ. In Brandenburg, the risk areas might in fact increase more than the R factor, for instance from currently 3% to 6% by mid-century (2041–2065) with RCP 8.5 under status-quo land management, if the bias-corrected ensemble subset was applied (Figure 10), while the average R factor may raise by about 40% (Figure 6, left column). In accordance to the R factor, the heavy-rainfall indices favored a more pronounced change in risk areas than the total sum.

4. Discussion

4.1. Indices to Estimate Current R Factors

The variability of total summer rainfall does not match the variability of R factors in Brandenburg. This explains the lack of accuracy of the existing DIN model, which cannot be resolved by a re-calibration. Instead, heavy-rainfall sums are more suitable for regional assessments of soil erosion risks. By changing the rainfall index, the estimated R factors and potential soil loss in the Southern part increase relatively to the northern part which corresponds to its higher calculated R factors (the 4 stations with R > 90 kJ m−2 mm h−1 are located in the South-Eastern part).
Given the low performance of the existing DIN models across the Central Plains ecoregion [11], this adjustment can help to improve the delineation of risk areas in other regions as well. However, the application of such simple empirical relationships is inherently impaired by the aggregated indices, and much of the unexplained variability of 40% has to be attributed to our use of daily data. Soil erosion often occurs during short peak intensities and the extreme erosivity of single events can considerably affect local R factors as multi-year averages. Likewise, interpolated station data cannot capture the high variability of rainfall erosivity even over short distances [46,47]. Better regional and national datasets are unavailable. Nonetheless, the data quality is continuously improving, including radar data [48,49].

4.2. Climate Change Impacts on R Factors and the Soil Erosion Risk

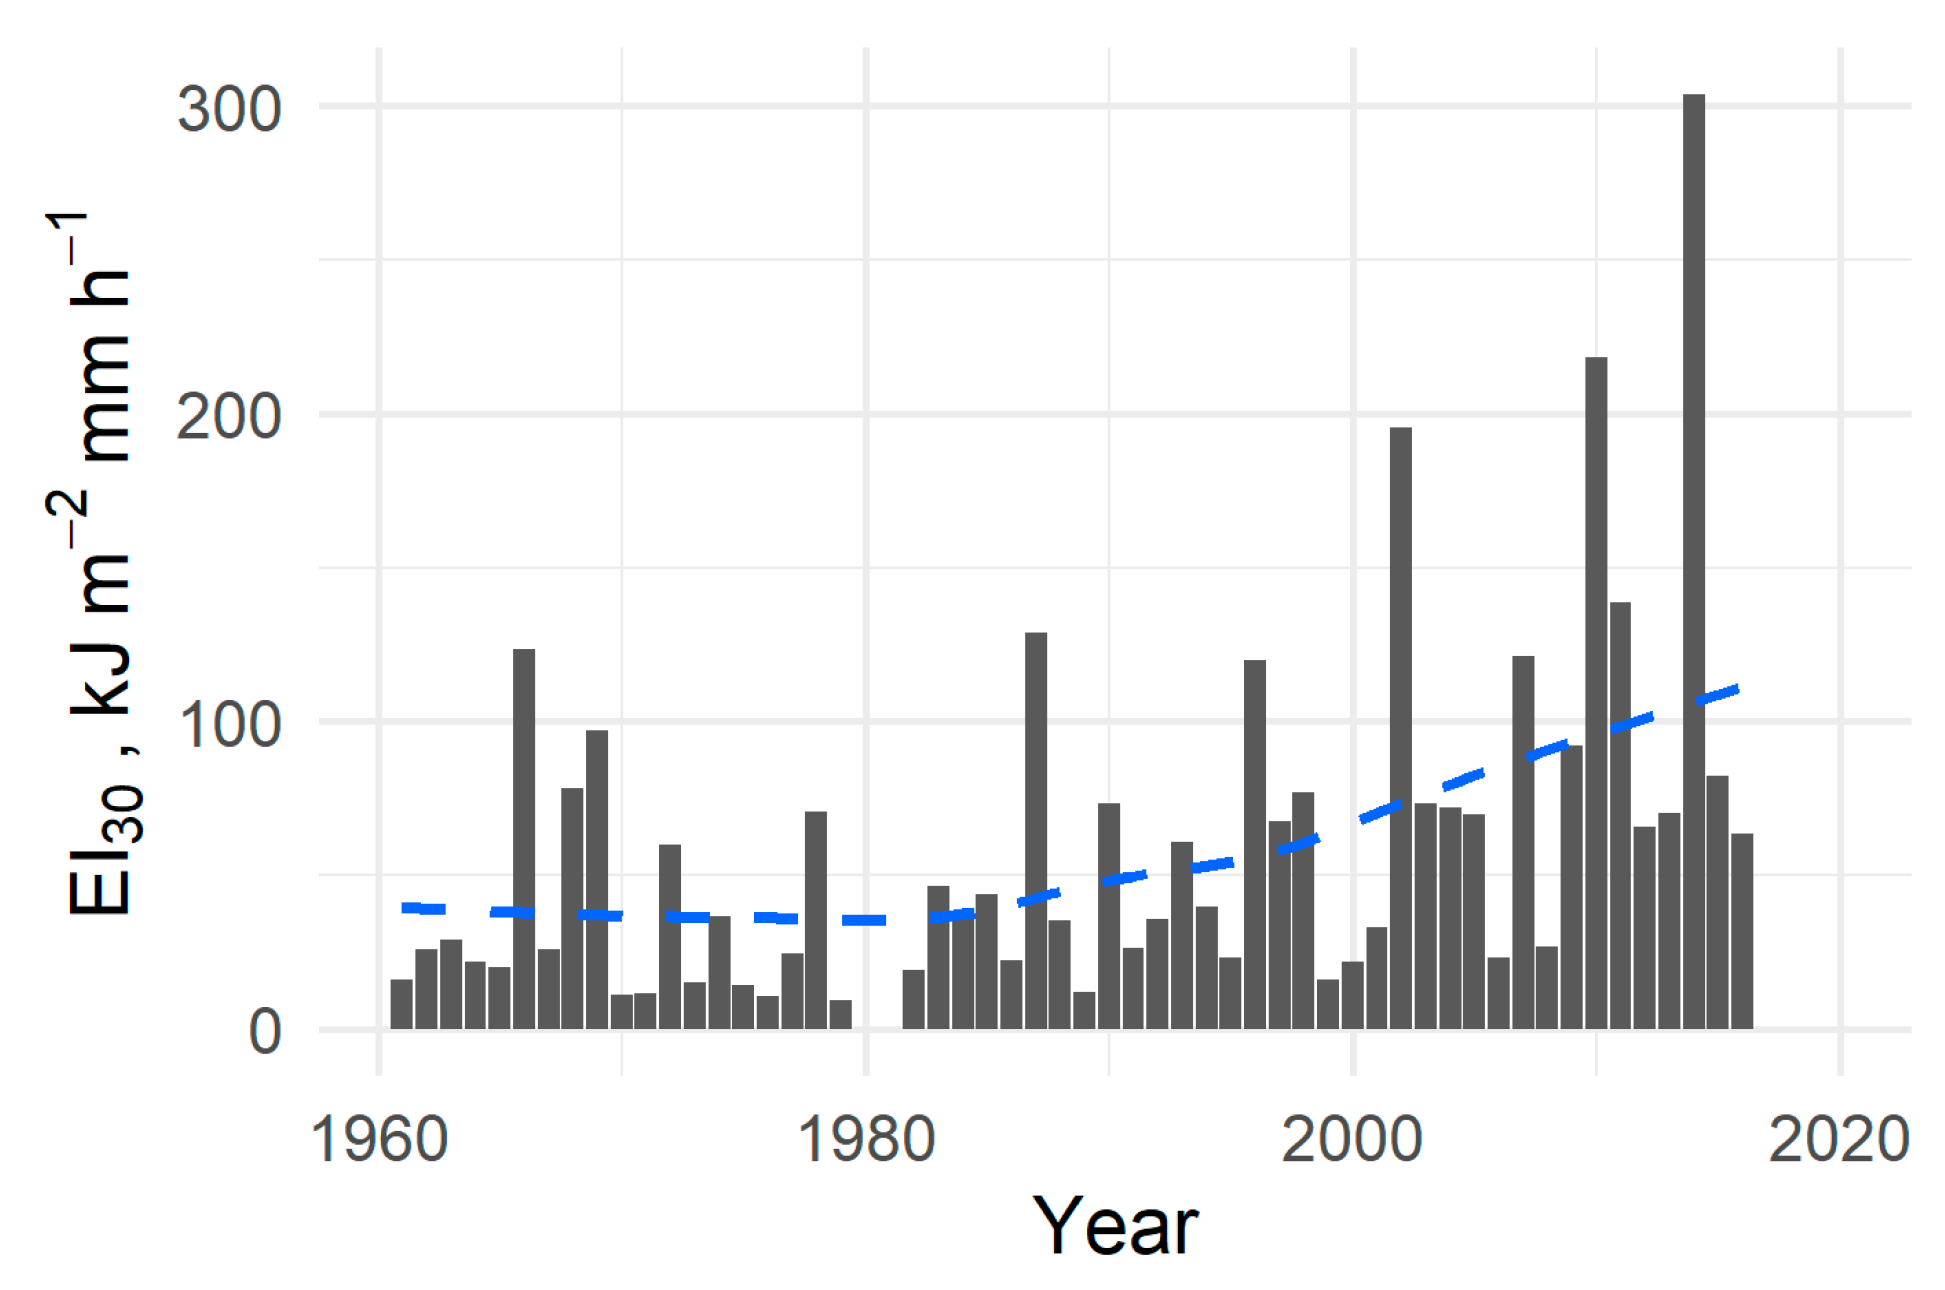
The significant underestimation of the calculated recent R factors by the existing DIN regression model indicates that the climate-based erosion risk increased since the 1990s in NE Germany. This corresponds well to rising total and heavy rainfalls in summer and is confirmed by an independent multi-decadal dataset with steadily increasing maximum and minimum annual values (Figure 11) and lower historical values for NE Germany [16]. Similar increases during the last decades were also reported for Western Germany [28] and recently deducted for the whole country [49].
Despite all model uncertainty, the climate scenarios consistently suggest that the rainfall erosivity and the erosion risk for the whole of Brandenburg might not return to levels of 2–3 decades ago—as observed during the 20th century in Western Germany [28] and suggested before to occur mid-century in NE Germany [32]. While the GCM HadGEM2 appeared twice in our ensemble subset, the rather low mid-century impact of a moderate climate change (RCP 4.5 in Figure 9) is nonetheless in contrast to the significant increase as derived in a European analysis [31]. However, the latter two studies relied only on a single and statistically downscaled GCM rather than an ensemble of dynamical RCM as used by CORDEX. The RCM type was recently shown to affect the direction of rainfall trends in Germany [33] (and also noted in Reference [32]).
A moderate climate change might, thus, open a window of opportunity to discuss and establish climate change adaptation, especially in southern Brandenburg. More soil conservation and better soil coverage on arable land are effective agricultural measures to mitigate the on-site and off-site impacts of intensified soil erosion under climate change.

4.3. Impact of Index Choice on Future R Factors and other Sources of Uncertainty

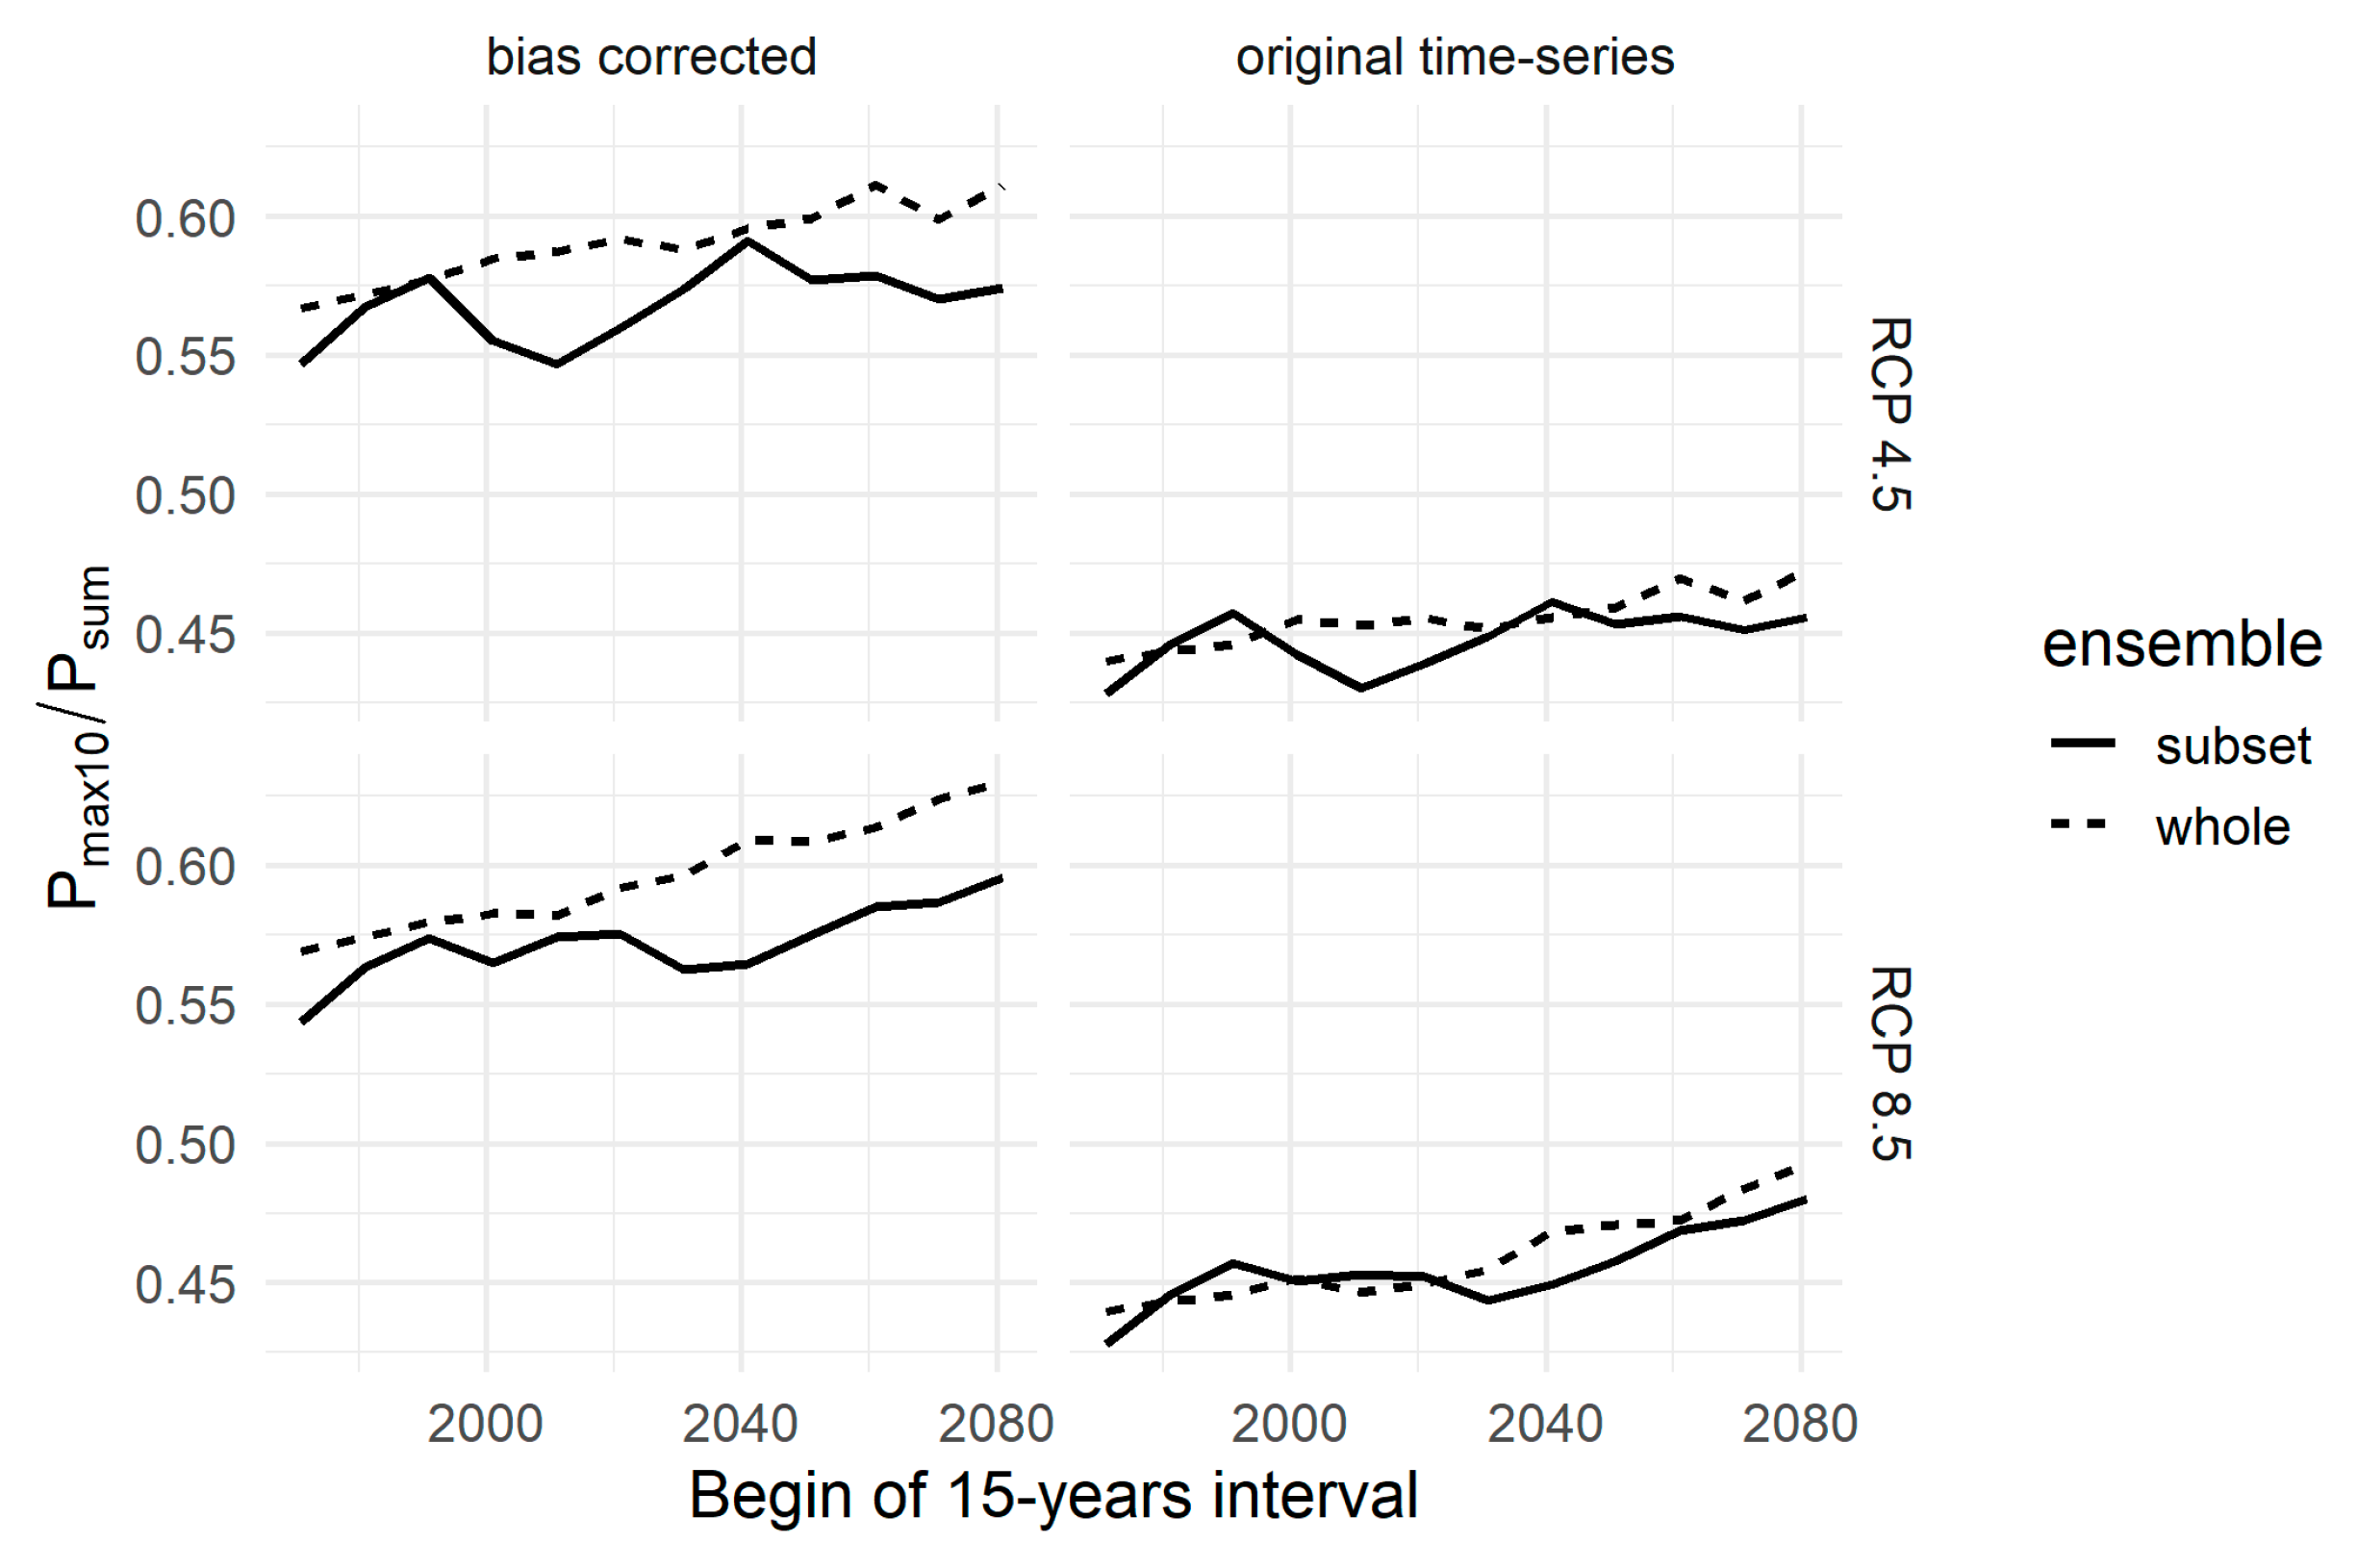
The choice of the R estimator, i.e., the replacement of the currently used total sum by heavy-rainfall indices, can affect the trend similarly to other modelling decisions as sources of uncertainty in scenario analyses. The impact on trend strength—the increase of R and the erosion risk was stronger for heavy-rainfall than for total sums—supports findings, e.g., by References [33] and [34]: future summers might be characterized by more concentrated rainfall and longer dry spells, especially with RCP 8.5 (Figure 12).
Additionally, past and future R factors were more prone to model uncertainty if estimated from total instead of the heavy-rainfall sums. While a careful selection of the climate models and a bias correction can also help to reduce this uncertainty, both implicitly assume that model deviations are stationary which might not necessarily hold true under climate change conditions [50]. While certain combinations of GCM and RCM depicted the spatio-temporal variability of rainfall indices particularly well in the past, none can unanimously be recommended as “the best performing”. Firstly, the CORDEX ensemble does not comprise all combinations of the available GCM and RCM. Secondly, the performance and ranking of climate models (and bias corrections) vary among ecoregions and depend on the hydro-climatic variables under consideration [41].
The similar results obtained with the two conceptually different heavy-rainfall indices show that the exact definition of “heavy rainfall days” is of minor relevance for the estimation of current and future R factors. The underestimation of the recent increase and the trend towards more and more heavy rainfall in summer point to the unknown effect of climate change on peak intensities of storm events. Should extreme events, such as the maximum value in our time-series (Appendix C) or the reported values by Reference [51], occur more frequently, even our revised empirical relationships would underestimate the future erosion risk and would thus become obsolete.

Author Contributions

Conceptualization, A.G.; Data curation, A.G. and M.V.; Formal analysis, A.G.; Funding acquisition, A.G. and M.V.; Investigation, A.G.; Methodology, A.G. and J.K.; Project administration, A.G.; Resources, J.K. (adapted CMHyd software) and D.D. (erosion map, data for Figure 12); Software, A.G. and J.K.; Supervision, M.V.; Validation, A.G. and D.D.; Visualization, A.G.; Writing—original draft, A.G.; Writing—review & editing, A.G., J.K., D.D. and M.V.

Funding

A.G. was funded by the German “Bundesministerium für Umwelt, Naturschutz und nukleare Sicherheit (Federal Ministry for the Environment, Nature Conservation and Nuclear Safety)”, grant number 03DAS074. J.K. was funded by the German “Bundesministerium für Bildung und Forschung (Federal Ministry of Education and Research)” within the GLANCE project, grant number 01LN1320A. The publication of this article was funded by the Open Access Fund of the Leibniz Association.

Acknowledgments

We thank the German Meteorological Service (DWD) for providing the precipitation data and for the revision of suspicious values. We very much acknowledge the World Climate Research Programme’s Working Group on Regional Climate and the Working Group on Coupled Modelling, former coordinating body of CORDEX and responsible panel for CMIP5 as well as the climate modelling groups for producing and making available their model outputs (cf. Table 3). We also appreciate the fast review process and the helpful comments of two anonymous reviewers. J.K. and A.G. express their gratitude to H. Rathjens for providing the CMHyd software and the support with the bias correction.

Conflicts of Interest

The authors declare no conflict of interest. The funders had no role in the design of the study; in the collection, analyses, or interpretation of data; in the writing of the manuscript, or in the decision to publish the results.

Appendix A

The R factor of the USLE is the long-term average annual sum of EI30, the rainfall erosivity of a storm event. EI30 is the product of the total kinetic energy E (in kJ m−2 mm h−1) and the peak 30-min intensity (I30, in mm h−1). Erosive storm events exceed the thresholds of 10 mm total rainfall or of 10 mm h−1 peak intensity within 30 min. Each event is separated by gaps of more than 6 h. Following [11,12], E was derived from the intensity I (mm h−1) and precipitation P (mm) for each time step i (Equation (A1)). Note, that the unit kJ m−2 mm h−1 (or N h−1) for our R factors equals 0.1 MJ mm ha−1 h−1, e.g., used by [15]. Accordingly, the calculation of the soil loss in tons ha-1 requires USLE K factors in tons ha−1 h N−1 while the other USLE factors are dimensionless.
E = i = 1 n E i   with E i = { 0 I i < 0.05 ( 11.89 + 8.73 log I i ) P i × 10 3 5.05 I i 76.2 28.33 P i × 10 3 I i > 76.2

Appendix B

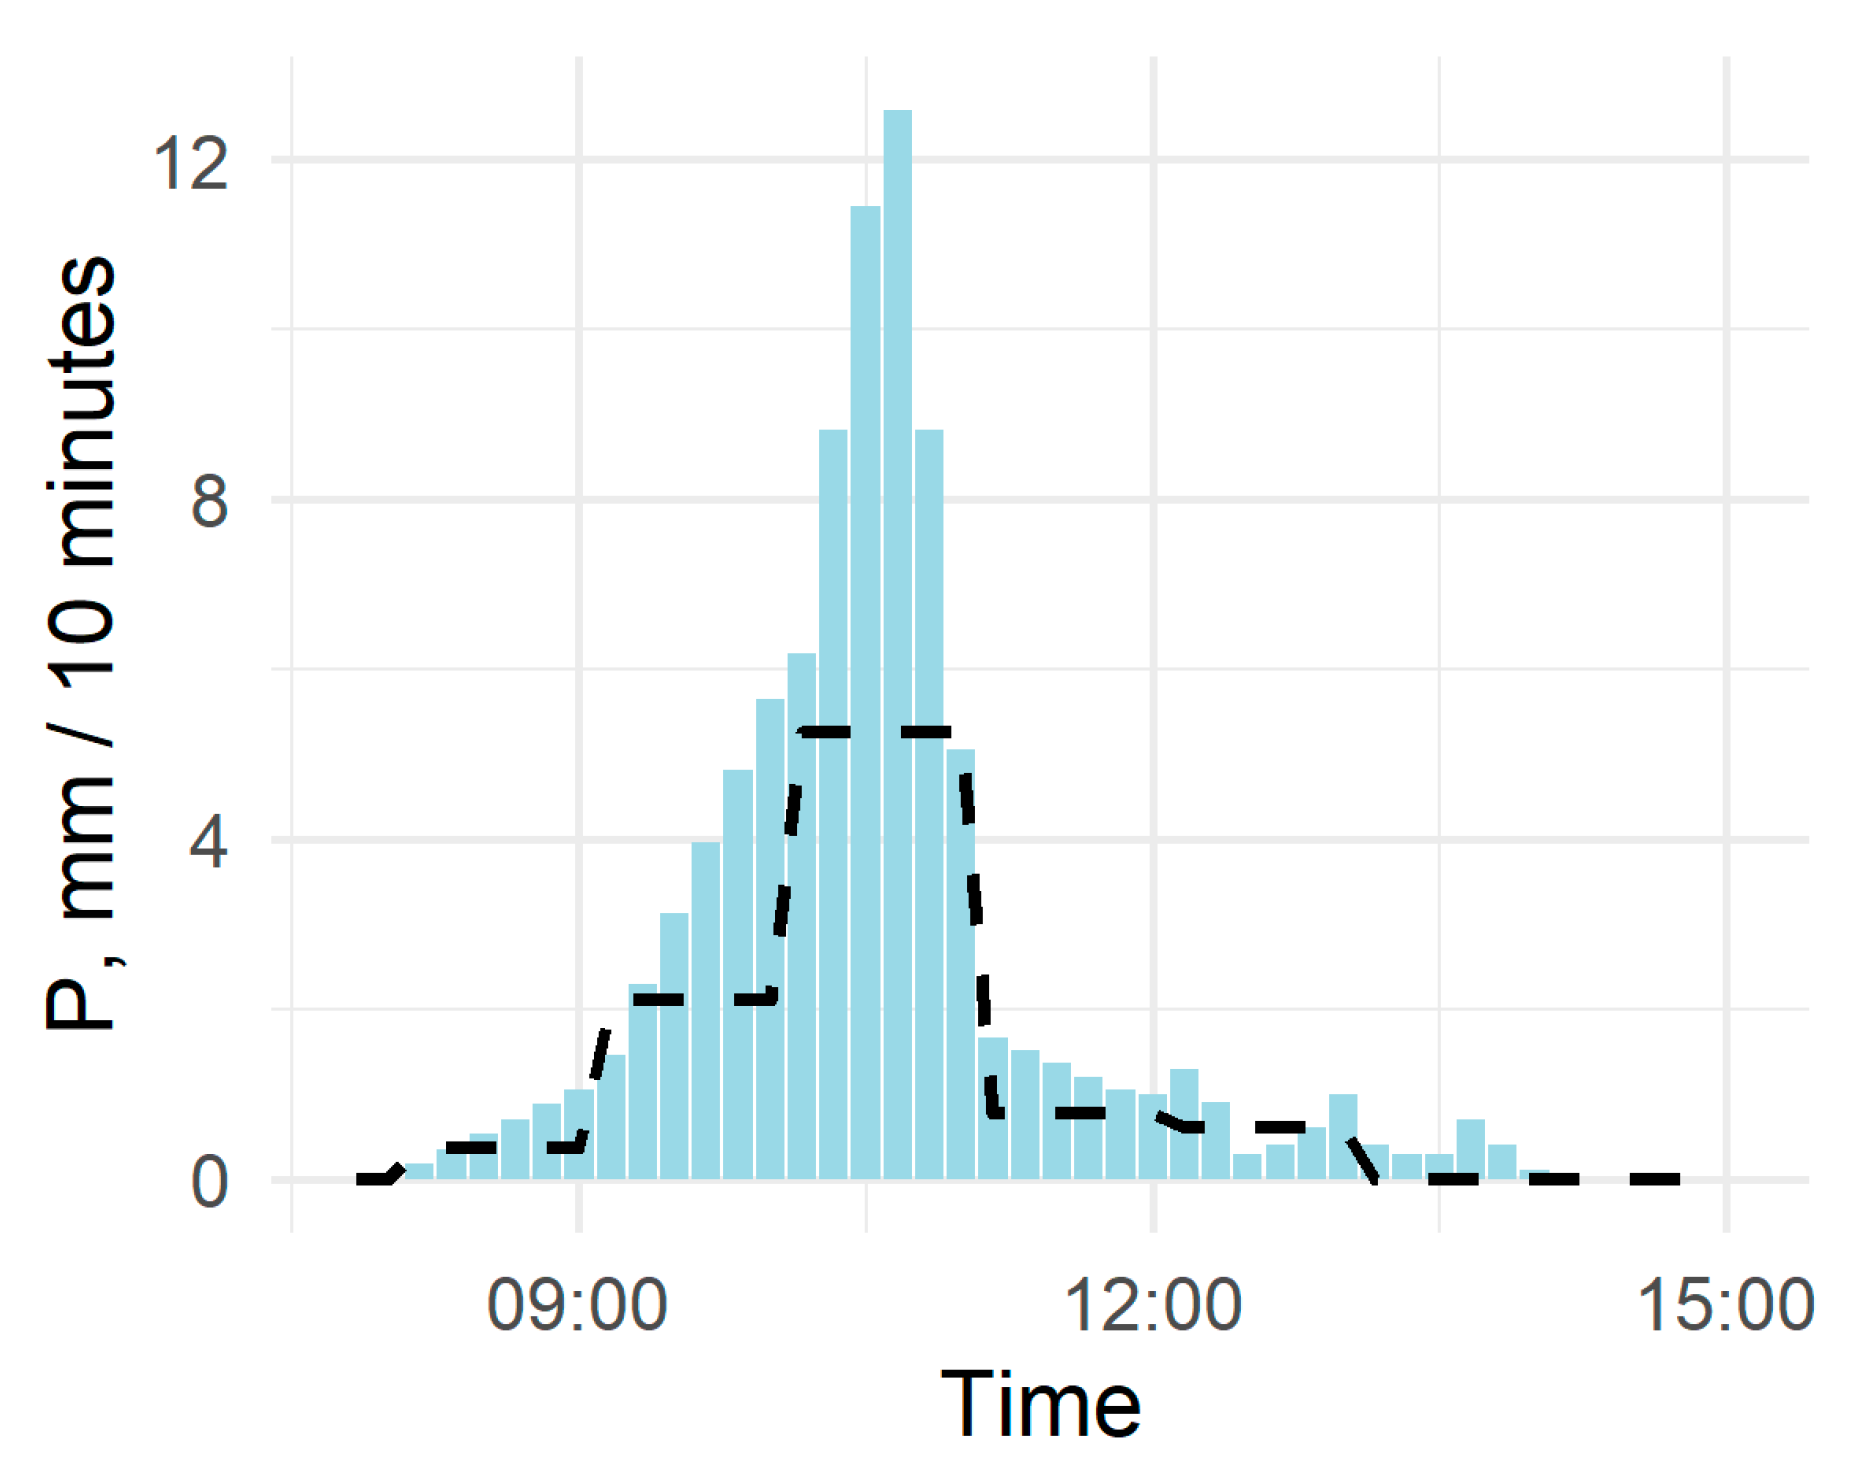
The 10-min data was aggregated and compared to daily and hourly sums from [36]. As the control data is not a priori error-free, we asked the DWD to revise deviations (gaps and spurious values) with the strongest impact on the R factors ([52,53], Table A1). The missing data at station 880 was estimated from rainfall radar data (RADOLAN RW) [36] adjusted to the conventionally measured value of 85.7 mm/6 h by assuming linear changes during each hour (Figure A1). The EI30 value increased from 5.6 to 163.7 kJ m−2 mm h−1.
Table A1. High-resolution data revised by DWD, station id according to Table 1.
Station IDDateValue (mm d−1)Update
8801999-08-03134.70
8802014-08-0416.9101.9 1
4302003-01-0876.10
4302006-08-25130-
61702009-06-3043.6- 2
1 Missing data interpolated (see text for details), 2 daily data incorrect.
Figure A1. Interpolated rainfall (columns) from hourly radar data (average values as broken line).
Water 11 00904 g0a1

Appendix C

The highest and most intense rainfall event in the dataset occurred on 25 August 2006 at Berlin Tegel (station ID 430 in Table 1). During 70 minutes, between 17:10 and 18:19, more than 122 mm was registered which corresponds to more than 20% of the total precipitation in this year (597 mm, Figure A2). The peak intensity of I30 = 135 mm/h resulted in an erosivity of 494 kJ m−2, or 86% of the annual EI30. The R factor for the years 2000-15 was 94 kJ m−2 mm h−1 with and 62 kJ m−2 mm h−1 without this event. Due to the much lower amount (cf. Figure A3) and intensity of rainfall, the daily erosivity at other climate stations was below 10 kJ m−2 mm h−1. Information on the weather conditions in Central Europe at this time are available online [54] (in German).
Figure A2. An extreme event: More than 20% of the annual precipitation occurred during 70 min.
Water 11 00904 g0a2
Figure A3. A singular event (dark blue): The rainfall amount on this day was significantly lower elsewhere, as well as the rainfall erosivity (not shown). Data source: RADOLAN RW [36]. The linear features are artifacts due to radar shadows.
Water 11 00904 g0a3

Appendix D

Table A2 lists the aggregated rankings as shown in Figure 4. The spatial variability of Psum was, as expected, almost identical between the bias-corrected (KGE ≈ 1) climate models and the REGNIE data, and in general very good for the two other variables (KGE > 0.7). Although the mostly negative KGE for the linear trends are not satisfactory, the bias correction could significantly reduce RMSE and APB (Table A3).
Table A2. Ranking of climate models (average of RCP 4.5 & RCP 8.5). The model ID corresponds to Table 3.
IDTrend (KGE)Trend (APB)Trend (RMSE)Trend (Mean)Spatial (KGE)Spatial (APB)Spatial (RMSE)Spatial (Mean)Mean
1710.610.69.410.811.811.711.410.4
2 14.14.54.44.35.14.14.14.44.35
314.31414.414.38.18.88.68.511.4
47.19.18.58.28.111.111.310.19.15
5 15.71.82.13.26.25.85.35.74.45
611.210.310.710.77.25.86.36.48.55
7 14.25.55.65.19.987.88.66.85
85.46.66.36.18.18.88.88.57.3
97.710.49.89.312.412.712.712.610.95
10 184.24.25.46.25.35.45.65.5
11 15.93.73.74.43.83.33.33.53.95
126.46.56.36.49.28.388.57.45
137.38.28.37.98.18.39.38.58.2
1414.213.413.913.88.19.89.89.211.5
1511.711.311.311.48.88.388.49.9
1 Selected for the ensemble subset.
Table A3. Average effect of bias correction on the performance of climate models.
Bias CorrectionVariableTrend (KGE)Trend (APB)Trend (RMSE)Spatial (KGE)Spatial (APB)Spatial (RMSE)
Pmax10−1.310.017.70.98.113.0
YesP11.8−0.818.524.70.812.816.0
Psum−0.56.923.11.00.00.1
Pmax10−1.215.826.10.414.525.1
NoP11.8−0.934.342.90.430.941.3
Psum−0.629.087.50.427.786.0

References

  1. FAO; ITPS. Status of the World’s Soil Resources; Food and Agriculture Organization of the United Nations and Intergovernmental Technical Panel on Soils: Rome, Italy, 2015; p. 607. [Google Scholar]
  2. Pimentel, D. Soil Erosion: A Food and Environmental Threat. Environ. Dev. Sustain. 2006, 8, 119–137. [Google Scholar] [CrossRef]
  3. Panagos, P.; Imeson, A.; Meusburger, K.; Borrelli, P.; Poesen, J.; Alewell, C. Soil Conservation in Europe: Wish or Reality? LDD 2016, 27, 1547–1551. [Google Scholar] [CrossRef]
  4. Verheijen, F.G.A.; Jones, R.J.A.; Rickson, R.J.; Smith, C.J. Tolerable versus actual soil erosion rates in Europe. Earth-Sci. Rev. 2009, 94, 23–38. [Google Scholar] [CrossRef]
  5. Panagos, P.; Standardi, G.; Borrelli, P.; Lugato, E.; Montanarella, L.; Bosello, F. Cost of agricultural productivity loss due to soil erosion in the European Union: From direct cost evaluation approaches to the use of macroeconomic models. LDD 2018, 29, 471–484. [Google Scholar] [CrossRef]
  6. Rickson, R.J. Can control of soil erosion mitigate water pollution by sediments? Sci. Total Environ. 2014, 468–469, 1187–1197. [Google Scholar] [CrossRef]
  7. Zessner, M.; Zoboli, O.; Hepp, G.; Kuderna, M.; Weinberger, C.; Gabriel, O. Shedding Light on Increasing Trends of Phosphorus Concentration in Upper Austrian Rivers. Water 2016, 8, 404. [Google Scholar] [CrossRef]
  8. Einsele, G.; Hinderer, M. Terrestrial sediment yield and the lifetimes of reservoirs, lakes, and larger basins. Geol. Rundsch. 1997, 86, 288–310. [Google Scholar] [CrossRef]
  9. Vanmaercke, M.; Poesen, J.; Govers, G.; Verstraeten, G. Quantifying human impacts on catchment sediment yield: A continental approach. Glob. Planet. Chang. 2015, 130, 22–36. [Google Scholar] [CrossRef]
  10. Borrelli, P.; Robinson, D.A.; Fleischer, L.R.; Lugato, E.; Ballabio, C.; Alewell, C.; Meusburger, K.; Modugno, S.; Schütt, B.; Ferro, V.; et al. An assessment of the global impact of 21st century land use change on soil erosion. Nat. Commun. 2017, 8, 2013. [Google Scholar] [CrossRef]
  11. Deutsches Institut für Normung. Bodenbeschaffenheit—Ermittlung der Erosionsgefährdung von Böden durch Wasser mit Hilfe der ABAG; Norm DIN 19708:2005-02; Beuth: Berlin, Germany, 2005. [Google Scholar]
  12. Schwertmann, U.; Vogl, W.; Kainz, M. Bodenerosion durch Wasser: Vorhersage des Abtrags und Bewertung von Gegenmahahmen; Ulmer: Stuttgart, Germany, 1987. [Google Scholar]
  13. Diodato, N.; Borrelli, P.; Fiener, P.; Bellocchi, G.; Romano, N. Discovering historical rainfall erosivity with a parsimonious approach: A case study in Western Germany. J. Hydrol. 2017, 544, 1–9. [Google Scholar] [CrossRef]
  14. Meusburger, K.; Steel, A.; Panagos, P.; Montanarella, L.; Alewell, C. Spatial and temporal variability of rainfall erosivity factor for Switzerland. Hydrol. Earth Syst. Sci. 2012, 16, 167–177. [Google Scholar] [CrossRef]
  15. Panagos, P.; Ballabio, C.; Borrelli, P.; Meusburger, K.; Klik, A.; Rousseva, S.; Tadić, M.P.; Michaelides, S.; Hrabalíková, M.; Olsen, P.; et al. Rainfall erosivity in Europe. Sci. Total Environ. 2015, 511, 801–814. [Google Scholar] [CrossRef]
  16. Deumlich, D. Beitrag zur Erarbeitung einer Isoerodentkarte Deutschlands. Arch. Acker- Pfl. Boden. 1993, 37, 17–24. [Google Scholar]
  17. Li, Z.; Fang, H. Impacts of climate change on water erosion: A review. Earth-Sci. Rev. 2016, 163, 94–117. [Google Scholar] [CrossRef]
  18. Zolina, O. Change in intense precipitation in Europe. In Changes in Flood Risk in Europe; Kundzewicz, Z.W., Ed.; IAHS Press: Wallingford, UK, 2012; pp. 97–120. [Google Scholar]
  19. Zolina, O.; Simmer, C.; Belyaev, K.; Gulev, S.K.; Koltermann, P. Changes in the Duration of European Wet and Dry Spells during the Last 60 Years. J. Clim. 2013, 26, 2022–2047. [Google Scholar] [CrossRef]
  20. Łupikasza, E.B. Seasonal patterns and consistency of extreme precipitation trends in Europe, December 1950 to February 2008. Clim. Res. 2017, 72, 217–237. [Google Scholar] [CrossRef]
  21. van den Besselaar, E.J.M.; Klein Tank, A.M.G.; Buishand, T.A. Trends in European precipitation extremes over 1951–2010. Int. J. Climatol. 2013, 33, 2682–2689. [Google Scholar] [CrossRef]
  22. Hänsel, S.; Petzold, S.; Matschullat, J. Precipitation Trend Analysis for Central Eastern Germany 1851–2006. In Bioclimatology and Natural Hazards; Střelcová, K., Mátyás, C., Kleidon, A., Lapin, M., Matejka, F., Blaženec, M., Škvarenina, J., Holécy, J., Eds.; Springer: Dordrecht, The Netherlands, 2009; pp. 29–38. [Google Scholar]
  23. Łupikasza, E.B.; Hänsel, S.; Matschullat, J. Regional and seasonal variability of extreme precipitation trends in southern Poland and central-eastern Germany 1951–2006. Int. J. Climatol. 2011, 31, 2249–2271. [Google Scholar] [CrossRef]
  24. Murawski, A.; Zimmer, J.; Merz, B. High spatial and temporal organization of changes in precipitation over Germany for 1951–2006. Int. J. Climatol. 2016, 36, 2582–2597. [Google Scholar] [CrossRef]
  25. Zolina, O. Multidecadal trends in the duration of wet spells and associated intensity of precipitation as revealed by a very dense observational German network. Environ. Res. Lett. 2014, 9, 025003. [Google Scholar] [CrossRef]
  26. Pińskwar, I.; Choryński, A.; Graczyk, D.; Kundzewicz, Z.W. Observed changes in extreme precipitation in Poland: 1991–2015 versus 1961–1990. Theor. Appl. Climatol. 2018. [Google Scholar] [CrossRef]
  27. Beranová, R.; Kyselý, J. Trends of precipitation characteristics in the Czech Republic over 1961–2012, their spatial patterns and links to temperature and the North Atlantic Oscillation. Int. J. Climatol. 2018, 38, e596–e606. [Google Scholar] [CrossRef]
  28. Fiener, P.; Neuhaus, P.; Botschek, J. Long-term trends in rainfall erosivity-analysis of high resolution precipitation time series (1937–2007) from Western Germany. Agric. For. Meteorol. 2013, 171–172, 115–123. [Google Scholar] [CrossRef]
  29. Verstraeten, G.; Poesen, J.; Demarée, G.; Salles, C. Long-term (105 years) variability in rain erosivity as derived from 10-min rainfall depth data for Ukkel (Brussels, Belgium): Implications for assessing soil erosion rates. J. Geophys. Res. Atmos. 2006, 111, 1–11. [Google Scholar] [CrossRef]
  30. Hanel, M.; Pavlásková, A.; Kyselý, J. Trends in characteristics of sub-daily heavy precipitation and rainfall erosivity in the Czech Republic. Int. J. Climatol. 2016, 36, 1833–1845. [Google Scholar] [CrossRef]
  31. Panagos, P.; Ballabio, C.; Meusburger, K.; Spinoni, J.; Alewell, C.; Borrelli, P. Towards estimates of future rainfall erosivity in Europe based on REDES and WorldClim datasets. J. Hydrol. 2017, 548, 251–262. [Google Scholar] [CrossRef]
  32. Wurbs, D.; Steininger, M. Wirkungen der Klimaänderungen auf die Böden—Untersuchungen zu Auswirkungen des Klimawandels auf die Bodenerosion durch Wasser; UBA: Dessau-Roßlau, Germany, March 2011; p. 225. [Google Scholar]
  33. Hübener, H.; Bülow, K.; Fooken, C.; Früh, B.; Hoffmann, P.; Höpp, S.; Keuler, K.; Menz, C.; Mohr, V.; Radtke, K.; et al. ReKliEs-De Ergebnisbericht; World Data Center for Climate (WDCC) at DKRZ: Hamburg, Germany, December 2017; p. 56. [Google Scholar]
  34. Schwarzak, S.; Hänsel, S.; Matschullat, J. Projected changes in extreme precipitation characteristics for Central Eastern Germany (21st century, model-based analysis). Int. J. Climatol. 2015, 35, 2724–2734. [Google Scholar] [CrossRef]
  35. European Environment Agency. Ecoregions for Rivers and Lakes. Available online: https://www.eea.europa.eu/ds_resolveuid/2C5D9354-5FC8-4EB3-BD7A-299D95EBAF (accessed on 13 March 2019).
  36. Deutscher Wetterdienst. Available online: ftp://ftp-cdc.dwd.de (accessed on 12 May 2016).
  37. ECA&D. Website of the European Climate Assessment & Dataset Project. Available online: https://eca.knmi.nl/ (accessed on 22 February 2019).
  38. Deumlich, D.; Völker, L. Bodenabtragskarte für Brandenburg in 25m-Auflösung; Leibniz Centre for Agricultural Landscape Research: Müncheberg, Germany, 2012. [Google Scholar]
  39. Jacob, D.; Petersen, J.; Eggert, B.; Alias, A.; Christensen, O.B.; Bouwer, L.M.; Braun, A.; Colette, A.; Déqué, M.; Georgievski, G.; et al. EURO-CORDEX: New high-resolution climate change projections for European impact research. Reg. Environ. Chang. 2014, 14, 563–578. [Google Scholar] [CrossRef]
  40. Rathjens, H.; Bieger, K.; Srinivasan, R.; Chaubey, I.; Arnold, J.G. CMhyd User Manual—Documentation for Preparing Simulated Climate Change Data for Hydrologic Impact Studies. 2016, p. 16. Available online: https://swat.tamu.edu/media/115265/bias_cor_man.pdf (accessed on 21 December 2018).
  41. Kiesel, J.; Gericke, A.; Rathjens, H.; Wetzig, A.; Kakouei, K.; Jähnig, S.C.; Fohrer, N. Climate change impacts on ecologically relevant hydrological indicators in three catchments in three European ecoregions. Ecol. Eng. 2019, 127, 404–416. [Google Scholar] [CrossRef]
  42. Teutschbein, C.; Seibert, J. Bias correction of regional climate model simulations for hydrological climate-change impact studies: Review and evaluation of different methods. J. Hydrol. 2012, 456–457, 12–29. [Google Scholar] [CrossRef]
  43. Kling, H.; Fuchs, M.; Paulin, M. Runoff conditions in the upper Danube basin under an ensemble of climate change scenarios. J. Hydrol. 2012, 424–425, 264–277. [Google Scholar] [CrossRef]
  44. Nychka, D.; Furrer, R.; Paige, J.; Sain, S. Fields: Tools for Spatial Data, R package version 9.6; University Corporation for Atmospheric Research: Boulder, CO, USA, 2017. [Google Scholar]
  45. Ministry of Rural Development, Environment and Agriculture of the Federal State of Brandenburg. Digitales Feldblockkataster des Landes Brandenburg 2019. Available online: http://geobroker.geobasis-bb.de/index.php (accessed on 22 October 2018).
  46. Fiener, P.; Auerswald, K. Spatial variability of rainfall on a sub-kilometre scale. Earth Surf. Process. Landf. 2009, 34, 848–859. [Google Scholar] [CrossRef]
  47. Fischer, F.K.; Winterrath, T.; Auerswald, K. Temporal- and spatial-scale and positional effects on rain erosivity derived from point-scale and contiguous rain data. Hydrol. Earth Syst. Sci. 2018, 22, 6505–6518. [Google Scholar] [CrossRef]
  48. Fischer, F.K.; Kistler, M.; Brandhuber, R.; Maier, H.; Treisch, M.; Auerswald, K. Validation of official erosion modelling based on high-resolution radar rain data by aerial photo erosion classification. Earth Surf. Process. Landf. 2018, 43, 187–194. [Google Scholar] [CrossRef]
  49. Auerswald, K.; Fischer, F.K.; Winterrath, T.; Brandhuber, R. Rain erosivity map for Germany derived from contiguous radar rain data. Hydrol. Earth Syst. Sci. 2019, 32, 1819–1832. [Google Scholar] [CrossRef]
  50. Ehret, U.; Zehe, E.; Wulfmeyer, V.; Warrach-Sagi, K.; Liebert, J. HESS Opinions “Should we apply bias correction to global and regional climate model data?”. Hydrol. Earth Syst. Sci. 2012, 16, 3391–3404. [Google Scholar] [CrossRef]
  51. Vogel, E.; Deumlich, D.; Kaupenjohann, M. Bioenergy maize and soil erosion—Risk assessment and erosion control concepts. Geoderma 2016, 261, 80–92. [Google Scholar] [CrossRef]
  52. Köcher, A.; DWD, Offenbach, Hessen, Germany. Personal communication, 2016.
  53. Heil, U.; DWD, Offenbach, Hessen, Germany. Personal communication, 2016.
  54. Karlsruhe Institute of Technology. Wettergefahren-Frühwarnung. Available online: http://www.wettergefahren-fruehwarnung.de/Ereignis/20060830_e.html (accessed on 20 March 2019).
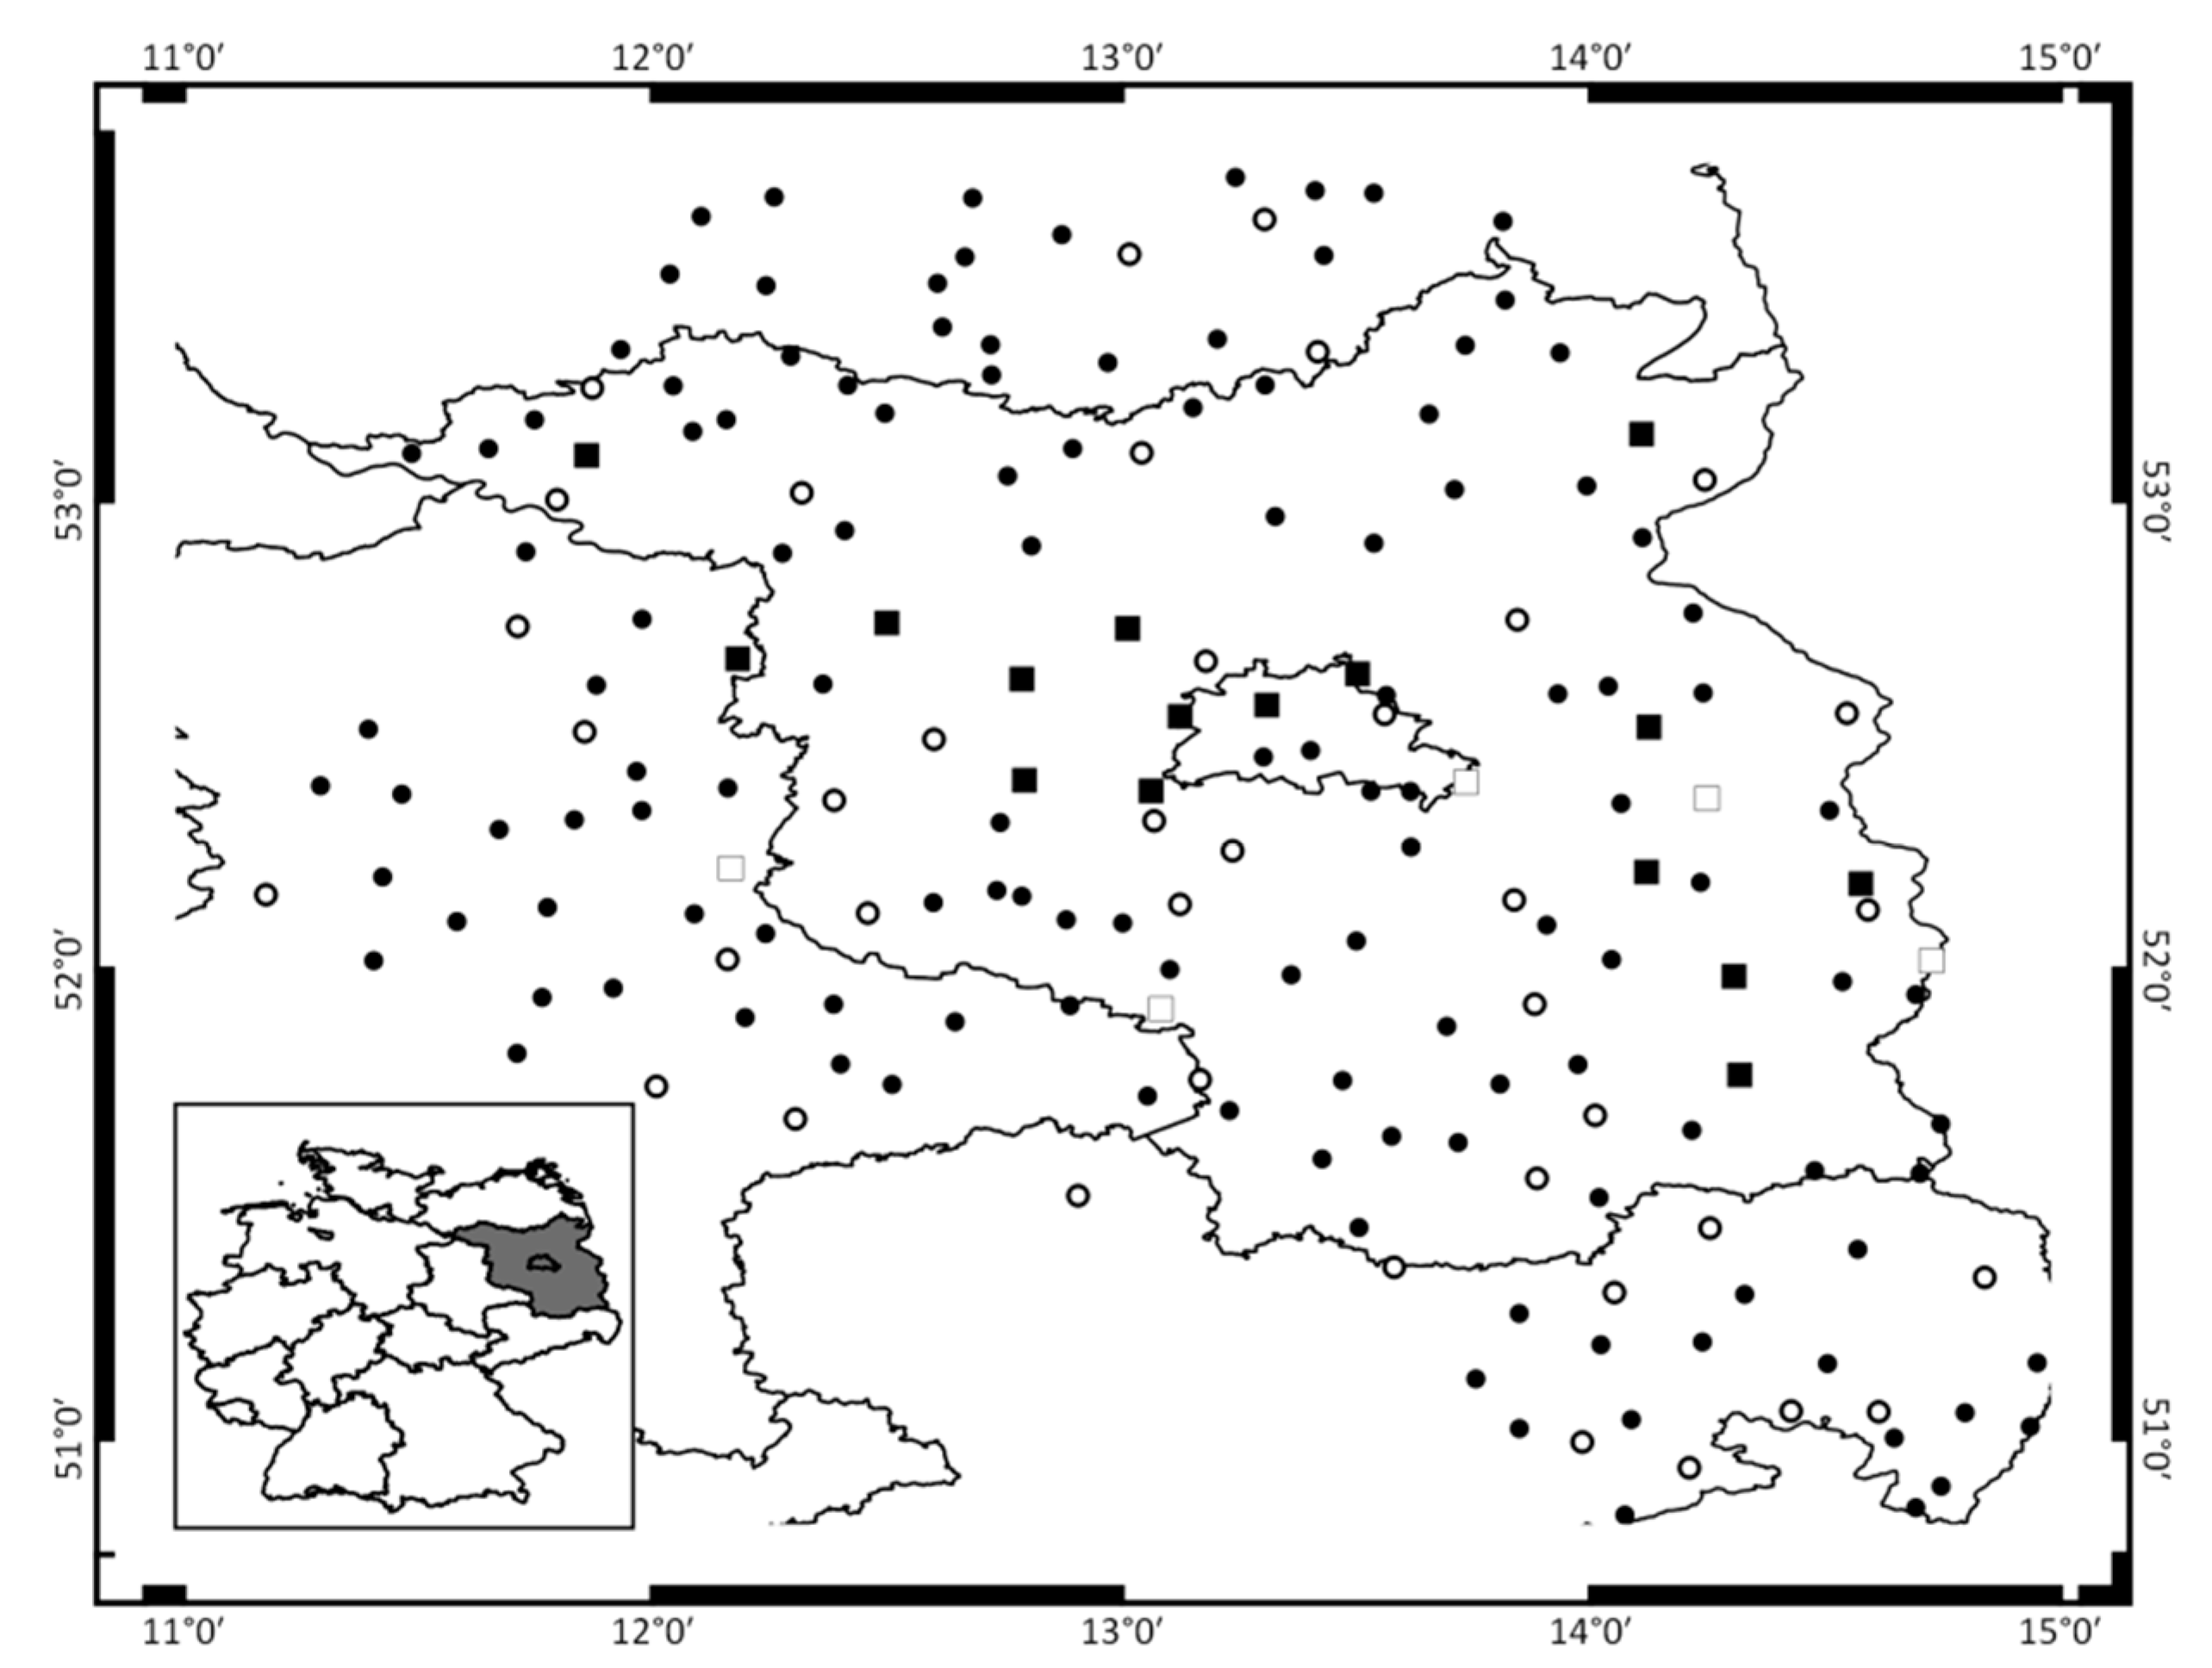
Figure 1. Climate stations used in this study and location of the study area in Germany (inset map), squares: stations with 10 min data for R calculation (Table 1), all stations with daily data to estimate R factors, bias correction of the climate models, and scenario analyses, black: stations with data for 1971–2015, hollow: stations with shorter time series. To harmonize the time series and to fill gaps we extracted the time series from regionalized station data.
Water 11 00904 g001
Figure 2. Variability of rainfall erosivity: (a) R factors estimated with the existing regression model were lower and less variability than the calculated R factors (1:1 line = perfect model agreement). The fixed R value of 50 kJ m−2 mm h−1 used for the current state erosion map corresponds to the upper boundary of the estimated R factors (vertical line) and the lower boundary of the calculated R factors (horizontal line). Both, calculation and estimation of R factors according to the German norm DIN; (b) average intra-annual distribution of the rainfall erosivity. Rainfall from October to April was far less erosive than summer rainfall and therefore not considered in the revised regression models for R factors in Brandenburg.
Water 11 00904 g002
Figure 3. Ratio of R factors estimated with Equation (2) and the DIN regression model, based on REGNIE data (2001–2015); similar spatial pattern if Equation (2) was replaced by Equation (3) and the DIN model by Equation (1).
Water 11 00904 g003
Figure 4. Average ranks for RCP 4.5 and 8.5 according to KGE, APB, and RMSE. Numbers correspond to the model ids in Table 3. The lower the rank, the better the model performance. Selected climate models for the ensemble subset in black.
Water 11 00904 g004
Figure 5. Historical R factors estimated with Equations (1)–(3), different ensembles of climate models (colored lines with 95%-confidence interval of the mean of climate models and stations) and the REGNIE data as reference (black); values relative to the reference period 2001–2015. Note: Both RCP and the three REGNIE results were averaged to improve readability.
Water 11 00904 g005
Figure 6. Variability of average R factors estimated with Equations (1)–(3), and the climate models, separated by bias correction (columns), RCP (rows), ensemble (line style), and rainfall index (color). (a) Changes were partly negative when Equation (1) (Psum) was applied to the uncorrected model ensemble for RCP 4.5.
Water 11 00904 g006
Figure 7. Trends of heavy and total rainfall sums averaged over 15 years and all stations. The bias correction resulted in lower total and slightly higher heavy-rainfall sums.
Water 11 00904 g007
Figure 8. Effect of modelling decisions on future R changes relative to the R changes estimated with the bias-corrected subset for RCP 4.5 and Equation (1) (R change relative to 2001-15, cf. Figure 6), alternative choices of bias correction (bc), ensemble (ens), RCP (rcp), and index (idx, mean of Equations (2) and (3)). Mean and confidence interval (p = 95%) of climate stations and four overlapping 15-year periods. Values in left-most column outside value range (2011–2055: 1.98 ± 1.02, 2051–2095: 41 ± 75).
Water 11 00904 g008
Figure 9. Percent change in the R factor 2041–2065 compared to 2001–2015 for a moderate climate change (RCP 4.5), using the bias-corrected ensemble subset and the average of Equations (2) and (3). Values interpolated with thin splines. The overall change for this combination is close to 0%.
Water 11 00904 g009
Figure 10. Future share of arable land with erosion risk, ensemble mean and confidence interval (p = 95%) of bias-corrected climate models for overlapping 15-year periods. Current value of 3.2% derived from the revised state erosion map in black.
Water 11 00904 g010
Figure 11. Annual variability of EI30 between April and October at Müncheberg (near station 3376), smoothed with a local weighted regression (blue line). Values for 1980-81 missing. Original data resolution: 10 min.
Water 11 00904 g011
Figure 12. Decadal change in the ratio of Pmax10 and Psum as derived from Figure 7.
Water 11 00904 g012
Table 1. Stations with high-resolution data for which R factors were calculated (end year is 2015).
IDNameLongitudeLatitudeStart YearCalculated R
kJ m−2 mm h−1
Data Gaps
400Berlin Buch13.50052.633200477.2
410Berlin Kaniswall13.73352.400200468.7
430Berlin Tegel 313.31752.5672000 161.9 2
714Neu Madlitz14.25052.367200596.9
880Cottbus 314.31751.7832000 183.9
1052Drewitz12.16752.217200385.4Jan–Mar 2003
1801Groß Kreutz12.80052.400200363.8
2625Kleßen12.50052.733200380.2Jan–Mar 2003 3 Nov–4 Apr
2733Kremmen13.01752.733200589.8
2856Langenlipsdorf13.08351.917200471.2
2997Lieberose14.30051.983200399.4Jan–Apr 2003
3015Lindenberg 314.11752.217200063.9
3376Müncheberg14.11752.517200499.1Dec 2005
3881Passow14.10053.150200552.0
3906Perleberg11.86753.100200467.7
3967Pohlitz14.56752.183200591.2Jan–Mar 2005
3987Potsdam 313.06752.383200076.6Nov–Dec 2000
4555Schollene12.18352.667200773.2
4637Staaken13.11752.533200951.8
5614Winterfeld-Sallenthin11.25052.750200465.4Jan–Mar 2004
5825Berge12.78352.617200364.7
6170Coschen14.73352.017200395.9Jan–Mar 2003
1 Corrected values (Appendix B), 2 as used for the regression models without an extreme event (Appendix C), 3 change from volumetric to weighing gauge.
Table 2. Overview of the climate data used in this study. The 188 data points comprise the 22 stations in Table 1. 2001–2015 was the reference period for scenario analyses.
PurposeData SourceResolutionData SetPeriodChapter
R calculationStation data10 min22≥2000–20152.2
Regression analysesREGNIEDaily22≥2000–20152.2
Bias correction, rankingREGNIE, climate modelsDaily1881971–20152.3
R scenariosClimate modelsDaily1881971–21002.3
Erosion risk areasREGNIEDaily(grid)2001–20152.2
Climate modelsDaily1882021–21002.4
Table 3. The output of climate models used in this study was available for RCP 4.5 and RCP 8.5.
IDInstituteGCMRCMEnsembleVersion
1CLMcomCNRM-CERFACS-CNRM-CM5CCLM4-8-17r1i1p1v1
2SMHICNRM-CERFACS-CNRM-CM5RCA4r1i1p1v1
3CLMcomICHEC-EC-EARTHCCLM4-8-17r12i1p1v1
4DMIICHEC-EC-EARTHHIRHAM5r3i1p1v1
5KNMIICHEC-EC-EARTHRACMO22Er1i1p1v1
6SMHIICHEC-EC-EARTHRCA4r12i1p1v1
7IPSL-INERISIPSL-IPSL-CM5A-MRWRF331Fr1i1p1v1
8SMHIIPSL-IPSL-CM5A-MRRCA4r1i1p1v1
9CLMcomMOHC-HadGEM2-ESCCLM4-8-17r1i1p1v1
10KNMIMOHC-HadGEM2-ESRACMO22Er1i1p1v2
11SMHIMOHC-HadGEM2-ESRCA4r1i1p1v1
12CLMcomMPI-M-MPI-ESM-LRCCLM4-8-17r1i1p1v1
13MPI-CSCMPI-M-MPI-ESM-LRREMO2009r1i1p1v1
14MPI-CSCMPI-M-MPI-ESM-LRREMO2009r2i1p1v1
15SMHIMPI-M-MPI-ESM-LRRCA4r1i1p1v1