Article

Modeling of Fertilizer Transport for Various Fertigation Scenarios under Drip Irrigation

1
Civil Engineering Department, Faculty of Engineering, Port Said University, Port Fouad 42523, Egypt
2
Division of Water Resources Engineering, Lund University, Box 118, SE-221 00 Lund, Sweden
3
Center for Middle Eastern Studies, Lund University, Box 201, SE-221 00 Lund, Sweden
*
Author to whom correspondence should be addressed.
Water 2019, 11(5), 893; https://doi.org/10.3390/w11050893
Submission received: 1 April 2019 / Revised: 18 April 2019 / Accepted: 20 April 2019 / Published: 28 April 2019
(This article belongs to the Special Issue Study of the Soil Water Movement in Irrigated Agriculture)

Abstract

:
Frequent application of nitrogen fertilizers through irrigation is likely to increase the concentration of nitrate in groundwater. In this study, the HYDRUS-2D/3D model was used to simulate fertilizer movement through the soil under surface (DI) and subsurface drip irrigation (SDI) with 10 and 20 cm emitter depths for tomato growing in three different typical and representative Egyptian soil types, namely sand, loamy sand, and sandy loam. Ammonium, nitrate, phosphorus, and potassium fertilizers were considered during simulation. Laboratory experiments were conducted to estimate the soils’ adsorption behavior. The impact of soil hydraulic properties and fertigation strategies on fertilizer distribution and use efficiency were investigated. Results showed that for DI, the percentage of nitrogen accumulated below the zone of maximum root density was 33%, 28%, and 24% for sand, loamy sand, and sandy loam soil, respectively. For SDI with 10 and 20 cm emitter depths, it was 34%, 29%, and 26%, and 44%, 37%, and 35%, respectively. Results showed that shallow emitter depth produced maximum nitrogen use efficiency varying from 27 to 37%, regardless of fertigation strategy. Therefore, subsurface drip irrigation with a shallow emitter depth is recommended for medium-textured soils. Moreover, the study showed that to reduce potential fertilizer leaching, fertilizers should be added at the beginning of irrigation events for SDI and at the end of irrigation events for DI. As nitrate uptake rate and leaching are affected by soil’s adsorption, it is important to determine the adsorption coefficient for nitrate before planting, as it will help to precisely assign application rates. This will lead to improve nutrient uptake and minimize potential leaching.

1. Introduction

Fertilization practice includes application of nitrogen, phosphate, and potassium before planting. For this purpose, manual broadcasting and mechanical spreading or spraying are used. Fertigation can be defined as the process of mixing irrigation water with fertilizers. Fertigation promotes overall root activity, improves nutrient mobility and uptake, as well as mitigating pollution of surface water and groundwater [1,2]. In Egypt, fertigation is practiced on only 13% of agricultural lands [3]. The fertigation technique is mainly used with nitrogen (N) and potassium (K) fertilizers [4].
For Egyptian agricultural conditions, nitrogen is considered one of the most important factors in crop production. Due to its excessive application by farmers, combined with poor surface irrigation management, N concentration is, on average, 1.50 ppm in the Nile Delta drains [3]. Therefore, sustainable agricultural management should be adopted. This management must include water saving irrigation methods (e.g., drip irrigation) along with precise estimation of fertilizer application rates to mitigate harmful effects of excessive use of fertilizers on the surrounding environment.
The most common N fertilizers used in Egypt are nitrate (NO3), ammonium (NH4+), and urea. Nitrate and ammonium are absorbed and used by crops, while urea is hydrolyzed to ammonium by heterotrophic bacteria, then nitrified to nitrite and nitrate by autotrophic bacteria [5]. Nitrate is highly mobile and easily leaches, due to its negative charge. Thus, excessive application of N might lead to nitrate contamination of surface water and groundwater [6]. Potassium, also adsorbs weakly to soil particles. Therefore, intensive use of fertilizers may increase N and K concentrations in groundwater [7,8]. Phosphorus leaching and runoff are insignificant, because phosphorus is usually adsorbed to particles, and is thus considered almost immobile [9].
Irrigation methods, soil hydraulic properties, management practices, climatic parameters, crop type, and crop rotation are major factors affecting risk for fertilizer leaching [10,11,12]. To achieve maximum fertilizer use efficiency, a proper fertigation strategy associated with modern irrigation technology should be implemented. Drip irrigation is considered a modern irrigation system that provides a great degree of control for both irrigation water and fertigation, allowing accurate application in accordance with crop water requirements and thereby reducing fertilizer leaching. Moreover, it allows for a controlled placement of nutrients near the plant roots, limits fertilizer losses, and reduces fertilizer leaching to the groundwater. Full understanding of water and fertilizer distribution patterns in the root zone and fertilizer leaching below the root zone are required for proper design of drip fertigation systems, regarding application rate and duration [13]. Considering all these parameters through large-scale field experiments is labor-, time-, and cost-consuming. Numerical simulations, on the other hand, are an inexpensive alternative which can help in assessing either existing or proposed fertigation practices.
The HYDRUS-2D/3D model [14] can efficiently simulate two or three dimensional water flow and fertilizer (e.g., urea–ammonium–nitrate, phosphorus, and potassium) transport in partially saturated porous media. In addition, it can simulate root water extraction and root nutrient uptake. Many researchers have shown that HYDRUS-2D/3D is a suitable software with which to simulate water flow and solute transport under different irrigation systems and fertigation scenarios (e.g., References [5,15,16,17,18,19,20,21,22,23,24]). Cote et al. [15] used HYDRUS-2D/3D to simulate water and fertilizer movement under subsurface trickle irrigation, considering different fertigation strategies for bare soil. They found that fertigation at the beginning of irrigation cycles can reduce nitrogen leaching. Gardenas et al. [16] evaluated nitrate leaching for various fertigation scenarios under micro irrigation systems, considering different soil types (sandy loam, loam, silt, and clay), assuming that the adsorption coefficient for nitrate was set equal to zero based on the assumption that the soils were free from positive charges, as nitrate is negatively charged, and, if soil is free from positive charges, nitrate will not adsorb to soil particles (i.e., adsorption coefficient for nitrate = 0). This also assumes that no other processes occur that affect the retention or release of soil chemical or biological nitrate content. They demonstrated that seasonal leaching was highest for coarse-textured soil, and that it increased when applying fertilizers at the beginning of the irrigation cycle, as compared to fertigation at the end of irrigation cycle. They showed that nitrate uptake by plant roots is smaller for micro-sprinkler irrigation, as compared to drip irrigation systems. The N use efficiency varied from 20 to 30% in micro-sprinkler irrigation. However, it reached 40 to 60% in drip irrigation. Hanson et al. [5] studied N uptake and leaching using urea–ammonium–nitrate fertilizers for surface drip (DI) and subsurface drip irrigation (SDI) systems. They ignored the adsorption behavior for urea and nitrate. They found that N use efficiency was about 50 to 65% for DI and 44 to 47% for SDI. Ajdari et al. [17] used HYDRUS-2D/3D to investigate nitrate leaching for an experimental onion field under DI, considering different emitter discharges. They found that as the emitter discharge increases, the amount of nitrogen leaching out from the root zone increases. The same conclusion was reached by Shekofteh et al. [25]. In addition, they found that simulation of nitrate movement using HYDRUS 2D/3D was close to the measured results in field soils.
As a result of the lack of irrigation water, some of Egypt’s agricultural land suffers from chemical contamination due to illegal practices such as use of untreated drainage water from industry and agriculture for irrigation purposes. Examples of sources of contaminants are organic phosphorus pesticides, chlorinated hydrocarbon pesticides, rodenticides, and a variety of other pesticides including lead arsenate, calcium arsenate, copper oxides, and mercury [26]. Therefore, it is necessary to investigate the effects of soil composition and charge, especially for land areas suffering from chemical contamination, on nitrate adsorption behavior that affect leaching rates and N use efficiency. Nitrate can be adsorbed to soil particles if they contain positive charges. Iron and aluminum oxide concentrations in soil, organic matter content, and soil texture affect the nitrate adsorption rates to soil particles.
The present study introduces DI and SDI as alternatives to traditional irrigation methods (flood and furrow irrigattion) in order to overcome the problems associated with water shortage and to protect the environment from excessive application of nitrogen fertilizers using surface irrigation methods. Consequently, the HYDRUS-2D/3D model was used to investigate fertilizer distribution (i.e., ammonium, nitrate, phosphorus, and potassium) under DI and SDI, considering different fertigation strategies and soil types cultivated with tomato crops. The effect of fertilizer adsorption on the fertilizer uptake rates and fertilizers’ leaching was also investigated.

2. Materials and Methods

The HYDRUS-2D/3D model (version 2.04, PC-Progress, Prague, Czech Republic) was used to simulate fertilizer movement under DI and SDI of tomatoes growing in three different soil types (sand, loamy sand, and sandy loam) representing typical Egyptian soils (Typic Xeropsamments to Typic Psammiaquents). Ammonium, nitrate, phosphorus, and potassium fertilizers were considered during simulations. Moreover, the impact of soil hydraulic properties, fertigation strategy, and fertilizer adsorption behavior, such as fertilizer distribution and losses, were investigated. HYDRUS-2D/3D is a computer software package used to simulate water, solute (i.e., chemicals), and heat transport in two or three dimensional variably saturated porous media. The HYDRUS-2D/3D model uses the Galerkin finite element method to solve the modified form of Richards’ equation, which includes a sink term to consider water uptake by plant roots for simulating water flow. The model solves the Fickian-based advection–dispersion equation for solute transport (e.g., [27]). The transport equations contain terms for nonlinear non-equilibrium reactions between the solid and liquid phases and two first-order degradation reactions. For more details of the HYDRUS code and its application, see Reference [14].

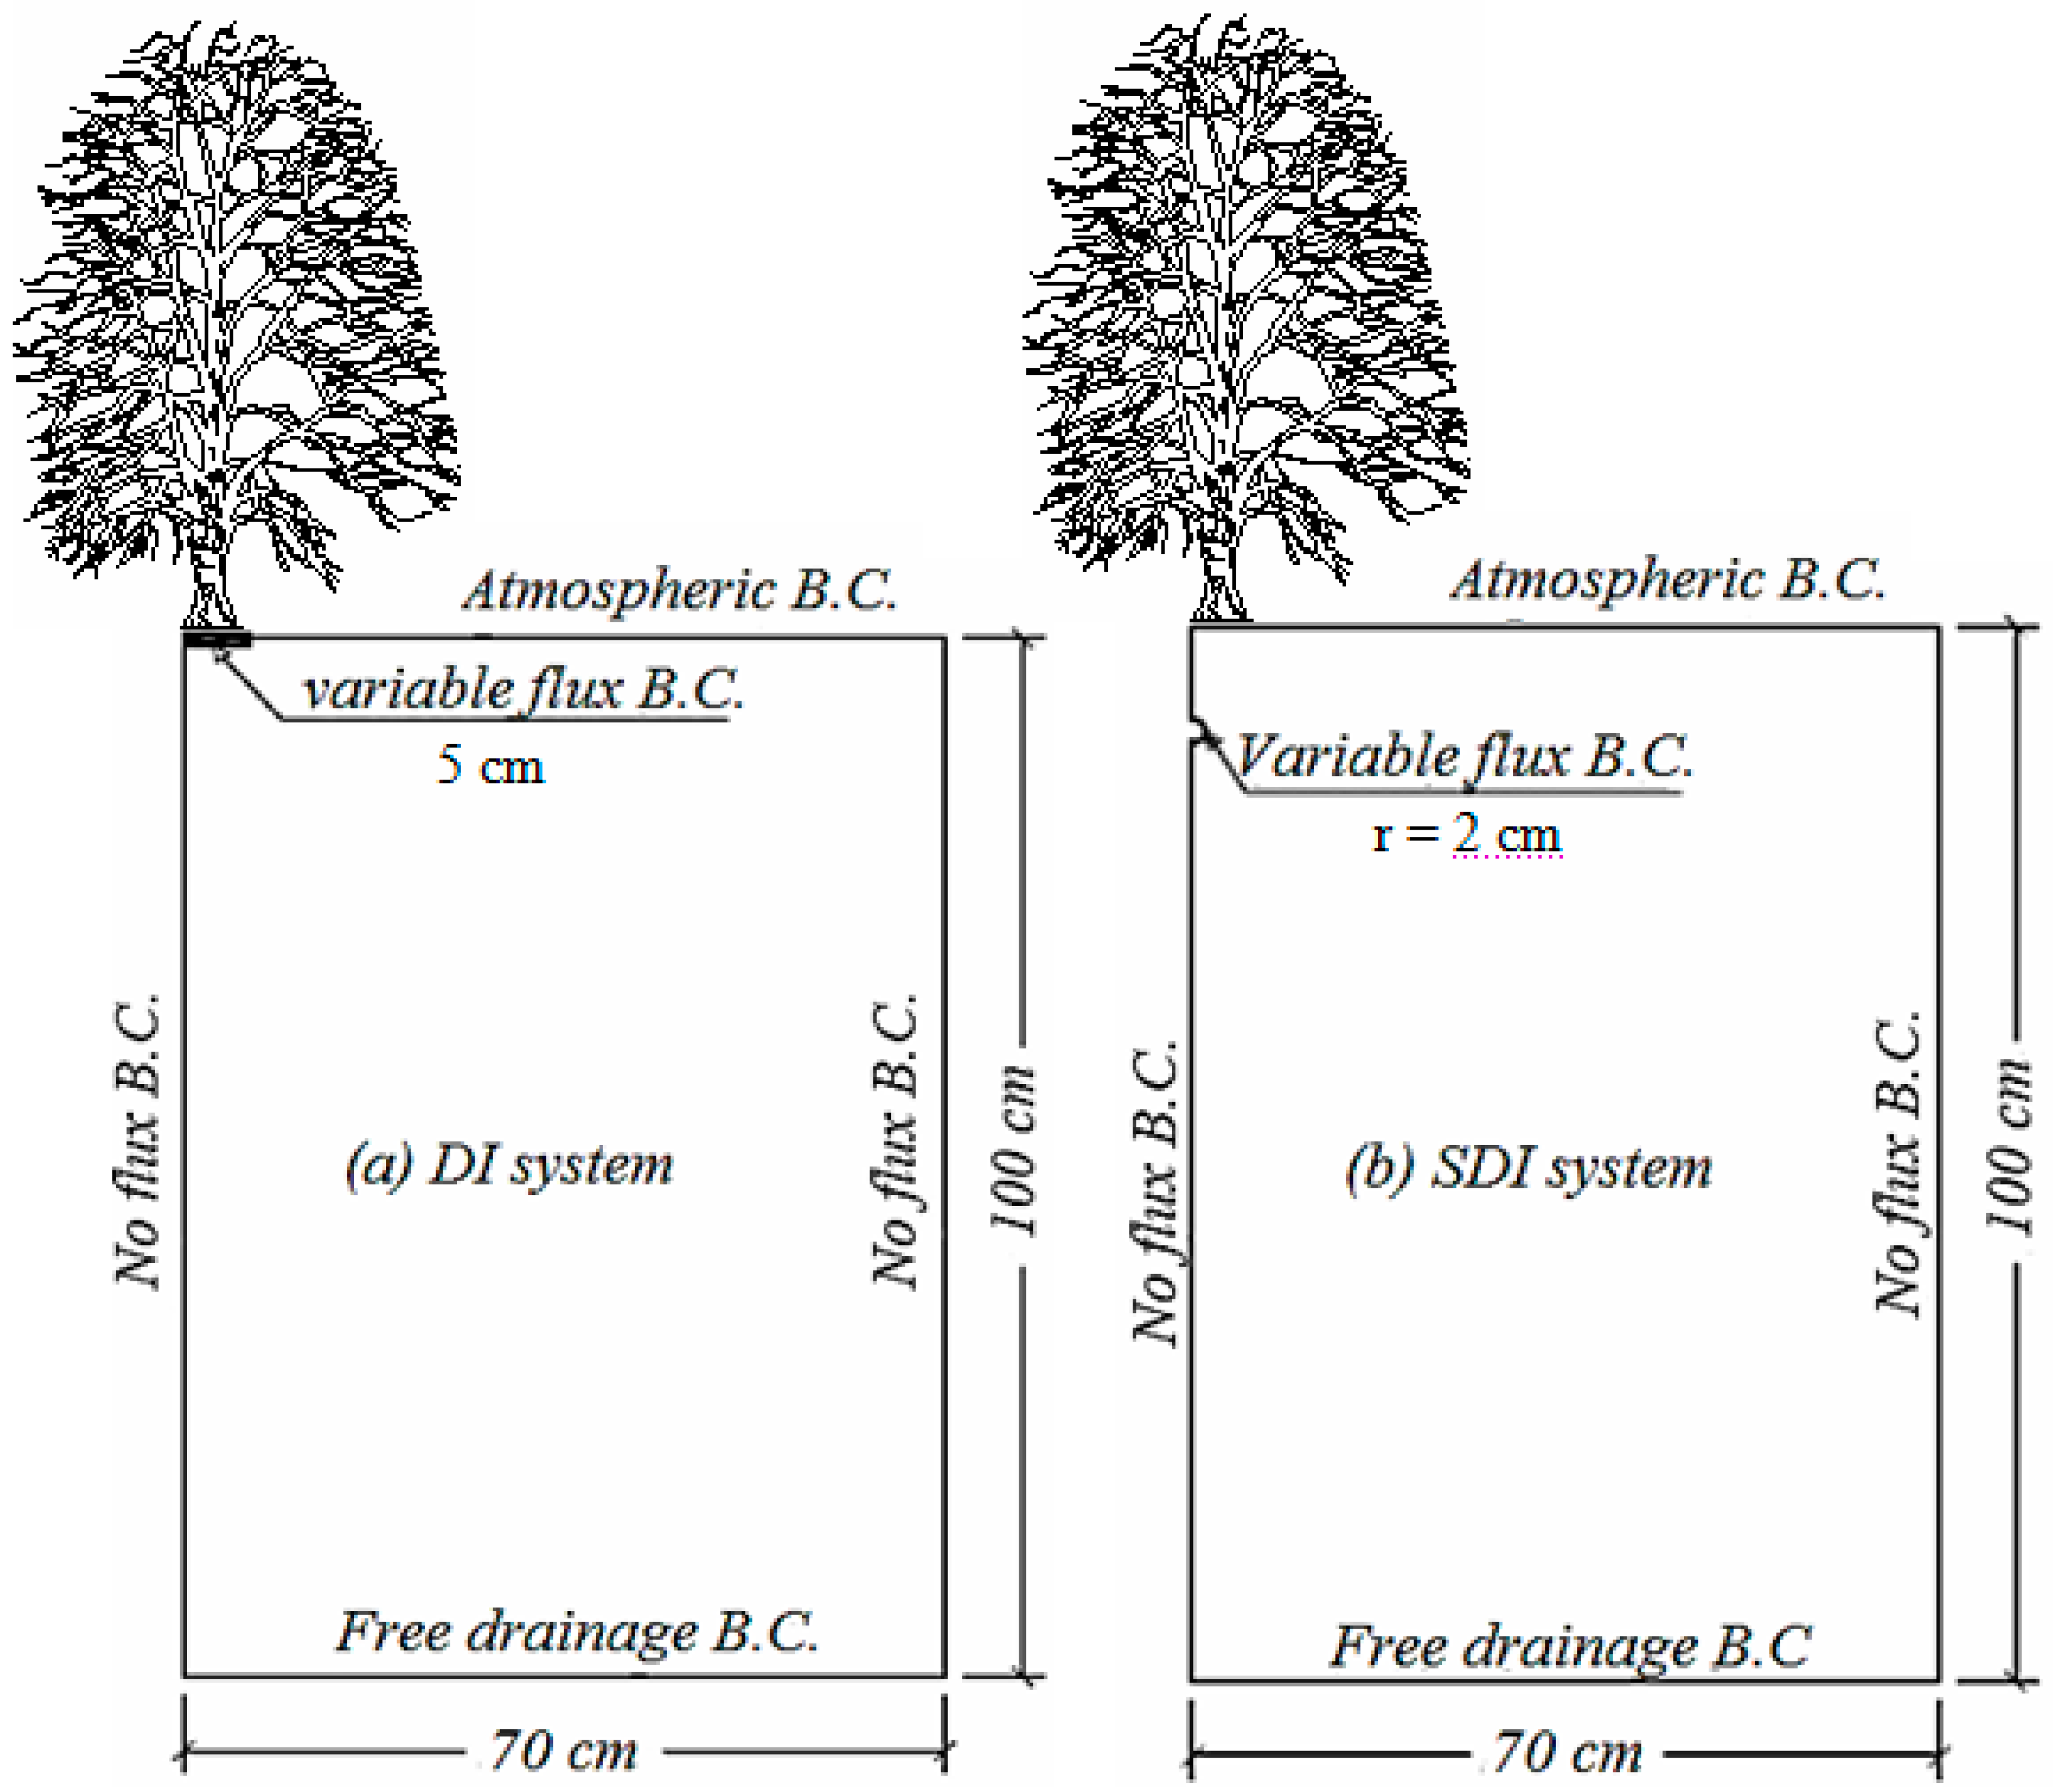
2.1. System Description

In the DI setup, the spacing between drip lines was set to 140 cm (one drip line per plant row), and the spacing between emitters was set to 35 cm with an emitter flow rate of 1 L h−1. The simulation domain used was rectangular with a 100 cm soil depth and a 70 cm width, with a tomato plant located at the upper left corner of the simulation domain. The SDI system was arranged to have the same characteristics as the DI system with emitter depths of 10 and 20 cm below the soil surface (Figure 1). Unstructured triangular mesh with 21,086 and 21,896 2D elements was used to spatially discretize the flow domain for the DI and SDI, respectively, with smaller size mesh elements at the surface and close to the emitter.

Soil Parameters

Three different soil types (sand, loamy sand, and sandy loam) representing three typical and representative agricultural soil types in Egypt were considered. Table 1 shows the physical properties of the three different soil types.
Soil hydraulic parameters were taken according to Abou Lila et al. [28], as the same fields were considered in the present study. Table 2 shows the soil hydraulic parameters used during model simulation, and Table 3 summarizes observed chemical parameters for the simulated soil types. Table 3 shows that all simulated soils have positive charges, due to the existence of heavy metals and other contaminants. These positive charges will affect the adsorption behavior of nitrate and other fertilizers.

2.2. Solute Parameters

Molecular diffusion coefficient (Dw), first-order decay coefficients (μw, μs), and adsorption isotherm coefficient (Kd) for each type of fertilizer were required for simulation implementation. Longitudinal and lateral dispersivities (εL and εt, respectively) were also required. Thus, εL was set = 0.1 m (i.e., one tenth of the simulation domain [29,30], while εt was set = 0.1 × εL [30]. Molecular diffusion was set equal to 1.957 × 10⁻⁵ cm2 s−1 for NH4+ and K+ [31], and 1.902 × 10⁻⁵ cm2 s−1 for NO3 [25,31].
The rate coefficients of nitrification from ammonium to nitrate (μw, μs) were set equal to 0.2 day−1 [32,33].

2.3. Batch Experiments

Batch experiments were carried out to estimate fertilizer adsorption isotherm parameters for the different soil types. The batch experiments were conducted for each type of fertilizer and repeated for each type of soil, as described by Flury and Fluhler [34]. Soil samples were sieved through a 2 mm sieve and dried over one day at 105 °C. Solutions with initial concentrations (Co) of 124, 60, 46.5, and 132.3 ppm of potassium, phosphorus, ammonium, and nitrate were prepared using potassium sulfate, phosphoric acid, ammonium sulfate, and calcium nitrate, respectively. A 25 mL of the prepared solution of each fertilizer was mixed with 25 g soil and shaken in an inert Teflon flask for 3 h at 20 °C. After that, soil and solution were separated by 30 min centrifugation and the concentration of fertilizers in the supernatant solution was measured. Flame photometer was used to measure potassium concentration, while spectrophotometer at a wavelength of 660 nm was used to estimate phosphorus concentration and Kjeldahl to measure nitrogen concentration. The adsorbed mass of fertilizer (Ca; mg kg−1) was calculated based on mass balance (the difference compared to the total mass of fertilizers). The mass found in the liquid phase at equilibrium (Cl; g m−3) was assumed to be adsorbed by the soil. The experiments were made in duplicate.
Adsorption isotherm parameters were calculated using linear Freundlich isotherm equations ((Equation (1)).
C a = K d C l
where Kd is the distribution coefficient (dm3 kg−1). Values of the distribution coefficient for different types of fertilizer in the different soil types used in the model simulations are presented in Table 4.
In contrast to most previous research that assumed Kd for nitrate to be equal to zero, the batch experiments gave an input for the Kd for all collected soil samples. Most previous research (e.g., [5,16]) has assumed that nitrate is not adsorbed to soil particles with negative charge. However, in our case, the chemical analyses of collected soil samples (Table 3) revealed the presence of heavy metals and other contaminants that have positive charges. It is worth mentioning that the collected soil samples for this study were taken from the El-Salam Canal region. The El-Salam Canal water is considered brackish, as it is a mixture of Nile water and salty agricultural drainage water. It may also contain industrial waste water.
The volatilization of ammonium and subsequent ammonium transport by gaseous diffusion were neglected during simulations.

2.4. Initial Conditions

The initial soil water content (θi) in soil was assumed to be uniform in the entire flow domain. The effective saturation (θe) was set equal to 0.25 m3 m−3 for all soil types, in order to determine θi according to:
θ e = θ θ r θ s θ r
where θ is the volumetric water content equal to θi at t = 0. The resulting θi values were equal to 0.13, 0.15, and 0.169 m3 m−3 for sand, sandy loam, and loamy sand, respectively. The simulation domain was assumed to be free of fertilizers at the beginning of simulations.

2.5. Boundary Conditions

Figure 1 shows the imposed boundary conditions (B.C.) assumed during simulation of DI and SDI. No flux B.C. was set along vertical sides of the simulation domain. The left side was set as zero flux B.C. due to symmetry, and as the result of using a large flow domain the right boundary was set to zero flux B.C. as well. The bottom boundary was assigned as free drainage B.C., as the groundwater table is situated 1.50 m below the soil surface. In SDI, the top boundary was set as the atmospheric B.C. that allows for crop evapotranspiration (ETc) along the whole length of the upper boundary of the simulation domain. In DI, the location of the emitter was set as variable flux B.C., and the remaining part of the top boundary was assigned as atmospheric B.C. The ETc value was taken as a constant (0.75 cm day−1), as calculated by Selim et al. [35] using the same study area. Although the HYDRUS-2D/3D model required partitioning of ETc to evaporation (E) and transpiration (T), T was set equal to ETc, while E was assumed to be zero during the simulation period. T was set equal to ETc, as the simulation was conducted only during the mid-growth season of the tomato crop, for which the surface area of land was approximately covered by tomato leaves (i.e., crop canopy). A constant flux (q) of 68.57 and 109.14 cm day−1 was used at the emitter location during irrigation events in the case of DI (Equation (3)) and SDI (Equation (4)), respectively. When irrigation was terminated, these fluxes were converted to no flux boundary condition.
q = Emitter   discharge   flow   rate Drip   tubing   surface   area = 1 × 1000 × 24 10 × 35 = 68.57   cm   day 1
where the flux diameter (10 cm) was assumed to be equal to the wetted diameter to avoid numerical simulation instability.
q = Emitter   discharge   flow   rate Drip   tubing   surface   area = Q 2   π   r   S = 1 × 1000 × 24 2 × π × 1 × 35 = 109.14   cm   day 1
where Q is the emitter discharge (L3 T−1), r is the emitter radius (L), and S is the distance between emitters (L).
As fertilizers were assumed to be applied with irrigation water, third-type Cauchy B.C. was set at the top edge of the simulation domain and along the emitter location for both DI and SDI.

2.6. Fertilizer Application

Fertilizers were added to the tomato crop with irrigation water according to the agricultural bulletin for tomato issued by the Egyptian Ministry of Agriculture. Four fertigation strategies were assumed in this study. The irrigation event period was divided into three equal intervals. In the first fertigation strategy (strategy B), fertilizers were applied at the beginning of the irrigation period (i.e., during the first third of irrigation). In the second and third fertigation strategies (strategies M and E, respectively), fertilizers were applied at the middle and at the end of the irrigation event period, respectively. In fertigation strategy C, fertilizers were applied during the whole period of the irrigation event. The total amounts of fertilizers added in the entire simulation period were 300.0, 21.4, 128.6, and 200.0 kg/ha for potassium, phosphorus, ammonium, and nitrate, respectively. Phosphorus was only added during the first 21 days, while other fertilizers were added during the entire simulation period. Potassium and phosphorus were added three times a week, while ammonium and nitrate were added twice a week.

2.7. Root Parameters

As the HYDRUS-2D/3D model version 2.04 does not consider root growth, and as a result of the lack of information about the root distribution through the entire growing season of the tomato crop, only simulation of the mid-growth season of tomato crop was executed. The growing stage was selected as the leaf area index for tomato crop is relatively constant, which leads to a constant root-to-shoot ratio [36]. The Vrugt et al. [37] model was used to describe root parameters. The following parameters of Vrugt’s model were used as input for the HYDRUS-2D/3D model: Zm = 100 cm, Xm = 70 cm, z* = 25 cm, x* = 0, Pz = 1, and Px = 1 [5]. The effect of water stress on root water uptake was considered using a threshold water stress response function presented by Feddes et al. [38] with the following parameters: Po = −1 cm, Popt = −2 cm, P2H = −800 cm, P2L= −1500 cm, P3 = −8000, r2H = 0.10 cm day−1, and r2L = 0.10 cm day−1.

2.8. Simulation Scenarios

Simulations were conducted to investigate the effect of irrigation method, soil hydraulic properties, fertilizers’ adsorption behavior, and fertigation strategy on fertilizer transport when growing tomato crops. Surface and subsurface drip irrigation with emitters at depths 10 and 20 cm below soil surface were considered in the simulation. The simulations were conducted for sand, loamy sand, and sandy loam during a 40 day period representing the mid-growth stage of tomato crop, and irrigation was applied every alternate day with a duration of 7.35 h for each irrigation event. Four different fertilizer types, namely ammonium, nitrate, phosphorus, and potassium, were considered during the current work. Four fertigation strategies were investigated. Strategies B, M, and E lasted 2.45 h, and strategy C lasted 7.35 h. This led to 36 simulation scenarios.

3. Results and Discussion

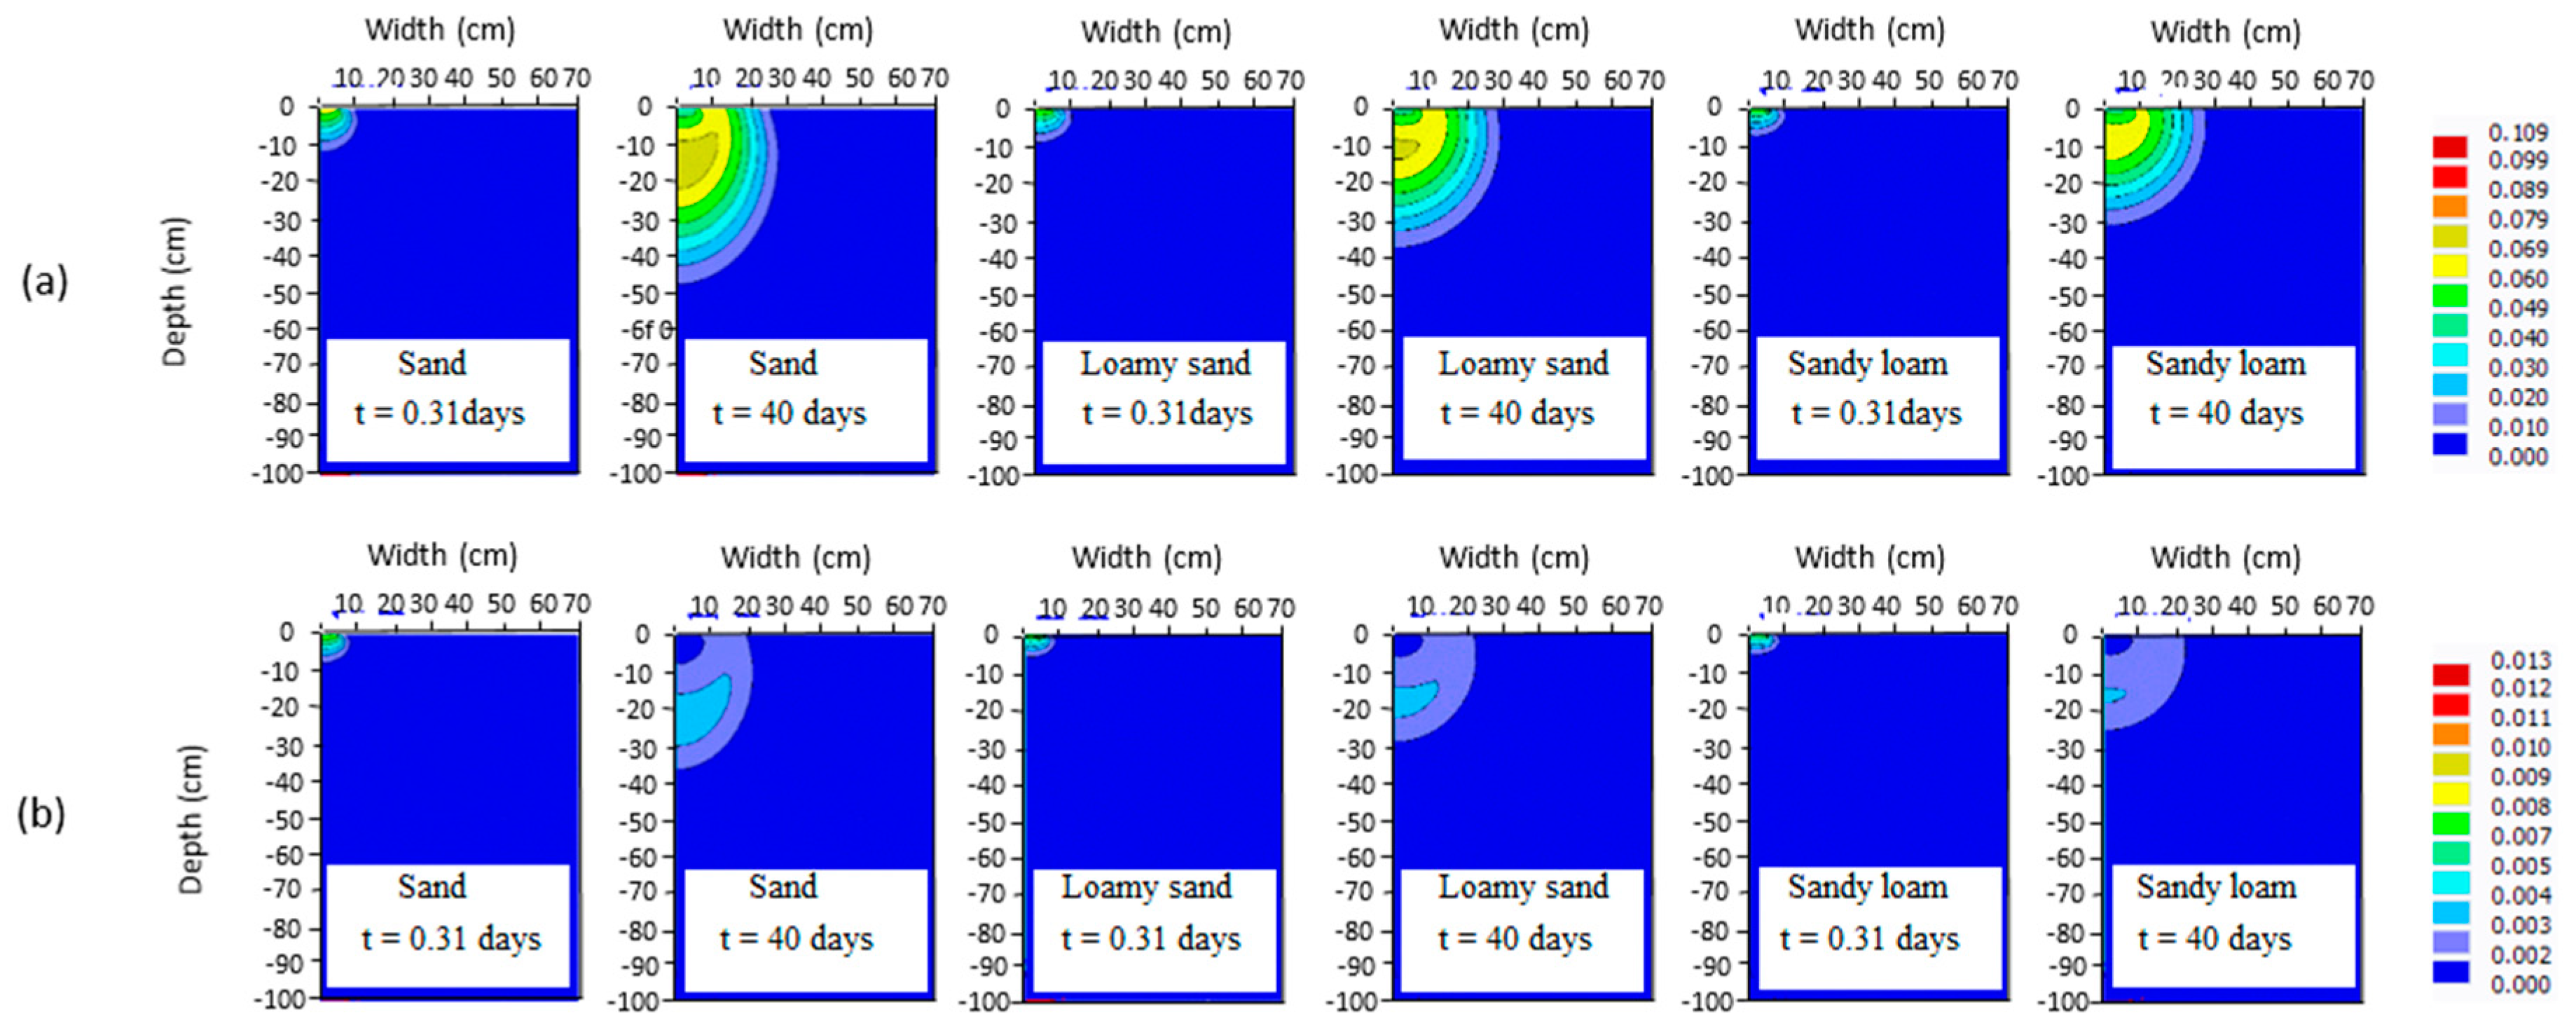
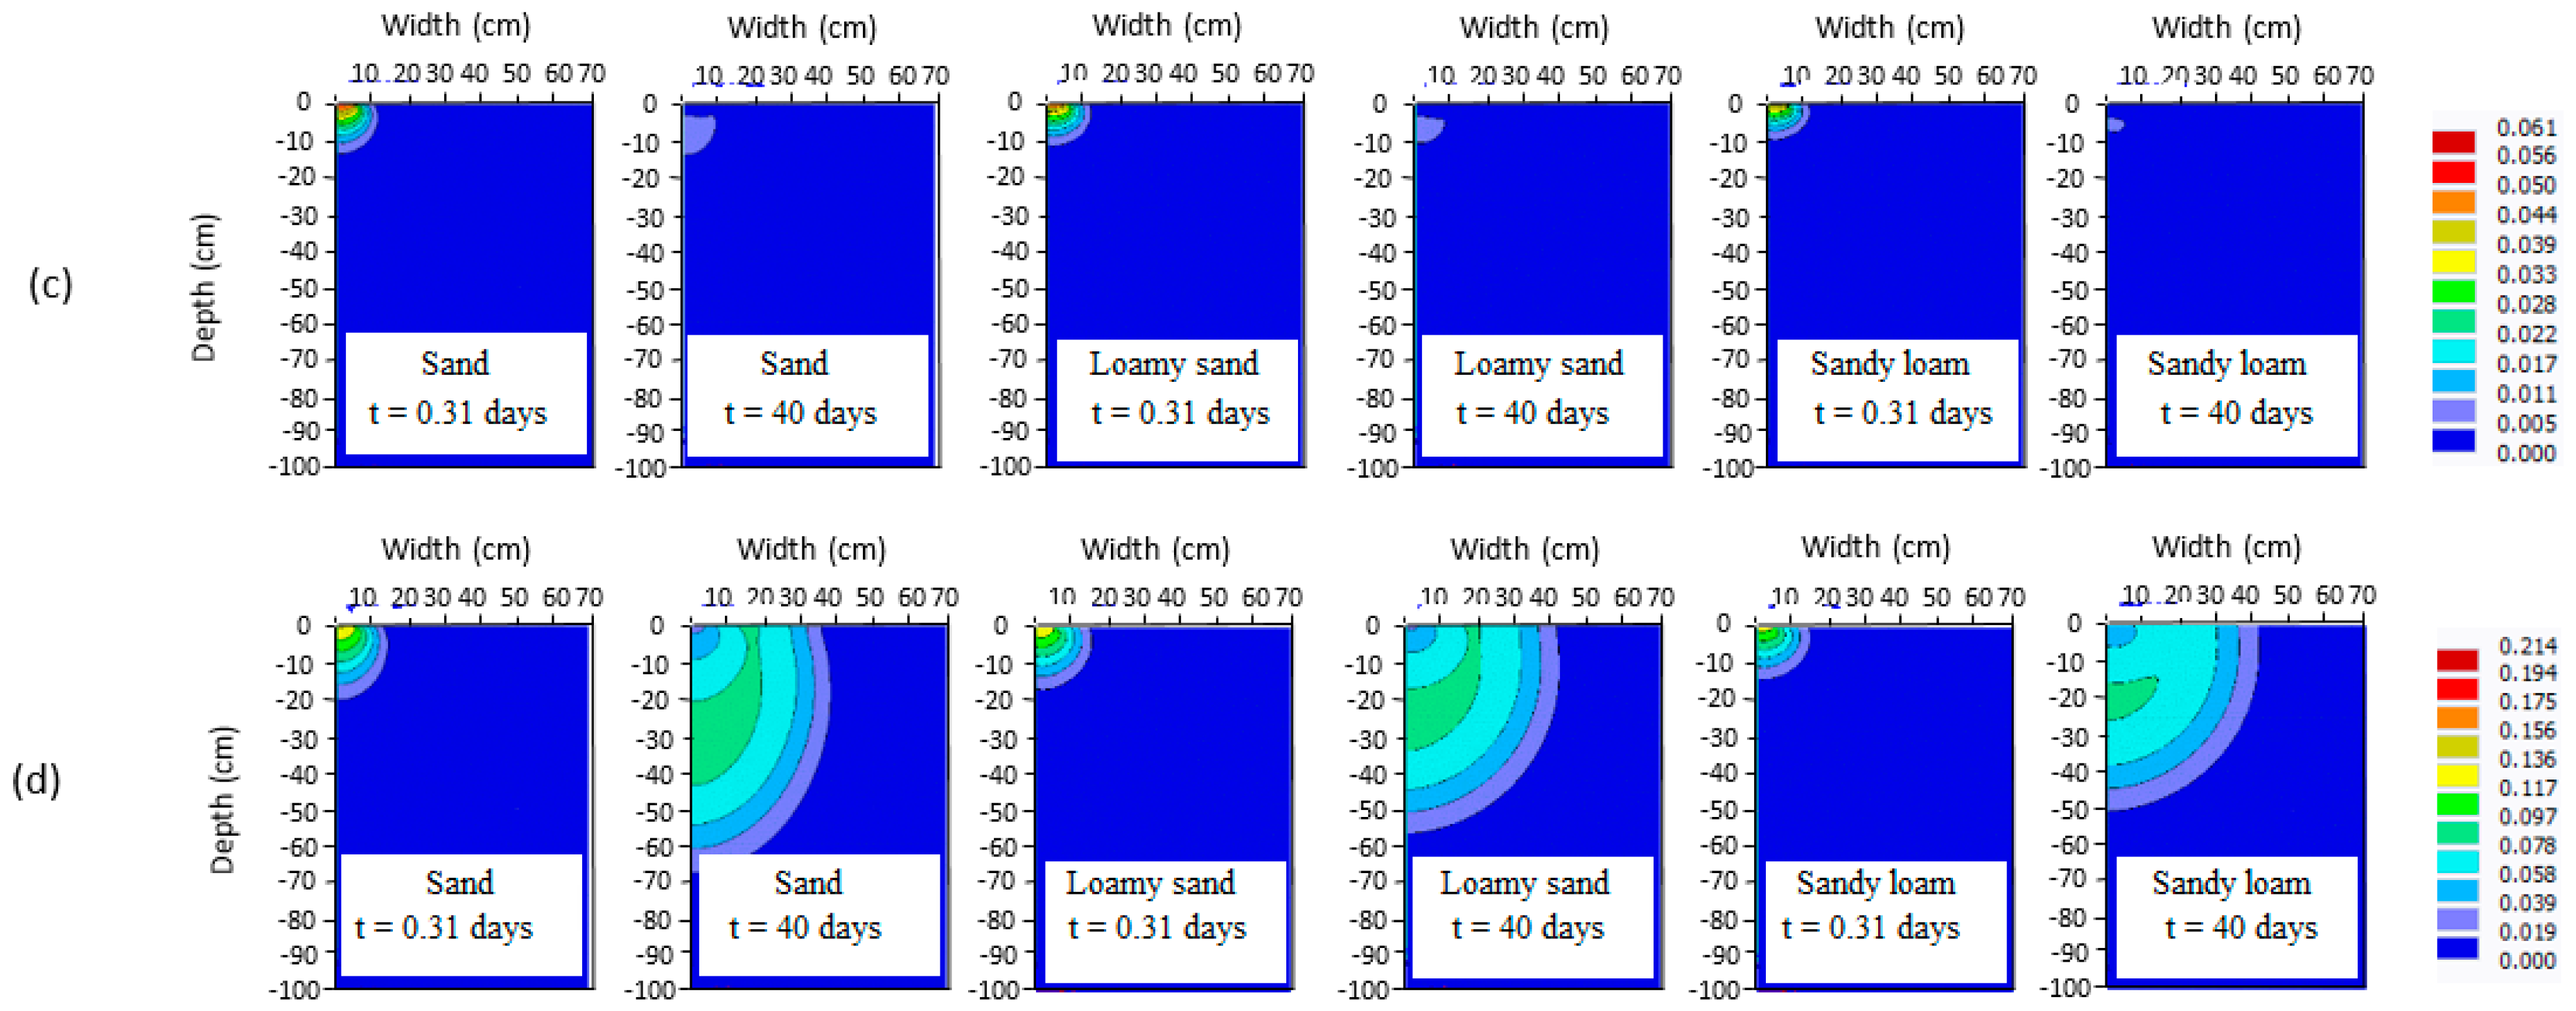
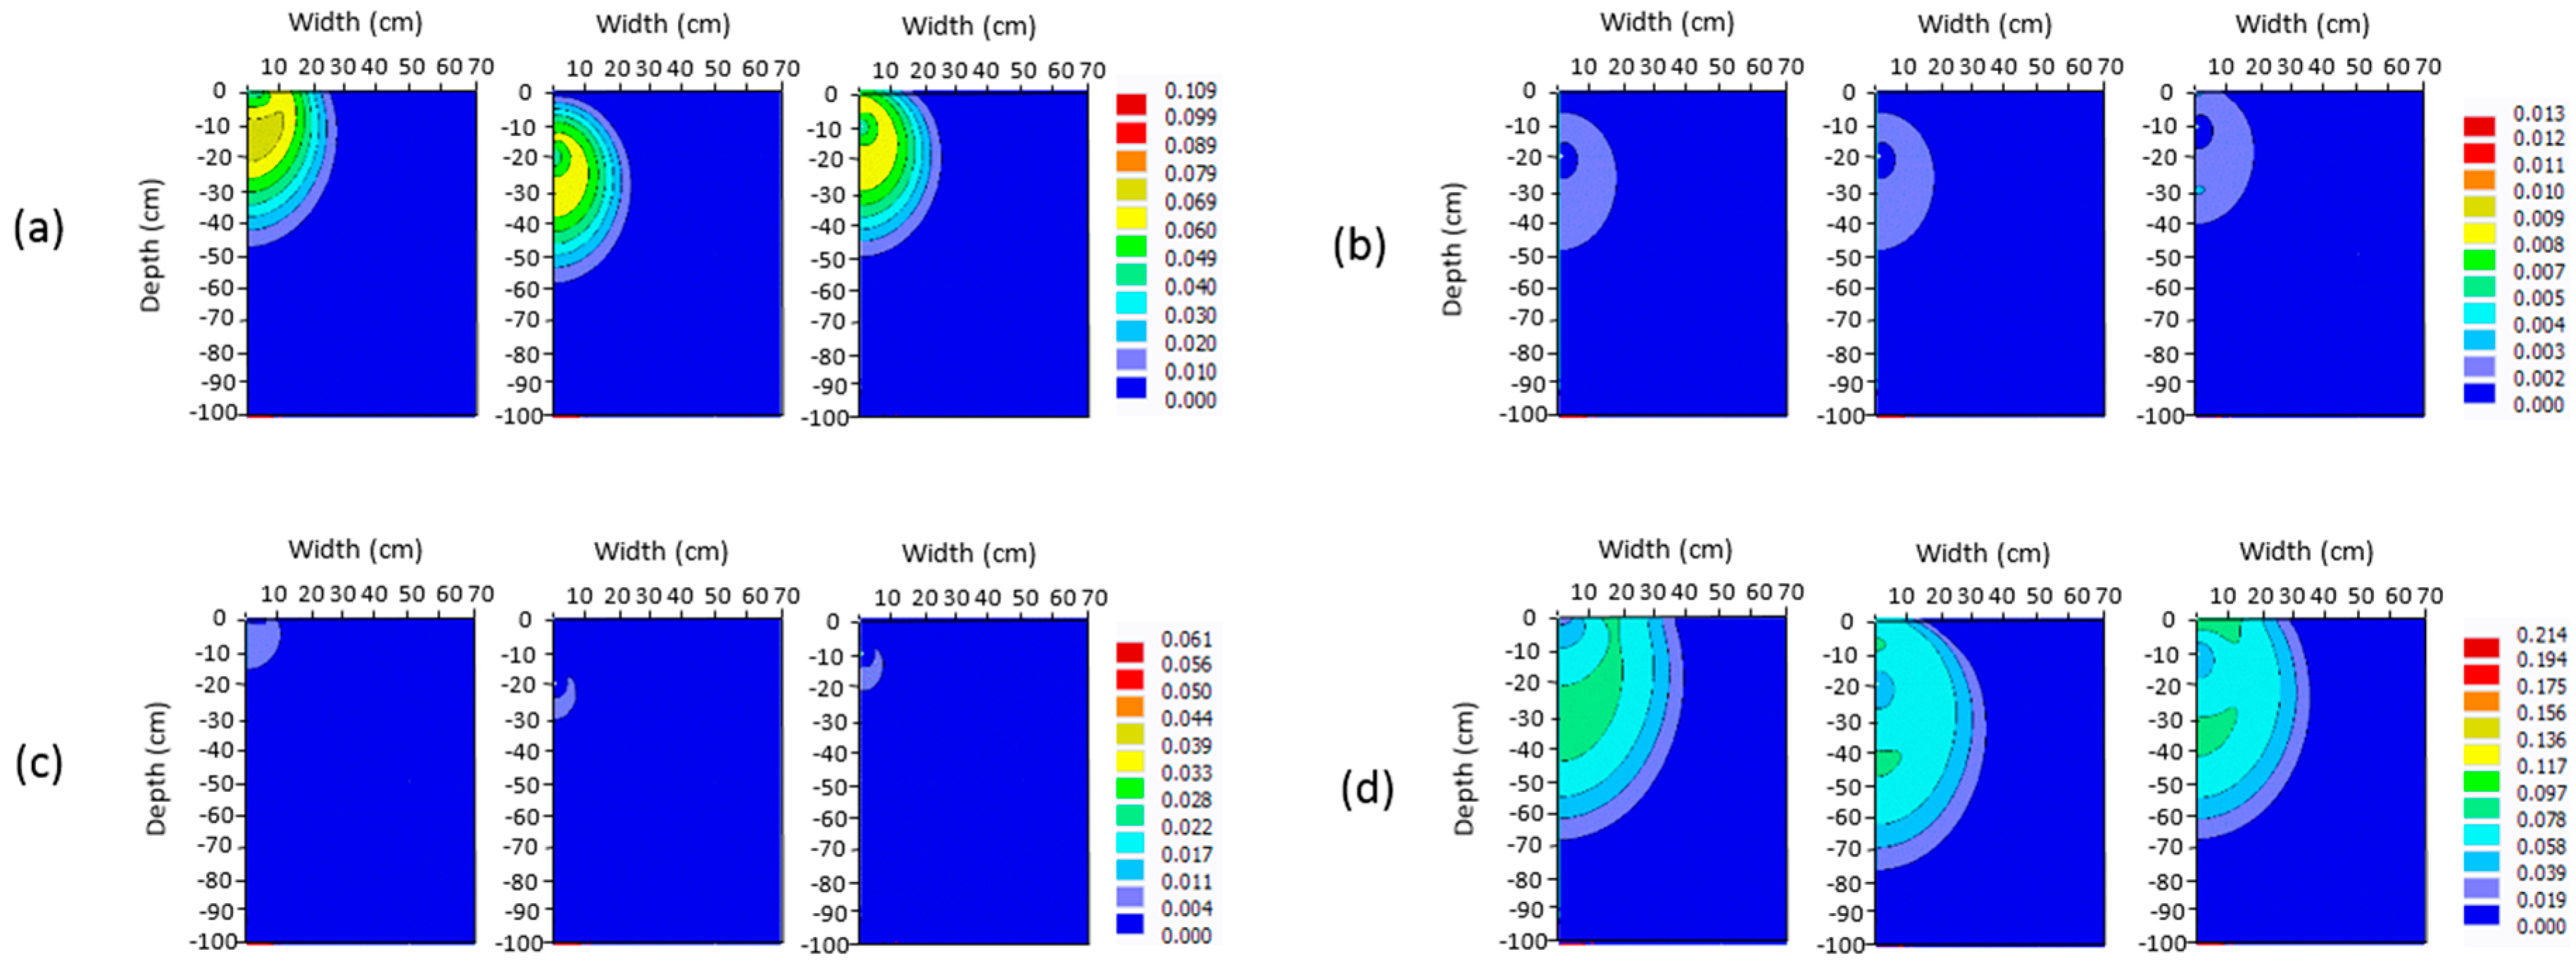
3.1. Distribution of Fertilizers

Figure 2 visualizes the progress of the fertilizer distribution at an observation point located on the top left corner of the simulation domain for DI, considering fertigation strategy C with different soil types (a: sand, b: loamy sand, and c: sandy loam). It can be observed that the fertilizer concentration increased at the end of fertigation events and then decreased between irrigation events, due to root uptake and adsorption to soil particles. For irrigation events free of fertilizers, fertilizer concentration decreased at the observation point, due to the movement of fertilizers with irrigation water. Potassium concentration increased at the end of the first fertigation event (t = 0.31 day), and then it decreased after ceasing irrigation. The same trend occurred throughout the simulation period, but with a significant decline in potassium concentration at 6.31, 20.31, and 34.31 days. These represent irrigation events without fertilizers, as potassium was applied three times a week. Phosphorus followed the same trend as potassium during the first 21 days of simulation. It then decreased with time until the end of simulation, as phosphorus was only applied during the first 3 weeks of simulation. For nitrate, the concentration increased at the end of the first fertigation events (t = 0.31 days). After that, nitrate concentration increased due to the nitrification of ammonium to nitrate and negligible denitrification, as the soil was not saturated between irrigation events. As nitrate was applied twice a week, nitrate concentration decreased during the second irrigation event. By applying the second fertigation, associated with the third irrigation event, nitrate concentration increased, but did not reach the concentration it had after the first fertigation event, due to adsorption, root uptake, and movement with irrigation water. Maximum nitrate concentration occurred at t = 16 days, due to the application of two subsequent fertigation events. After that and until the end of the simulation period, nitrate concentration decreased and increased but did not reach the maximum value. Ammonium concentration, on the other hand, increased by the end of fertigation events and decreased between fertigation events, due to nitrification to nitrate, adsorption, and root uptake. It is worth mentioning that approximately the same trend occurred in other fertigation strategies. The concentration of fertilizers around the emitter was the lowest for strategy B as compared to other strategies, due to the movement of fertilizers with irrigation water, while it was the highest for strategy E, as a result of high soil moisture content before fertigation. At the end of the simulation, fertilizer concentrations at the observation point for fertigation strategy C were 82.4, 1.1, 21.4, and 88.3 mg/L for sand; 79.7, 1.2, 20.3, 87.4 mg/L for loamy sand; and 76.5, 1.31, 18.9, and 85.5 mg/L for sandy loam for potassium, phosphorus, ammonium, and nitrate, respectively. For fertigation strategy B, they were 49.3, 1.1, 9.3, and 48.7 mg/L for sand; 50.4, 1.2, 9.1, and 50.4 mg/L for loamy sand; and 51.1, 1.3, 8.9, and 52.8 mg/L for sandy loam, respectively. For fertigation strategy M, they were 64.7, 1.1, 14.4, and 66.9 mg/L for sand; 63.7, 1.2, 13.6, and 67.1 mg/L for loamy sand; and 62.8, 1.3, 12.9, and 68.0 mg/L for sandy loam, respectively. However, for fertigation strategy E, they were 133.1, 1.2, 40.6, and 149.3 mg/L for sand; 124.9, 1.3, 38.8, and 144.6 mg/L for loamy sand; and 115.6, 1.4, 35.0, and 135.8 mg/L for sandy loam, respectively. It is worth mentioning that, in order to save space, only the aforementioned results are discussed herein.

3.2. Effect of Soil Type

Figure 3 illustrates fertilizer distribution in the soil domain after the first fertigation event and at the end of the simulation period for strategy C, considering the three soil types and DI. Soil type affected the fertilizer distribution within the simulation domain. Potassium, phosphorus, ammonium, and nitrate reached soil depths of 48, 38, and 32 cm, 37, 30, and 26 cm, 15, 12, and 10 cm, and 68, 58, and 50 cm below soil surface in sand, loamy sand, and sandy loam, respectively. The figure shows that the fertilizers moved deepest in sandy soil as compared to other soil types. This is because of the low field capacity of sand as compared to other soil types. The lateral spreading in sand, loamy sand, and sandy loam was 28, 30, and 30 cm, 20, 21, and 22 cm, 10, 11, and 11 cm, and 38, 41, and 41 cm for potassium, phosphorus, ammonium, and nitrate, respectively. The downward vertical extent of fertilizers was larger than the lateral extent for all soil types. This can be attributed to the gravity force that dominated during solute transport movement. Lateral movement of fertilizers in loamy sand and sandy loam was higher as compared to sand. This is due to the limited infiltration capacity in fine-textured soil as compared to coarse-textured soils, which led to less air-filled pore space. The adsorption behavior was larger in fine-textured soil as compared to coarse-textured soil. Similar results were obtained under different strategies and SDI (results not shown). It is pertinent to mention that the amount of fertilizers above the emitter in sandy loam soil was higher than for other soil types with SDI. This may be due to the capillary action that increases the upward movement of water and fertilizers in sandy loam as compared to sand and loamy sand soils.

3.3. Effect of Irrigation System

Figure 4 shows fertilizer distribution in sandy soil at the end of the simulation period for strategy C, using DI and SDI systems with emitters at 10 and 20 cm depths. It is noted that the fertilizer distribution depends mainly on the location of the emitter. For the DI, potassium, phosphorus, ammonium, and nitrate reached 48, 37, 15, and 68 cm depth below soil surface, respectively. In SDI with an emitter depth of 10 cm, potassium, phosphorus, ammonium, and nitrate reached depths of 50, 41, 24, and 68 cm, respectively. In SDI with an emitter depth of 20 cm, potassium, phosphorus, ammonium, and nitrate moved down to depths of 59, 49, 32, and 77 cm depths. As expected, the downward movement of fertilizers increased as the emitter depth increased. Shallow emitter depths allowed the fertilizers to reach the soil surface and spread more horizontally as compared to the deeper emitters. Thus, large emitter depth may increase the potential risk of groundwater contamination as well as decreasing fertilizer uptake. Similar results were obtained for the other strategies and soil types (results not shown).

3.4. Fertilizer Leaching

Results of all simulation scenarios showed that nitrate was adsorbed in all soil types under all fertigation scenarios. Therefore, there was insignificant leaching of nitrate outside the soil domain, with a leaching percentage below 1% for all fertigation strategies. No leaching of potassium, phosphorus, and ammonium took place due to high adsorption rates. Results of the amount of fertilizers leaving the simulation domain showed that SDI systems with a shallow emitter depth had the lowest leaching percentage as compared to DI and SDI systems with deep emitter depths. This is attributed to the fact that the fertilizers were applied in the zone of maximum root density, as the emitter was located close to this zone. Thereby, fertilizers could effectively be taken up by plant roots. The results of leaching (accumulated) percentages below the maximum root density (25 cm from the soil surface) are shown in Table 5.
The table shows that the potential leaching of fertilizers in sand soil is much greater than for loamy sand and sandy loam with DI. For the SDI, the cumulative fertilizers below the maximum root density zone were the lowest for sandy loam soil, due to the upward movement of water and fertilizers that occurred by capillary action. The limited infiltration capacity and the high adsorption characteristics of fine-textured soil particles increase the soil retention of water and fertilizers, making fine-textured soils less susceptible to leaching losses. It is noted that fertigation strategy had little effect on fertilizer leaching. For DI, the potential leaching was the lowest for strategy E and the highest for strategy B. However, for SDI, the leaching potential was the lowest for strategy B. These results concur with the results of Hanson et al. [5] and Cote et al. [15]. They found that fertigation strategy affects leaching to a small degree only. Ajdary et al. [17] found that fertigation strategy did not affect nitrogen leaching, except in the case of coarse-textured soil when applying fertilizers directly before ceasing of the irrigation event. In our study, gravity force dominated fertilizer movement in strategy E, where fertilizers entered the wetting zone and moved downward with the flow. On the other hand, capillarity dominated the movement of fertilizers in strategy B, where the fertilizers moved with water downward and upward by capillary action. Therefore, more fertilizers can be maintained near and above the emitter. Thus, strategy E is recommended to reduce the groundwater contamination risk for DI, and strategy B is recommended for SDI.

3.5. Root Fertilizer Uptake

Table 6 shows that slight differences in the amount of root fertilizer uptake (fertilizer use efficiency) occurred when comparing different fertigation strategies. In our study, fertilizer use efficiency (FUE) is defined as the ratio between the amounts of fertilizer uptake by plant roots to the total amount of fertilizer added to the simulation domain. For the DI, FUE varied in the three soil types from 9.0 to 15.5%, 11.0 to 15.4%, and 26.2 to 35.8% for potassium, phosphorus, and nitrogen, respectively. The largest FUE occurred in sand soil, while the lowest FUE occurred in sandy loam. The higher value of FUE in loamy sand soil as compared to the sandy loam soil may be attributed to higher fertilizer adsorption on sandy loam particles. For SDI with an emitter depth of 10 cm, FUE varied in the three soil types from 9.3 to 15.6%, 11.4 to 15.7%, and 27.2 to 36.4% for potassium, phosphorus, and nitrogen, respectively. For the SDI with an emitter depth of 20 cm, the potassium uptake varied from 9.0 to 14.6%, phosphorus uptake varied from 11.0 to 14.4%, and nitrogen uptake varied from 26.7 to 34.5% in the three soil types. The results show that there is an insignificant difference between root fertilizer uptakes under different fertigation strategies. Consequently, the fertigation strategy does not seem to have any effect on the fertilizer uptake by the plant roots. This result concurs with Gardenas et al. [16]. They reported that nitrate taken up by plant roots was independent of fertigation strategy. However, Hanson et al. [5] found that the best nitrogen uptake ratio occurred when using strategy E for DI, while fertigation strategy did not have any effect on nitrogen uptake for SDI. Results also showed that root nutrient uptake was higher for SDI with a shallow emitter depth as compared to other systems. This may be due to the fact that the emitter was located approximately in the middle of the zone of maximum root density.
This study did not include considerations of practical network effects such as mainline and manifold hydraulics, lag time, and mixing of chemical flow with motive flow (main flow of irrigation water in the lines). However, we still believe that our results display some general and universal results for DI and SDI irrigation system outlines. However, future studies would need to quantify the above network effects.

4. Conclusions

The present study investigated the effect of soil type, fertigation strategy, and adsorption behavior on fertilizer distribution, fertilizer uptake by plant roots, and the amount of fertilizers that can leach below the simulation domain and below the zone of maximum root density for DI and SDI with 10 and 20 cm emitter depths for tomato plants. Simulation results showed that fertilizer leaching is significantly affected by the soil type. Sandy soils were more susceptible to the risk of fertilizer leaching below the maximum root density zone than loamy sand and sandy loam soils. Fertilizer accumulation in sandy loam was also larger than for other soil types. In addition, fertilizer leaching below the simulation domain was affected by varying irrigation systems. SDI with shallow emitter depths had a lower amount of leaching as compared to other drip irrigation systems where water and fertilizers were effectively injected into the zone of maximum root density. Therefore, the amount of fertilizer uptake by roots was the highest for the SDI with a shallow emitter depth. Consequently, a shallow emitter is recommended as compared to deep emitters for SDI, as it reduces the potential risk of groundwater contamination, especially in sandy soil and plants with shallow roots.
Simulation results showed that it is best to conduct fertigation at the end of the irrigation event (strategy E) in the case of DI, and fertigation at the beginning of the irrigation event (strategy B) in SDI. Simulation results showed that nitrate adsorption behavior has a considerable impact on leaching, uptake by plants, and distribution within the soil domain. Logically, as the adsorption coefficient increases, the amount of solute leaching from the soil domain decreases. Additionally, as the emitter discharge and/or the amount of solute increases, the amount of solute leaching from the soil domain increases. Shekofteh et al. [25] used different emitter discharges, varying from 0.5 to 8 L h−1, and different amounts of potassium nitrate, varying from 950 to 2550 kg ha−1, while neglecting the adsorption coefficient of nitrate. They found that, as the emitter discharge and fertilizer increased, the amount of nitrate leaching increased. In any case, it is important to determine the adsorption coefficient for nitrate before planting, as it will help to precisely assign nitrate application rates (fertilizer application rate and duration). This will lead to improved nutrient uptake and minimal leaching.

Author Contributions

Conceptualization, T.S. and A.M.; Methodology, R.E. and T.S.; Software, R.E. and T.S.; Validation, R.E. and T.S.; Formal Analysis, R.E.; T.S.; and R.B.; Investigation, R.E. and T.S.; Resources, T.S. and A.M.; Data Curation, R.E.; T.S. and R.B.; Writing—Original Draft Preparation, R.E. and T.S.; Writing—Review & Editing, R.B.; Visualization, R.E.; T.S. and R.B.; Supervision, T.S. and A.M. Project Administration, T.S. and A.M.; Funding Acquisition, T.S. and A.M.

Funding

This research received no external funding.

Conflicts of Interest

The authors declare no conflict of interest.

References

  1. Magen, H. Fertigation: An overview of some practical aspects. Fert. News 1995, 40, 97–100. [Google Scholar]
  2. Kafkafi, U.; Tarchitzky, J. A Tool for Efficient Fertilizer and Water Management; International Fertilizer Association/International Potash institute: Paris/Horgen, France, 2011. [Google Scholar]
  3. Food and Agriculture Organization of the United Nations (FAO). Fertilizer Use by Crop in Egypt; Land and Plant Nutrition Management Service, Land and Water Development Division: Roma, Italy, 2005. [Google Scholar]
  4. Taha, M.H. Chemical fertilizers and irrigation system in Egypt. In Proceedings of the FAO Regional Workshop on Guidelines for Efficient Fertilizers Use through Irrigation, Cairo, Egypt, 14–16 December 1999. [Google Scholar]
  5. Hanson, B.R.; Simunek, J.; Hopmans, J.W. Evaluation of urea–ammonium–nitrate fertigation with drip irrigation using numerical modeling. Agric. Water. Manag. 2006, 86, 102–113. [Google Scholar] [CrossRef]
  6. González-Delgado, A.M.; Shukla, M.K. Transport of nitrate and chloride in variably saturated porous media. J. Irrig. Drain Eng. 2014, 140, 04014006. [Google Scholar] [CrossRef]
  7. Corley, R.H.V.; Tinker, P.B.H. The Oil Palm (World Agriculture Series), 4th ed.; Wiley-Blackwell: Oxford, UK, 2003; p. 592. ISBN 978-0-632-05212-7. [Google Scholar]
  8. Griffioen, J. Potassium adsorption ratios as an indicator for the fate of agricultural potassium in groundwater. J. Hydrol. 2001, 254, 244–254. [Google Scholar] [CrossRef]
  9. Feigen, A.; Ravina, I.; Shalhevet, J. Effect of Irrigation with Treated Sewage Effluent on Soil, Plant and Environment. In Irrigation with Treated Sewage Effluent; Springer: Berlin, Germany, 1990. [Google Scholar]
  10. Nemeth, T. Nitrogen in the soil-plant system nitrogen balances. Cer. Res. Commun. 2006, 34, 61–64. [Google Scholar]
  11. Josipovic, M.; Kovačević, V.; Šostarić, J.; Plavšić, H.; Liovic, J. Influences of irrigation and fertilization on soybean properties and nitrogen leaching. Cer. Res. Commun. 2006, 34, 513–516. [Google Scholar] [CrossRef]
  12. Nemcic, J.; Mesić, M.; Bašić, F.; Kisić, I.; Zgorelec, Z. Nitrate concentration in drinking water from wells at three different locations in Northwest Croatia. Cer. Res. Commun. 2007, 35, 533–536. [Google Scholar] [CrossRef]
  13. Hanson, B.; Schwankl, L.; Granttan, S.; Prichard, T. Drip Irrigation for Row Crops; Water Management Handbook Series (Publication 93-05); University of California: Davis, CA, USA, 1996. [Google Scholar]
  14. Simunek, J.; van Genuchten, M.T.; Šejna, M. Recent Developments and Applications of the HYDRUS Computer Software Packages. Vadose Zone J. 2016. [Google Scholar] [CrossRef]
  15. Cote, C.M.; Bristow, K.L.; Charlesworth, P.B.; Cook, F.J.; Thorburn, P.J. Analysis of soil wetting and solute transport in subsurface trickle irrigation. Irrig. Sci. 2003, 22, 143–156. [Google Scholar] [CrossRef]
  16. Gardenas, A.I.; Hopman, J.W.; Hanson, B.R.; Simunek, J. Two-dimensional modeling of nitrate leaching for various fertigation scenarios under micro-irrigation. Agric. Water Manag. 2005, 74, 219–242. [Google Scholar] [CrossRef]
  17. Ajdary, K.; Singh, D.K.; Singh, A.K.; Khanna, M. Modeling of nitrogen leaching from experimental onion field under drip fertigation. Agric. Water Manag. 2007, 89, 15–28. [Google Scholar] [CrossRef]
  18. Crevoisier, D.; Popova, Z.; Mailhol, J.C.; Ruelle, P. Assessment and simulation of water and nitrogen transfer under furrow irrigation. Agric. Water Manag. 2008, 95, 354–366. [Google Scholar] [CrossRef] [Green Version]
  19. Siyal, A.A.; Bristow, K.L.; Simunek, J. Minimizing nitrogen leaching from furrow irrigation through novel fertilizer placement and soil surface management strategies. Agric. Water Manag. 2012, 115, 242–251. [Google Scholar] [CrossRef]
  20. Ramos, T.B.; Simunek, J.; Goncalves, M.C.; Martins, J.C.; Prazeres, A.; Pereira, L.S. Two-dimensional modeling of water and nitrogen fate from sweet sorghum irrigated with fresh and blended saline waters. Agric. Water Manag. 2012, 111, 87–104. [Google Scholar] [CrossRef]
  21. Siyal, A.A.; Siyal, A.G. Strategies to reduce nitrate leaching under furrow irrigation. Int. J. Environ. Sci. Dev. 2013, 4, 431–434. [Google Scholar] [CrossRef]
  22. Zhen, W.; Jiusheng, L.; Yanfeng, L. Simulation of nitrate leaching under varying drip system uniformities and precipitation patterns during the growing season of maize in the North China Plain. Agric. Water Manag. 2014, 142, 19–28. [Google Scholar]
  23. Raij, I.; Simunek, J.; Ben-Gal, A.; Lazarovitch, N. Water flow and multicomponent solute transport in drip irrigated lysimeters: Experiments and modeling. Water Resour. Res. 2016, 52, 6557–6574. [Google Scholar] [CrossRef]
  24. Salehi, A.A.; Navabian, M.; Varaki, M.E.; Pirmoradian, N. Evaluation of HYDRUS-2D model to simulate the loss of nitrate in subsurface controlled drainage in a physical model scale of paddy fields. Padd. Water Environ. 2017, 15, 433–442. [Google Scholar] [CrossRef]
  25. Shekofteh, H.; Afyuni, M.; Hajabbasi, M.A. Modeling of nitrate leaching from a potato field using HYDRUS-2D. Commun. Soil Sci. Plant Anal. 2013, 44, 2917–2931. [Google Scholar] [CrossRef]
  26. Mokhtar, S.; El Agroudy, N.; Shafiq, F.A.; Abdel Fatah, H.Y. The Effects of the environmental pollution in Egypt. Intern. J. Environ. 2015, 4, 21–26. [Google Scholar]
  27. Hillel, D. Environmental Soil Physics; Elsevier: San Diego, CA, USA, 1998. [Google Scholar]
  28. Abou Lila, T.S.; Berndtsson, R.; Persson, M.; Somaida, M.; El_Kiki, M.; Hamed, Y.; Mirdan, A. Numerical evaluation of subsurface trickle irrigation with brackish water. Irrig Sci. 2013, 31, 1125–1137. [Google Scholar] [CrossRef]
  29. Anderson, M.P. Movement of contaminants in groundwater: Groundwater transport-advection and dispersion. In Groundwater Contamination. Studies in Geophysics; National Academy: Washington, DC, USA, 1984; pp. 37–45. [Google Scholar]
  30. Cote, C.M.; Bristow, K.L.; Ford, E.J.; Verburg, K.; Keating, B. Measurement of Water and Solute Movement in Large Undisturbed Soil Cores: Analysis of Macknade and Bundaderg Data; Technical Report 07/2001; CSIRO Land and Water: Canberra, Australia, 2001. [Google Scholar]
  31. Lide, D.R. CRC Handbook of Chemistry and Physics; CRC Press: Boca Raton, FL, USA, 2005. [Google Scholar]
  32. Lotse, E.G.; Jabro, J.D.; Simmons, K.E.; Baker, D.E. Simulation of nitrogen dynamics and leaching from arable soils. J. Contam. Hydrol. 1992, 10, 183–196. [Google Scholar] [CrossRef]
  33. Jansson, P.E.; Karlberg, L. Coupled Heat and Mass Transfer Model for Soil–Plant–Atmosphere Systems; Royal Institute of Technology, Department of Civil and Environmental Engineering: Stockholm, Sweden, 2001; p. 321. [Google Scholar]
  34. Flury, M.; Fluhler, H. Tracer characteristics of Brilliant Blue FCF. Soil Sci. Soc. Am. J. 1995, 59, 22–27. [Google Scholar] [CrossRef]
  35. Selim, T.; Berndtsson, R.; Persson, M.; Somaida, M.; El-Kiki, M.; Hamed, Y.; Mirdan, A.; Zhou, Q. Influence of geometric design of alternate partial root-zone subsurface drip irrigation (APRSDI) with brackish water on soil moisture and salinity distribution. Agric. Water Manag. 2012, 103, 182–190. [Google Scholar] [CrossRef]
  36. Heuvelink, E. Growth, development and yield of a tomato crop: periodic destructive measurements in a greenhouse. Hort. Sci. 1995, 61, 77–99. [Google Scholar] [CrossRef]
  37. Vrugt, J.A.; van Wijk, M.T.; Hopmans, J.W.; Simunek, J. Comparison of one, two, and three-dimensional root water uptake functions for transient water flow modeling. Water Resour. Res. 2001, 37, 2457–2470. [Google Scholar] [CrossRef]
  38. Feddes, R.A.; Kowalik, P.J.; Zaradny, H. Simulation of Field Water Use and Crop Yield; John Wiley & Sons: New York, NY, USA, 1978. [Google Scholar]
Figure 1. Simulation domain for the investigated drip irrigation (DI) and subsurface drip irrigation (SDI) systems.
Water 11 00893 g001
Figure 2. Temporal variation in fertilizer concentration at observation points on the emitter for strategy C using a DI system and different soil types, (a) sand, (b) loamy sand, and (c) sandy loam.
Water 11 00893 g002aWater 11 00893 g002b
Figure 3. Fertilizer distribution after the first fertigation event (t = 0.31 days) and at the end of simulation period (t = 40 days) for strategy C for different soil types with DI ((a): potassium, (b): phosphorus, (c): ammonium, and (d): nitrate, units: mg cm−3).
Water 11 00893 g003aWater 11 00893 g003b
Figure 4. Fertilizer distribution at the end of the simulation period (t = 40 days) for strategy C in sand with DI and SDI systems and emitter at 10 and 20 cm depths ((a): potassium, (b): phosphorus, (c): ammonium, and (d): nitrate, unit: mg cm−3).
Water 11 00893 g004
Table 1. Physical properties for the different soil types used in the simulations (Typic Xeropsamments to Typic Psammiaquents).
Soil TypeSand (%)Silt (%)Clay (%)Bulk Density (gm/cm3)
Sand92.03.64.41.66
Loamy sand79.712.38.01.73
Sandy loam65.230.84.01.78
Table 2. Hydraulic parameters for the different soil types used in the simulations.
Soil Typeθr (m3 m−3)θs (m3 m−3)αnKs (cm day−1)l
Sand0.0240.4470.1241.87878.200.5
Loamy sand0.0740.4530.0451.72288.500.5
Sandy loam0.0380.4860.0251.72194.060.5
θr: residual water content. θs: saturated water content. Ks: saturated hydraulic conductivity. α: inverse of the air-entry value. n: pore size distribution index, l: pore connectivity parameter.
Table 3. Observed chemical characteristics for soil types used in the simulations.
Soil TypepHCalcium Carbonate (%)Na (meq/L)Mg (meq/L)Ca (meq/L)Fe (ppm)Cu (ppm)Zn (ppm)
Sand8.50.71.51.21.16.90.861.9
Loamy sand8.02.12.711.18.25.50.243.0
Sandy loam7.90.840.112.411.112.80.742.8
Table 4. Distribution coefficient for fertilizers in the different soil types (cm3 g−1).
Soil TypeSandLoamy Sand Sandy Loam
Potassium2.503.263.99
Phosphorus3.624.314.41
Ammonium2.202.502.86
Nitrate0.650.720.89
Table 5. Percentage of potassium, phosphorus, and nitrogen accumulated below the maximum root density zone as a fraction of the total potassium, phosphorus, and nitrogen added, respectively.
Soil TypeFertigation Strategy DISDI with Emitter Depth of 10 cmSDI with Emitter Depth of 20 cm
KPNKPNKPN
SandC24.426.432.732.736.234.049.9852.6143.30
E23.725.831.932.636.234.250.0552.7343.34
M24.626.633.033.637.035.051.2353.4944.41
B24.926.833.131.935.332.949.351.642.2
Loamy sandC13.815.127.722.125.128.740.242.836.3
E13.314.627.222.225.428.940.143.236.5
M13.815.127.822.525.629.140.743.136.7
B14.215.528.221.924.527.739.942.235.7
Sandy loamC7.710.124.415.920.126.335.739.035.4
E7.49.823.916.020.426.735.639.335.5
M7.710.224.416.120.326.635.939.135.5
B8.010.524.915.619.725.635.938.935.1
Table 6. Percentage of root uptake for potassium, phosphorus, and nitrogen as a fraction of the total potassium, phosphorus, and nitrogen added, respectively, for different fertigation strategy.
Soil TypeFertigation StrategyDISDI with Emitter Depth of 10 cmSDI with Emitter Depth of 20 cm
KPNKPNKPN
SandC15.415.335.515.515.436.214.514.434.3
E15.515.435.815.615.736.414.614.434.5
M15.415.335.515.515.336.014.414.334.0
B15.415.335.215.415.336.214.514.334.5
Loamy sandC12.012.731.912.313.033.111.812.432.2
E12.012.732.112.313.133.311.812.432.2
M12.012.732.012.313.033.011.712.432.2
B12.012.731.712.313.032.911.712.432.0
Sandy loamC9.011.026.39.411.427.49.011.026.8
E9.111.126.59.411.527.69.111.026.8
M9.011.026.39.411.427.39.011.026.7
B9.011.026.29.311.427.29.011.026.7

