Article

Characterising Recycled Organic and Mineral Materials for Use as Filter Media in Biofiltration Systems

1
School of Environmental & Life Sciences, The University of Newcastle, Callaghan, NSW 2308, Australia
2
School of Environmental & Life Sciences, The University of Newcastle, Singapore 038986, Singapore
3
Center for Organic Research & Education (CORE), North Sydney, NSW 2060, Australia
*
Author to whom correspondence should be addressed.
Water 2019, 11(5), 1074; https://doi.org/10.3390/w11051074
Submission received: 1 April 2019 / Revised: 15 May 2019 / Accepted: 17 May 2019 / Published: 23 May 2019

Abstract

:
Filter media (FM) sourced from recycled organic and mineral materials offer an effective and low cost means of treating urban stormwater. Using recycled materials rather than the increasingly scarce source of virgin materials (typically sandy loam soil) can ensure a sustainable and long-term economy and environment. This paper presents the results from the laboratory analysis and mathematical modelling to highlight the performance of recycled organic and mineral materials in removing nutrients and metals from stormwater. The analysis included the physical and chemical characterisation of particle size distribution, saturated hydraulic conductivity (Ksat), bulk density, effective cation exchange capacity, and pollutant removal performance. The design mixes (DM), comprising a combination of organic and mineral materials, were characterised and used to develop/derive the modelling design within the Model for Urban Stormwater Improvement Conceptualisation (MUSIC v6). Comparison is made to the Adoption Guidelines for Stormwater Biofiltration Systems—Summary Report which were based on the Facility for Advancing Water Biofiltration (FAWB) guidelines to assist in the development of biofiltration systems, including the planning, design, construction, and operation of those systems. An observed outcome from over two decades of biofiltration guideline development has been the exclusion of alternative biofilter materials due to claims of excessive leaching. Results from this study indicate that high nutrient and metal removal rates can be achieved over a range of hydraulic conductivities using design mixes of recycled organic and mineral materials that have a demonstrated equivalence to existing guideline specifications.

1. Introduction

In a world where natural resources are limited it is important to recycle organic and mineral waste materials for alternative uses [1]. The use of recycled organic materials is one of Australia’s greatest assets that can be utilised to address several of society’s vexing challenges [2]. For example, the recycling of municipal solid waste (MSW) prevents the need for further landfill areas, which are a major source of greenhouse gas emissions [3]. Since the late 1970′s, over 4500 larger-scale recycling facilities have now been in operation in Australia, manufacturing “compost” from organic waste [2]. Compost has various benefits for soil health and structure, including increased moisture holding capacity and permeability [4], improved cation exchange capacity [5,6], increased organic matter and buffering of soil pH [7], the supply of essential plant nutrients, and aids the proliferation of soil micro-organisms [7,8].
In stormwater management, sandy loam soils are typically recommended as the treatment substrate in biofiltration devices due to their nutrient retention properties [9]. However, these soils are often excavated from areas of productive agriculture, which is not sustainable. Natural soils around the world are rapidly being lost due to land clearing and agricultural practices, with estimates that we have lost over 38% of our food-production land since 1950 [7]. Therefore, it is paramount that “new generation” sustainable substrates are found for water-sensitive urban design (WSUD) approaches such as raingardens and similar biofiltration devices. Recycled organic and mineral waste materials have the potential to provide a sustainable solution with local economic and performance benefits. Previous reviews on the use of compost as biofiltration media highlighted the need for further research on alternatives [4,10] particularly those materials that may potentially contain contaminants and/or are not sustainably sourced.
The use of recycled organic and mineral materials and the amendment of media to improve bioretention performance is an active area of research [10]. The use of column leaching experiments have been described as “mesocosms” [11,12] and studies, both in the lab and in the field, have demonstrated that various recycled organic and mineral materials can significantly reduce metals such as Cu, Pb, and Zn [13,14,15,16] and remove nutrients [4,17,18,19] when used in a biofiltration scenario. Results have also showed that media with excess clay can clog and increase total suspended solids TSS discharge [11].
Biofiltration guidelines in Australia, including the Facility for Advancing Water Biofiltration (FAWB) guidelines and the more recent Adoption Guidelines for Stormwater Biofiltration Systems—Summary Report [9], aim to assist in the development of biofiltration systems, including the planning, design, construction, and operation of these systems. The results from this study are used to develop/derive a modelling design within the Model for Urban Stormwater Improvement Conceptualisation (MUSIC v6) [20], a common tool used in the Australian stormwater industry. A recent review on the research needs of bioretention highlighted the need for improved modelling approaches [12]. This paper highlights some potential issues in using commercially available models and their applicability when using alternative filter media such as recycled organic and mineral materials.
This study aims to characterise recycled organic and mineral materials for use in biofiltration scenarios (as a design mix comprising different components), so that they can provide significant pollutant removal performance and a demonstrated equivalence to the M165 FAWB specification. The results from this study indicate that many recycled organic and mineral materials may be used as a suitable filter media (FM); particularly considering the pollutant removal performance and equivalence to the industry FAWB specification (sandy loam—coded “M165” from the supplier).

2. Materials and Methods

2.1. Materials

The characterisation of recycled organic and mineral materials is presented in this section to provide insight into their attributes and suitability for use in biofiltration devices. The recent Washington State monitoring data indicates that compost with sources other than yard waste may contain loosely bound heavy metals and nutrients, which may result in an increase in these compounds in discharges, at least initially [11]. This is the main reason for characterising recycled organic and mineral materials before their use as a biofilter media.
The determining attributes and suitability for use in biofiltration devices was achieved by comparing the characterisation data to the FAWB specification (M165) for filter media. Once the suitability of individual materials was determined, the design mix configurations (DM1 and DMS) were created, and a series of column leaching experiments were undertaken to compare the leaching/pollutant removal performance to the FAWB specification (M165).
The raw materials used in this study are shown in Table 1.
The materials were sourced from various recycling plants around the Greater Sydney Region in NSW (Australia) that manage a range of wastes from the urban centres. The materials tested consisted of both recycled organic and mineral components of varying particle size distributions (refer to Figure 1a–f). The recycled organic (RO-fine and RO-medium) are composts created from green waste (predominantly palm fronds), the biochar and calcium carbonate (CaCO3) were sourced from a commercial supplier, and the FAWB specification (sandy loam—coded M165 by the supplier) was sourced through a local quarry/soil supplier.
Using a combination of the raw materials shown above, Table 2 shows the percentage composition (by volume) of the two design mix configurations (DM1 and DMS) and Figure 2a,b show the particle size distribution of DM1 and DMS respectively. The design mix configurations and M165 (from Figure 1f) show a similar particle size in the 0.25–1 mm range.

2.2. Column Leaching Experiments

Three sets of column leaching experiments (CLE) were undertaken. The first CLE investigated the leaching potential of individual materials and the design mixes (DM1 and DMS), the second CLE investigated the pollutant removal performance, and the third CLE investigated the removal of Cu, Pb, and Zn (conservative pollutants) from natural stormwater. The method for the CLE was similar for all tests and is described below.
The packing of the columns was based on volume. For each material, a column was packed with a known mass and the height in the column was measured. Each column was gently tapped on a hard surface to promote settling but no compaction was applied. The column depth was typically 200 mm.
The column was positioned as shown in Figure 3. For constant-head conditions, a 1 L volumetric flask containing tap water was slowly poured into the top of the column. At the point where the top of the column contained a “head”, the volumetric flask was quickly inverted, and the spout was submerged in the tap water above the material in the column. The volumetric flask was clamped in place and the tap water moved through the column under gravity.
The time taken for the tap water to be eluted through the column reflected the saturated hydraulic conductivity (Ksat) of the material and was determined by calculation (volume/time). The 1 L of tap water was applied under constant-head conditions. The area of the 55 mm (ID) column was 0.00238 m2 (A = πr2) meaning 1 L/0.00238 m2 = 420 mm of tap water was applied. If the 1 L takes 1 h to move through the column then the Ksat would be 420 mm/h.
After elution, any losses from the 1 L of tap water were deemed to reflect the moisture holding capacity (MHC) of the FM and was calculated using the mass by difference. For example, if 1 L of tap water went into the column and 0.8 L was eluted out of the column (when freely drained), then the MHC equals 20%.
Tap water was used to create leaching curves based on its electrical conductivity (EC, µS/cm) and pH. The tap water was applied to the column under constant-head conditions and the column output was collected in approximately 100 mL increments and analysed using a HACH laboratory pH/EC meter.
Water from an urban creek was used as a surrogate for the “runoff” in the second set of column leaching experiments (pollutant removal). The runoff was collected from a local creek before the column tests. The analysis included pH, electrical conductivity (EC), dissolved oxygen (DO), total Kjeldahl nitrogen (TKN), total oxidisable nitrogen (TON), total nitrogen (TN), orthophosphate (PO43−), total phosphorous (TP), copper (Cu), zinc (Zn), turbidity, total oil and grease (TOG), and total organic carbon (TOC); all based on standard water analysis methods [21]. The same water was used in the third set of column leaching experiments (metals removal) however was spiked with trace amounts of Cu, Pb, and Zn to provide a positive presence of these metals in the eluent.

2.3. MUSIC v6 Modelling

The conceptual modelling was undertaken using the Model for Urban Stormwater Improvement Conceptualisation (MUSIC v6), a continuous simulation conceptualisation model [20] used in the stormwater industry. The setup used in MUSIC v6 is shown in Figure 4, comprising of urban source nodes flowing to a raingarden and then to a junction (for the options M165, DM1 and DMS). Figure 5 shows the conceptual plan and longitudinal view of the “Bioretention Treatment Node” as used in MUSIC v6 [20].
The rainfall from Blacktown NSW was used in the case study (Blacktown Development.mlb, 1966–1976) and was obtained through the MUSICLink feature within MUSIC v6.
Source nodes—“Urban” source nodes were used in the modelling. Urban_M165, Urban_DM1, and Urban_DMS were all similar in catchment properties, with a catchment area of 0.28 Ha and 90% impervious area. The water quality (runoff) defaults and rainfall-runoff parameters used in MUSIC v6 were not altered.
Treatment Nodes—“Bioretention” treatment nodes were selected for use in the model. Table 3 provides the properties of the raingarden and an example of the screenshot (for sandy loam) is shown in Figure 4. The only difference between the options (M165, DM1 and DMS) was the inclusion of actual analysis data (in bold) for TN and orthophosphate (as Colwell P) (from Table 4). The base of the raingarden was lined and vegetated with effective nutrient removal by plants. An underdrain was present, and the overflow weir width was 1.2 m. The default values for k and C* for the total suspended solids (TSS), total phosphorous (TP), and total nitrogen (TN) were used in the modelling. The determination of appropriate k and C* values were based on first assuming a representative particle size distribution of the suspended solids (sediment) in urban stormwater and an assumed pollutant speciation distribution within this range [20].
From Appendix G in the MUSIC Help directory [20], “At this stage the selection of default values for k and C* for music is therefore based on a combination of hypothetical (qualitative) and limited quantitative information, owing to the absence of any extensive data base for the range of stormwater treatment measures considered. Nevertheless, default values are required, and should address both the relative effectiveness of the various treatment nodes, and the relative behaviour of the different water quality parameters at a single node. This Appendix describes how the default values of k and C* were derived. However, C* can be expected to also vary during the inter-event period as chemical and biological processes alter the ambient concentrations of contaminants in waterbodies receiving stormwater. These processes are not modelled in the current version but are subject to-going research and development.
A sensitivity analysis was undertaken using a calibrated MUSIC scenario and the results are prese nted and discussed in the next section.

3. Results & Discussion

The characterisation of recycled organic and mineral materials is presented in this section to provide insight into their attributes and suitability for use in biofiltration devices. For example, the biofiltration media should not contribute excess salts, nutrients, metals, and/or sediment. This is consistent with the water quality objectives to receiving waterways [22] and with previous studies that have reviewed the use of filter media and biofiltration design [10,11].
Once the suitability was determined, the design mix configurations were created (DM1 and DMS), and a series of column leaching experiments were undertaken to compare the pollutant removal performance of the filter media compared to the FAWB specification (M165) and the Adoption Guidelines for Stormwater Biofiltration Systems [9].

3.1. Characterisation of Materials

Table 4 summarises the detailed chemical and physical analysis of all the materials and design mixes (DM1 and DMS). The chemical analysis was undertaken by EnviroAg EastWest Laboratory at Tamworth and the physical analysis was undertaken at the University of Newcastle; based on standard soil analysis methods [23].
The extensive analysis suite was selected to provide data on the soil function and the ability of the soil (or media) to sustain plant growth. Parameters such as pH, electrical conductivity (EC), exchangeable cations (Ca, Mg, Na, K), exchangeable trace metals (Cu, Zn, Fe, Mn), total nitrogen, total carbon, Colwell P (plant-available phosphorous), and effective cation exchange capacity (ECEC) were used to determine the suitability of a soil for plant growth. Physical parameters such as saturated hydraulic conductivity (Ksat), moisture-holding capacity (MHC), and bulk density (BD) are important as they impact on biofiltration operational objectives. The data in Table 4 will be referred to in later sections when comparing the FAWB specification (M165) to DM1 and DMS.
Understanding soils and interpreting data is especially relevant to many other environmental and land management issues, including urban development, salinity control, clearing of native vegetation, prevention of land degradation, control of water and wind erosion, irrigation development, the management of effluent disposal, and management of acid-sulfate soils [7].
The dataset shown in Table 4 is just one of many that have been used in the development of new organic biofiltration media guidelines recently published; the “Performance & Validation Standards for Organic Bio-Filtration Media” [24] has been included as an addendum to this paper.

3.2. Column Leaching Tests—Leaching Potential of Individual Materials and the Design Mixes (DM1 and DMS)

The aim of this experiment was to demonstrate the leaching behaviour of materials with respect to EC and pH, as both are important trigger values in the ANZECC guideline [22]. The trigger values for different indicators of water quality are provided as a threshold value or as a range of desirable values. Trigger values are conservative assessment levels and not ‘pass/fail’ compliance criteria and typically provide a threshold for management actions.
The biofiltration media should not leach excessive salts and should have a suitable pH before being discharged to natural receiving waters. Figure 6 shows the tap water eluted through all materials resulted in leaching of cation/anions (as increasing EC); however, all materials, except washed sand and biochar, produced a relatively high peak before returning close to initial tap water EC (at around 1.4 L). Washed sand did not produce a peak (low ECEC, minimal cations/anions to be leached). Biochar displayed hydrophobic properties that resulted in a longer wetting time and slower release of salts, hence the broadness of the “peak” before trending back to tap water EC values. Note that eluent EC for both DM1 and DMS did not exceed the ANZECC trigger value of 2000 µS/cm; meaning it would be suitable for discharge to natural waterways.
The change in pH is shown in Figure 7. The ANZECC guidelines [22] trigger values for aquatic ecosystems (SE Australia) range from 6.5–8.5 and all materials achieved this except biochar (high pH). The results indicate that the discharge from these materials, from a raingarden or biofiltration device for example, would be within the desired pH range, and would not impact on receiving waters.

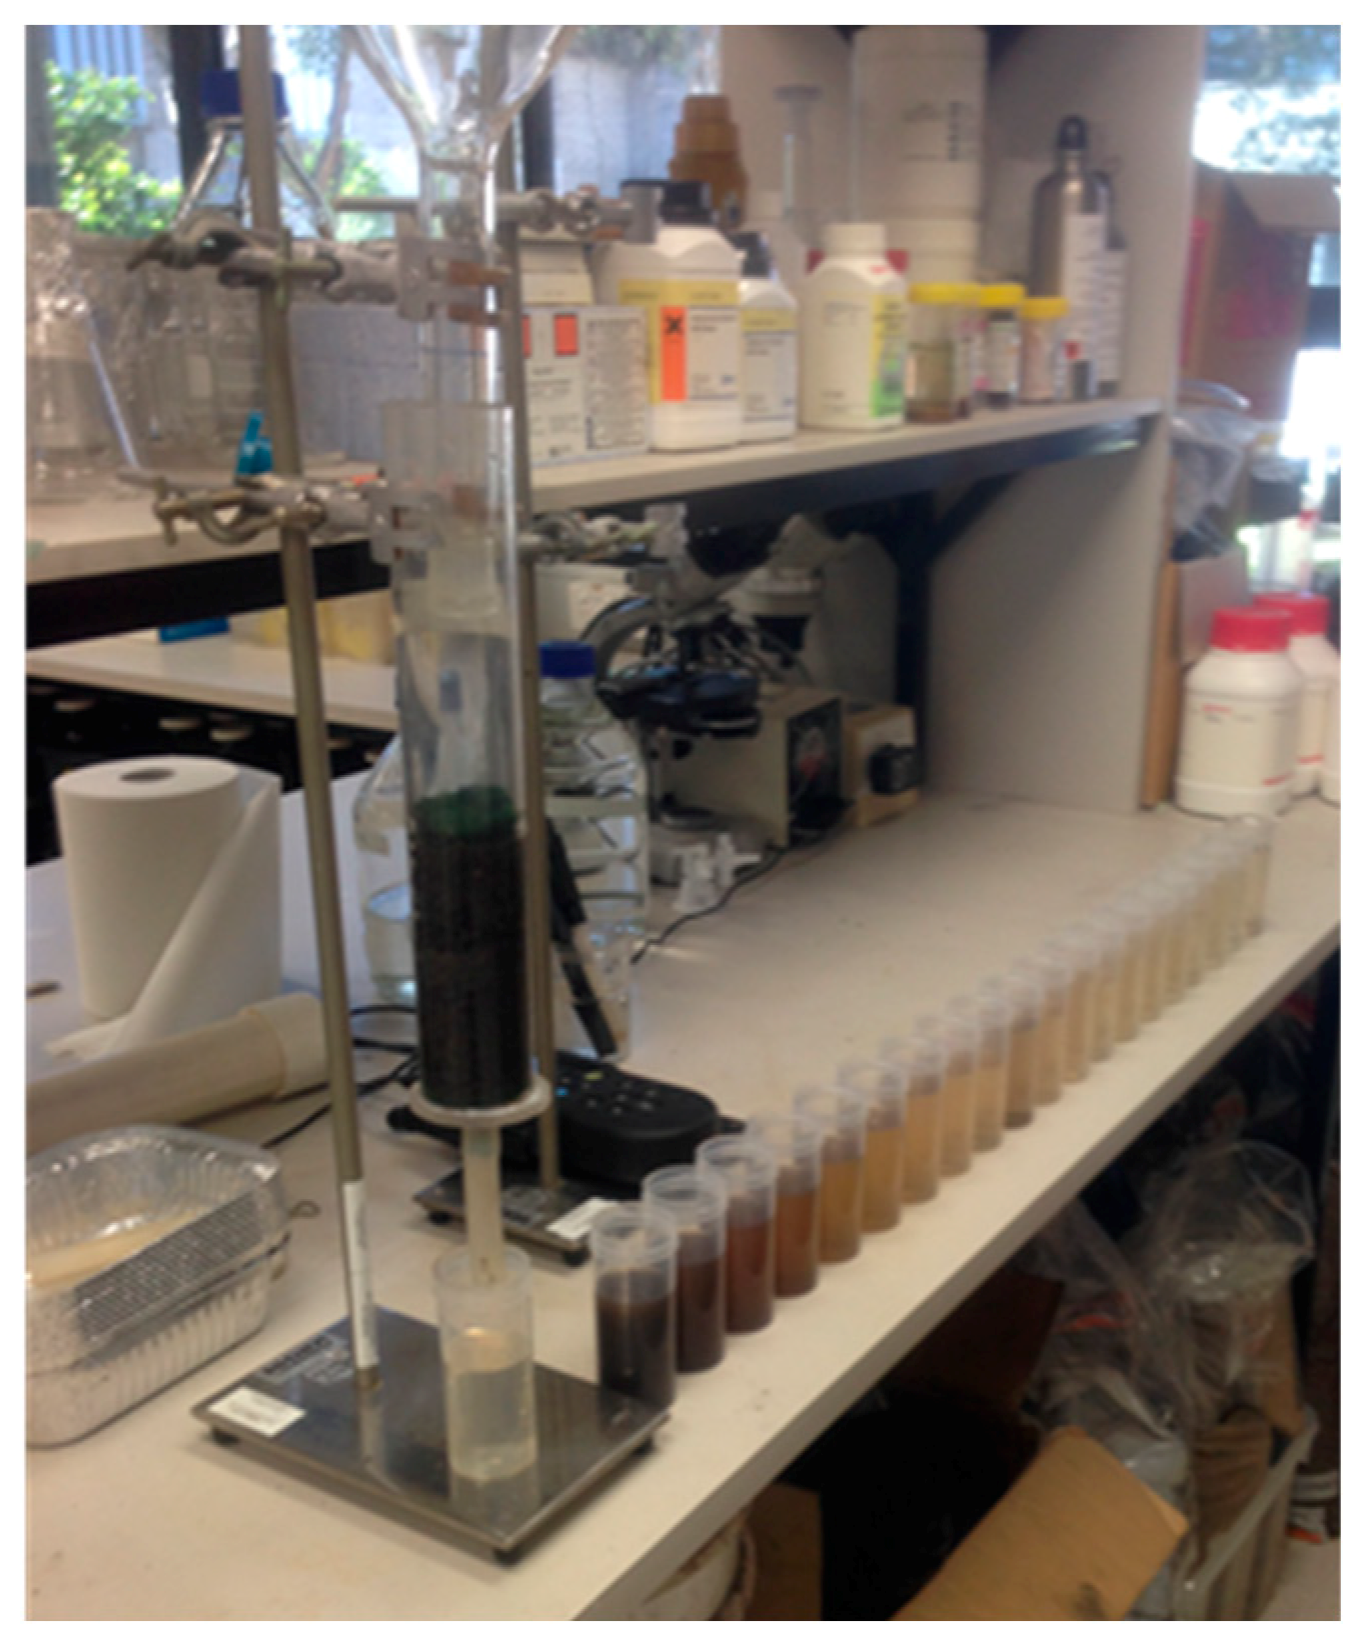
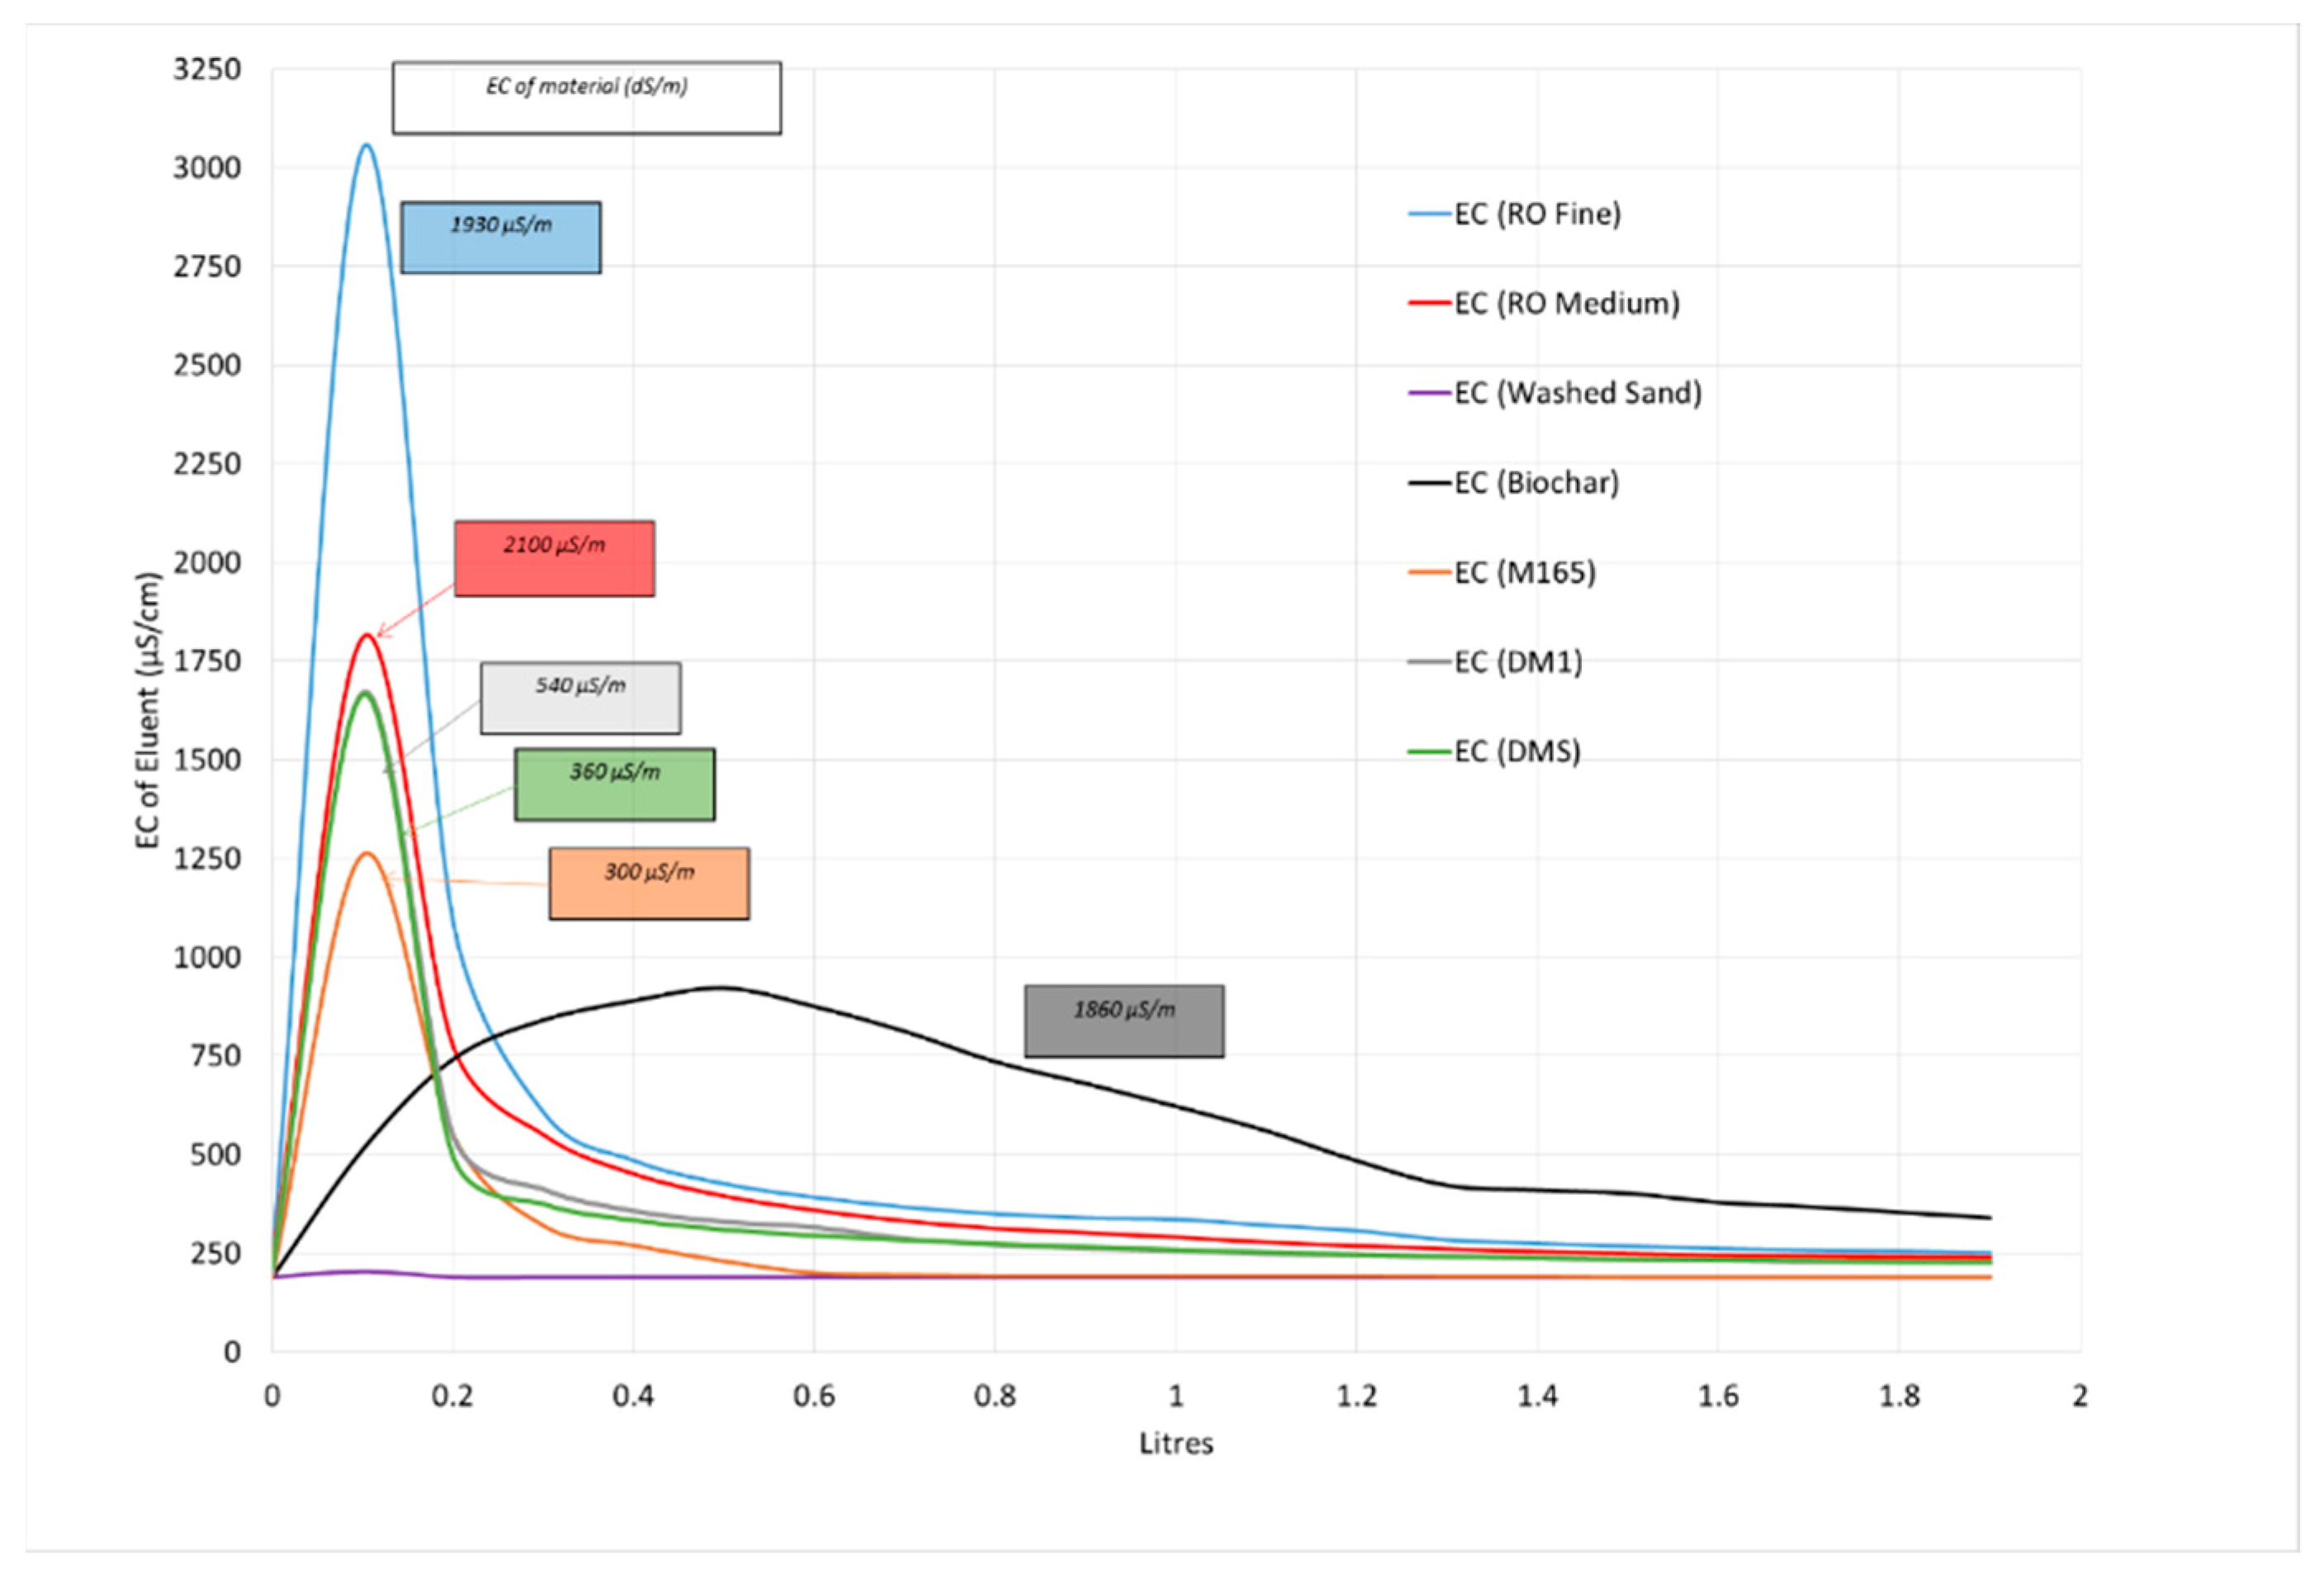
3.3. Column Leaching Tests—Pollutant Leaching

The second set of column tests attempted to demonstrate how the materials would behave under high flow conditions (saturated, low residence time) in leaching and/or removing pollutants. Water from a local urban creek was used as the “stormwater runoff” for eluting through the columns. Note that the experiment was undertaken in two batches where the stormwater for each batch had a slightly different water quality profile. Table 5 shows the initial stormwater quality (Stormwater1 and Stormwater2) and the change in pollutants after elution. Note that biochar and CaCO3 were not included in this experiment as they were typically used as soil additives rather than as a major component.
Table 5 values shown in 
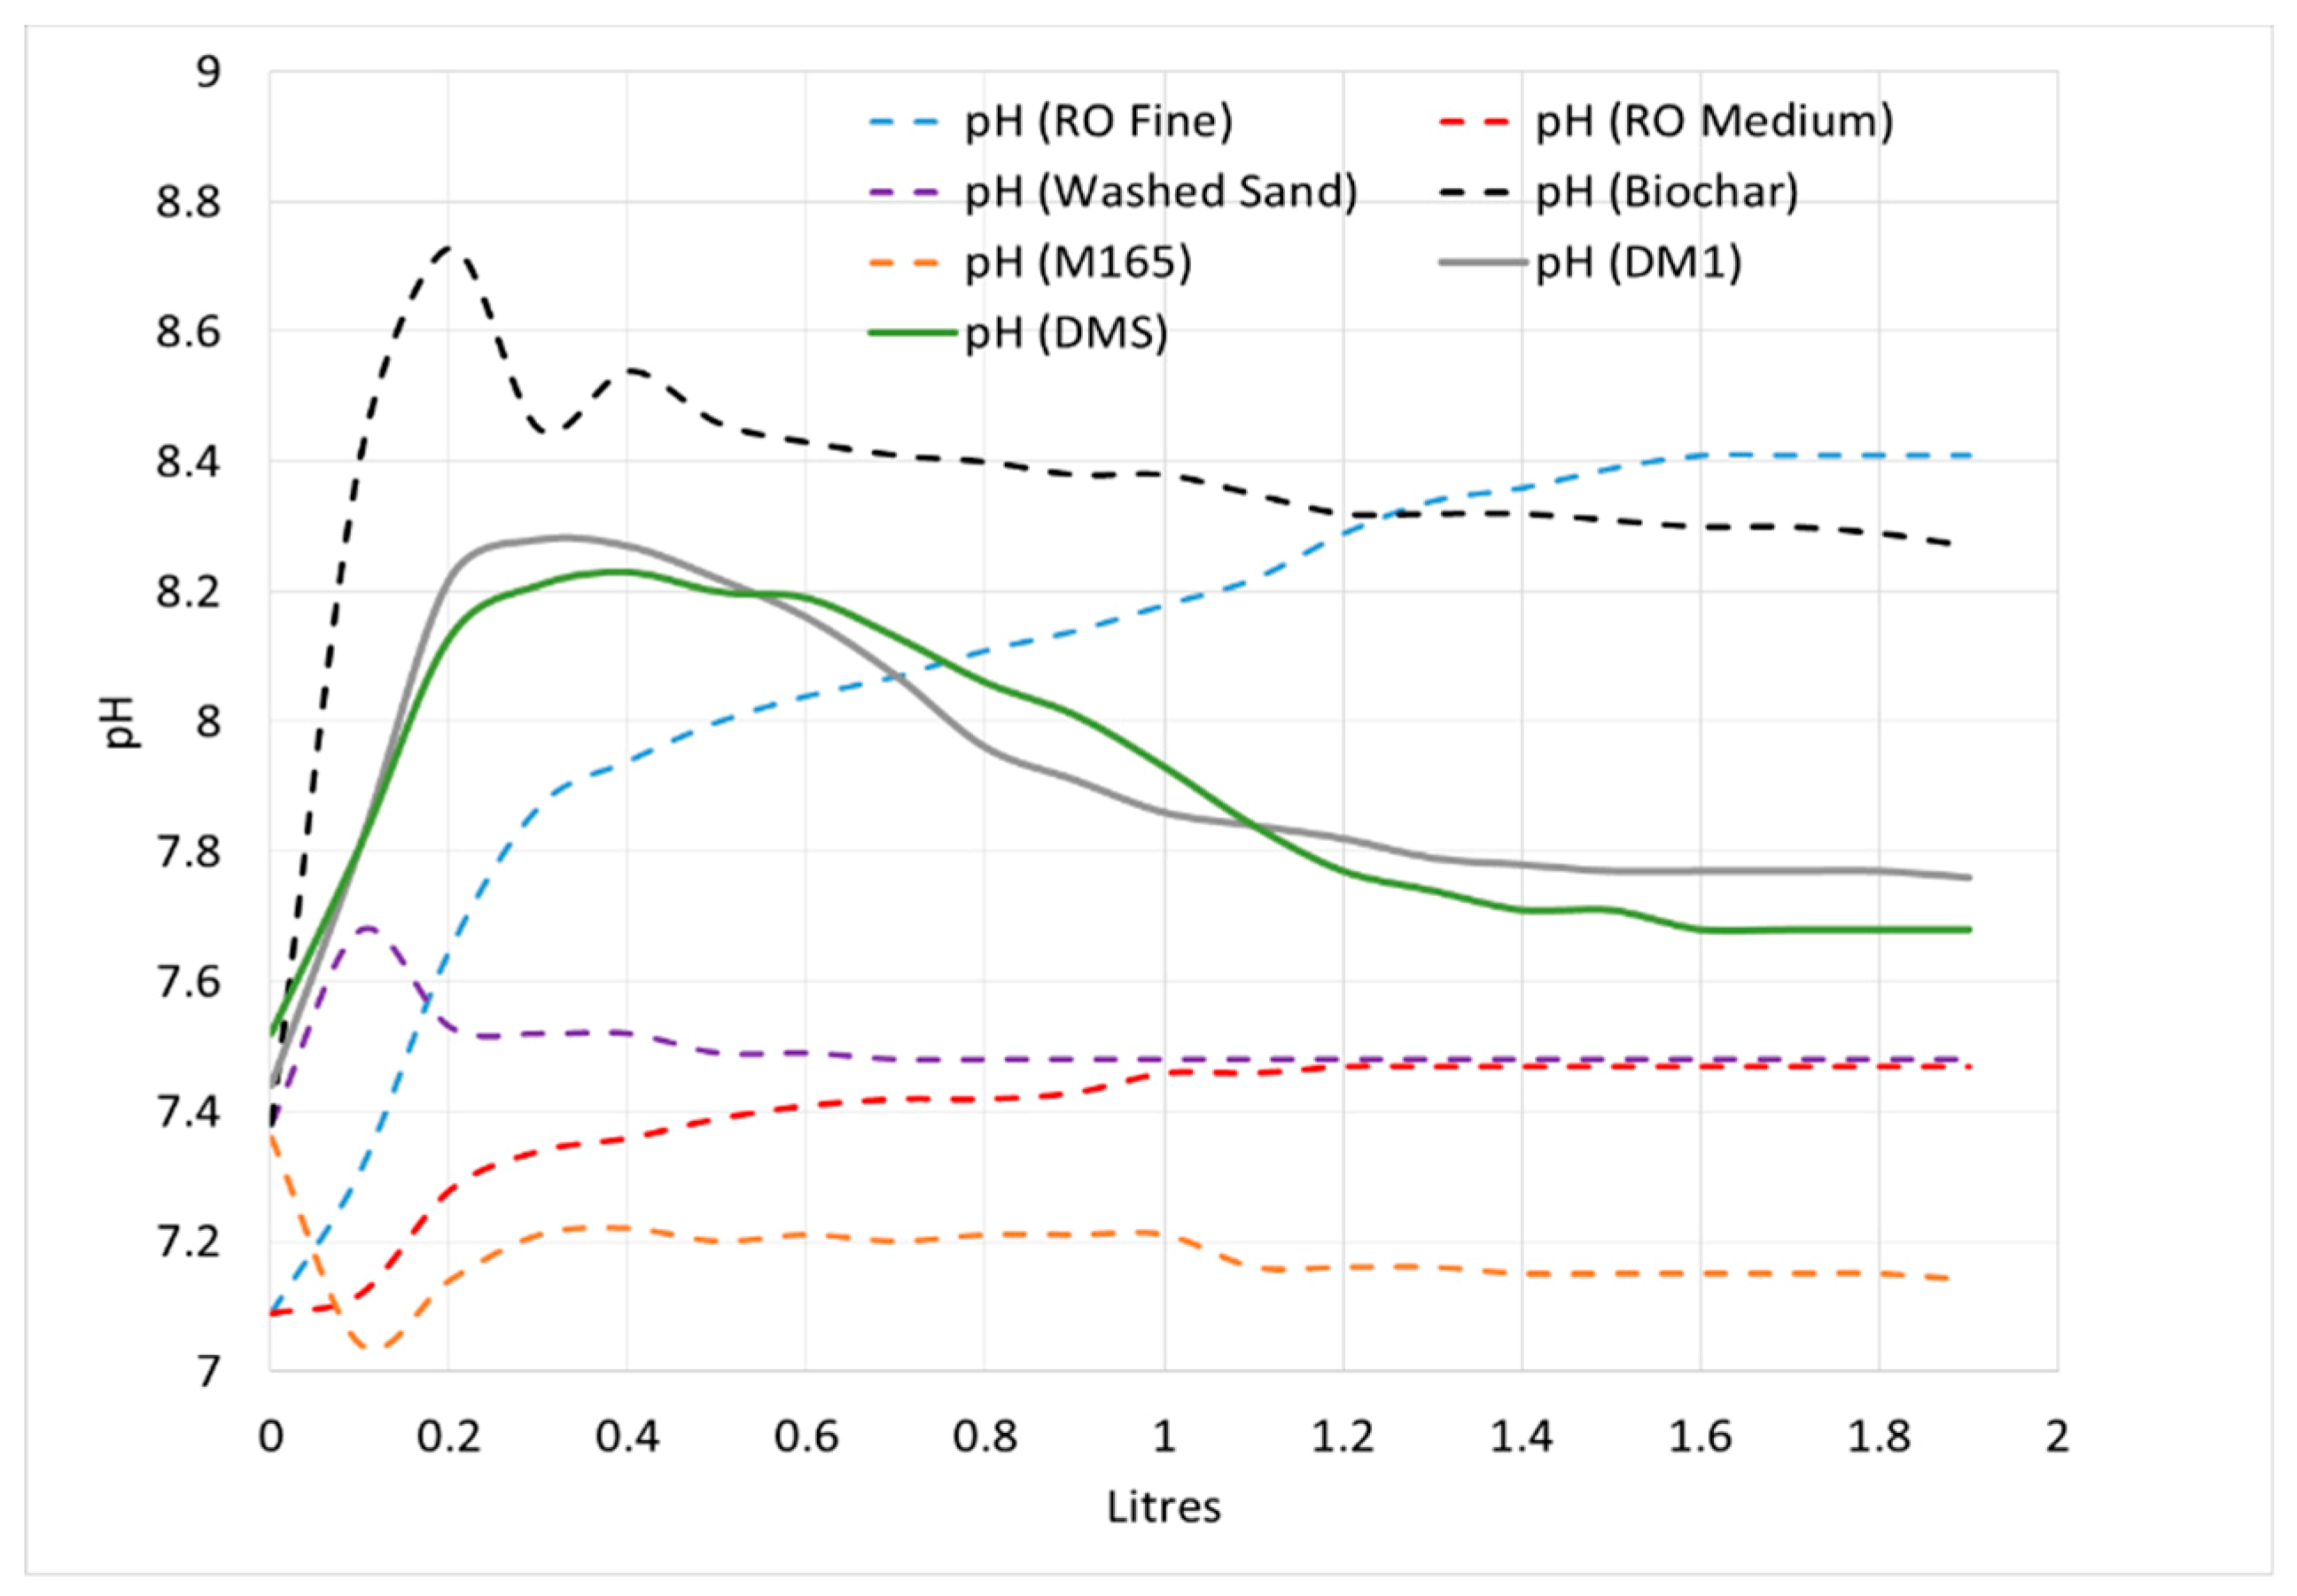
bold indicate an increase compared to initial stormwater quality. All the pH, EC, DO, and turbidity values, after elution, were within ANZECC guidelines (based on SE Australia, aquatic ecosystems) [22] and indicate minimal impact on the receiving ecosystems. The TOC and TOG showed negligible change from the initial stormwater quality.
TN = TKN + TON, where TKN = bound N, and TON = soluble N. The RO-fine and RO-medium leached TN (as TKN), however TON decreased, possibly due to volatilisation, meaning that TON was not leached from these materials. The RO-fine and RO-medium also leached some TP, Cu, and TOC to a small extent. The current specification (M165) leached more TN (as TKN) than the alternative filter media (DM1 and DMS).
Minimal leaching of TP occurred for M165, DM1, and DMS, however there was some leaching of TP from RO-fine and RO-medium. This indicates that the use of RO in a design mix, such as DM1 and DMS, may provide a source of P for plant establishment in a raingarden (no amelioration required).
Surprisingly, washed sand leached the highest amount of Cu and Zn (42 and 41 µg/L respectively) whilst other materials leached minimal Cu and Zn. It is important to note that many parameters lied within Australian Runoff Quality (ARQ) [25] ranges, a document that “characterises” the typical stormwater quality profiles in Australia (and from different landuses/surfaces) that biofiltration devices would be expected to treat. Compared to the ARQ ranges [25], the Cu and Zn concentrations could be considered low.

3.4. Column Leach Tests—Metals Removal

The third column experiment investigated Cu, Pb, and Zn (conservative pollutants) removal by M165, DM1, and DMS, from natural stormwater. Table 6 shows the initial stormwater quality for Cu, Pb, and Zn (Inflow), the values after elution with natural stormwater (1 L), and the percentage reduction.
Significant removal rates for Cu and Zn were observed for M165, DM1, and DMS, which are consistent with other studies [13,14,15,16]. The removal rates for Pb were >50 % for DM1 and DMS, however there was no change in Pb for M165. A further 6 L (7 L in total) was applied to M165, DM1, and DMS; and the filter materials were then analysed for total Cu, Pb, and Zn (Table 7).
The values in Table 7 were compared to the Industrial Waste Resource Guideline (IWRG) [26], which provides limits on contaminated soils for disposal. The results indicate that once the filter media of a raingarden has been subjected to 2940 L/m2 (7 L passing through the column) of runoff containing Cu (162 µg/L), Pb (0.4 µg/L), and Zn (138 µg/L), it would be suitable for the fill material to be used for other purposes (landscaping and clean fill developments) and would not require special transport/disposal to a reuse area. Further research into the lifespan of the filter materials is required, however all materials demonstrated a high removal rate for Cu, Pb, and Zn.

3.5. Comparison to Guidelines

In Australia, the use of filter media in biofiltration devices is approved through a procurement process within local councils. If the filter media does not meet the FAWB specification, then it will not be used, as the procurement processes strive to reduce risk (environmental, economic, and social). The guideline states that the organic matter in biofiltration media cannot exceed 5% and, since many organic recycled materials such as compost have higher levels, they have effectively been excluded from the procurement process and from market opportunities within the stormwater industry. The Adoption Guidelines for Stormwater Biofiltration Systems—Summary Report [9] provides a summary of the important parameters for the biofiltration filter media (see Table 8) used in Australia. Cells with a “√” and/or are in bold could be considered within specification. For example, hydraulic conductivity can be reduced and residence times increased with a degree of compaction. Values are given for the other parameters to provide a comparison to the M165 FAWB specification.
Material—RO (fine and medium) and biochar cannot be considered as engineered soil/sand. Washed sand, M165, DM1, and DMS can be considered as engineered soil/sand and satisfy the CRC Guideline requirements.
Hydraulic Conductivity—All materials can be compacted to achieve the desired hydraulic conductivity within the CRC Guideline requirements.
Clay and silt content—All materials contained <3% clay content and satisfy the CRC Guideline requirements.
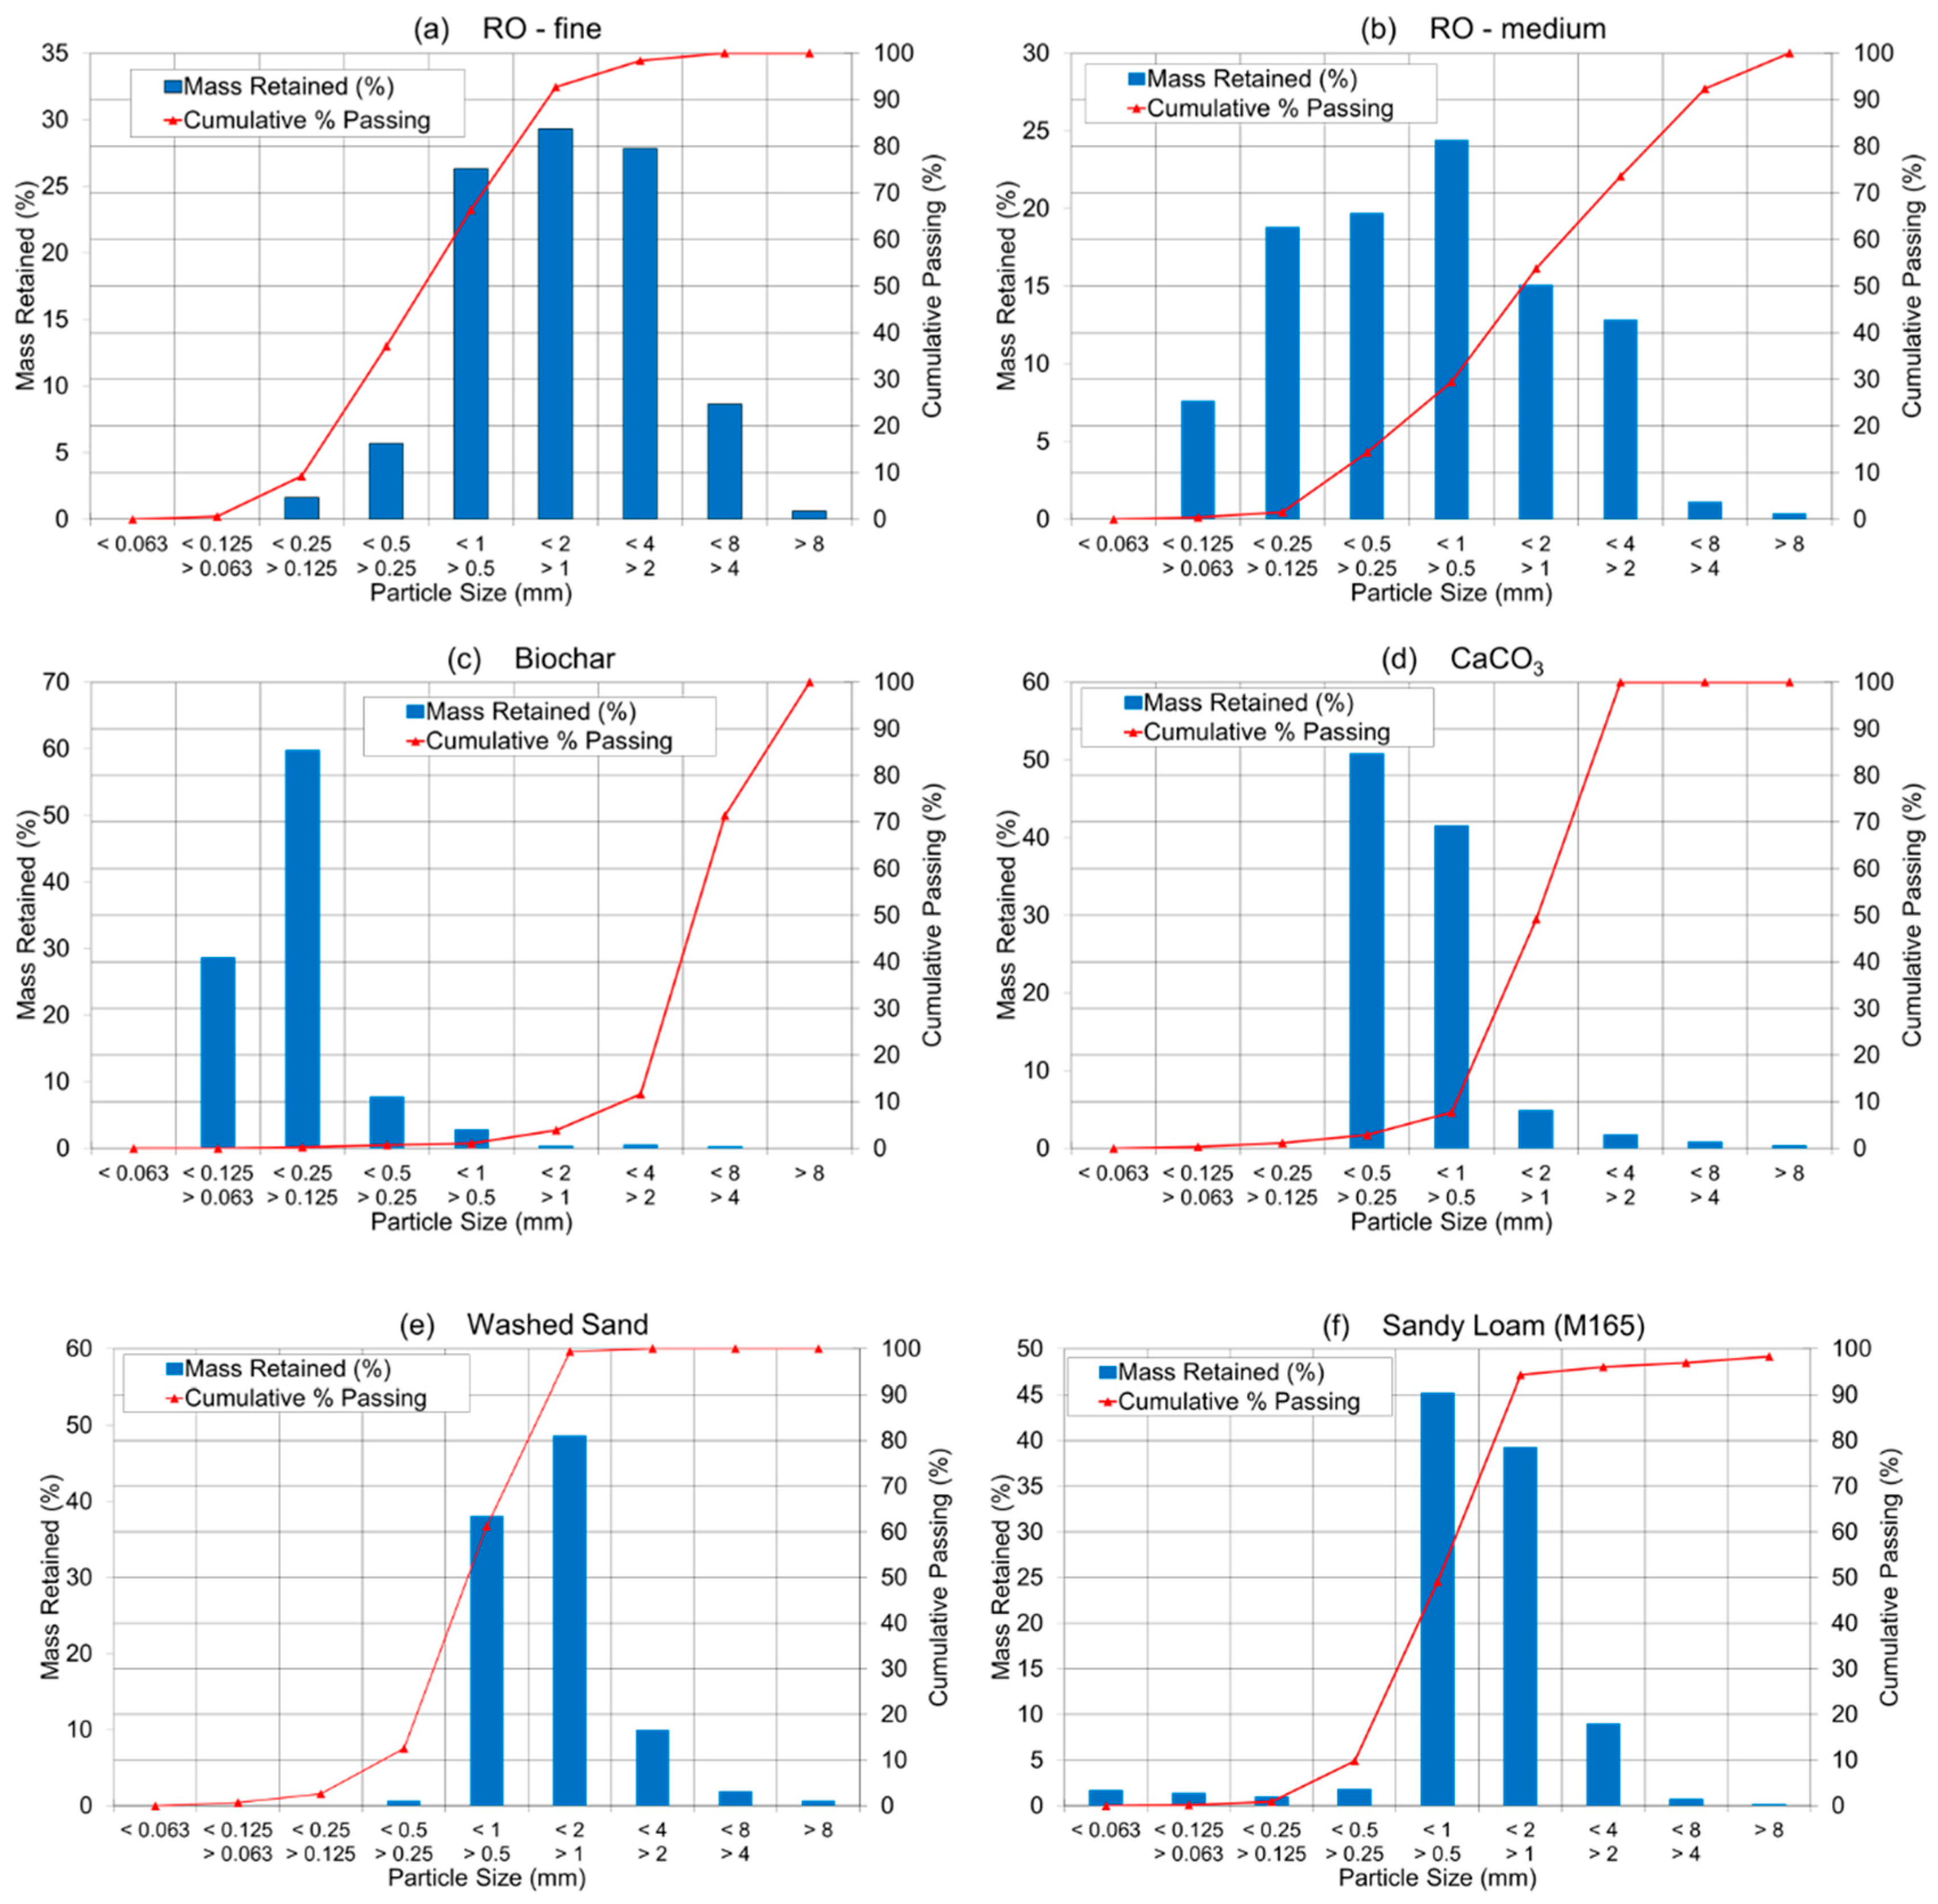
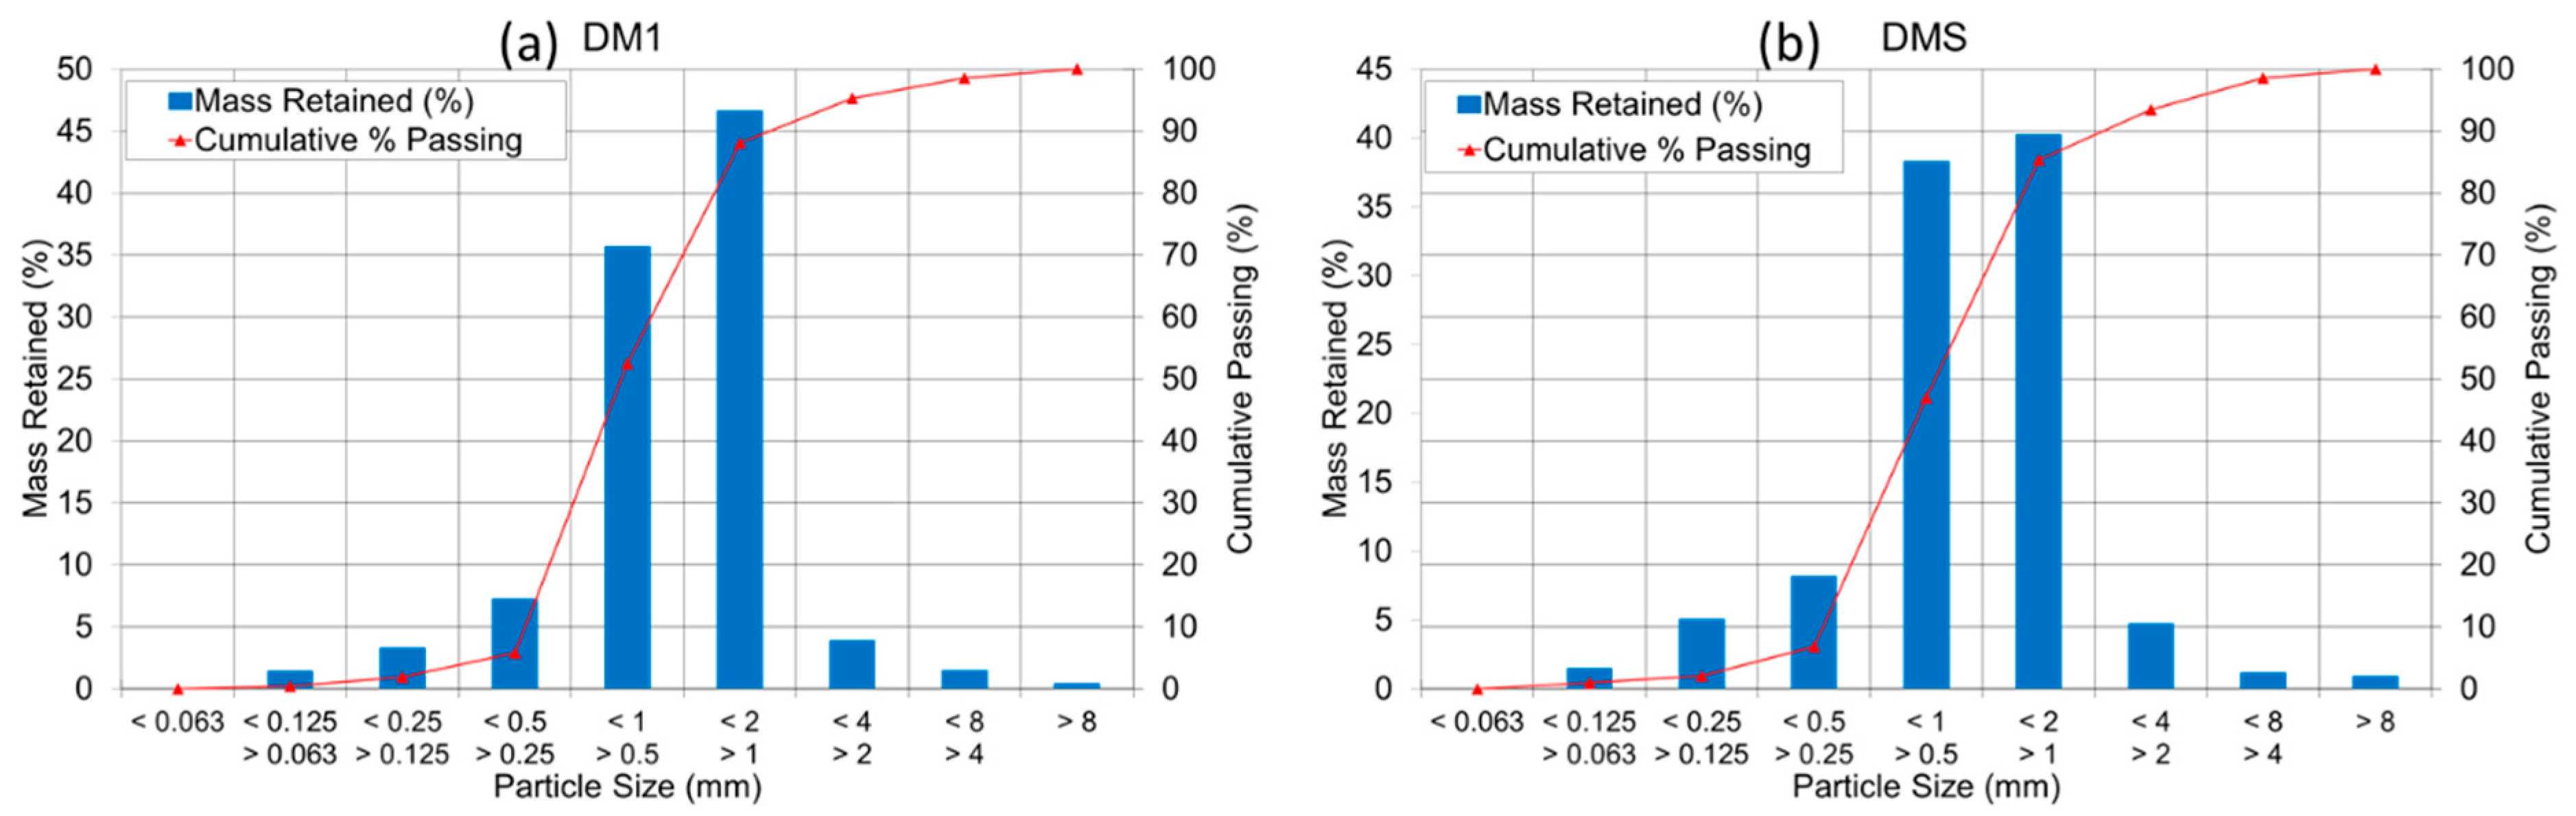
Grading of particles—RO (fine and medium) and biochar had a wider (and higher) range of particle sizes that exceeded the CRC Guideline requirements. Greater than 95% of the particle sizes in the washed sand, M165, DM1, and DMS were within the CRC Guideline requirements (0.05–3.4 mm) and were satisfactory for use in biofiltration.
Nutrient content—RO (fine and medium) and biochar contained TN that far exceeded the CRC Guideline requirements (>>1000 mg/kg). Washed sand and M165 are well below the CRC Guideline requirements and, since this is too low to sustain plant growth, potassium nitrate and superphosphate are typically added to M165 (at 300 g/m3). DM1 and DMS exceeded the CRC Guideline requirements however these values will be modelled in the MUSIC v6 later in this paper to demonstrate the suitability of DM1 and DMS as filter media in raingardens. RO (fine and medium) and biochar contained orthophosphate (plant-available phosphorous as Colwell P in Table 2) that exceeded the CRC Guideline requirements (<80 mg/kg). Washed sand, M165, DM1, and DMS were all within the CRC Guidelines requirements.
Organic matter—RO (fine and medium) and biochar were all 100% organic matter and did not satisfy the CRC Guideline requirements. DMS and DM1 were 50% and 65% organic matter respectively and washed sand and M165 had minimal organic matter (0.1% and 0.4% respectively). This requirement (≤5% organic matter) is currently the subject of debate in the stormwater industry due to claims of excess leaching of nutrients. However, the CRC for Water Sensitive Cities has recently added to its filter media guidelines (CRC Guidelines)—“There may be soil with higher organic content that the level specified that may not leach nutrients (TN and/or TP). It is also acknowledged that organic matter content does not have a direct link to nutrient leaching” [9].
pH (1:5 in water)—The pH values in the CRC Guidelines essential specifications prescribe a value of 5.5. to 7.5. The FM materials ranged from 6.8 (M165) to 9.2 (biochar). The range of pH, after leaching tests, will be discussed in Section 3 in relation to the ANZECC water quality guidelines [21].
Electrical conductivity (EC, 1:5 in water)—RO (fine and medium) and biochar exceeded the CRC guideline values (>1.2 dS/m). Washed sand, M165, DM1, and DMS were within the CRC Guideline values (<1.2 dS/m) and were satisfactory for use in raingardens.
Horticultural suitability—DM1 and DMS have been deemed as appropriate for use in raingardens based on the data in Table 4. Note that M165 required an initial addition of fertilizer at a rate of 300 g/m3.
Particle size distribution—The CRC Guideline states that the filter media should be 10–30% fine sand. M165, DM1, and DMS ranged between 30–35% fine sand and satisfied the CRC Guideline requirements. The final mixes for DM1 and DMS had particles over the size range prescribed in the CRC Guidelines. However, no negative performance consequences were identified.
Depth—Washed sand, M165, DM1, and DMS could be used for the CRC Guideline requirements for depth.
Once-off nutrient amelioration—M165 needed amelioration however this was not required for DM1 and DMS
Submerged zone—Washed sand, M165, DM1, and DMS could be used to increase or decrease hydraulic conductivity (depending on compaction) to satisfy the CRC Guideline requirements.
The design mix configurations of DM1 and DMS appear to be a comparable media to M165 for use in biofiltration devices.

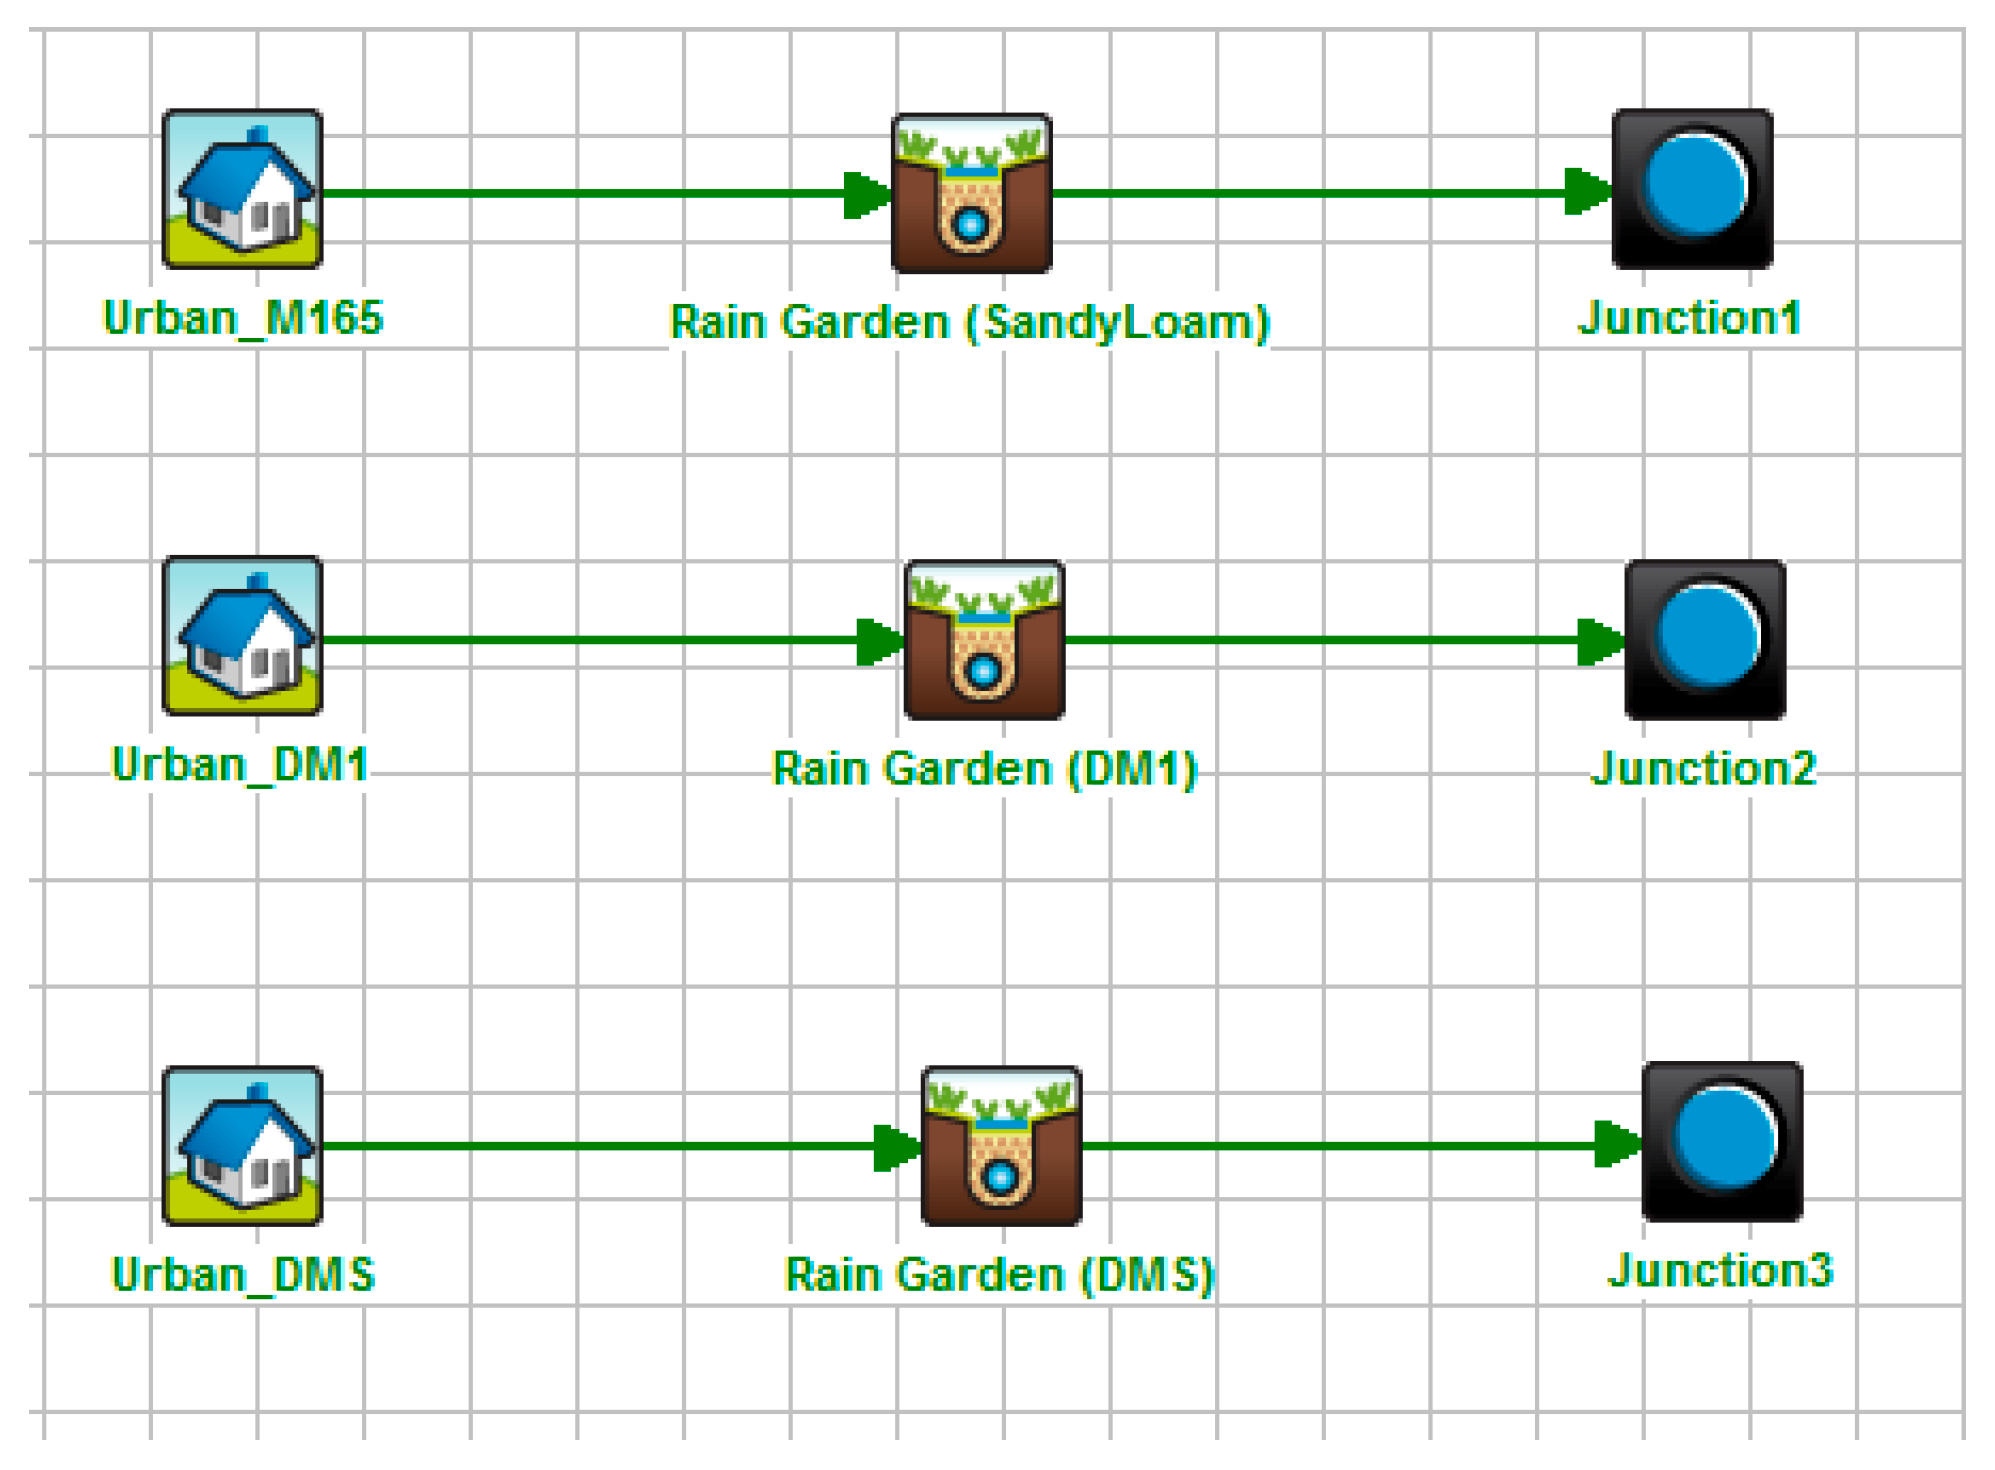
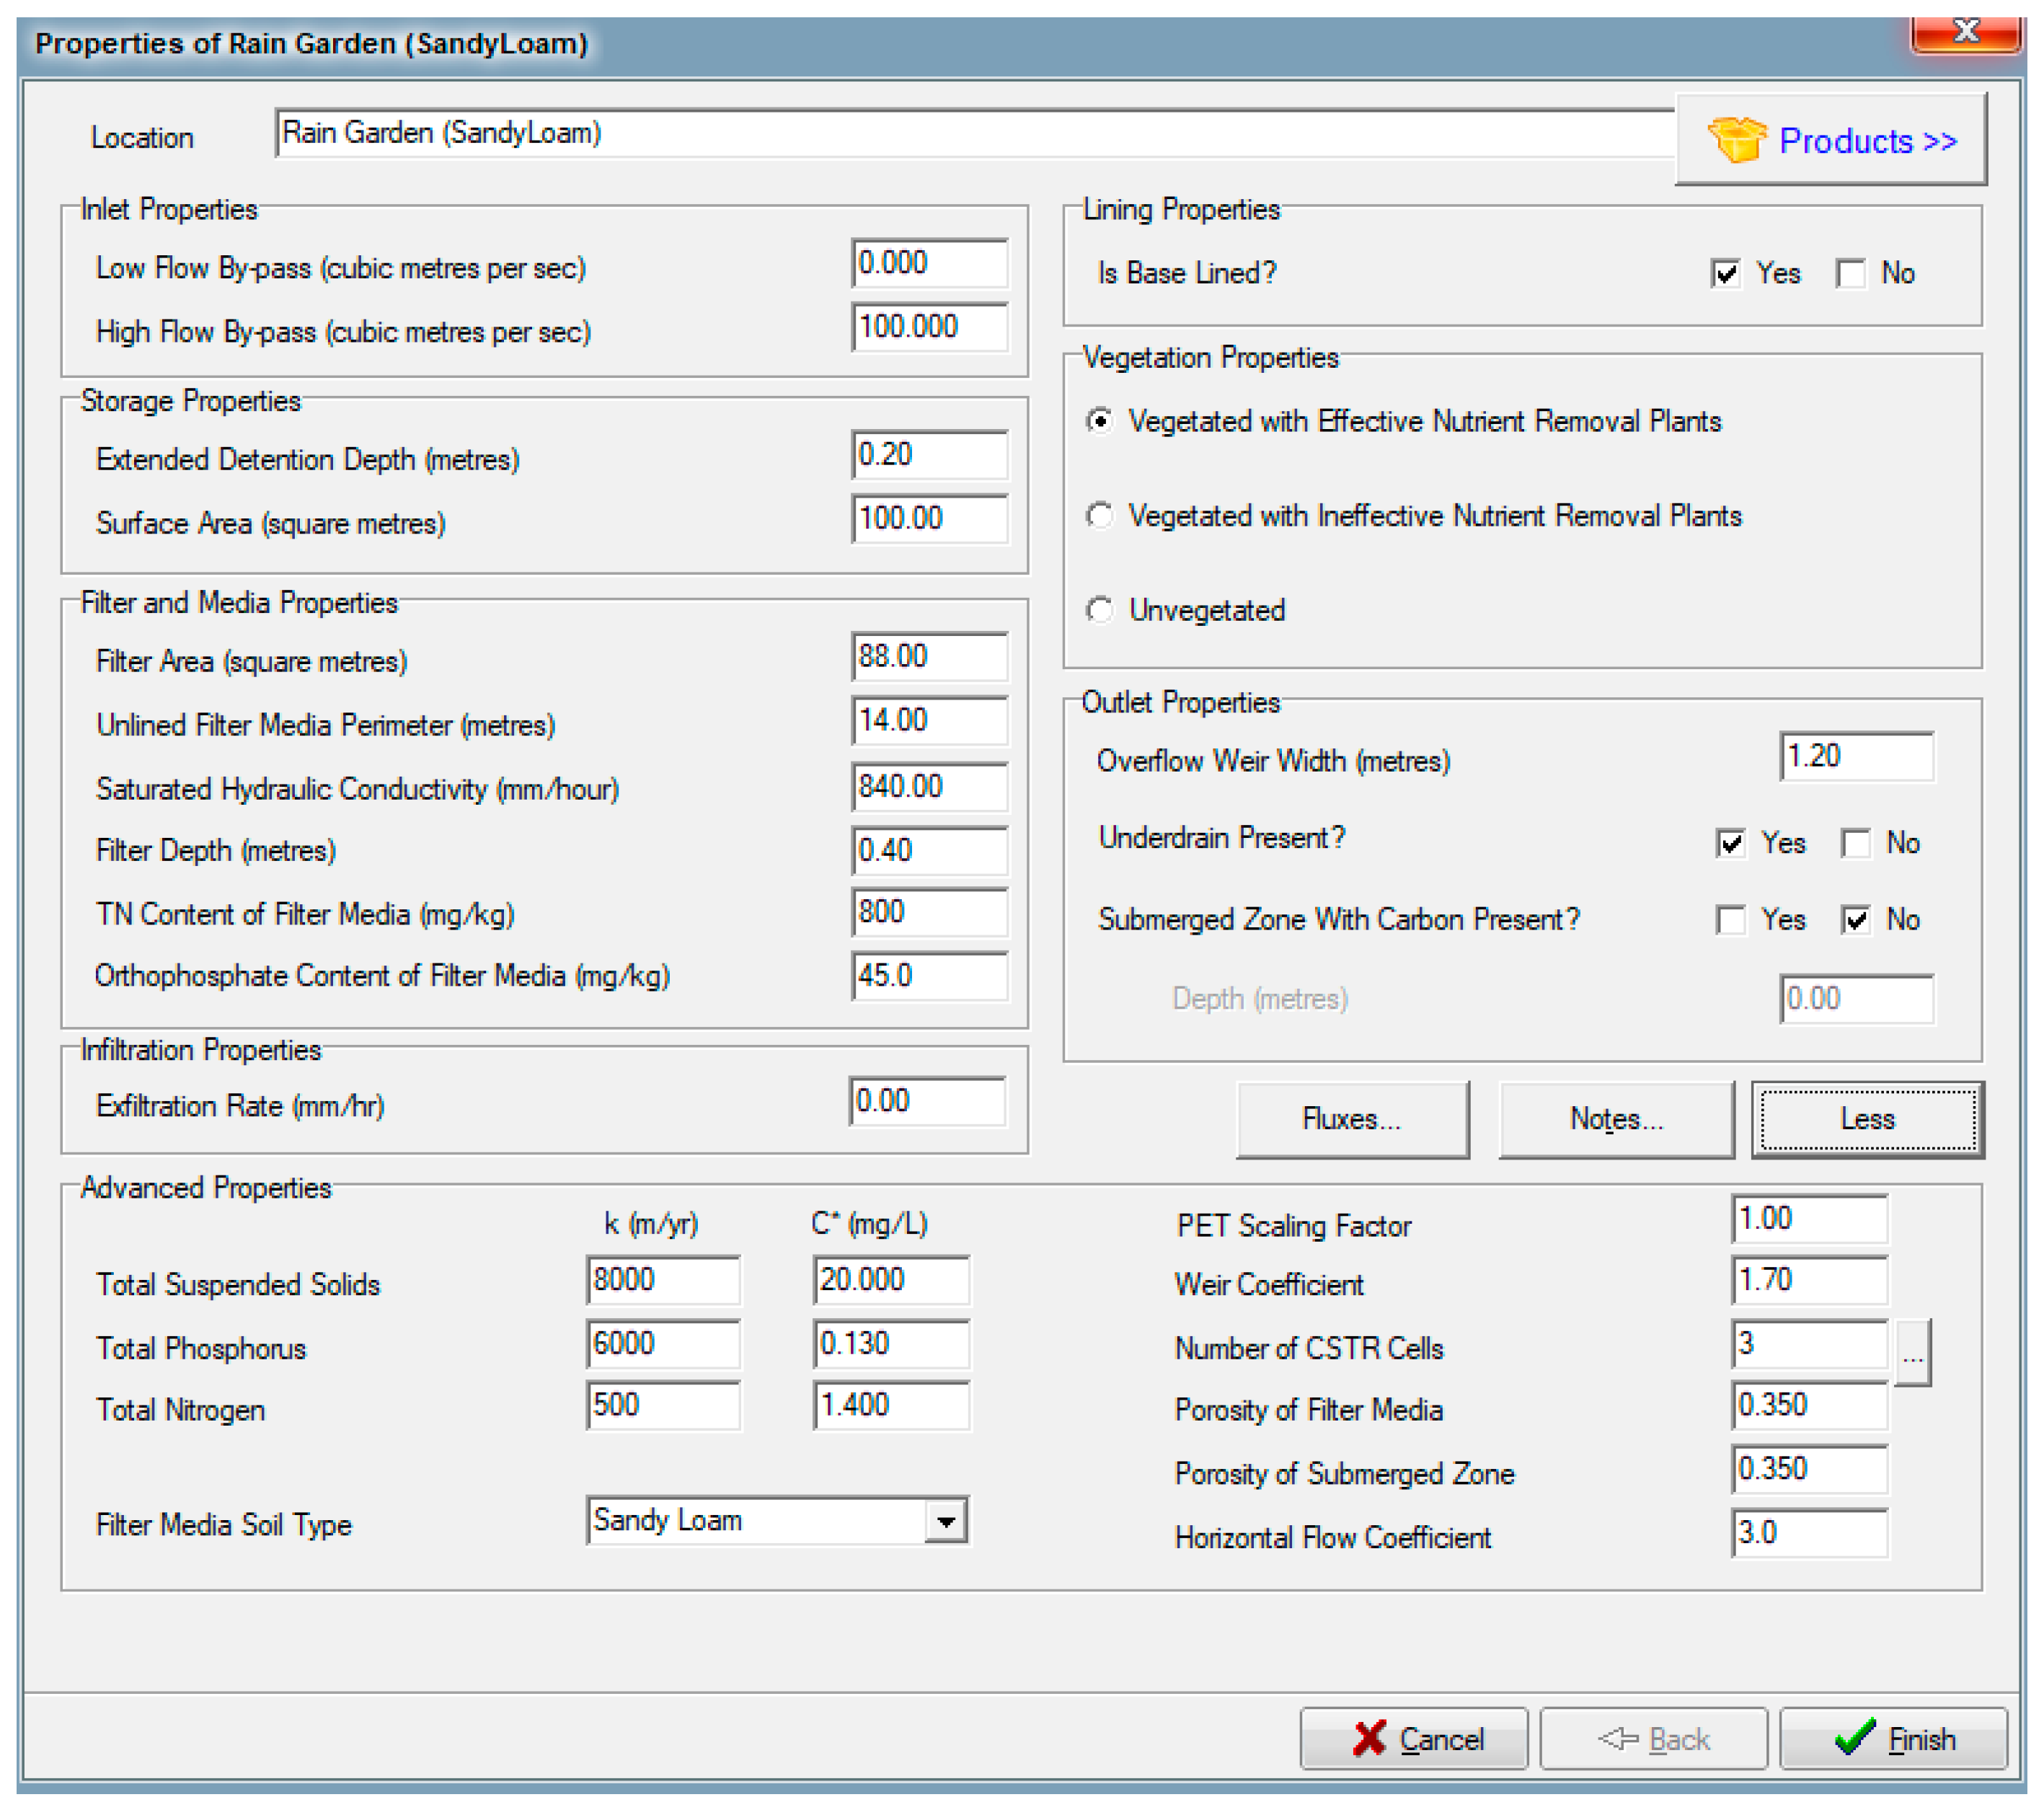
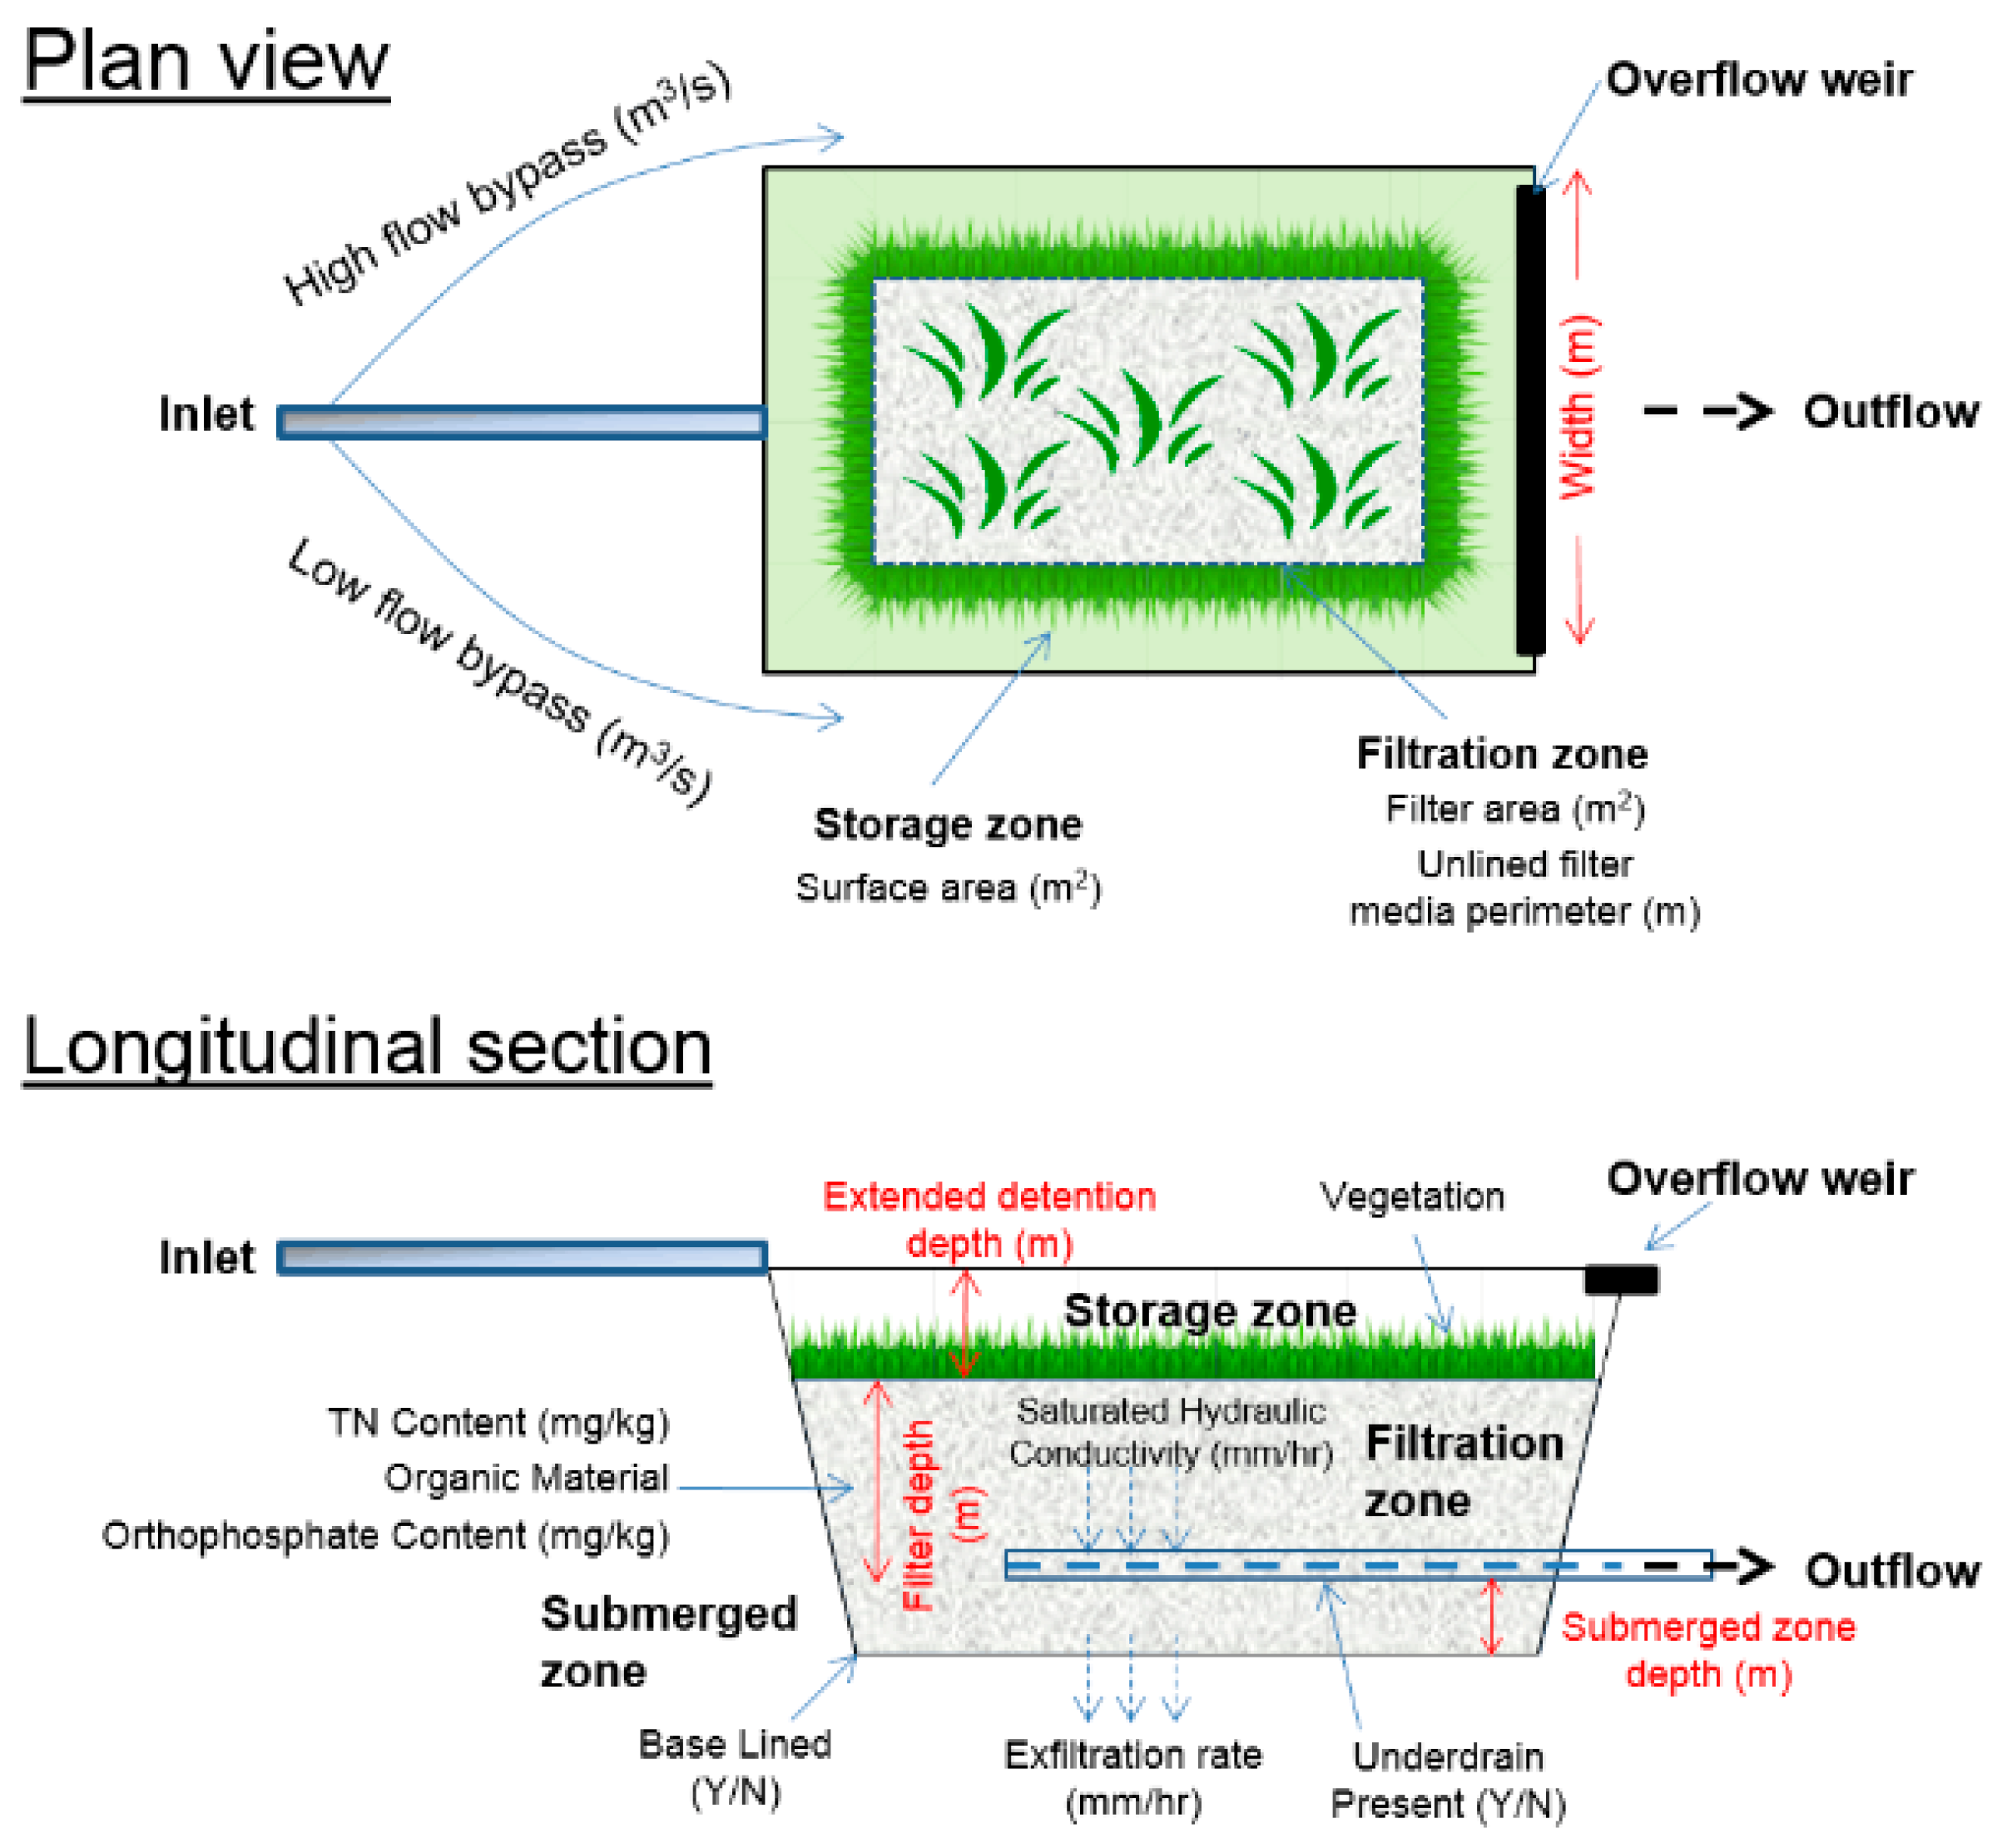
3.6. MUSIC v6 Modelling

This report has characterised several materials (RO-fine, RO-medium, washed sand, and M165) and design mixes (DM1 and DMS) in terms of their physical and chemical properties, demonstrated the leaching/pollutant removal behaviour of the same, and compared the current CRC Guideline specifications (FAWB specification, M165) to DM1 and DMS for use in biofiltration devices. MUSIC v6 was used as a conceptual design tool for sizing bioretention devices (amongst other scenarios) and evaluating water quality; and is commonly used in the Australian stormwater industry by local councils and planning authorities as part of the development application/consent process.
In a bioretention setting, the non-conservative nature of some pollutants means that the actual removal rates are dependent on plant growth in a media that utilised and altered the forms present during the wetting and drying cycles over time. For example, nitrogen exists in several forms (see Figure 8).
The forms of nitrogen in soil (or filter media) are governed by several processes including inputs from runoff, microbial degradation, chemical transformation, wetting and drying patterns, and uptake of nutrients by plants [8,23]. As such, it is difficult to demonstrate the nitrogen removal performance based on the (short-term) column leaching experiments as shown in this study without some long-term continuous modelling approach as provided by MUSIC v6.
Table 9 summarises the treatment-train effectiveness as modelled in MUSIC v6.
The raingarden reduced flow by ~5%, TSS by ~98%, and gross pollutants by 100% for all the options (M165, DM1 and DMS). TP was reduced by 94%, 86%, and 80% for M165, DM1, and DMS respectively. The difference between all the options was the function of the initial orthophosphate concentration (as Colwell P) of the filter media that entered the model. The more orthophosphate contained in the filter media, the lower the percentage reduction. For example, M165 had an orthophosphate content of 11 mg/kg and had the highest reduction (94%) compared to DM1 (38 mg/kg) and DMS (45 mg/kg).
TN was reduced by 77%, 58%, and 52% for M165, DM1, and DMS respectively. The difference between all the options was a function of the initial TN concentration of the filter media that entered the model. The more TN contained in the filter media, the lower the percentage reduction. For example, M165 had a TN content of 235 mg/kg and had the highest reduction (77%) compared to DM1 (1624 mg/kg) and DMS (1745 mg/kg).
The relationship between the filter media TN, the orthophosphate content, and the treatment performance may be based on the erroneous assumption that the filter media with organic matter content ≥5% leached excessive nutrients; which this study has demonstrated not to be the case. So, how can DM1 and DMS be modelled in MUSIC v6 to provide equivalent treatment performance compared to M165?
From MUSIC v6:
“The selection of appropriate k and C* values for modelling the removal of total nitrogen cannot easily follow the procedure applied for TSS and TP. The composition of particulate and soluble forms of N in stormwater is highly varied. There is significantly smaller particulate fraction of TN compared with TP, and even that fraction is associated with organic particles which have significantly lower specific gravities than sediment. Calibrated k values for TN in wastewater systems indicate significantly lower values (as much as two orders of magnitude) compared with TP and TSS. The default k and C* values for TN are thus based on very limited data. There is an expectation that the k values are likely to be an order of magnitude lower than corresponding values for TP, and that the ratios of C* to inflow event mean concentration (EMC) are likely to be higher for TN than for TP.”
K and C* are used to represent a first order reaction kinetic in continuously stirred reactors (CSR’s) and depend on factors such as density and particle size distribution in a waterbody receiving runoff. This may be important for modelling detention ponds and wetlands, but the use of k and C* may not specifically apply to biofilters. For example, biofilters go through short periods of inundation and much longer periods of drying out, with the objective of not producing a water body post-event due to filtration.
The treatment performance of biofiltration in MUSIC v6 is governed by an extensive “lookup table” [20], which determines the outflow concentrations and/or removal rates for TSS, TP, and TN and considers all the important characteristics of the biofiltration system and its operating conditions. The “lookup tables” are based on extensive research and observations, however the M165 (sandy loam) has been the preferred choice in most of the research over the past 20 years.
Therefore, the nature of DM1 and DMS in comprising 50% and 65% “organic matter” with an initial leaching peak that rapidly subsided back to stable levels, means that the changes in k and C* need investigation. Selection of k and C* were based on the Biofiltration Systems (Table 5 in [20], “Appendix G: Selecting Appropriate k and C* Values”). A simple sensitivity analysis was undertaken on three scenarios (changes in k and C*) and are described in Table 10. The MUSIC v6 results (% reduction) are presented in Table 11.
The sensitivity analysis shows that M165 was relatively unchanged with significant changes in k and C* and is likely a function of the fact that most research, and development of the CRC Biofiltration Guidelines [9], have used sandy loam (M165) as the filter media. However, DM1 and DMS were highly sensitive to changes in k and C* with respect to TN (difference in treatment performance of 16.9% and 19% respectively). The results from this study have demonstrated that DM1 and DMS are comparable filter media to M165 in terms of leaching/pollutant removal and treatment performance, yet this performance was not captured in MUSIC v6.
Why? Sandy loam (M165) contains silt and clay that provides the cation exchange capacity that contributes to the attenuation of pollutants in a biofiltration system. The “engineered” filter media, DM1 and DMS, do not contain a significant silt/clay content, as the exchange capacity is provided by the recycled organic matter (higher ECEC, refer Table 2). Therefore, future research should look to develop a “lookup table” suited to the use of filter media, such as DM1 and DMS, by monitoring the flow and water quality (inflow and outflow) of “real-life” raingardens. However, through the historical development of the FAWB specification and the existing procurement processes, it is difficult to use/promote these materials in Australia as filter media in biofiltration devices. As DM1 and DMS behave similarly (or better) to the M165 with respect to nutrient leaching and pollutant removal, it makes sense to use similar “inputs” to MUSIC v6 for DM1 and DMS, i.e., the same values one would use for M165.
It must be noted that MUSIC v6 was not used for validation of the filter media in this study, but rather as a test of a tool which is commonly used for sizing biofilters in Australia. Design guidelines require that a new development must demonstrate a TSS, TP, and TN load reduction in runoff and MUSIC v6 was used for this purpose. However, if the results from the model underestimated the removal performance, then a larger biofilter would be required if a compost filter media were to be used. Apart from the historical development of the FAWB specification and existing procurement processes, a false assumption of the performance of organic filter media based on MUSIC v6 modelling will likely further deter local councils to use the compost-based filter media. Filter media created from the design configurations of recycled organic and mineral materials, such as DM1 and DMS, cannot accurately be represented by MUSIC v6. This further highlights how important the need is for further field studies of other types of alternative filter media.

4. Conclusions

This paper has characterised several materials (RO-fine, RO-medium, washed sand, and M165) and design mixes (DM1 and DMS) in terms of their physical and chemical profiles, demonstrated the leaching/pollutant removal behaviour of the same, compared the current CRC Guideline (FAWB) specification (sandy loam—M165) to DM1 and DMS for use in biofiltration, and investigated the performance of alternative filter media (DM1 and DMS) through MUSIC v6 modelling. The pollutant removal performance of DM1 and DMS, particularly for metals, is similar or greater than the industry FAWB specification (sandy loam—M165).
The CRC Water Sensitive Cities released their Adoption Guidelines for Stormwater Biofiltration Systems—Summary Report 2015 [9] containing Table 3, “Filter Media (top layer/growing media) Essential Specifications and Guidance”. The Guideline (Table 3) asserts in the “Essential Specifications” that exceeding ≤5% organic matter will lead to nutrient leaching. The results from this study demonstrated that filter media (from recycled organic and mineral materials) containing up to 65% compost (sourced predominantly from palm fronds) did not leach any more nutrients than soil. Previous research has also shown that different composts have different leaching properties, and this is likely a function of the what is in the compost [10,11]; therefore, characterising any organic/mineral based materials should be mandatory to ascertain the leaching risk before use in a commercial setting.
The industry model, MUSIC v6, appears to be sensitive to initial TN and orthophosphate inputs for treatment nodes, potentially underestimating the benefits of recycled organic and mineral materials as filter media. The results from this study indicate that “lookup tables” used for Biofiltration nodes in MUSIC v6 may not represent the true behaviour of FMs as demonstrated in this study; and the use of k and C* are not particularly relevant to biofilter systems (no permanent water body for receiving runoff). More data is required to develop “lookup tables” (in MUSIC v6) for engineered soils that provide equivalent treatment performance to the current specification (M165). The best way forward is to use actual case study sites and monitor their performance; and this will be the focus of future research. In contrast, MUSIC v6 inputs typically used for M165 could be used for both DM1 and DMS which would also provide comparable performance.
One observed issue with long-term commercial based research (such as CRC for Water Sensitive Cities) is that many alternatives within the industry can be excluded if they don’t “fit” the specification developed by the research over decades. Over decades, the uptake of specifications and models by the local government has driven the procurement process to the FAWB specification (sandy loam), but we are running out of this resource and alternatives must be promoted. This is the case in Australia where, despite billions of dollars investment in recycling urban waste, the recycled organic and mineral materials presented in this paper have effectively been excluded by local government due to claims of excessive leaching and other negative impacts. These are erroneous claims if the recycled organic and mineral materials can be demonstrated to be similar to the FAWB specification or are benign to any receiving waters. The recent guidelines on the use of organic material as biofilter media are now available in Australia [24], which may assist in development of similar standards elsewhere.
The recent acknowledgment by the CRC Water Sensitive Cities that suitable alternatives can be used provided they meet a verified performance-based requirement of addressing essential operational performance related to sustained acceptable infiltration rate, integrity of the surface vegetation community of the system, and with acceptably low or no leaching from the biofiltration media; means that both DM1 and DMS can be considered suitable alternatives to using virgin resources (M165, sandy loam soil) in biofiltration systems. The recycled organic and mineral material alternatives can offer both a significant reuse industry whilst reducing our demand for virgin sandy loam soils and need for landfill sites.

Author Contributions

S.A.L.: investigation, methodology, software modelling, formal analysis and writing of this paper; C.C.L.: writing—original draft preparation and review; E.L.: data curation, funding acquisition, writing—review and editing.

Funding

The research was funded by the Department of Industry, Innovation and Science (Australian Commonwealth), The University of Newcastle grant number G1600480, under the Innovation Connections Scheme.

Acknowledgments

The authors would like to thank the School of Environmental & Life Sciences (The University of Newcastle) for providing the laboratory space required and for technical support during this study; and the extremely helpful comments and suggestions from the anonymous reviewers from Water.

Conflicts of Interest

The authors declare no conflict of interest.

References

  1. Gertsakis, J.; Lewis, H. Sustainability and the Waste Management Hierachy–A Discussion Paper; EcoRecycle Victoria: Melbourne, Australia, 2003.
  2. Alexander, R. Compost: The Sustainable Solution. MSW Manag. 2016, 20. [Google Scholar] [CrossRef]
  3. Lou, X.F.; Nair, J. The impact of landfilling and compost on greenhouse gas emissions—A review. Bioresour. Technol. 2009, 100, 3792–3798. [Google Scholar] [CrossRef] [PubMed]
  4. Lucas, S.; Lee, C.C.; Love, E. The Performance of Recycled Organic and Mineral Materials as Reactive Filter Media. In Proceedings of the ICSWHK 2015–2nd International Conference on Solid Waste 2015: Innovation in Technology and Management, Hong Kong, China, 19–23 May 2015. [Google Scholar]
  5. Said-Pullicino, D.; Massaccesi, L.; Dixon, L.; Bol, R.; Gigliotti, G. Organic matter dynamics in a compost-amended anthropogenic landfill capping-soil. Eur. J. Soil Sci. 2010, 61, 35–47. [Google Scholar] [CrossRef]
  6. Xie, S.; O’Dwyer, T.; Freguia, S.; Pikaar, I.; Clarke, W.P. Effect of biomass concentration on methane oxidation activity using mature compost and graphite granules as substrata. Waste Manag. 2016, 56, 290–297. [Google Scholar] [CrossRef]
  7. Oldeman, L.R. The Global Extent of Soil Degradation. In Soil Resilience and Sustainable Land Use; Szabolcs, I., Ed.; CAB International: Oxon, UK, 1994; p. 115. [Google Scholar]
  8. Hazelton, P.; Murphy, B. Interpreting Soil Test Results: What Do All the Numbers Mean? NSW Department of Natural Resources, CSIRO Publishing: Clayton, Australia, 2007; ISBN 0 643 09225 0.
  9. Payne, E.G.I.; Hatt, B.E.; Deletic, A.; Dobbie, M.F.; McCarthy, D.T.; Chandrasena, G.I. Adoption Guidelines for Stormwater Biofiltration Systems-Summary Report; Cooperative Research Centre for Water Sensitive Cities: Melbourne, Australia, 2015. [Google Scholar]
  10. Davis, A.P.; Hunt, W.; Traver, R.; Clar, M. Bioretention technology: Overview of current practice and future needs. J. Environ. Eng. 2009, 135, 109–117. [Google Scholar] [CrossRef]
  11. Liu, J.; Sample, D.J.; Bell, C.; Guan, Y. Review and Research Needs of Bioretention Used for the Treatment of Urban Stormwater. Water 2014, 6, 1069–1099. [Google Scholar] [CrossRef] [Green Version]
  12. Palmer, E.T.; Poor, C.J.; Hinman, C.; Stark, J.D. Nitrate and phosphate removal through enhanced Bioretention media: Mesocosm study. Water Environ. Res. 2013, 85, 823–832. [Google Scholar] [CrossRef]
  13. Jones, P.S.; Davis, A.P. Spatial accumulation and strength of affiliation of heavy metals in Bioretention media. J. Environ. Eng. 2013, 139, 479–487. [Google Scholar] [CrossRef]
  14. Lim, H.S.; Lim, W.; Hu, J.Y.; Ziegler, A.; Ong, S.L. Comparison of filter media materials for heavy metal removal from urban stormwater runoff using biofiltration systems. J. Environ. Manag. 2015, 147, 24–33. [Google Scholar] [CrossRef] [PubMed]
  15. Li, H.; Davis, A.P. Heavy metal capture and accumulation in bioretention media. Environ. Sci. Technol. 2008, 42, 5247–5253. [Google Scholar] [CrossRef] [PubMed]
  16. Hatt, B.E.; Steinel, A.; Deletic, A.; Fletcher, T.D. Retention of heavy metals by stormwater filtration systems: Breakthrough analysis. Water Sci. Technol. 2011, 64, 1913–1919. [Google Scholar] [CrossRef] [PubMed]
  17. Hsieh, C.-H.; Davis, A.P. Evaluation and optimization of Bioretention media for treatment of urban storm water runoff. J. Environ. Eng. 2005, 131, 1521–1531. [Google Scholar] [CrossRef]
  18. Roy-Poirier, A.; Champagne, P.; Filion, Y. Bioretention processes for phosphorus pollution control. Environ. Rev. 2010, 18, 159–173. [Google Scholar] [CrossRef]
  19. Hunt, W.; Jarrett, A.; Smith, J.; Sharkey, L. Evaluating Bioretention hydrology and nutrient removal at three field sites in North Carolina. J. Irrig. Drain. Eng. 2006, 132, 600–608. [Google Scholar] [CrossRef]
  20. eWater Model for Urban Stormwater Improvement Conceptualisation (MUSIC v6). Available online: http://ewater.org.au/products/music/ (accessed on 21 November 2016).
  21. APHA. Standard Methods for the Examination of Water and Wastewater, 21st ed.; American Public Health Association/American Water Works Association/Water Environment Federation: Washington, DC, USA, 2005. [Google Scholar]
  22. ANZECC. Australian and New Zealand Guidelines for Fresh and Marine Water Quality-Volume 1; Australia and New Zealand Environment and Conservation Council (ANZECC) and the Agriculture and Resource Management Council of Australia and New Zealand (ARMCANZ): Canberra, Australia, 2000; ISBN 09578245 0 5.
  23. Rayment, G.E.; Lyon, D.J. Soil Chemical Methods–Australasia, Australian Soil and Land Survey Handbook Series; CSIRO Publishing: Clayton, Australia, 2010; ISBN 9780643067684. [Google Scholar]
  24. CORE. Performance & Validation Standards for Organic Bio-Filtration Media, CORE Standard CS-1510-18, CORE Water Division, a Report for the EPA NSW by the Centre for Organic Research and Education (CORE); CORE: North Sydney, Australia, 2018. [Google Scholar]
  25. Engineers Australia. Australian Runoff Quality (ARQ); Wong, T., Ed.; Engineers Australia: Melbourne, Australia, 2006; ISBN 0 85825 860 9. [Google Scholar]
  26. EPA. Soil Hazard Categorisation and Management, Industrial Waste Resource Guidelines; Environment Protection Agency-Victoria: Carlton, Australia, 2009; Publication IWRG621.
Figure 1. Particle size distribution of raw materials used in this study, (a) RO-fine, (b) RO-medium, (c) Biochar, (d) CaCO3, (e) Washed sand, and (f) FAWB specification (M165).
Water 11 01074 g001
Figure 2. Particle size distribution of the design mix configurations, (a) DM1 and (b) DMS.
Water 11 01074 g002
Figure 3. Setup for the column leaching tests (note the improving clarity of the eluted samples).
Water 11 01074 g003
Figure 4. Setup in MUSIC v6 and the properties of the Bioretention Node (raingarden). Source—Screensnip from MUSIC v6.
Water 11 01074 g004aWater 11 01074 g004b
Figure 5. The Bioretention Node parameters used in MUSIC v6. Source: User guideline for MUSIC v6.
Water 11 01074 g005
Figure 6. Change in EC based on applied volume.
Water 11 01074 g006
Figure 7. Change in pH based on applied volume.
Water 11 01074 g007
Figure 8. Nitrogen cycle.
Water 11 01074 g008
Table 1. Organic and mineral materials used in this study.
MaterialType
Recycled Organics (RO-fine)Organic
Recycled Organics (RO-medium)Organic
BiocharOrganic
Calcium Carbonate (CaCO3)Mineral
Washed SandMineral
FAWB specification (sandy loam—M165)Mineral (with <5% organic matter)
Table 2. Design mix configurations for DM1 and DMS (% composition by volume).
Design MixROSandM165CaCO3Biochar
DM1403015510
DMS50350015
Table 3. Biofiltration properties used in MUSIC v6.
PropertiesM165DM1DMS
Low Flow by-pass (m3)000
High Flow by-pass (m3)100100100
Extended Detention depth (m)0.20.20.2
Surface Area (m2)100100100
Filter Area (m2)888888
Unlined Filter Media (m)141414
Saturated Hydraulic Conductivity (mm/h)300300300
Filter Depth (m)0.40.40.4
TN Content of Filter Media (mg/kg)23516241745
Orthophosphate Content of Filter Media (mg/kg)113845
Exfiltration Rate (mm/h)000
Table 4. All chemical/physical data for organic materials (RO-fine, RO-medium and biochar), washed sand, M165 (sandy loam), and the design mix configurations (DM1 and DMS).
Test ParameterMethod DescriptionMethod ReferenceUnitsRO FineRO MediumBiocharWashed SandM165DM1DMS
pH (1:5 in H20)ElectrodeR&L 4A2pH units7.767.879.237.726.808.297.74
pH (1:5 in CaCl2)ElectrodeR&L4B2pH units7.187.318.156.746.387.457.28
Chloride SolubleElectrodePMS-05mg/kg2810303015854.6212310362
Electrical ConductivityElectrodeR&L 3A1dS/m1.932.11.860.020.30.540.36
Total N (LECO)LECOR&L 7A5mg/kg13,35014,59068708223516241745
Extractable Nitrate-NH20/UV-VisPMS-08mg/kg50.752.92.344.44.28109.4
Organic Carbon (LECO)LECOR&L 6B3%3236.55.90.110.43.112.01
Total Carbon (LECO)LECOR&L 6B2a%31.736.961.10.120.364.885.27
Phosphorus (Colwell)Bicarb/UV-VisR&L 9B1mg/kg31632299.37.7210.945.238
Sulphate-SulphurKCl40/ICPR&L 10D1mg/kg14478.791.23.1911531.213.6
Extractable CopperDTPA/ICPR&L 12A1mg/kg0.29<0.20.590.20.410.970.67
Extractable ZincDTPA/ICPR&L 12A1mg/kg3.471.661.460.252.063.634.5
Extractable ManganeseDTPA/ICPR&L 12A1mg/kg6.984.862.4<0.50.573.686.89
Extractable IronDTPA/ICPR&L 12A1mg/kg6.526.054.917.719.515.930.3
Extractable BoronHot CaCl2/ICPR&L 12C2mg/kg3.13.681.650.140.381.811.15
Exchangeable PotassiumNH4Cl/ICPR&L 15A1mg/kg73867949253410161850723
Exchangeable CalciumNH4Cl/ICPR&L 15A1mg/kg84488380368021043521942226
Exchangeable MagnesiumNH4Cl/ICPR&L 15A1mg/kg1151119712418.473.4161255
Exchangeable SodiumNH4Cl/ICPR&L 15A1mg/kg45248314219.288.9101249
Exchangeable AluminiumKCl/ICPR&L 15G1mg/kg0.70.6<0.53.5511.80.810.65
Exchangeable PotassiumCalculationPMS-15A1Cmol/kg18.920.46.50.00.42.21.9
Exchangeable CalciumCalculationPMS-15A1Cmol/kg42.241.918.41.12.211.011.1
Exchangeable MagnesiumCalculationPMS-15A1Cmol/kg9.610.01.00.20.61.32.1
Exchangeable SodiumCalculationPMS-15A1Cmol/kg2.02.10.60.10.40.41.1
Exchangeable AluminiumCalculationR&L 15J1Cmol/kg0.00.00.00.00.10.00.0
Effective Cation Exchange Capacity (ECEC)CalculationPMS-15A1Cmol/kg72.774.426.51.43.714.916.2
Ca/Mg RatioCalculationPMS-15A1Cmol/kg4.44.217.86.83.68.25.2
K/Mg RatioCalculationPMS-15A1Cmol/kg2.02.06.30.20.71.60.9
Air-dried Moisture UoN%28339281013
Moisture Holding Capacity UoN%66625219223333
Bulk density UoNkg/m35505502101520118011001100
Saturated Hydraulic Conductivity (Ksat)CalculationUoNmm/hr72014001052100840840840
Table 5. Pollutant removal where stormwater used as influent to column experiments.
UnitsStorm Water1RO FineRO MediumStorm Water2M165Coarse SandDM1DMSANZECC Trigger Value (AE)ARQ (2006)
pH-7.57.77.67.57.47.57.57.66.5–86.2–7.6
ECµS/cm655670670915915900925935125–2200-
DOmg/L8.539.089.258.648.999.119.049.06>6.5-
TKNmg/L0.50.80.80.82.20.80.81--
TONmg/L0.340.270.160.260.210.260.210.220.04-
TNmg/L0.841.070.961.062.411.061.011.220.51.5–6
PO43-mg/L0.050.310.22<0.05<0.05<0.05<0.05<0.050.02-
TPmg/L0.10.380.340.10.120.080.160.180.050.15–0.7
TurbidityNTU20172791210986–5050–350 *
Cuµg/L4.9992.7284218221.418–150
Znµg/L6438492.7264119173180–700
TOCmg/L6.410.210.47.697.78.58.9-13–45
TOGmg/L<2<2<2<2<2<2<2<2-3–16
* based on TSS.
Table 6. Metal removal from stormwater.
Inflow (µg/L)After Elution (µg/L)% Reduction
StormwaterM165DM1DMSM165DM1DMS
Cu1624.27.26.4979696
Pb0.40.4<0.2<0.20>50>50
Zn1381754889697
Table 7. Metals in materials after 7 L of runoff.
M165DM1DMSIWRG (Upper Limit—Fill Material)
Cumg/kg4.27.26.4<100
Pbmg/kg0.4<0.2<0.2<300
Znmg/kg1754<200
Table 8. Summary of important parameters for raingarden filter media (based on Adoption Guidelines for Stormwater Biofiltration Systems—Summary Report [9].
ParameterCRC Guideline ObjectiveRO FineRO MediumBiocharWashed SandM165DM1DMS
MaterialEngineered soil/sandNANANA
Hydraulic Conductivity100–300 mm/h
Clay & Silt content<3%
Grading of particles0.05–3.4 mmNANANA
Nutrient contentTN > 1000 mg/kg13,35014,59068708223516241745
Extractable Nitrate (no limit?)50.752.92.344.44.28109.4
Available P (Colwell) < 80 mg/kg316322998114538
Organic matter≤5%1001001000.10.45065
Organic carbonNo data3236.55.90.10.43.112.01
Total carbonNo data3236.961.10.10.44.885.27
pH5.5–7.57.767.879.237.726.808.297.74
Electrical conductivity<1.2 dS/m1.932.11.860.020.30.540.36
Horticultural suitabilityTo be assessed by horticulturalistNANANANA
Particle size distributionFine sand (10–30%)NANANA
Depth400–600 cmNANANA
Once-off nutrient ameliorationAdded to upper 10 cmNANANAYesYesNoNo
Submerged zoneHigh HC or shallow depthNANANA
Table 9. Treatment-train effectiveness as modelled in MUSIC v6.
M165SourcesResidual Load% Reduction
Flow (ML/year)1.961.865
Total Suspended Solids (kg/year)3999.6998
Total Phosphorous (kg/year)0.8050.05194
Total Nitrogen (kg/year)5.661.2977
Gross Pollutants (kg/year)53.60100
DM1SourcesResidual Load% Reduction
Flow (ML/year)1.961.865
Total Suspended Solids (kg/year)4009.6998
Total Phosphorous (kg/year)0.8120.11286
Total Nitrogen (kg/year)5.642.3758
Gross Pollutants (kg/year)53.60100
DMSSourcesResidual Load% Reduction
Flow (ML/year)1.961.855
Total Suspended Solids (kg/year)4009.6398
Total Phosphorous (kg/year)0.8120.05180
Total Nitrogen (kg/year)5.641.2952
Gross Pollutants (kg/year)53.60100
Table 10. Changing k and C* in MUSIC v6 (sensitivity analysis inputs).
Bioretention TSS
k
C*TP
k
C*TN
k
C*
LOWmg/kg40001030000.082501.1
Defaultmg/kg80002060000.135001.4
HIGHmg/kg15,0003012,0000.1810001.7
Table 11. Results (as %) from changing k and C* in MUSIC v6 (sensitivity analysis).
M165LOWDefaultHighDifference
Flow5.35.35.30
Total Suspended Solids 94.595.896.52
Total Phosphorous9090.590.60.6
Total Nitrogen72.372.773.10.8
Gross Pollutants1001001000
DM1LOWDefaultHighDifference
Flow5.35.35.30
Total Suspended Solids 94.695.695.50.9
Total Phosphorous83.484.1862.6
Total Nitrogen52.655.569.516.9
Gross Pollutants1001001000
DMSLOWDefaultHighDifference
Flow 5.35.35.30
Total Suspended Solids 94.295.395.61.4
Total Phosphorous77.377.979.72.4
Total Nitrogen47.650.266.619
Gross Pollutants1001001000

