Effects of Urban Forms on Separate Drainage Systems: A Virtual City Perspective


Abstract
1. Introduction
2. Materials and Methods
2.1. Virtual City Design
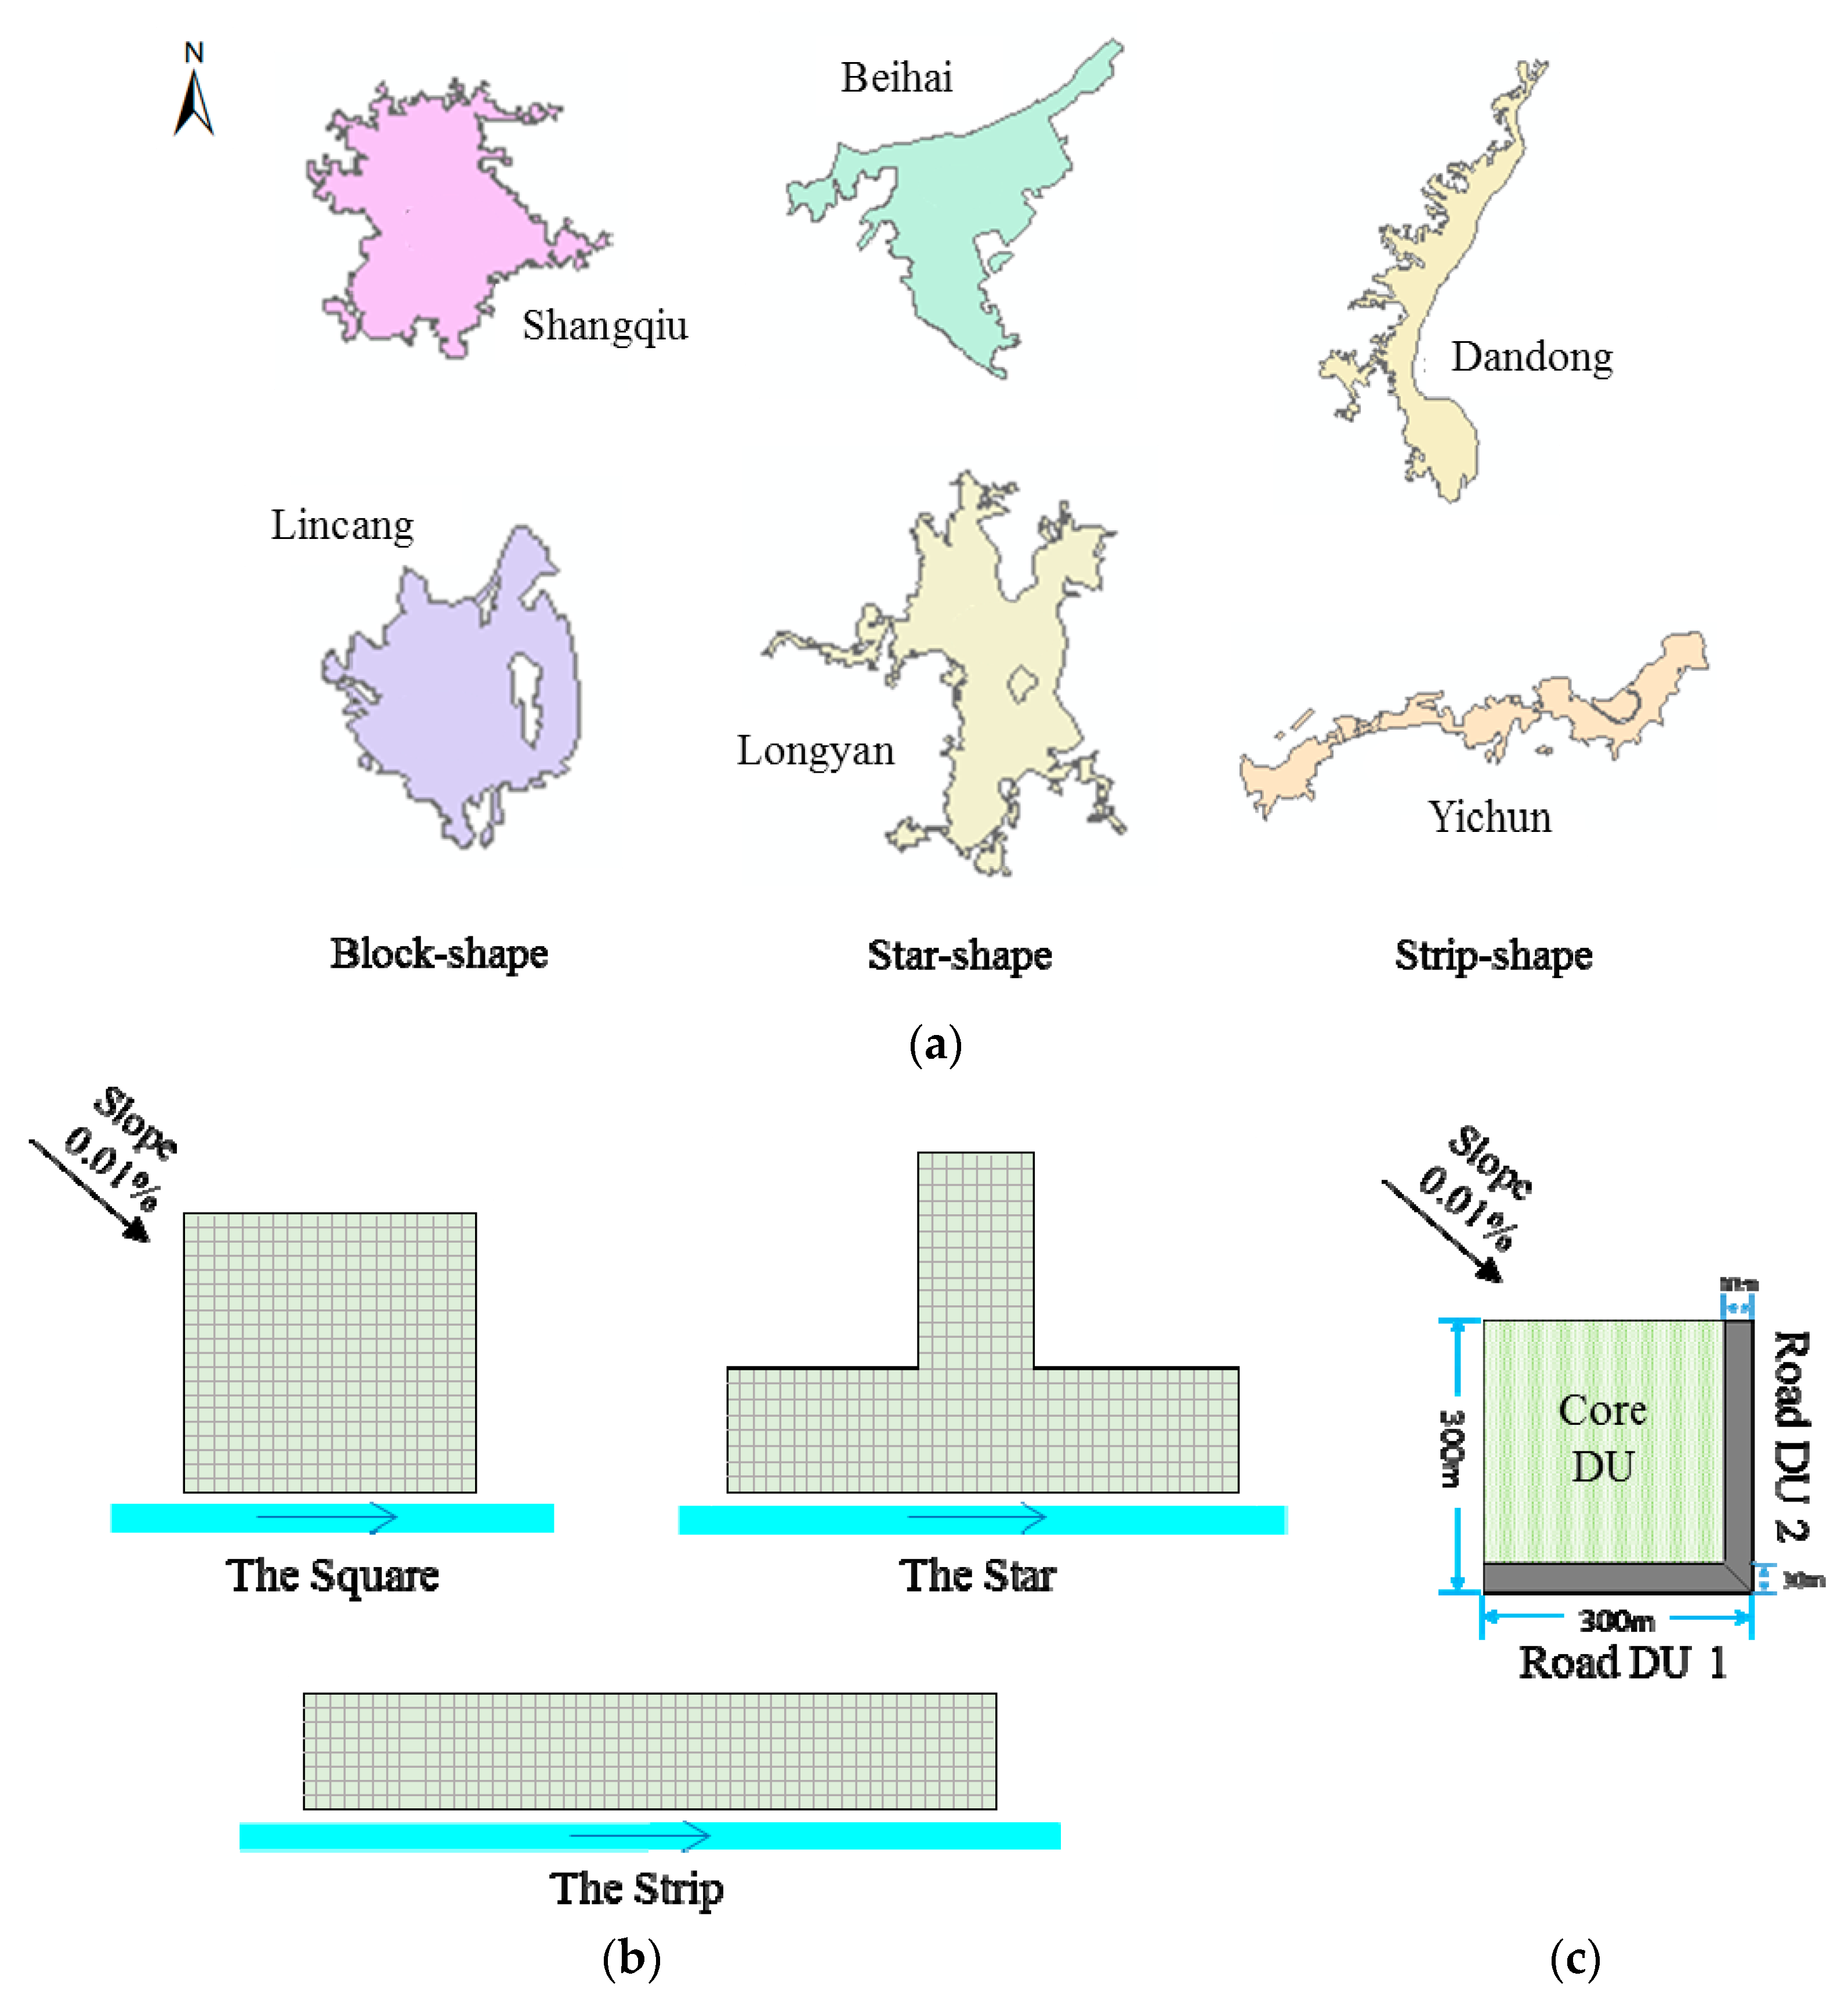
2.1.1. Forms of the Virtual Cities
2.1.2. Scale and Natural Conditions of the Virtual Cities
2.1.3. Blocks and Drainage Units
2.2. Drainage System Generation and Performance Simulation
2.3. Evaluation of Drainage System Performance
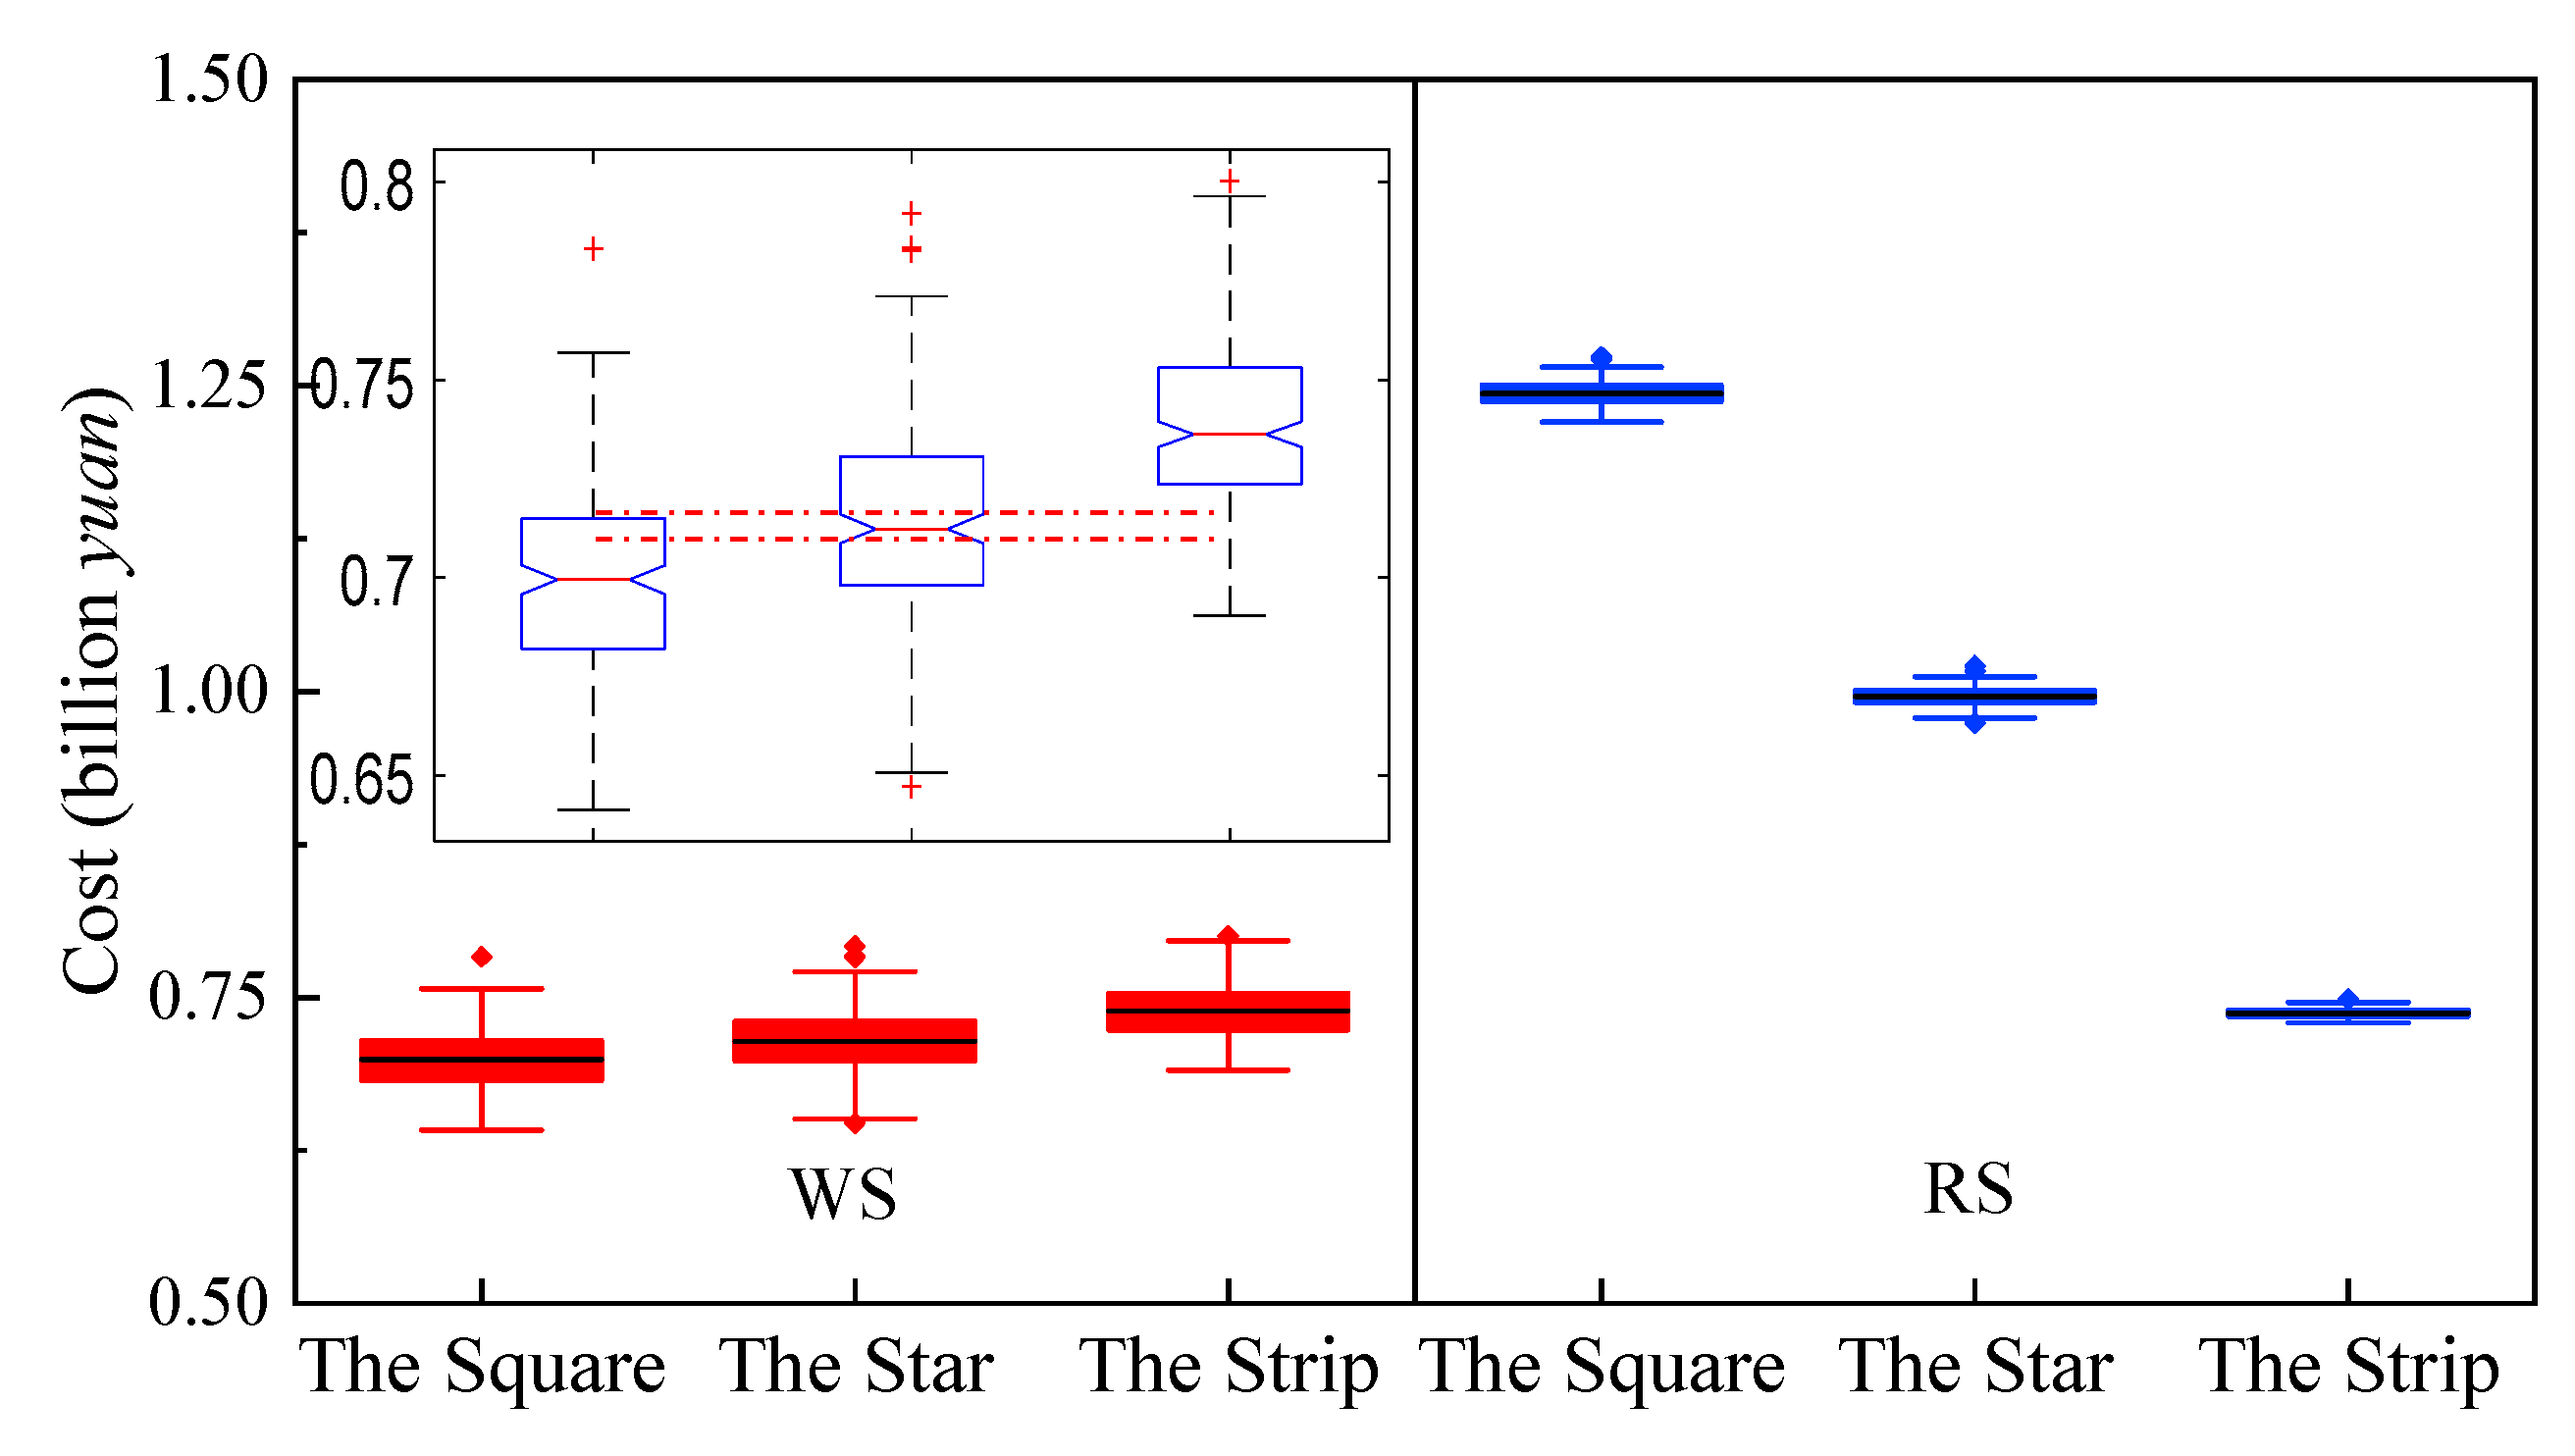
2.3.1. Economic Efficiency
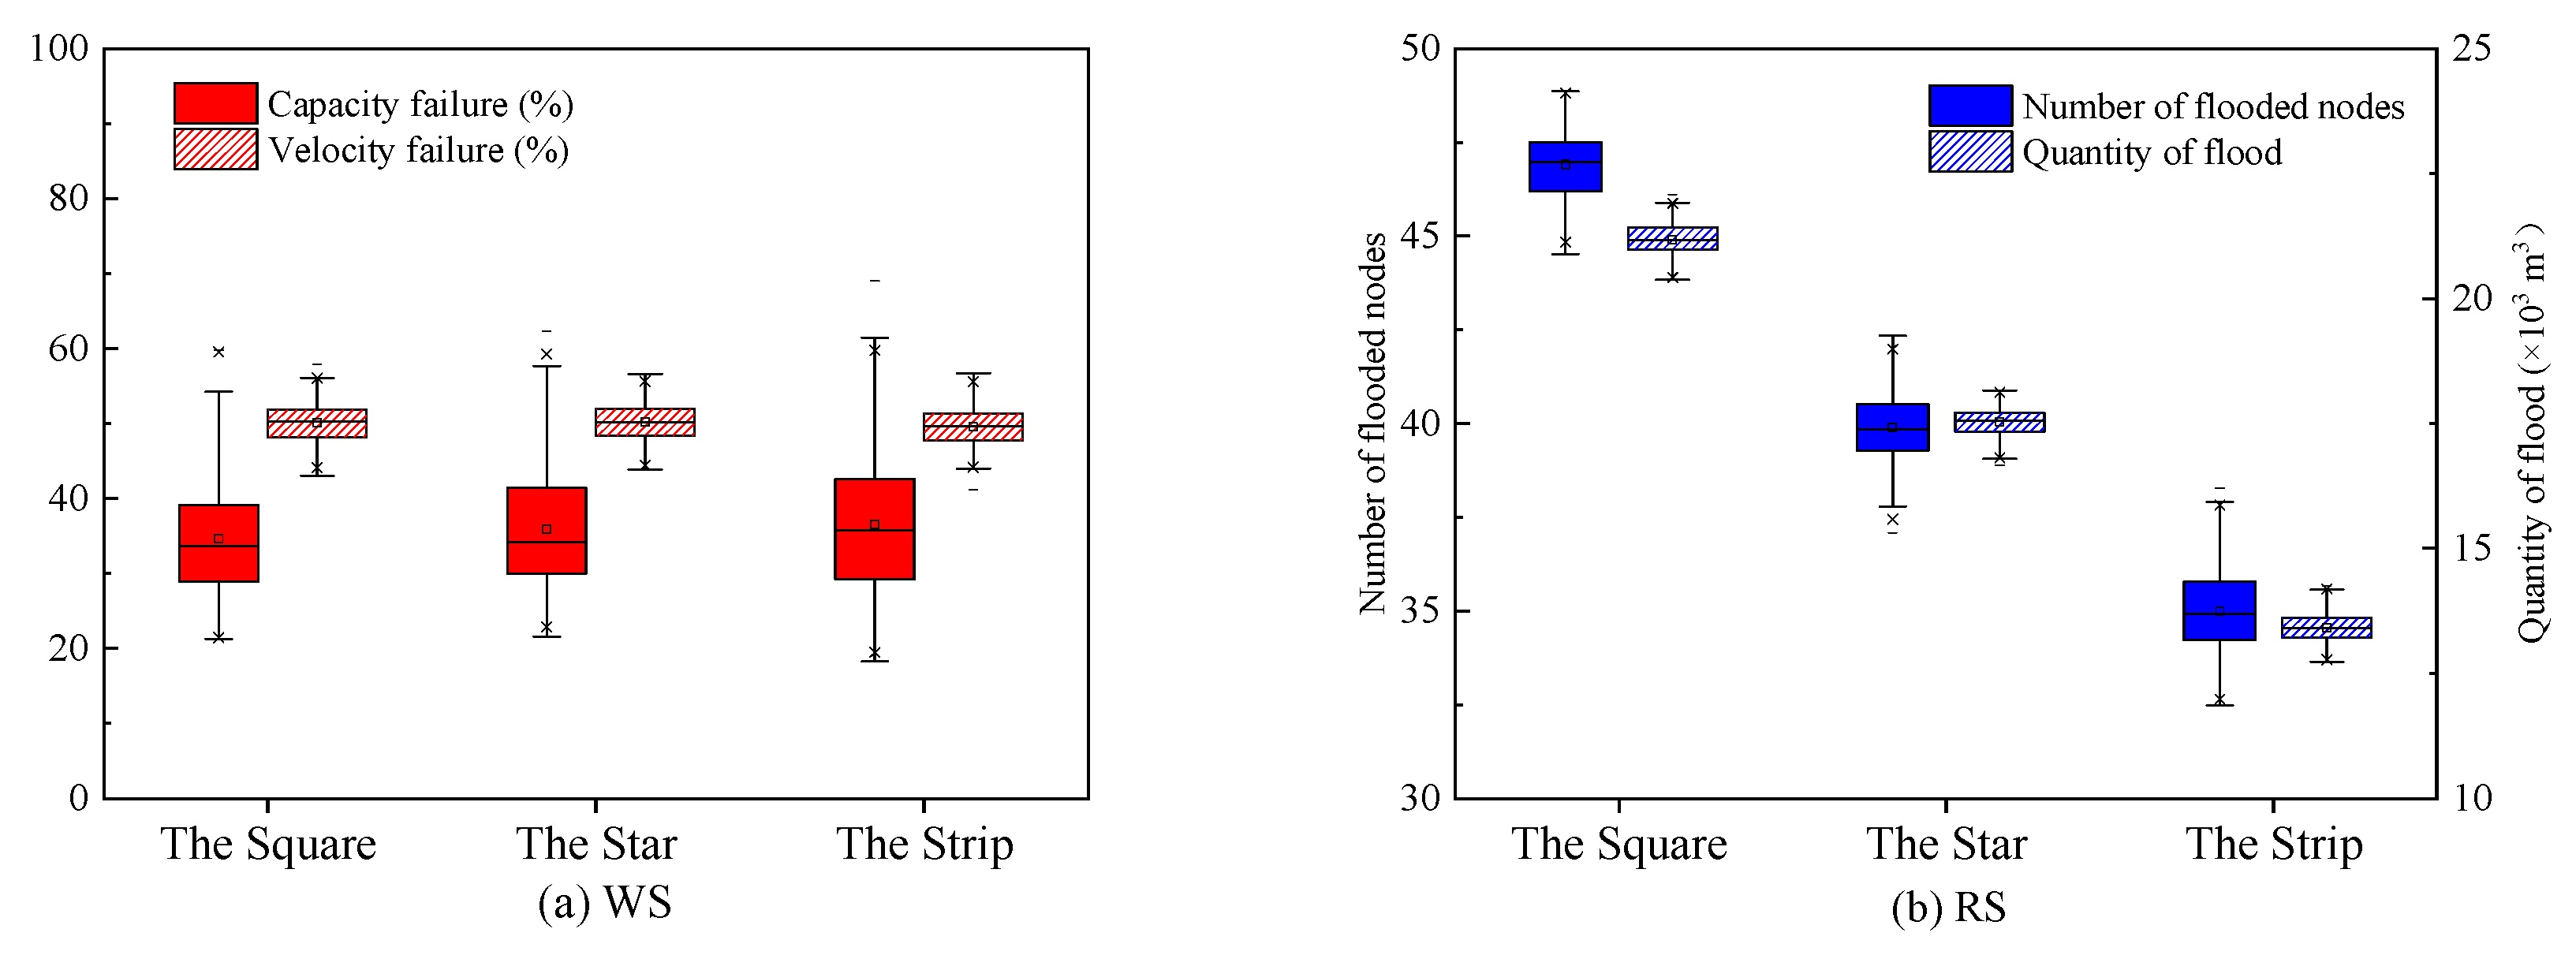
2.3.2. Effectiveness
2.3.3. Adaptability
3. Results and Discussion
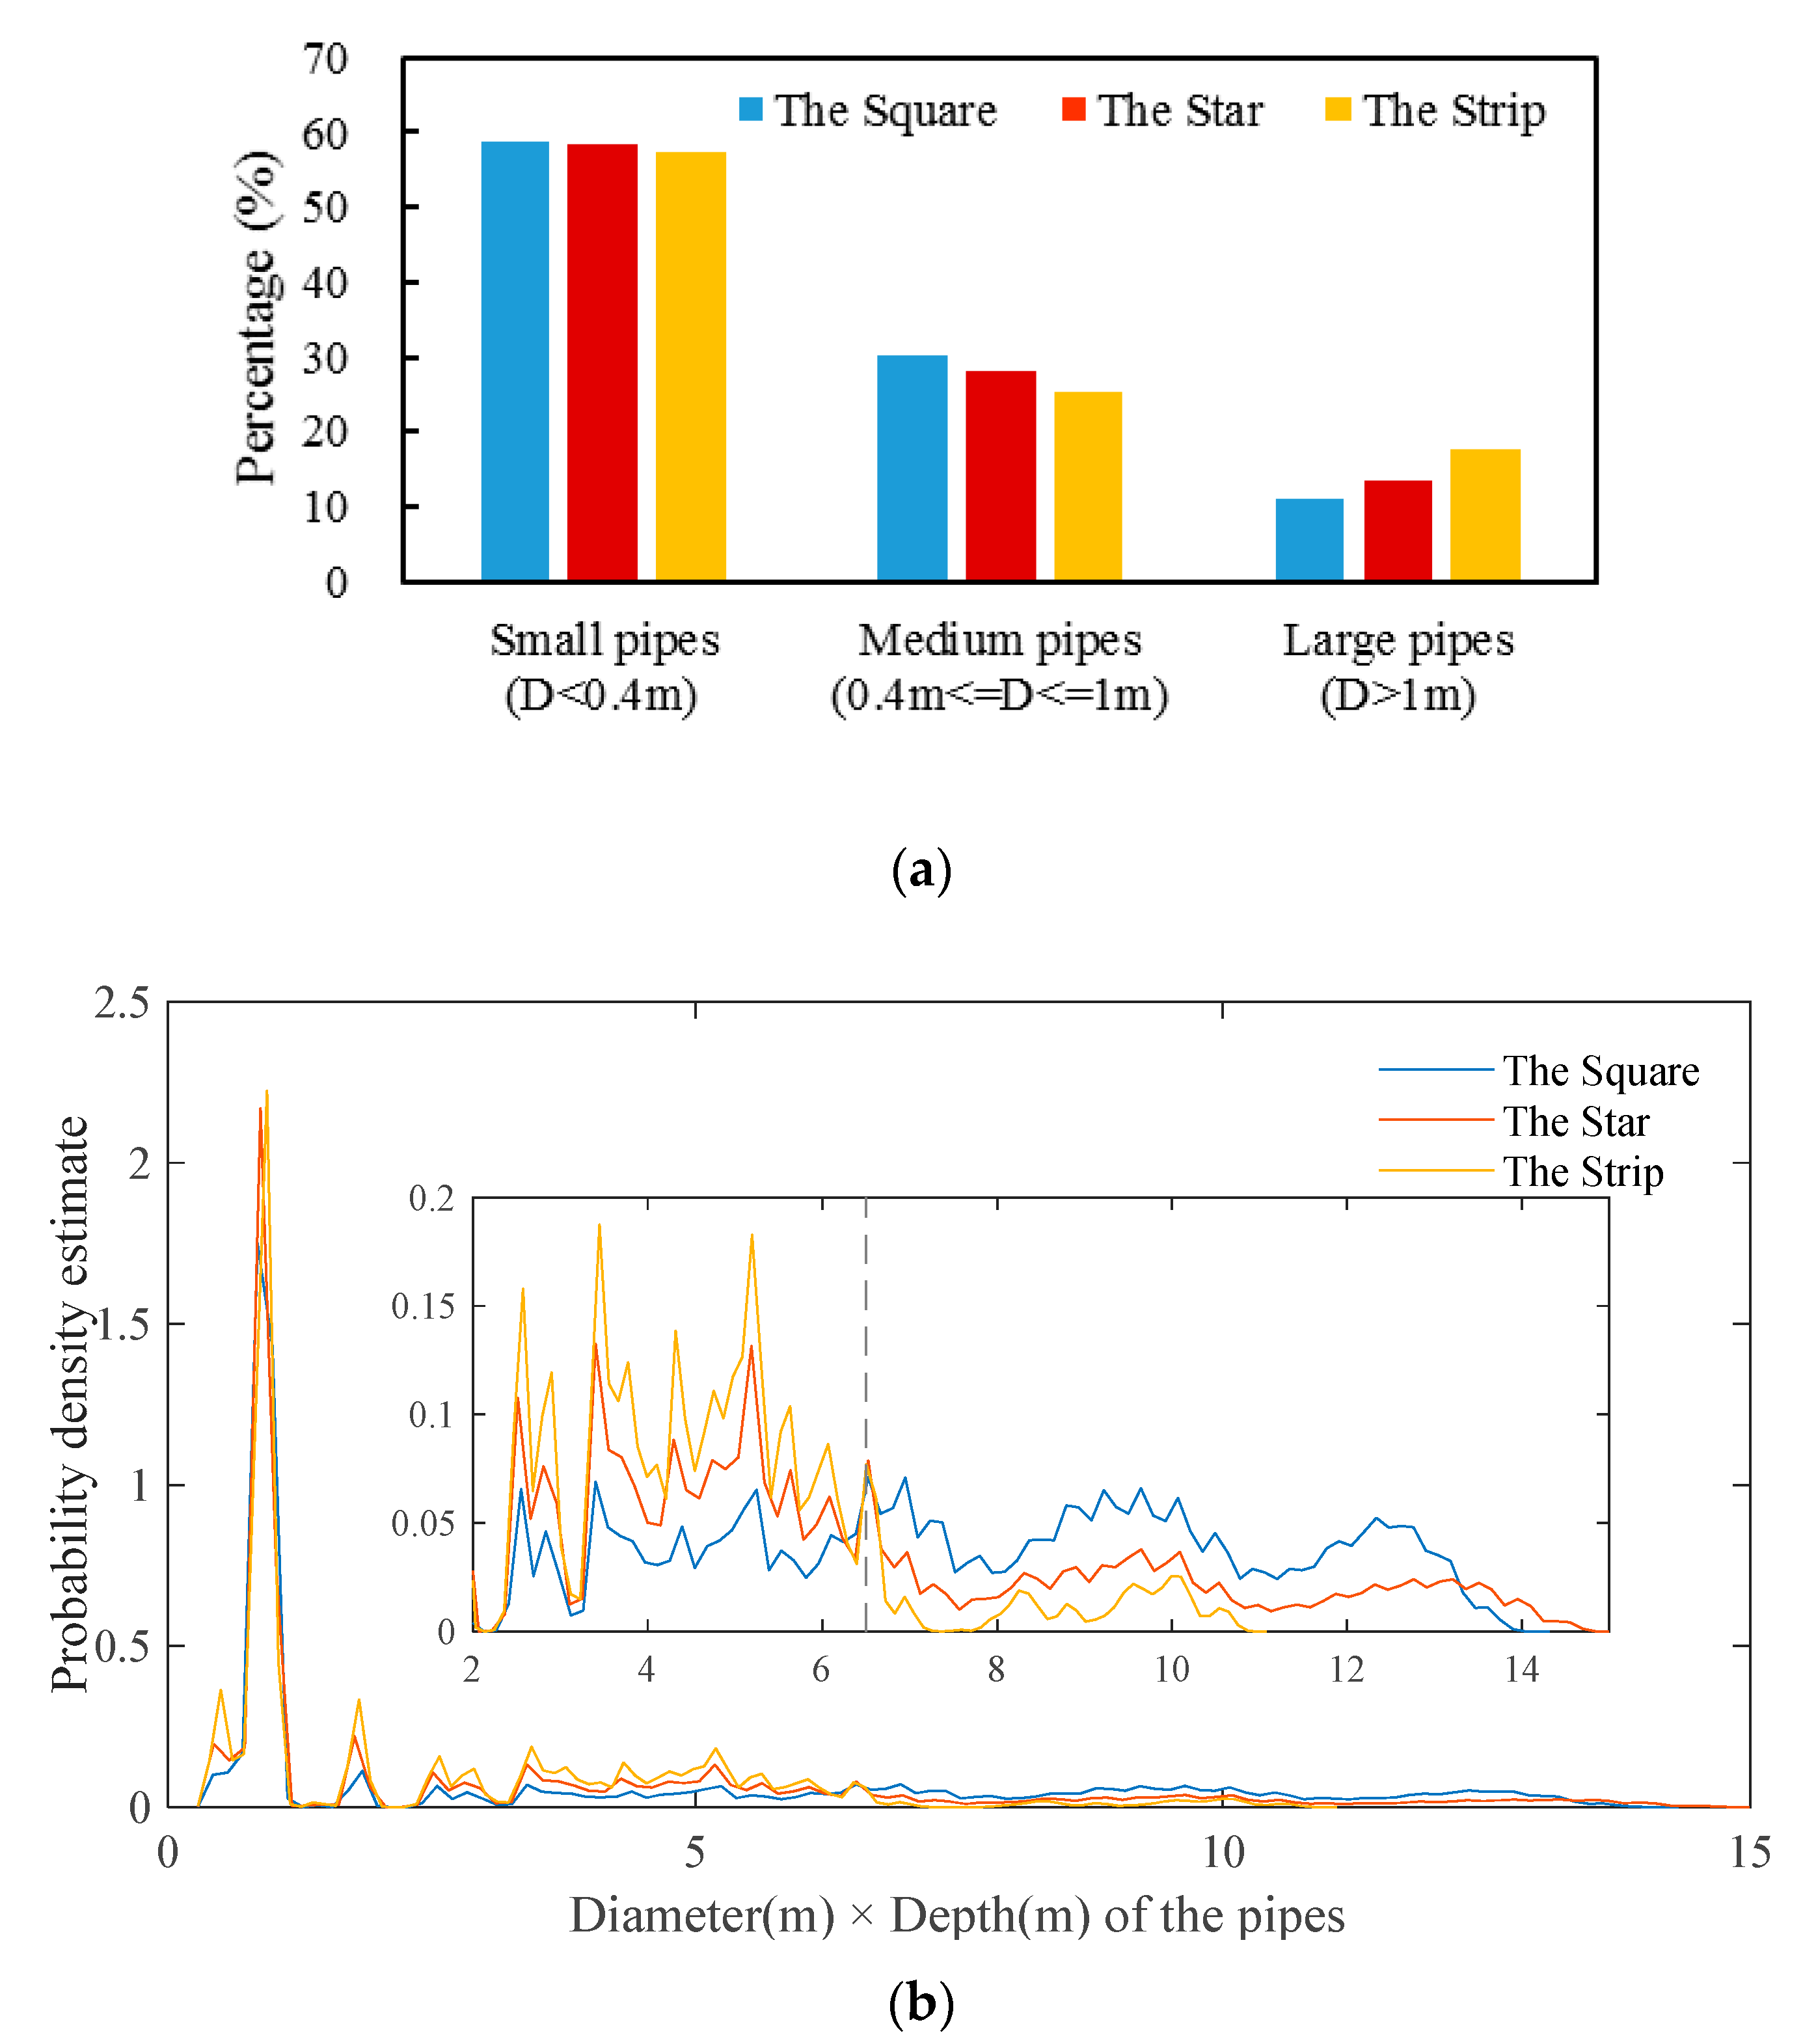
3.1. Structure and Economic Efficiency
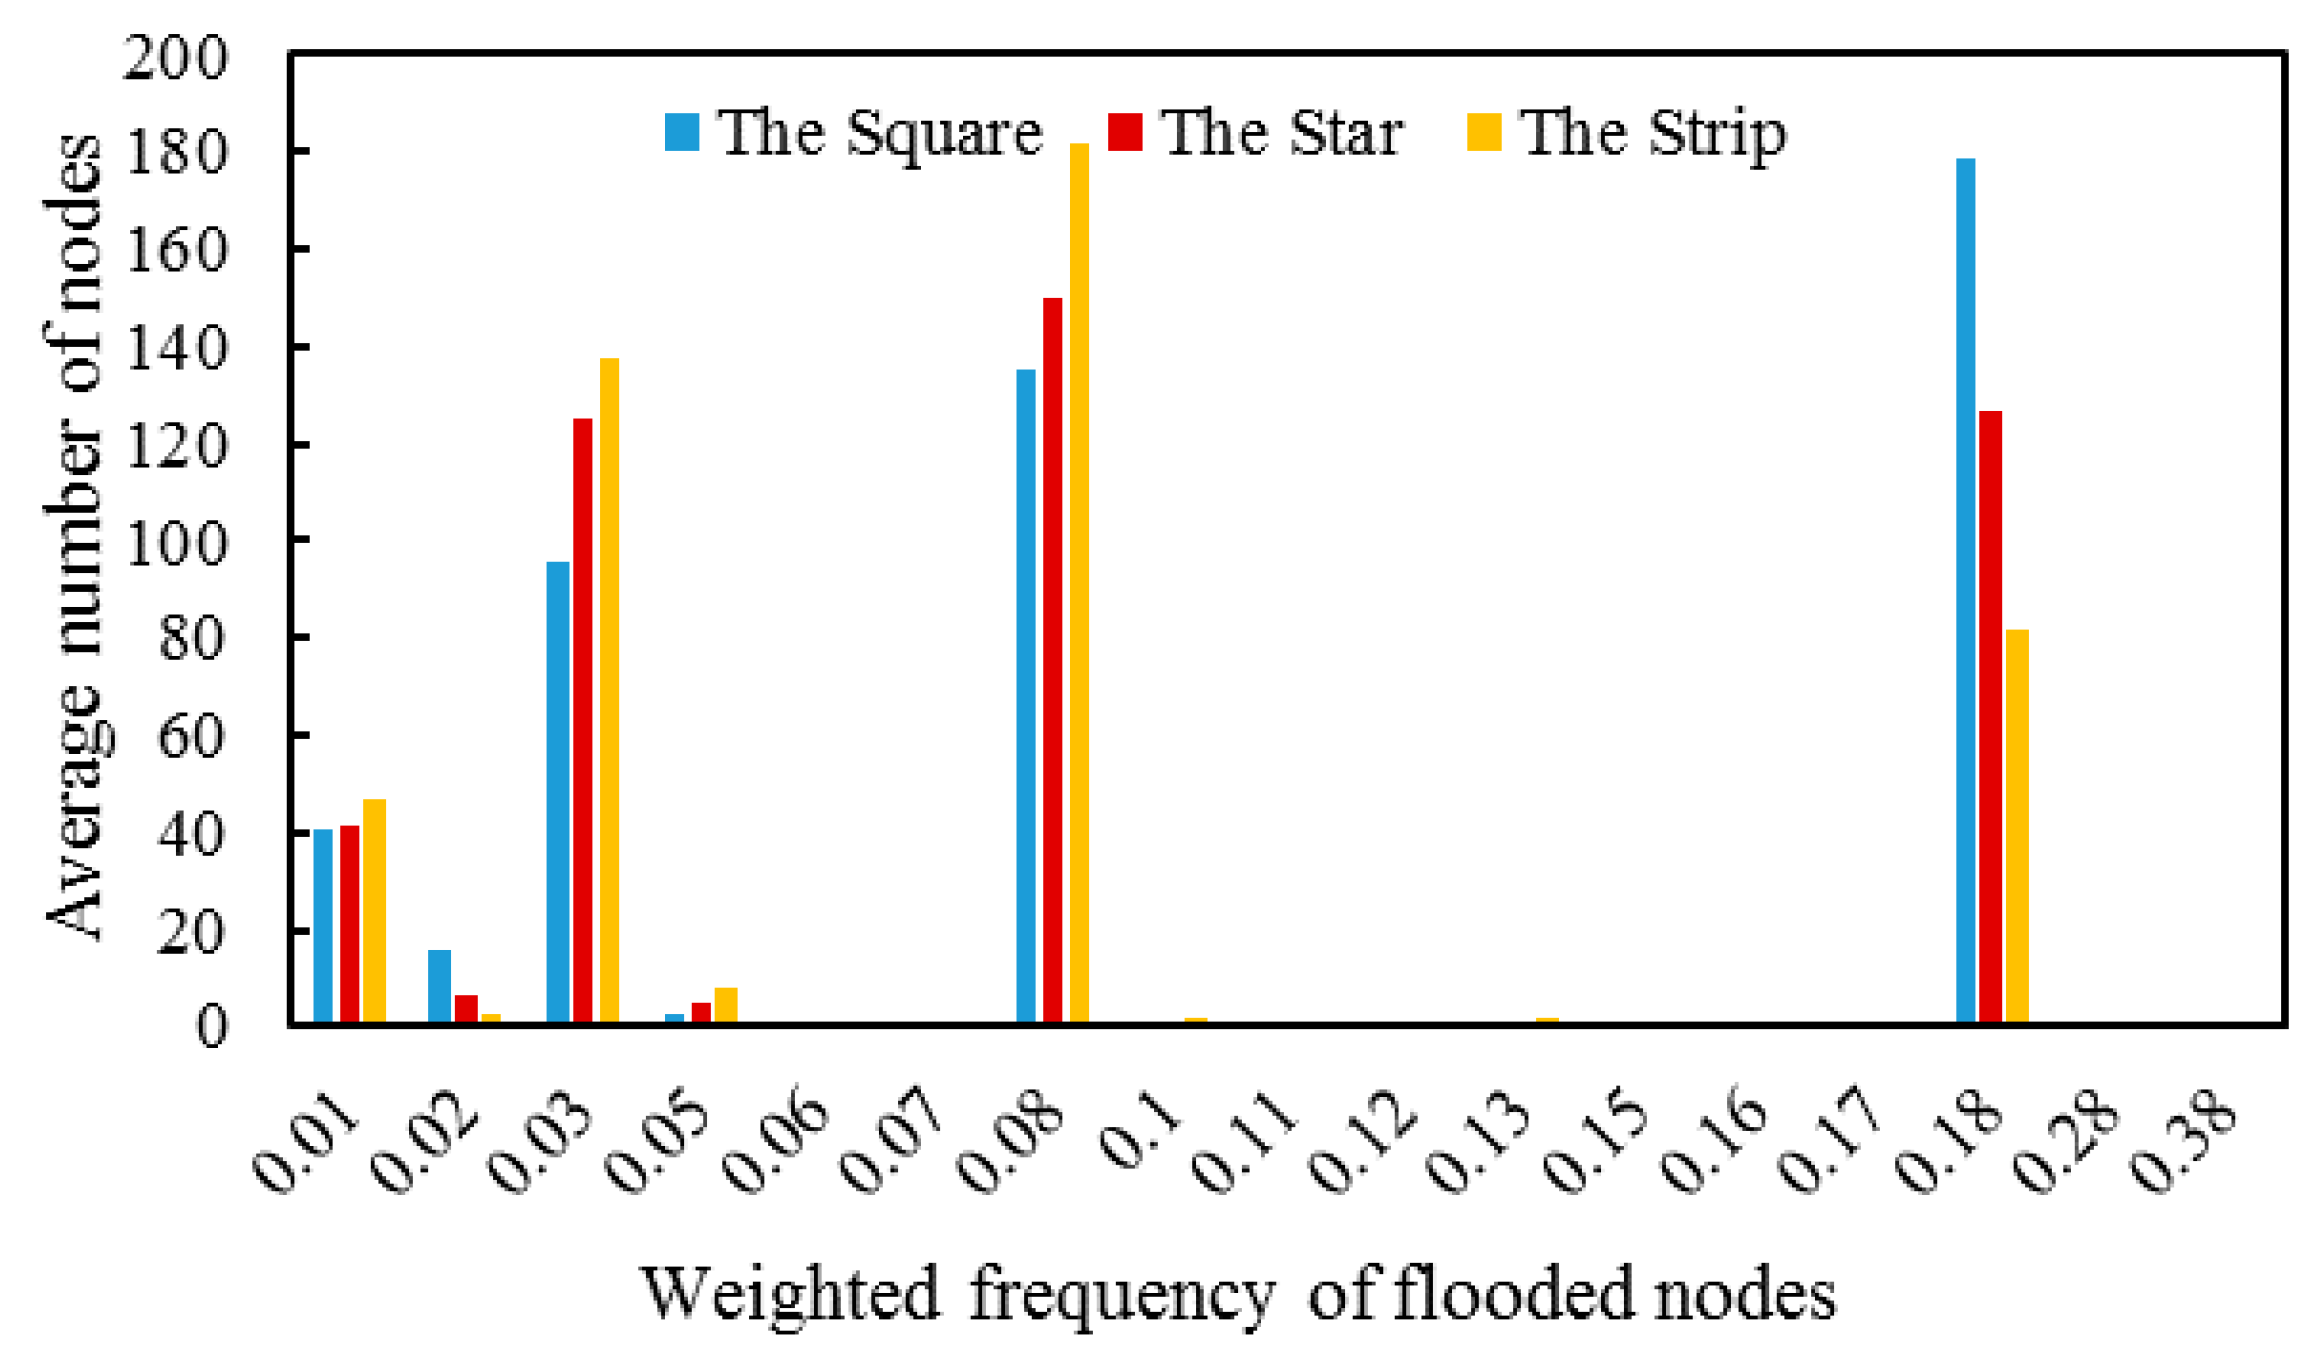
3.2. Effectiveness
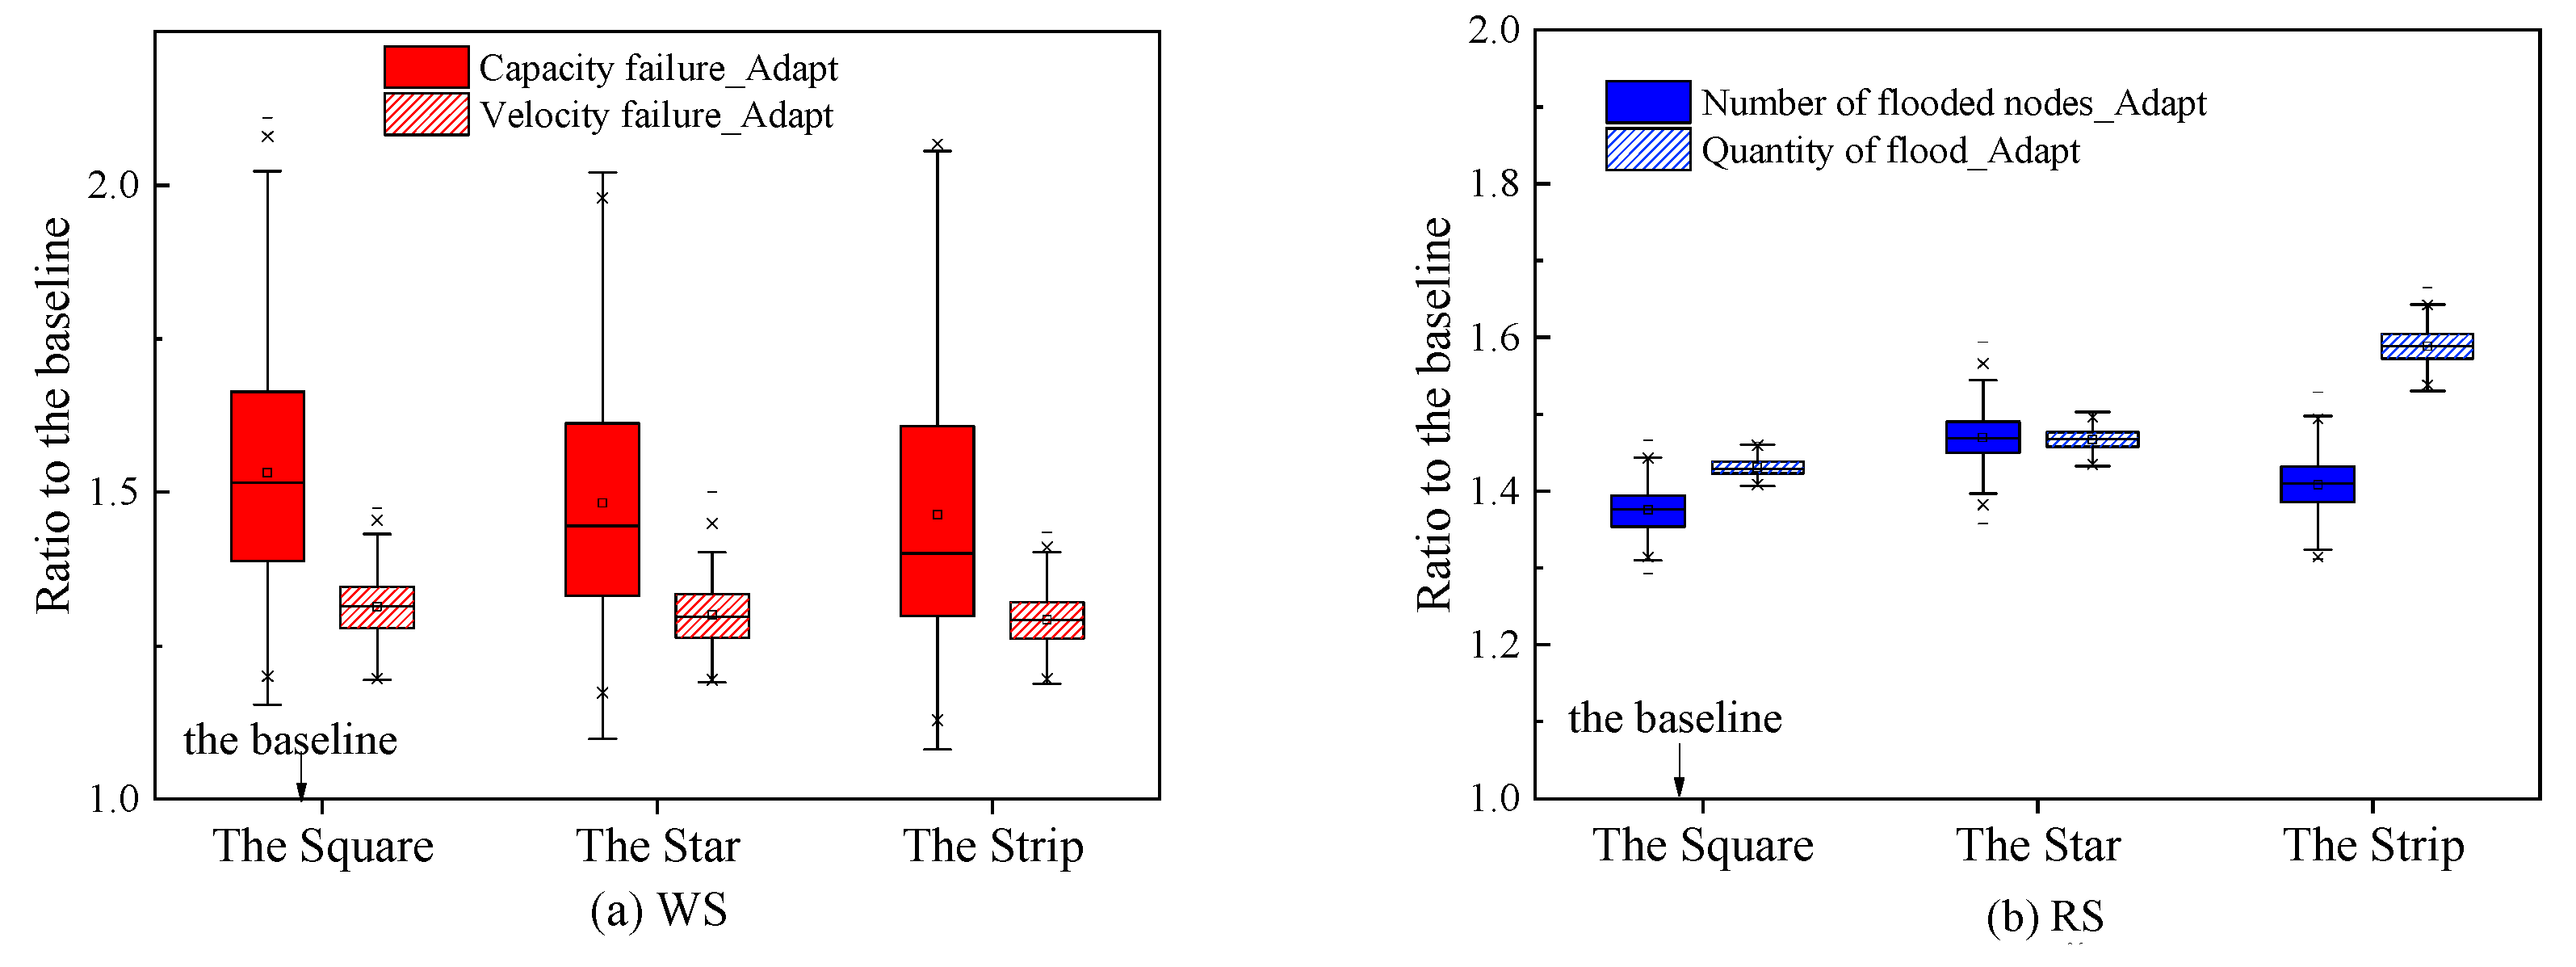
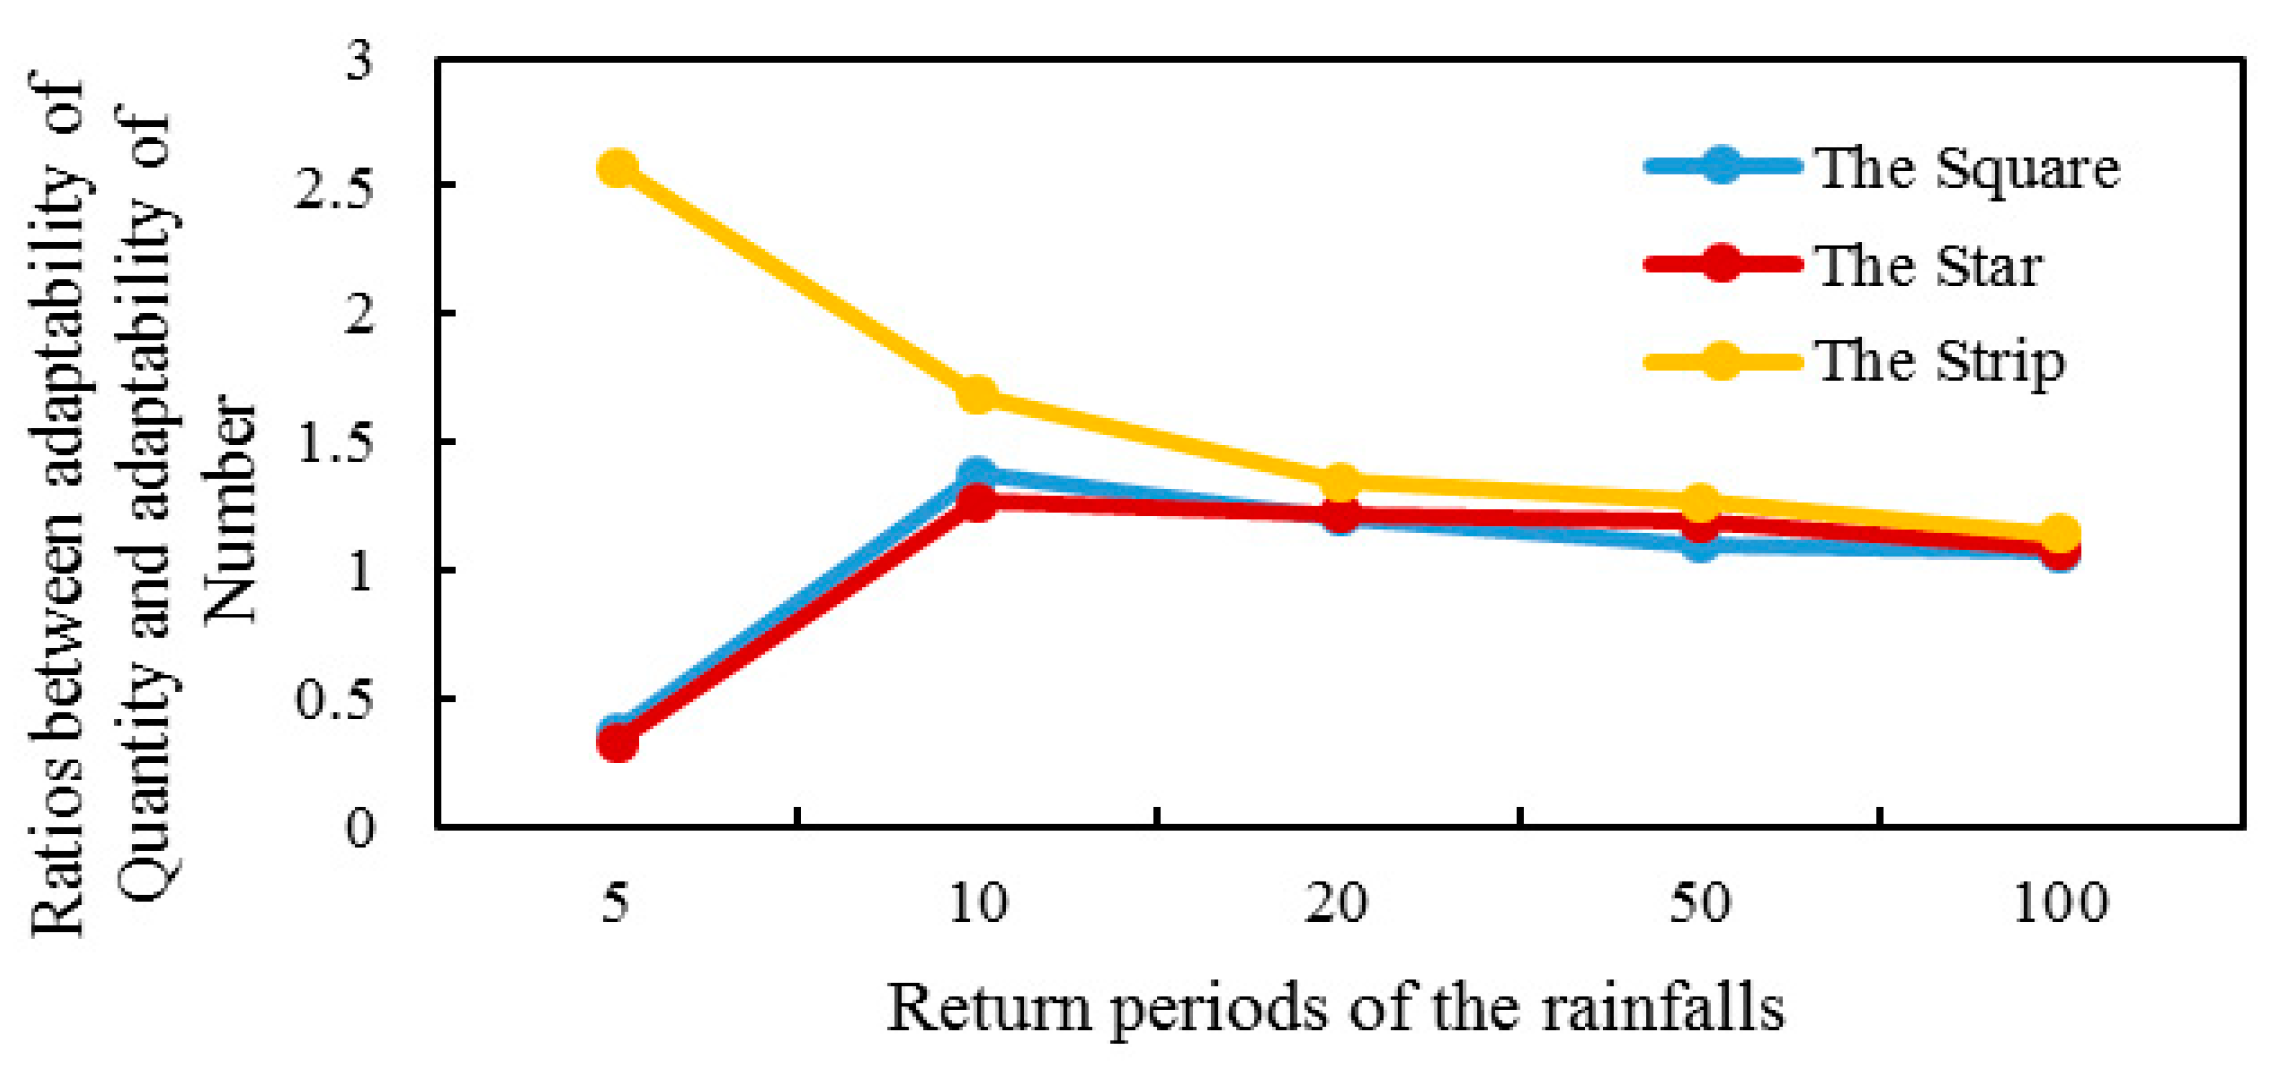
3.3. Adaptability
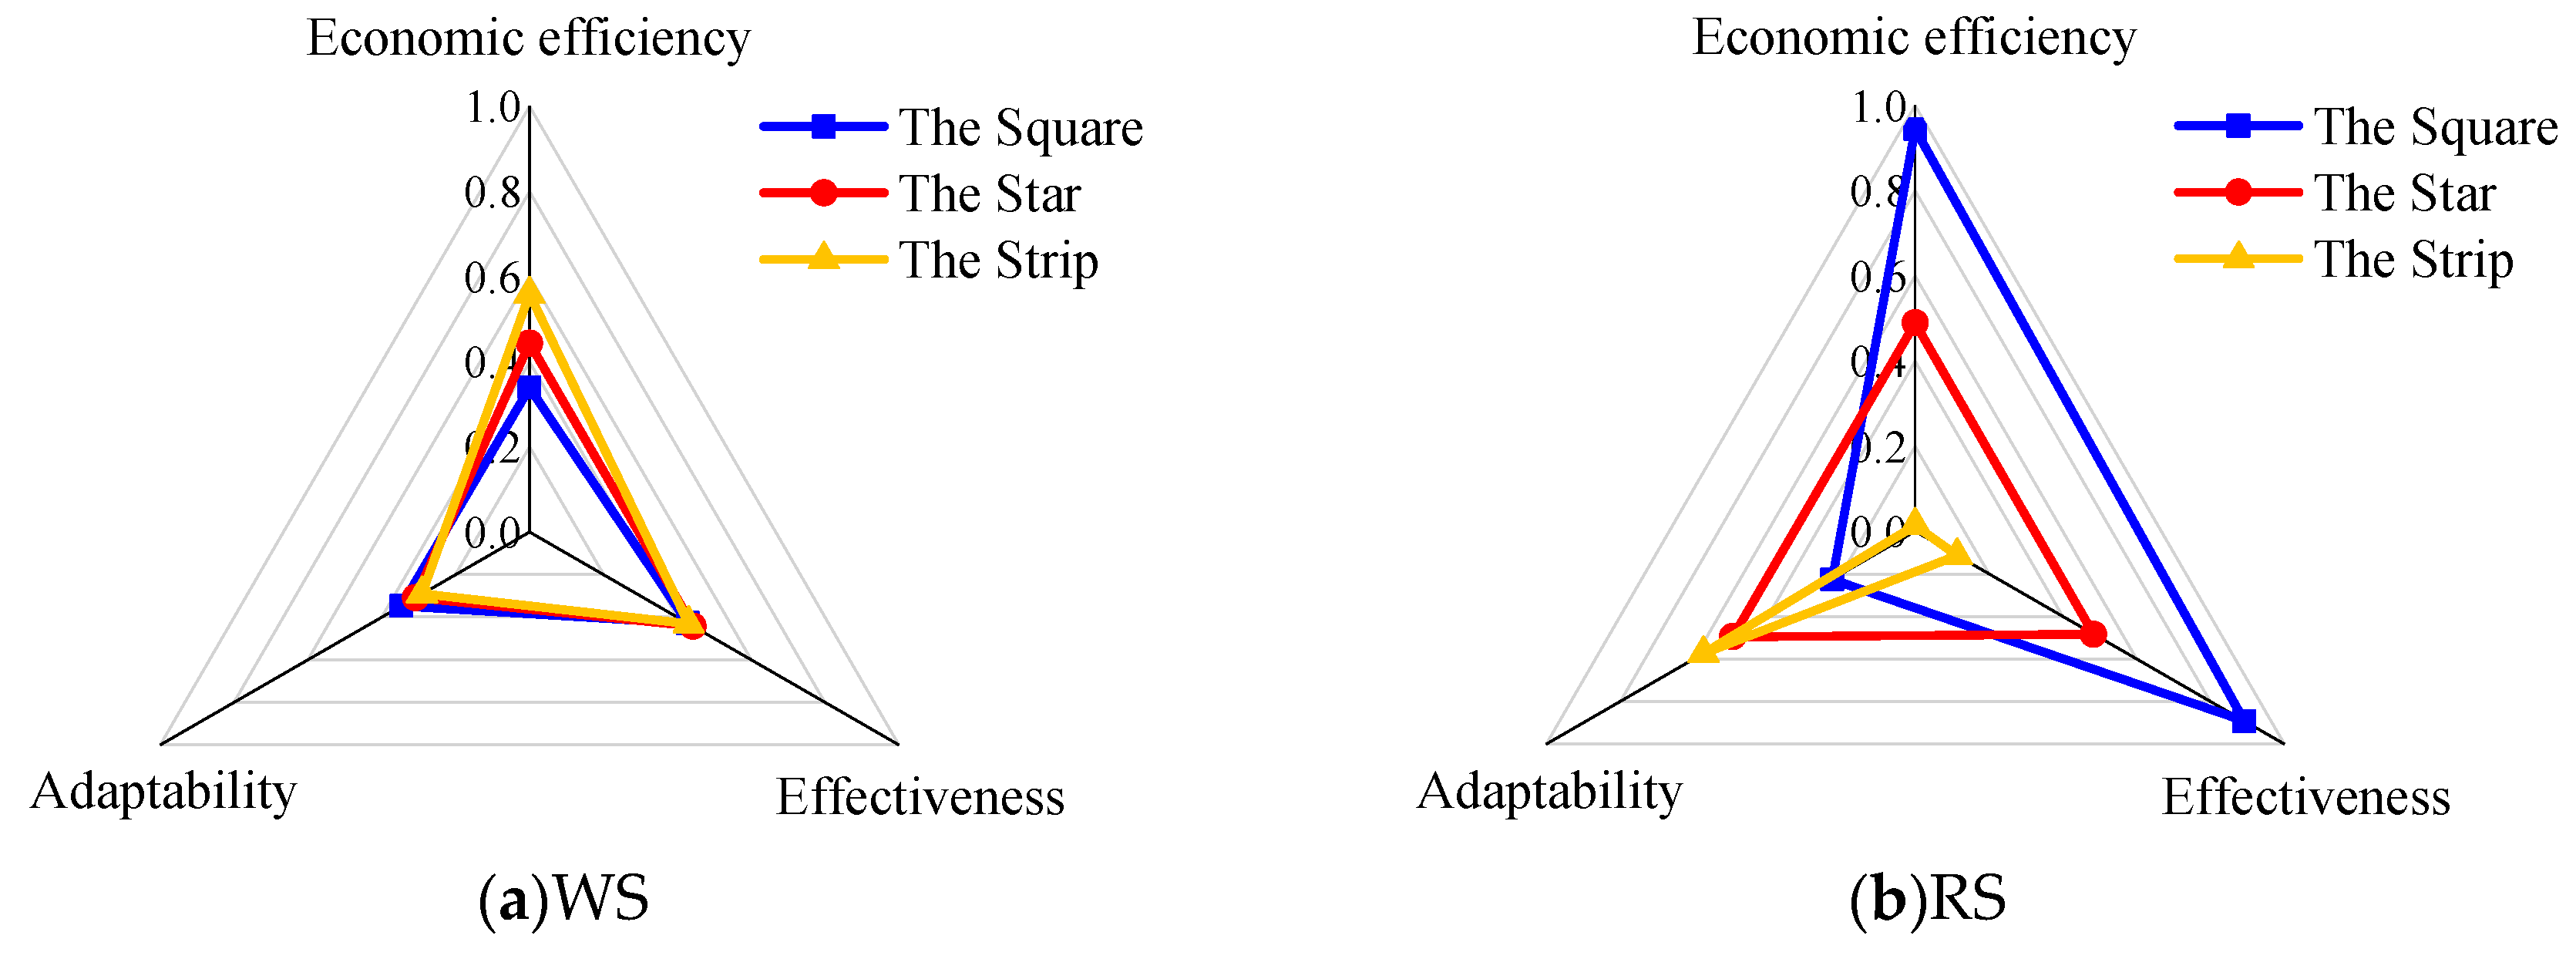
3.4. Comprehensive Evaluation
4. Conclusions
Author Contributions
Funding
Acknowledgments
Conflicts of Interest
Appendix A

References
- Ministry of Housing and Urban-Rural Development of the People’s Republic of China. China urban construction statistical yearbook. Beijing. 2016. Available online: http://www.mohurd.gov.cn/xytj/tjzljsxytjgb/jstjnj/index.html (accessed on 22 January 2019).
- The State Council of the People’s Republic of China. Regulation on Urban Drainage and Sewage Treatment. Beijing. 2013. Available online: http://www.gov.cn/zwgk/2013-10/16/content_2508045.htm (accessed on 15 February 2019).
- Li, T.; Zhang, W.; Feng, C.; Shen, J. Performance assessment of separate and combined sewer systems in metropolitan areas in southern China. Water Sci. Technol. 2014, 69, 422–429. [Google Scholar] [CrossRef] [PubMed]
- Qi, L.; Zu, S.; Ma, J. CCTV Inspection and Thinking of a Regional Sewage Networks in Zhuhai. CHINA WATER WASTEWATER 2017, 33, 135–138. (in Chinese). [Google Scholar]
- National Flood Control and Drought Relief Headquarters & Ministry of Water Resources. Water and Drought Disaster Bulletin in China 2010–2017; SinoMaps Press: Beijing, China, 2011–2018.
- Astaraie-Imani, M.; Kapelan, Z.; Fu, G.; Butler, D. Assessing the combined effects of urbanisation and climate change on the river water quality in an integrated urban wastewater system in the UK. J. Environ. Manag. 2012, 112, 1–9. [Google Scholar] [CrossRef]
- Deng, Y.H.; Cardin, M.-A.; Babovic, V.; Santhanakrishnan, D.; Schmitter, P.; Meshgi, A. Valuing flexibilities in the design of urban water management systems. Water Res. 2013, 47, 7162–7174. [Google Scholar] [CrossRef]
- Li, C.; Liu, M.; Hu, Y.; Shi, T.; Qu, X.; Walter, M.T. Effects of urbanization on direct runoff characteristics in urban functional zones. Sci. Total. Environ. 2018, 643, 301–311. [Google Scholar] [CrossRef] [PubMed]
- Zhou, Q. A Review of Sustainable Urban Drainage Systems Considering the Climate Change and Urbanization Impacts. Water 2014, 6, 976–992. [Google Scholar] [CrossRef]
- Pingale, S.M.; Jat, M.K.; Khare, D. Integrated urban water management modelling under climate change scenarios. Resour. Conserv. Recycl. 2014, 83, 176–189. [Google Scholar] [CrossRef]
- Notaro, V.; Liuzzo, L.; Freni, G.; La Loggia, G. Uncertainty Analysis in the Evaluation of Extreme Rainfall Trends and Its Implications on Urban Drainage System Design. Water 2015, 7, 6931–6945. [Google Scholar] [CrossRef]
- Kang, N.; Kim, S.; Kim, Y.; Noh, H.; Hong, S.J.; Kim, H.S. Urban Drainage System Improvement for Climate Change Adaptation. Water 2016, 8, 268. [Google Scholar] [CrossRef]
- Da Silva, C.V.F.; Schardong, A.; Garcia, J.I.B.; Oliveira, C.D.P.M. Climate Change Impacts and Flood Control Measures for Highly Developed Urban Watersheds. Water 2018, 10, 829. [Google Scholar] [CrossRef]
- Huong, H.T.L.; Pathirana, A. Urbanization and climate change impacts on future urban flooding in Can Tho city, Vietnam. Hydrol. Earth Syst. Sci. 2013, 17, 379–394. [Google Scholar] [CrossRef]
- Zhou, Q.; Leng, G.; Su, J.; Ren, Y. Comparison of urbanization and climate change impacts on urban flood volumes: Importance of urban planning and drainage adaptation. Sci. Total. Environ. 2018, 658, 24–33. [Google Scholar] [CrossRef]
- Kleidorfer, M.; Mikovits, C.; Jasper-Tönnies, A.; Huttenlau, M.; Einfalt, T.; Rauch, W. Impact of a Changing Environment on Drainage System Performance. Procedia Eng. 2014, 70, 943–950. [Google Scholar] [CrossRef][Green Version]
- Bach, P.M.; Deletic, A.; Urich, C.; McCarthy, D.T. Modelling characteristics of the urban form to support water systems planning. Environ. Model. Softw. 2018, 104, 249–269. [Google Scholar] [CrossRef]
- Mikovits, C.; Rauch, W.; Kleidorfer, M. Importance of scenario analysis in urban development for urban water infrastructure planning and management. Comput. Environ. Syst. 2018, 68, 9–16. [Google Scholar] [CrossRef]
- Mikovits, C.; Tscheikner-Gratl, F.; Jasper-Tönnies, A.; Einfalt, T.; Huttenlau, M.; Schöpf, M.; Kinzel, H.; Rauch, W.; Kleidorfer, M. Decision Support for Adaptation Planning of Urban Drainage Systems. J. Resour. Plan. Manag. 2017, 143, 4017069. [Google Scholar] [CrossRef]
- Kuller, M.; Bach, P.M.; Ramirez-Lovering, D.; Deletic, A. Framing water sensitive urban design as part of the urban form: A critical review of tools for best planning practice. Environ. Model. Softw. 2017, 96, 265–282. [Google Scholar] [CrossRef]
- Pregnolato, M.; Ford, A.; Robson, C.; Glenis, V.; Barr, S.; Dawson, R. Assessing urban strategies for reducing the impacts of extreme weather on infrastructure networks. R. Soc. Open Sci. 2016, 3, 160023. [Google Scholar] [CrossRef]
- Ellis, J.B.; Viavattene, C. Sustainable urban drainage system modeling for managing urban surface water flood risk. CLEAN—Soil Air Water 2014, 42, 153–159. [Google Scholar] [CrossRef]
- Zhang, K.; Chui, T.F.M. Linking hydrological and bioecological benefits of green infrastructures across spatial scales—A literature review. Sci. Total. Environ. 2019, 646, 1219–1231. [Google Scholar] [CrossRef]
- Rauch, W.; Urich, C.; Bach, P.; Rogers, B.; De Haan, F.; Brown, R.; Mair, M.; McCarthy, D.; Kleidorfer, M.; Sitzenfrei, R.; et al. Modelling transitions in urban water systems. Water Res. 2017, 126, 501–514. [Google Scholar] [CrossRef]
- Batty, M. A Theory of City Size. Science 2013, 340, 1418–1419. [Google Scholar] [CrossRef]
- Fang, C.; Wang, S.; Li, G. Changing urban forms and carbon dioxide emissions in China: A case study of 30 provincial capital cities. Appl. Energy 2015, 158, 519–531. [Google Scholar] [CrossRef]
- Liu, Y.; Wu, J.; Yu, D. Disentangling the Complex Effects of Socioeconomic, Climatic, and Urban Form Factors on Air Pollution: A Case Study of China. Sustainability 2018, 10, 776. [Google Scholar] [CrossRef]
- Lu, C.; Liu, Y. Effects of China’s urban form on urban air quality. Urban Stud. 2016, 53, 2607–2623. [Google Scholar] [CrossRef]
- Mansfield, T.J.; Rodriguez, D.A.; Huegy, J.; Gibson, J.M. The Effects of Urban Form on Ambient Air Pollution and Public Health Risk: A Case Study in Raleigh, North Carolina. Risk Anal. 2015, 35, 901–918. [Google Scholar] [CrossRef]
- Wong, H.G.; Speight, V.L.; Filion, Y.R. Impact of Urban form on Energy Use in Water Distribution Systems at the Neighbourhood Level. Procedia Eng. 2015, 119, 1049–1058. [Google Scholar] [CrossRef]
- Filion, Y.R. Impact of Urban Form on Energy Use in Water Distribution Systems. J. Infrastruct. Syst. 2008, 14, 337–346. [Google Scholar] [CrossRef]
- Farmani, R.; Butler, D. Implications of Urban Form on Water Distribution Systems Performance. Resour. Manag. 2013, 28, 83–97. [Google Scholar] [CrossRef]
- Schindler, M.; Caruso, G. Urban compactness and the trade-off between air pollution emission and exposure: Lessons from a spatially explicit theoretical model. Comput. Environ. Syst. 2014, 45, 13–23. [Google Scholar] [CrossRef]
- Long, Y.; Mao, Q.; Yang, D.; Wang, J. A Multi-agent Model for Urban Form, Transportation Energy Consumption and Environmental Impact Integrated Simulation. Acta Geogr. Sin. 2011, 66, 1033–1044. (In Chinese) [Google Scholar]
- Möderl, M.; Fetz, T.; Rauch, W. Stochastic approach for performance evaluation regarding water distribution systems. Water Sci. Technol. 2007, 56, 29–36. [Google Scholar] [CrossRef]
- Muranho, J.; Ferreira, A.; Sousa, J.; Gomes, A.; Marques, A.S.; Marques, J.A.S. WaterNetGen: an EPANET extension for automatic water distribution network models generation and pipe sizing. Water Sci. Technol. Water Supply 2012, 12, 117–123. [Google Scholar] [CrossRef]
- Sitzenfrei, R.; Fach, S.; Kleidorfer, M.; Urich, C.; Rauch, W. Dynamic virtual infrastructure benchmarking: DynaVIBe. Water Sci. Technol. Water Supply 2010, 10, 600–609. [Google Scholar] [CrossRef]
- Sitzenfrei, R. A Review on Network Generator Algorithms for Water Supply Modelling and Application Studies. In Proceedings of the World Environmental and Water Resources Congress, West Palm Beach, FL, USA, 22–26 May 2016. [Google Scholar]
- Sitzenfrei, R.; Möderl, M.; Rauch, W. Assessing the impact of transitions from centralised to decentralised water solutions on existing infrastructures—Integrated city-scale analysis with VIBe. Water Res. 2013, 47, 7251–7263. [Google Scholar] [CrossRef]
- Milder, J. Sustainable Urban Form. In Sustainable Urban Environments: An Ecosystem Approach; Springer: Dordrecht, The Netherlands, 2012; pp. 263–284. [Google Scholar]
- Besussi, E.; Chin, N.; Batty, M.; Longley, P. The Structure and Form of Urban Settlements. In Radar Remote Sensing of Urban Areas; Springer: Dordrecht, The Netherlands, 2010; Volume 10, pp. 13–31. [Google Scholar]
- Wu, J. Urban forms in China: Structures, Features and their Evolution; Jiangsu Science and Technology Press: Nanjing, China, 1990. (In Chinese) [Google Scholar]
- Ministry of Housing and Urban-Rural Development of the People’s Republic of China & National Development and Reform Commission. The 13th Five-Year Plan for the Municipal Infrastructure Construction in Nationwide Cities. Beijing. 2017. Available online: http://www.mohurd.gov.cn/wjfb/201705/W020170525053420.pdf (accessed on 13 February 2019).
- Ministry of Housing and Urban-Rural Development of the People’s Republic of China & State Administration for Market Regulation. Code for Classification of Urban Land Use and Planning Standards of Development Land (GB 50137-2011); China Architecture & Building Press: Beijing, China, 2011.
- Ministry of Housing and Urban-Rural Development of the People’s Republic of China & State Administration for Market Regulation. Code for Design of Outdoor Wastewater Engineering (GB 50014-2006); China Planning Press: Beijing, China, 2014.
- Mair, M.; Zischg, J.; Rauch, W.; Sitzenfrei, R. Where to Find Water Pipes and Sewers?—On the Correlation of Infrastructure Networks in the Urban Environment. Water 2017, 9, 146. [Google Scholar] [CrossRef]
- Cormen, T.H.; Leiserson, C.E.; Rivest, R.L.; Stein, C. The algorithms of Kruskal and Prim. In Introduction to Algorithms, 2nd ed.; MIT Press and McGraw-Hill: Cambridge, MA, USA, 2001; pp. 567–574. [Google Scholar]
- Bai, H. Research on the Optimization Design Method of Separated Urban Drainage System under Uncertainty. Ph.D. Thesis, Tsinghua University, Beijing, China, 2016. (In Chinese). [Google Scholar]
- Rossman, L.A. Storm Water Management Model User’s Manual Version 5.1; U.S. Environmental Protection Agency: Cincinnati, OH, USA, 2015.
- Ministry of Housing and Urban-Rural Development of the People’s Republic of China. Statistical Communiqué of China’s Urban Water Supply (2006–2010). Available online: http://www.mohurd.gov.cn/xytj/tjzljsxytjgb/w02012052419769781411330032.doc (accessed on 17 February 2019).
- Keifer, C.J.; Chu, H.H. Synthetic storm pattern for drainage design. J. Hydraul. Div. 1957, 83, 1–25. [Google Scholar]
- Wang, H. Optimization Design for Sewer Network System Based on MATLAB. Master Thesis, Hefei University of Technology, Hefei, China, 2007. (In Chinese). [Google Scholar]
- Liu, J.; Zheng, X.; Gao, C.; Chen, L. Study on area, operating and construction costs of urban wastewater treatment plants. Chin. J. Environ. Eng. 2010, 11, 2522–2526. (In Chinese) [Google Scholar]
- Mattsson, J.; Hedström, A.; Westerlund, L.; Dahl, J.; Ashley, R.M.; Viklander, M. Impacts on Rural Wastewater Systems in Subarctic Regions due to Changes in Inputs from Households. J. Cold Reg. Eng. 2018, 32, 4017019. [Google Scholar] [CrossRef]
- Botev, Z.I.; Grotowski, J.F.; Kroese, D.P. Kernel density estimation via diffusion. Ann. Stat. 2010, 38, 2916–2957. [Google Scholar] [CrossRef]
- Dong, X.; Guo, H.; Zeng, S. Enhancing future resilience in urban drainage system: Green versus grey infrastructure. Water Res. 2017, 124, 280–289. [Google Scholar] [CrossRef]


| Attributes | Core DU | Road DU | |
|---|---|---|---|
| Basic information | Types | Three | One |
| Area | 7.29 ha | 0.855 ha | |
| Number | 400 | 800 | |
| Wastewater system | Produce wastewater? | Yes | No |
| Population | 900 | - | |
| Where to discharge? | Randomly choose any one of four surrounding roads | - | |
| Rainwater system | Produce rain water? | Yes | Yes |
| Runoff coefficient | 0.2, 0.6, and 0.7 | 0.9 | |
| Where to discharge? | The road closest to the receiving water body | Itself | |
| Items | Wastewater System | Rainwater System |
|---|---|---|
| Variables of sampling | The roads (pipes) included | The layout of Core DUs |
| Design parameters | Typical household wastewater discharge: 240 L/cap/day [45,50] | Rain pattern: Chicago [51] 1 Return period: 2 years [45] Rainfall intensity (of Beijing): |
| Simulation parameters | 24 h, using a typical daily wastewater discharge curve | Peak position coefficient: 0.35 Rainfall duration: 2 h Rainfall events of different return periods |
© 2019 by the authors. Licensee MDPI, Basel, Switzerland. This article is an open access article distributed under the terms and conditions of the Creative Commons Attribution (CC BY) license (http://creativecommons.org/licenses/by/4.0/).
Share and Cite
Jia, N.; Sitzenfrei, R.; Rauch, W.; Liang, S.; Liu, Y. Effects of Urban Forms on Separate Drainage Systems: A Virtual City Perspective. Water 2019, 11, 758. https://doi.org/10.3390/w11040758
Jia N, Sitzenfrei R, Rauch W, Liang S, Liu Y. Effects of Urban Forms on Separate Drainage Systems: A Virtual City Perspective. Water. 2019; 11(4):758. https://doi.org/10.3390/w11040758
Chicago/Turabian StyleJia, Ning, Robert Sitzenfrei, Wolfgang Rauch, Shan Liang, and Yi Liu. 2019. "Effects of Urban Forms on Separate Drainage Systems: A Virtual City Perspective" Water 11, no. 4: 758. https://doi.org/10.3390/w11040758
APA StyleJia, N., Sitzenfrei, R., Rauch, W., Liang, S., & Liu, Y. (2019). Effects of Urban Forms on Separate Drainage Systems: A Virtual City Perspective. Water, 11(4), 758. https://doi.org/10.3390/w11040758