Article

The Characterization of Microbial Communities Response to Shallow Groundwater Contamination in Typical Piedmont Region of Taihang Mountains in the North China Plain

1
Institute of Hydrogeology and Environmental Geology, Chinese Academy of Geological Sciences, Shijiazhuang 050061, China
2
Key Laboratory of Groundwater Remediation, China Geological Survey/Hebei, Zhengding 050803, China
*
Author to whom correspondence should be addressed.
Water 2019, 11(4), 736; https://doi.org/10.3390/w11040736
Submission received: 8 March 2019 / Revised: 3 April 2019 / Accepted: 7 April 2019 / Published: 9 April 2019
(This article belongs to the Section Water Quality and Contamination)

Abstract

:
Regional-scale nitrate and organic contaminants in the shallow groundwater were investigated in the Piedmont region of Taihang Mountains (PRTM), but the information of the microbial communities is limited. However, microorganisms provide a dominated contribution to indicate and degrade the contaminants in the aquifer. Therefore, this study investigates the microbial diversity and contamination microbial indicators of groundwater samples with different contaminated types to better understand the contamination in the PRTM. Seventy-six samples were collected between two rivers in the Tang-Dasha River Basin covering 4000 km2 in the PRTM. High-throughput sequencing was employed to determine the samples’ DNA sequences. The samples were divided into four groups: background (B), nitrate contamination (N), organic contamination (O) and organic-nitrate contamination (O_N) based on the cumulative probability distribution and the Chinese groundwater standard levels of NO3, COD and DO concentrations. Then, the microbial diversity and contamination microbial indicators were studied in the four groups. The results showed that the O group exhibited lower diversity than other groups. Bacteria detected in these four groups covered 531 families, 987 genera, and 1881 species. Taxonomic assignment analysis indicated that Rhodobacter, Vogesella, Sphingobium dominated in the O_N group, N group, and O group, and accounted for 18.05%, 17.74%, 16.45% in each group at genus level, respectively. Furthermore, these three genera were identified as contamination microbial indicators to the three types of contamination, respectively. The results provide a potential molecular microbiological method to identity contamination in shallow groundwater, and established a strong foundation for further investigation and remediation in the PRTM.

1. Introduction

Groundwater is the major source of drinking water around the world. In the Middle East and North Africa, about 80% of drinking water is groundwater sourced. In Europe, 60% of drinking water is from groundwater [1,2]. In the Piedmont region of Taihang Mountains (PRTM), groundwater provides more than a half of the population with drinking water [3]. The shallow groundwater also significantly supplies the agricultural and industrial requirements [4,5]. Due to the important status of groundwater in the PRTM, its quality has been extensively observed. The preliminary investigation of the groundwater chemical and physical properties indicated that the regional shallow groundwater had been continuously contaminated by nitrogen and organic pollutants [6,7], which may pose health risks to residents in the PRTM [8].
The contaminated groundwater could be considered as a sick ecosystem. Microorganisms are the key curative force in this kind of ecosystem, as groundwater microorganisms utilize the redox reactions to degrade organic pollutants, using inorganic elements such as oxygen, nitrates, sulfates and iron, etc., and obtain the energy for survival [9,10,11,12]. Therefore, it is important to understand the microbial communities’ status in the polluted aquifer systems, which will enable us to uncover and use the relationship between microorganisms and contaminants in the groundwater to remediate pollution.
At present, in most countries, including China, groundwater survey works have almost entirely overlooked microbiological communities. According to the Chinese specification for regional groundwater contamination survey [13], only the content of Escherichia coli is in the routine monitoring list, as it is an index of faecal contamination. In recent years, an increasing number of studies have been conducted to fulfil the necessity of evaluating microbial parameters in contaminated groundwater, including microbial diversity and its relationships with water quality indices and hydro-geological conditions at the site scale [14,15,16,17]. However, according to our knowledge, the indigenous microbial diversity and the microbial indicators related to the groundwater contamination have never been systematically investigated at the regional scale. The regional investigation of microbial communities in groundwater is necessary and crucial due to the fact that most of the biochemical cycles on the earth are strongly influenced by microbial communities [18]. In the groundwater ecosystem, any change of the contaminants would cause a corresponding transformation in the microbial communities’ diversity and structure [19]. High-throughput sequencing has been considered as a conventional molecular microbiological method to characterize the structure and diversity of microbial communities. Then the community composition and its relationships with water quality parameters could provide an interesting approach to identify potential microbial indicators for contamination degradation [20].
In this study, the typical shallow groundwater from the PRTM was selected as the study subject. Seventy-six samples were collected along the rivers in the middle-upper part of the alluvial-proluvial fan of the Tang-Dasha River Basin, covering 4000 km2 in the PRTM. High-throughput sequencing was used to determine the DNA sequences. Combined with NO3, COD and DO concentrations, the samples were divided into four groups, based on their cumulative probability distribution and by referring to the groundwater quality standard. Following this, we compared the bacterial community of the samples in the four groups. Then, the contamination microbial indicators related to the nitrate and organic contamination were found. We sought to find the characterization of the microbial communities’ response to shallow groundwater contamination at the regional scale and provide a molecular microbiological method for the further regional groundwater survey and remediation in the PRTM.

2. Materials and Methods

2.1. Study Area

The study site is located in the middle-upper part of alluvial-proluvial fan of the Tang-Dasha River Basin in the PRTM (Figure 1). The length of the river section within the study site is ~100 km, covering an area of ~4000 km2. The Tang River and the Dasha River, which belong to the Daqing River System in the Haihe River Basin, originate in Shanxi, flow from west to east through Quyang, Xingtang, Xinle, Dingzhou, Anguo and Boye in the central south part of Hebei Province, and discharge into the Baiyang Lake after merging into the Zhulong River. From west to east of the Tang-Dasha River Basin, the thickness of the underground aquifer gradually increases and the lithology gradually becomes finer, along with decreasing water volume but increasing salinity. The shallow groundwater tested in this study mainly occurs in the Holocene (Q4) and Upper Pleistocene (Q3) strata. The lithology is dominated by coarse sand and medium sand, with gravel in the lower part. Medium-fine sand is distributed between the fans and in the marginal zones, with poor water-bearing capability. Coarse sand is present at the axial part, the paleochannel, and both sides of the present riverbed, with high water-bearing capability. The water chemistry type is dominated by calcium bicarbonate and calcium-magnesium bicarbonate, with salinity being no more than 1 g/L. Groundwater is recharged from vertical infiltration of natural precipitation and lateral runoff of groundwater, along with field irrigation and riverway infiltration. Groundwater discharge is mainly based on artificial mining, which has formed a cone of depression, with a groundwater table of ~30 m [21]. Agriculture, livestock, and small-scale industries are relatively developed along the banks of these two rivers, causing groundwater contamination in the surroundings [22].

2.2. Sampling Procedure

From July to August 2018, a total of 76 groundwater samples were collected along the direction of groundwater flow in the middle-upper part of the Tang-Dasha River’s alluvial-proluvial fan. The distribution of sampling points followed two principles: (1) Cover most areas in the middle-upper part of the Tang-Dasha River’s alluvial-proluvial fan, in order to obtain data reflecting the overall microbial diversity characteristics in this region; and (2) increase the sampling point density surrounding farms, contiguous croplands and factories in order to characterize the nitrate and organic contamination in this area. The distribution of the sampling points is shown in Figure 1.
The sampling wells were generally irrigation wells of croplands or self-supply wells of farms and factories, with sampling depths of 30–60 m. Before the sampling, well flushing and on-site testing were performed according to the Chinese standard of regional groundwater contamination survey and evaluation [13]. Sampling was carried out after the water quality indexes such as DO, EC, pH, ORP, water temperature became stable. For sampling, 5 L ultra-pure water plastic buckets from Nestle were chosen. The ultra-pure water was discarded at sampling, and the bucket was rinsed three times with the groundwater to be collected, then filled and sealed. The collected samples were placed in a 4 °C incubator and transported to the laboratory within 1–2 days of collection, where they were pre-treated by suction filtration using high-temperature sterilized polytetrafluoroethylene microporous membranes with a pore size of 0.22 μm and a diameter of 50 cm. Each membrane was used to filter 2 L of sample, then kept in a disposable sterile petri dish and stored at −86 °C before subsequent DNA extraction and other analysis.

2.3. High-Throughput Sequencing and Chemical Analyses

High-throughput sequencing: Total DNA was extracted from the samples using the MP Fast DNATM Spin Kit for Soil. To do this, a filter membrane was thawed on ice, cut into small pieces with sterile scissors, and placed into the bead-milling centrifuge tube provided by the kit. DNA extraction was performed following the manufacturer’s instructions. The quality of DNA extracts was checked by 1% agarose gel electrophoresis, and DNA concentration was measured using Nano Drop 2000. PCR amplification and subsequent sequencing were performed using the 16S rDNA amplification primer sequences recommended by the Earth Microbiome Project [23], as their target fragments cover both bacteria and archaea. The upstream primer was 515FB (5’-GTGYCAGCMGCCGCGGTAA-3’) and the downstream primer was 806RB (5’-GGACTACNVGGGTWTC TAAT-3’). PCR reactions were carried out using the GeneAmp® 9700 (Life Applied Biosystems), in a total volume of 20 μL. Amplicons were recovered, purified, and sequenced on an Illumina Miseq platform by Shanghai Majorbio Bio-pharm Technology Co., Ltd. (Shanghai, China).
Water quality index determination: Conventional water quality indexes, including dissolved oxygen (DO), nitrate (NO3), and chemical oxygen demand (COD), were determined according to the sanitary standard examination methods for drinking water in China (GBT 5750.6. 2.1-2006). This was done by the groundwater, mineral water, and environmental monitoring center, the Ministry of Natural Resources of China.

2.4. Data Analysis

Grouping scheme of different contamination: According to the DO, NO3, and COD concentrations determined by water chemical analysis, the samples were divided into four groups. The selection of grouping thresholds was mainly based on the inflection point of cumulative probability curve for each index [24,25]. In the case of multiple inflection points, the Chinese groundwater quality standard [26] was taken into account for threshold selection.
Reliability test of sequencing results and grouping scheme: The PE reads obtained by Miseq high-throughput sequencing were spliced based on their overlap relationships. Meanwhile, the reads were quality-controlled and filtered, then resampled by the minimum number of reads per sample [27]. Then, the reliability of the sequencing results was tested by a rarefaction analysis [28]. The reliability of the grouping scheme was tested by an Anosim analysis based on the Bray–Curtis distance algorithm [29]. Further, a hierarchical clustering analysis was used for taxonomic assignment of the sample groups at the operational taxonomic unit (OTU) level, with the distance algorithm of Bray–Curtis and the hierarchical clustering method of average [30].
Analysis of microbial community structure and diversity: Alpha diversity and beta diversity analyses were performed at the OTU level. The alpha diversity analysis mainly involved the coverage index reflecting sequencing Coverage, the Chao, ACE and sobs indexes reflecting community richness, and the Shannon and Simpson indexes reflecting community diversity [31]. For the beta diversity analysis, the principal coordinate analysis (PCoA) based on the Bray–Curtis distance algorithm was used [32]. Representative sequences of OTUs at a 97% similarity level were taxonomically assigned using the RDP classifier with the Bayesian algorithm. Species classification was based on the silva128/16S database, and the classification confidence was set to 0.7. Building on this classification, a Venn diagram analysis was performed at the OTU level [33].
Analysis of microbial response indicator microorganisms: First, a representative species analysis was performed, including a community composition analysis and a test of significant difference between groups. The community composition analysis was performed by summing the species abundance for each group. Difference between groups was identified by the Kruskal–Wallis H test [34]. This test of significant difference was done at the genus level using the FDR (false discovery rate) method for multiple testing correction of the significance level (p-value) and the Scheffe method for CI calculation. Second, a heatmap analysis was performed on the grouped samples using Spearman correlation coefficients [35], aiming to uncover the relationship between representative species and contamination-related environmental factors, and to identify the functional indicator microorganisms. Finally, the role of functional indicator microorganisms in indicating groundwater contamination was verified through comparing with existing studies. The above analyses were completed on the I-sanger Cloud Platform [36].

3. Results

3.1. Grouping Scheme of Different Contamination

The cumulative probability curves of DO, NO3, and COD concentrations in 76 samples are shown in Figure 2.
The cumulative probability curve showed an inflection point of COD at 1.01 mg/L. Since this value is very close to the threshold for grades I and II of Chinese groundwater quality standard (1.0 mg/L) [26], 1.0 mg/L was selected as the threshold for determining organic contamination. As for NO3, inflection points appeared at 88.62 mg/L, 107.7 mg/L and 143.7 mg/L. The first inflection point of 88.62 mg/L is close to the threshold for grades III and IV of Chinese groundwater quality standard, namely, 88.57 mg/L. As the water beyond grade III is no longer suitable for drinking, the grade III standard of 88.57 mg/L was selected as the threshold for determining nitrate contamination. The DO curve showed an inflection point at 3.12 mg/L. The DO index is not listed in the Chinese groundwater quality standard. It is generally believed that when DO is lower than 3.0 mg/L, there may exist organic contamination. Thus, the value of 3.0 mg/L was selected as the threshold for DO. Organic contamination was determined using the double indexes of COD and DO: COD > 1 and DO < 3 indicate organic pollutant was present and being degraded; COD > 1 and DO > 3 indicate organic pollutant was present and not degraded; COD < 1 and DO < 3 indicate organic pollutant once occurred but was already degraded; and COD < 1 and DO > 3 indicate organic pollutant was absent. When both nitrate and organic contamination criteria were met, it was defined as organic-nitrate contamination. The specific grouping rules are shown in Table 1.

3.2. Reliability Test of Sequencing Results and Grouping Scheme

By sequencing bacteria and archaea in the groundwater collected, a total of 3,986,079 raw sequences were obtained from 76 samples. After filtering out low-quality sequences, 3,555,122 valid sequences were obtained, with a mean of 46,778 sequences per sample, and the length of each read was 276.05 bp on average. To standardize the data, the sequences were subsampled by the lowest number of sample reads as 30,024. Then, the valid sequences were taxonomically assigned, yielding 6201 OTUs for the 76 samples.
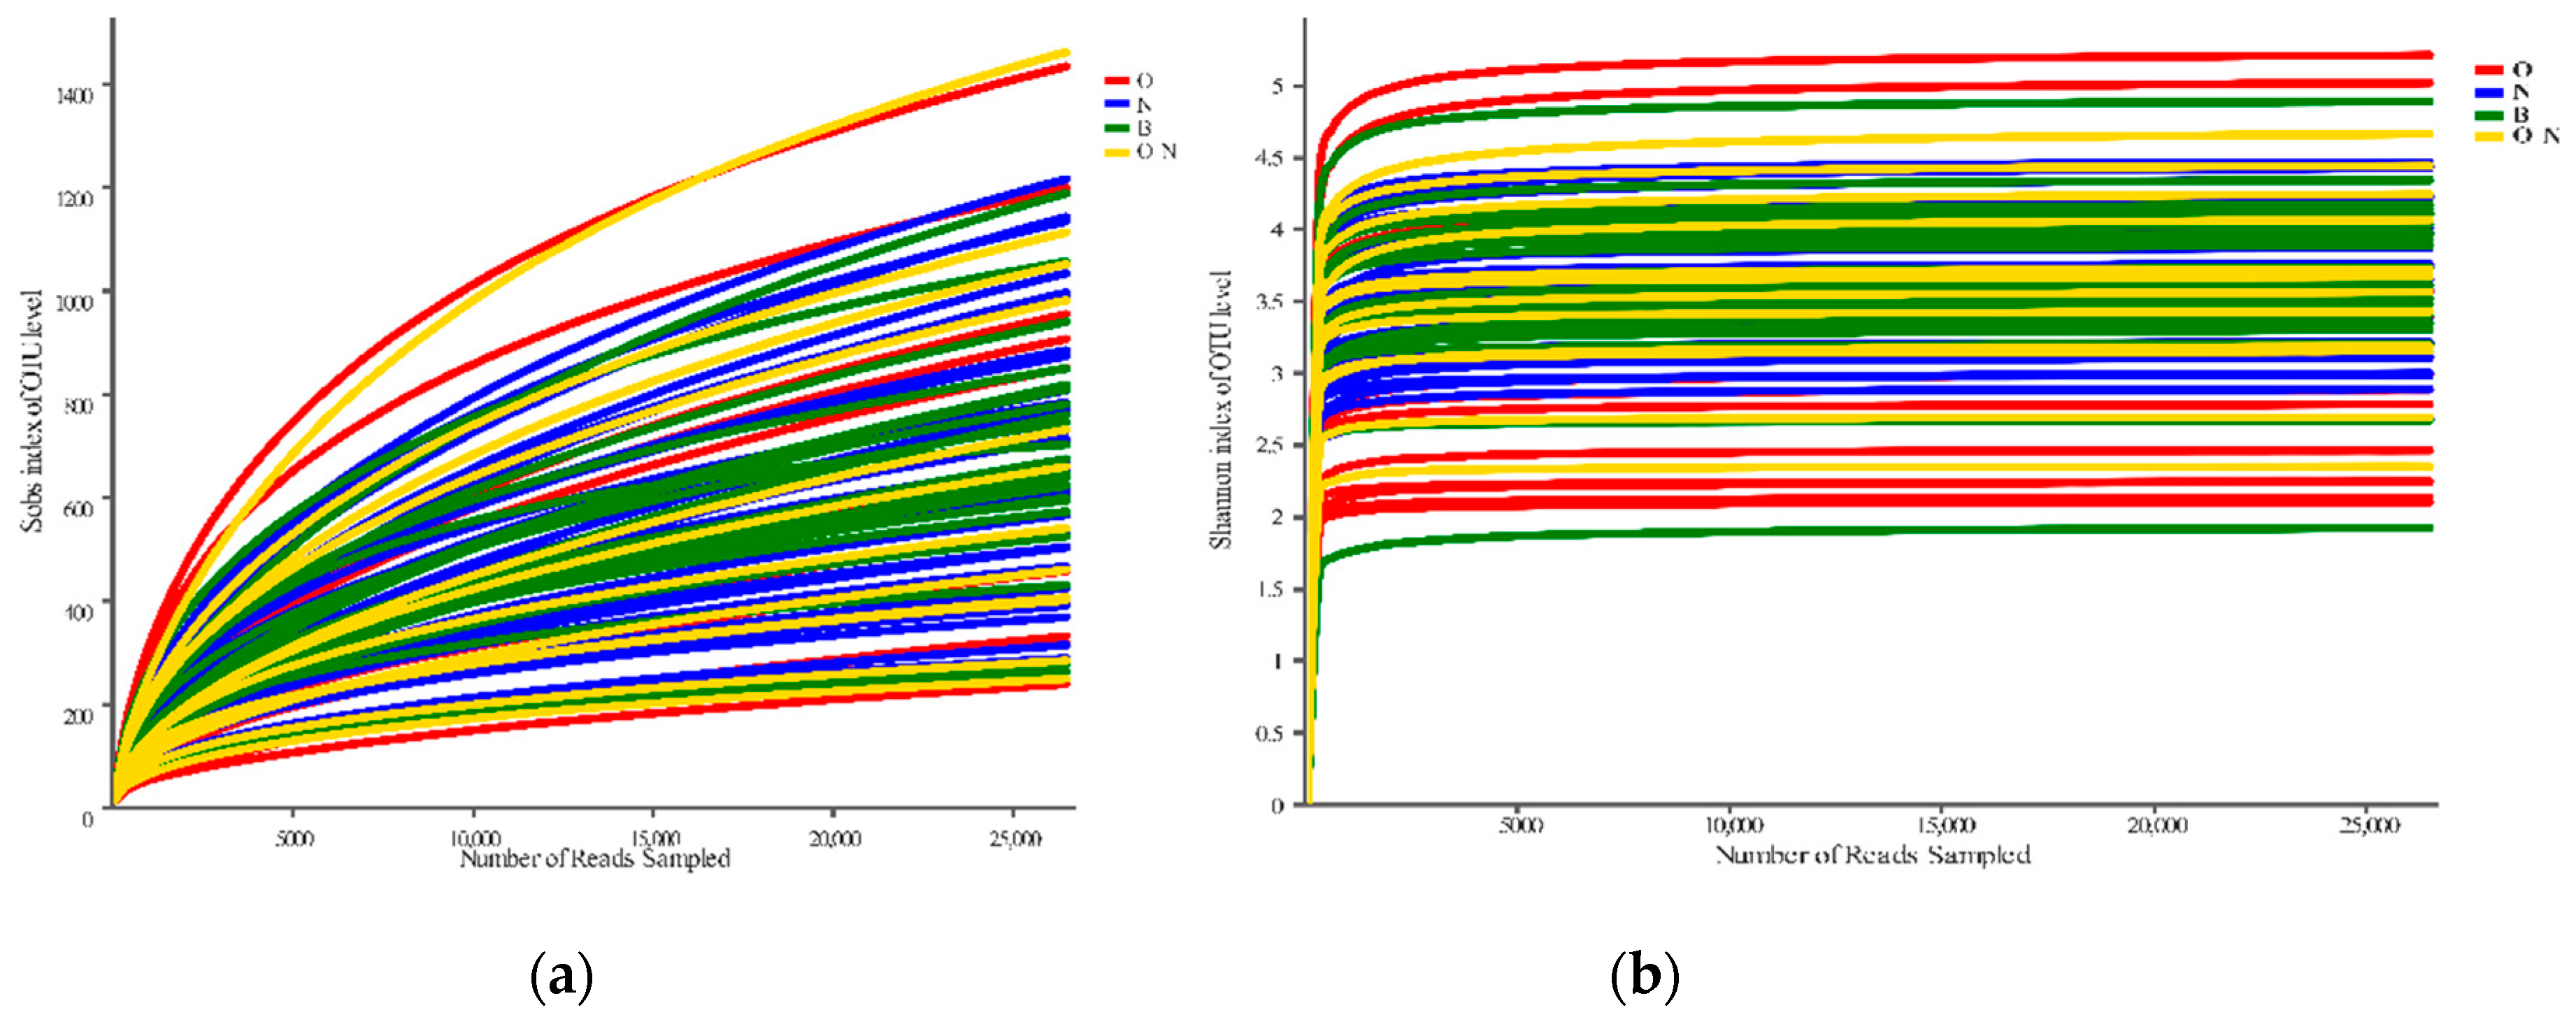
The samples were subjected to a rarefaction analysis to evaluate whether the sequencing data were sufficient to cover all taxa. The Sobs and Shannon rarefaction curves for the 76 samples are shown in Figure 3. The curves of all samples appear to level off; in other words, further increasing the size of sequencing data did not contribute to the discovery of OTUs. This result indicates that the OTU coverage of the samples was generally saturated, and that the size of sequencing data and the result of resampling were reasonable, with very high reliability.
To test whether our grouping scheme used was reliable, the Anosim analysis based on the Bray–Curtis distance was performed. This analysis could determine whether the difference between groups was significantly larger than the difference within groups. Based on the Anosim analysis, the R2 value of 0.33 (p = 0.001) was obtained for the grouping scheme. This result suggests that the difference between groups was significantly larger than the difference within groups (p < 0.05), with a high degree of explanation (R2 > 0.25). Thus, the grouping scheme had high reliability.
Based on the grouping, the samples were analyzed by hierarchical clustering (Figure 4). Samples of group O were generally gathered in four clusters of the phylogenetic tree, those of group N were gathered in two clusters, and those of group O_N were gathered in three clusters. The remaining samples appeared in group B. Samples of groups O and N showed relatively distant phylogenetic relationships. These results indicate that our grouping scheme distinguished samples with organic contamination and nitrate contamination well and could therefore be used for subsequent correlation analysis. The samples of group O and O_N are scattered on the OTU clustering tree; this may be related to the wide variety of organic reactants and products from biochemical reactions on the regional scale.

4. Discussion

4.1. Characteristics of Microbial Diversity and Community Structure

First, alpha diversity analysis, beta diversity analysis, and Venn diagram analysis were performed to clarify whether there existed a response relationship in microbial community structure and diversity to organic contamination and nitrate contamination.
The analysis of alpha diversity indexes can display species diversity information such as community coverage, richness, and diversity of the samples (Table 2). The coverage index reflects the community coverage by the sequencing results. For all four groups, their mean coverage index was 0.989 or higher. Our sequencing thus demonstrated high community coverage, and the data had high reliability.
The Chao, ACE, and Sobs indexes are used to analyze a community’s species richness, and higher index values indicate higher species richness contained in a sample. On the whole, group N was ranked highest, while group O was the lowest for the Chao, ACE, and Sobs indexes among the four groups. This result indicates that nitrate contamination increased microbial richness, while organic contamination reduced it.
The Shannon and Simpson indexes reflect species diversity in a sample. These two indexes not only reflect species richness, but also indicate species evenness. A higher Shannon index value (or smaller the Simpson index value) indicates a higher number and more uniform distribution of species in a sample. The Shannon index is more sensitive to species richness, while the Simpson index is more sensitive to species evenness. Comparing the four groups of samples, group B had the largest Shannon index, while group O had the smallest value. With regard to the Simpson index, group O had the largest value and group N had the smallest value.
Taking into account alpha diversity indexes, organic contamination reduced a microbial community’s species richness.
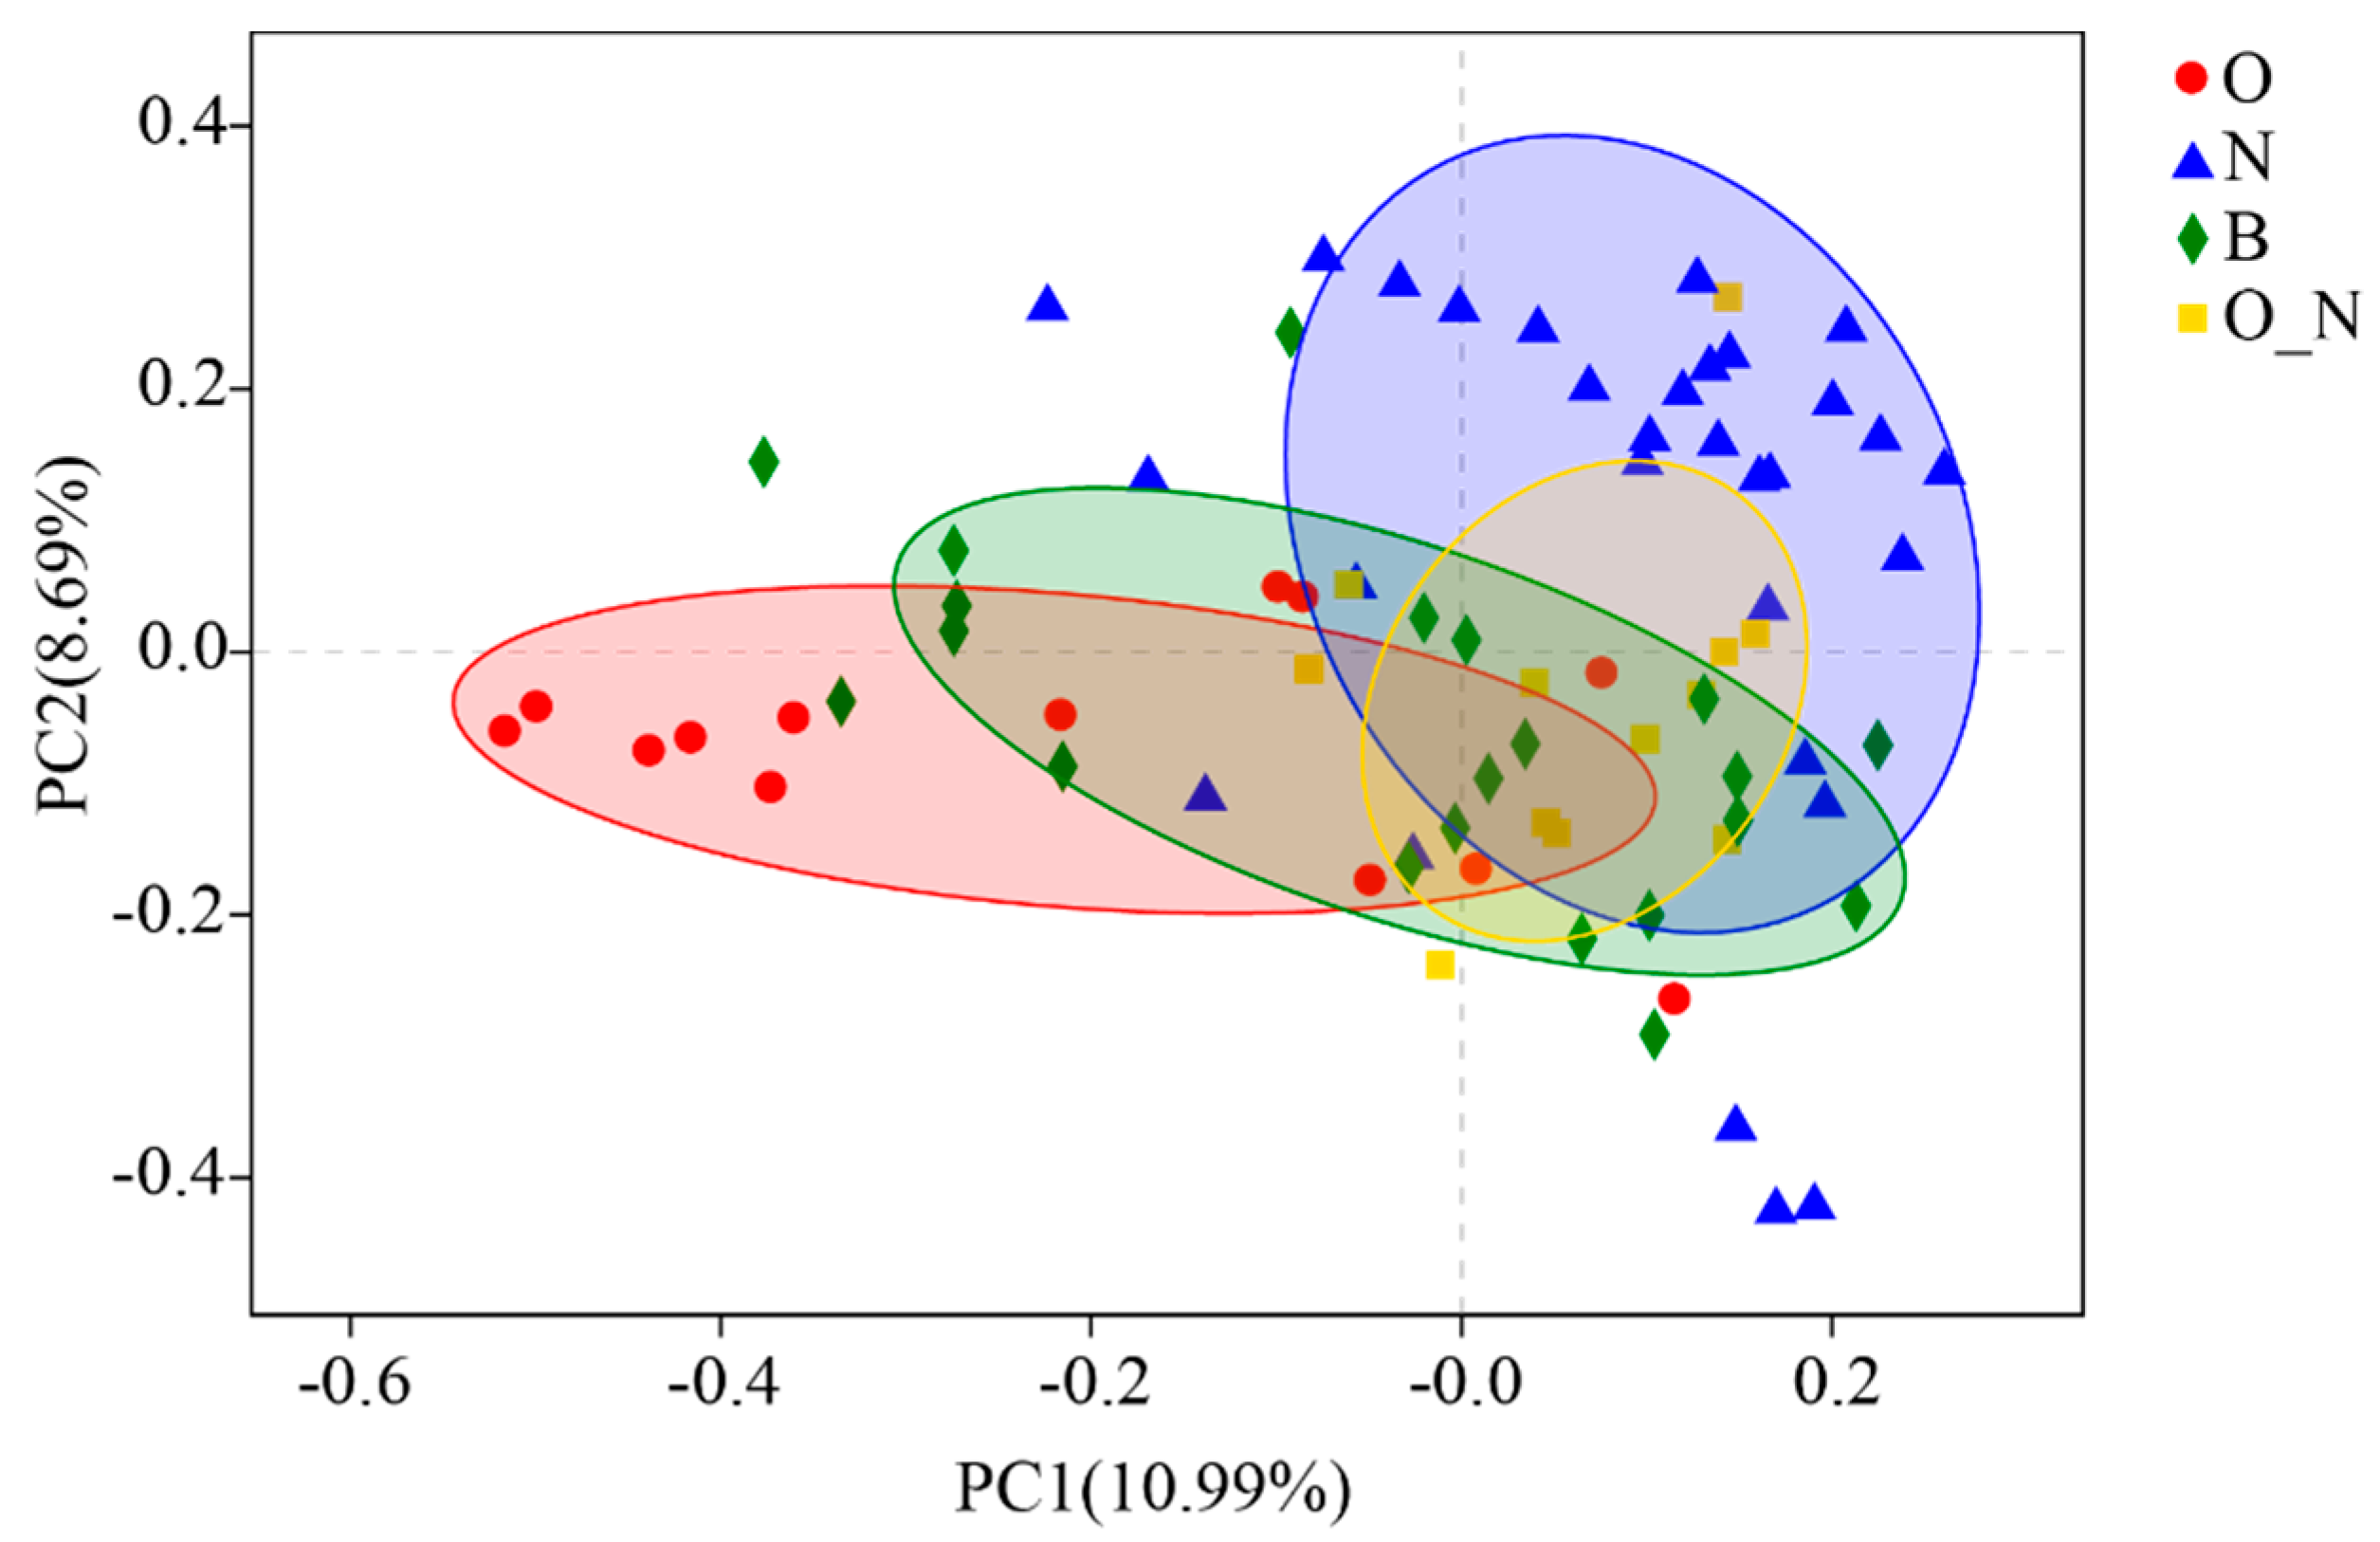
Beta diversity analysis provides more microbial diversity results between groups than alpha diversity analysis. Here, a PCoA analysis of beta diversity was performed using the Bray–Curtis distance algorithm. This algorithm not only reflects the richness difference of various species, but also includes the species differences between samples. As shown in Figure 5, samples of group N (nitrate contamination) were mainly concentrated in quadrants I and IV, showing a considerable difference compared with the diversity of groups B (background), O (organic contamination), and O_N (organic-nitrate contamination). This difference suggests that group N harbored distinct species that were considerably different from those in groups B, O, and O_N groups. Groups O, B, and O_N were all distributed in quadrants II, III, and IV. However, the distribution range of group O was substantially overlapped with that of group B, indicating that the microbial diversity of organic-contaminated samples was similar to some background samples. Samples of group O_N were distributed at the junction of groups B, N, and O, indicating that the microbial diversity of samples contaminated by organic-nitrate was similar to samples of the background, nitrate contamination, and organic contamination groups.
In summary, contamination caused changes in the microbial diversity of communities in the contaminated areas. Under nitrate contamination, the microbial diversity showed distinct changes that were substantially different from the background group, while organic contamination caused less change.
According to the taxonomic assignment of 6201 OTUs, all species in the samples belonged to 58 phyla, 149 classes, 286 orders, 513 families, 987 genera, and 1881 species, with relatively rich species composition. A Venn diagram was used to analyze the number of common and unique OTUs in groups B, O, N, and O_N at the OTU level. The species composition of different groups was compared and the results are presented in Figure 6. Groups B, O, N, and O_N contained 4178, 3596, 4468, and 3416 microbial OTUs, including 448, 408, 517, and 242 unique OTUs, respectively. These four groups shared 1787 common OTUs. According to these results, nitrate contamination resulted in the richer microbial composition, with more species differing from the background group, whereas organic-nitrate contamination resulted in fewer unique OTUs.

4.2. Microbial Indicators Related to Contamination

Based on the above analysis, the samples were characterized by rich microbial community structure and diversity. To use this information for the functional indication of groundwater contamination, further analysis and selection would be needed. First, the representative microorganisms in each group were identified; second, the indicative role of representative microorganisms in groundwater contamination was determined according to their relationship with contamination-related environmental factors; and finally, the indicative role was verified by comparing it with existing studies. As such, the functional indicator microorganisms were identified for groundwater contamination.
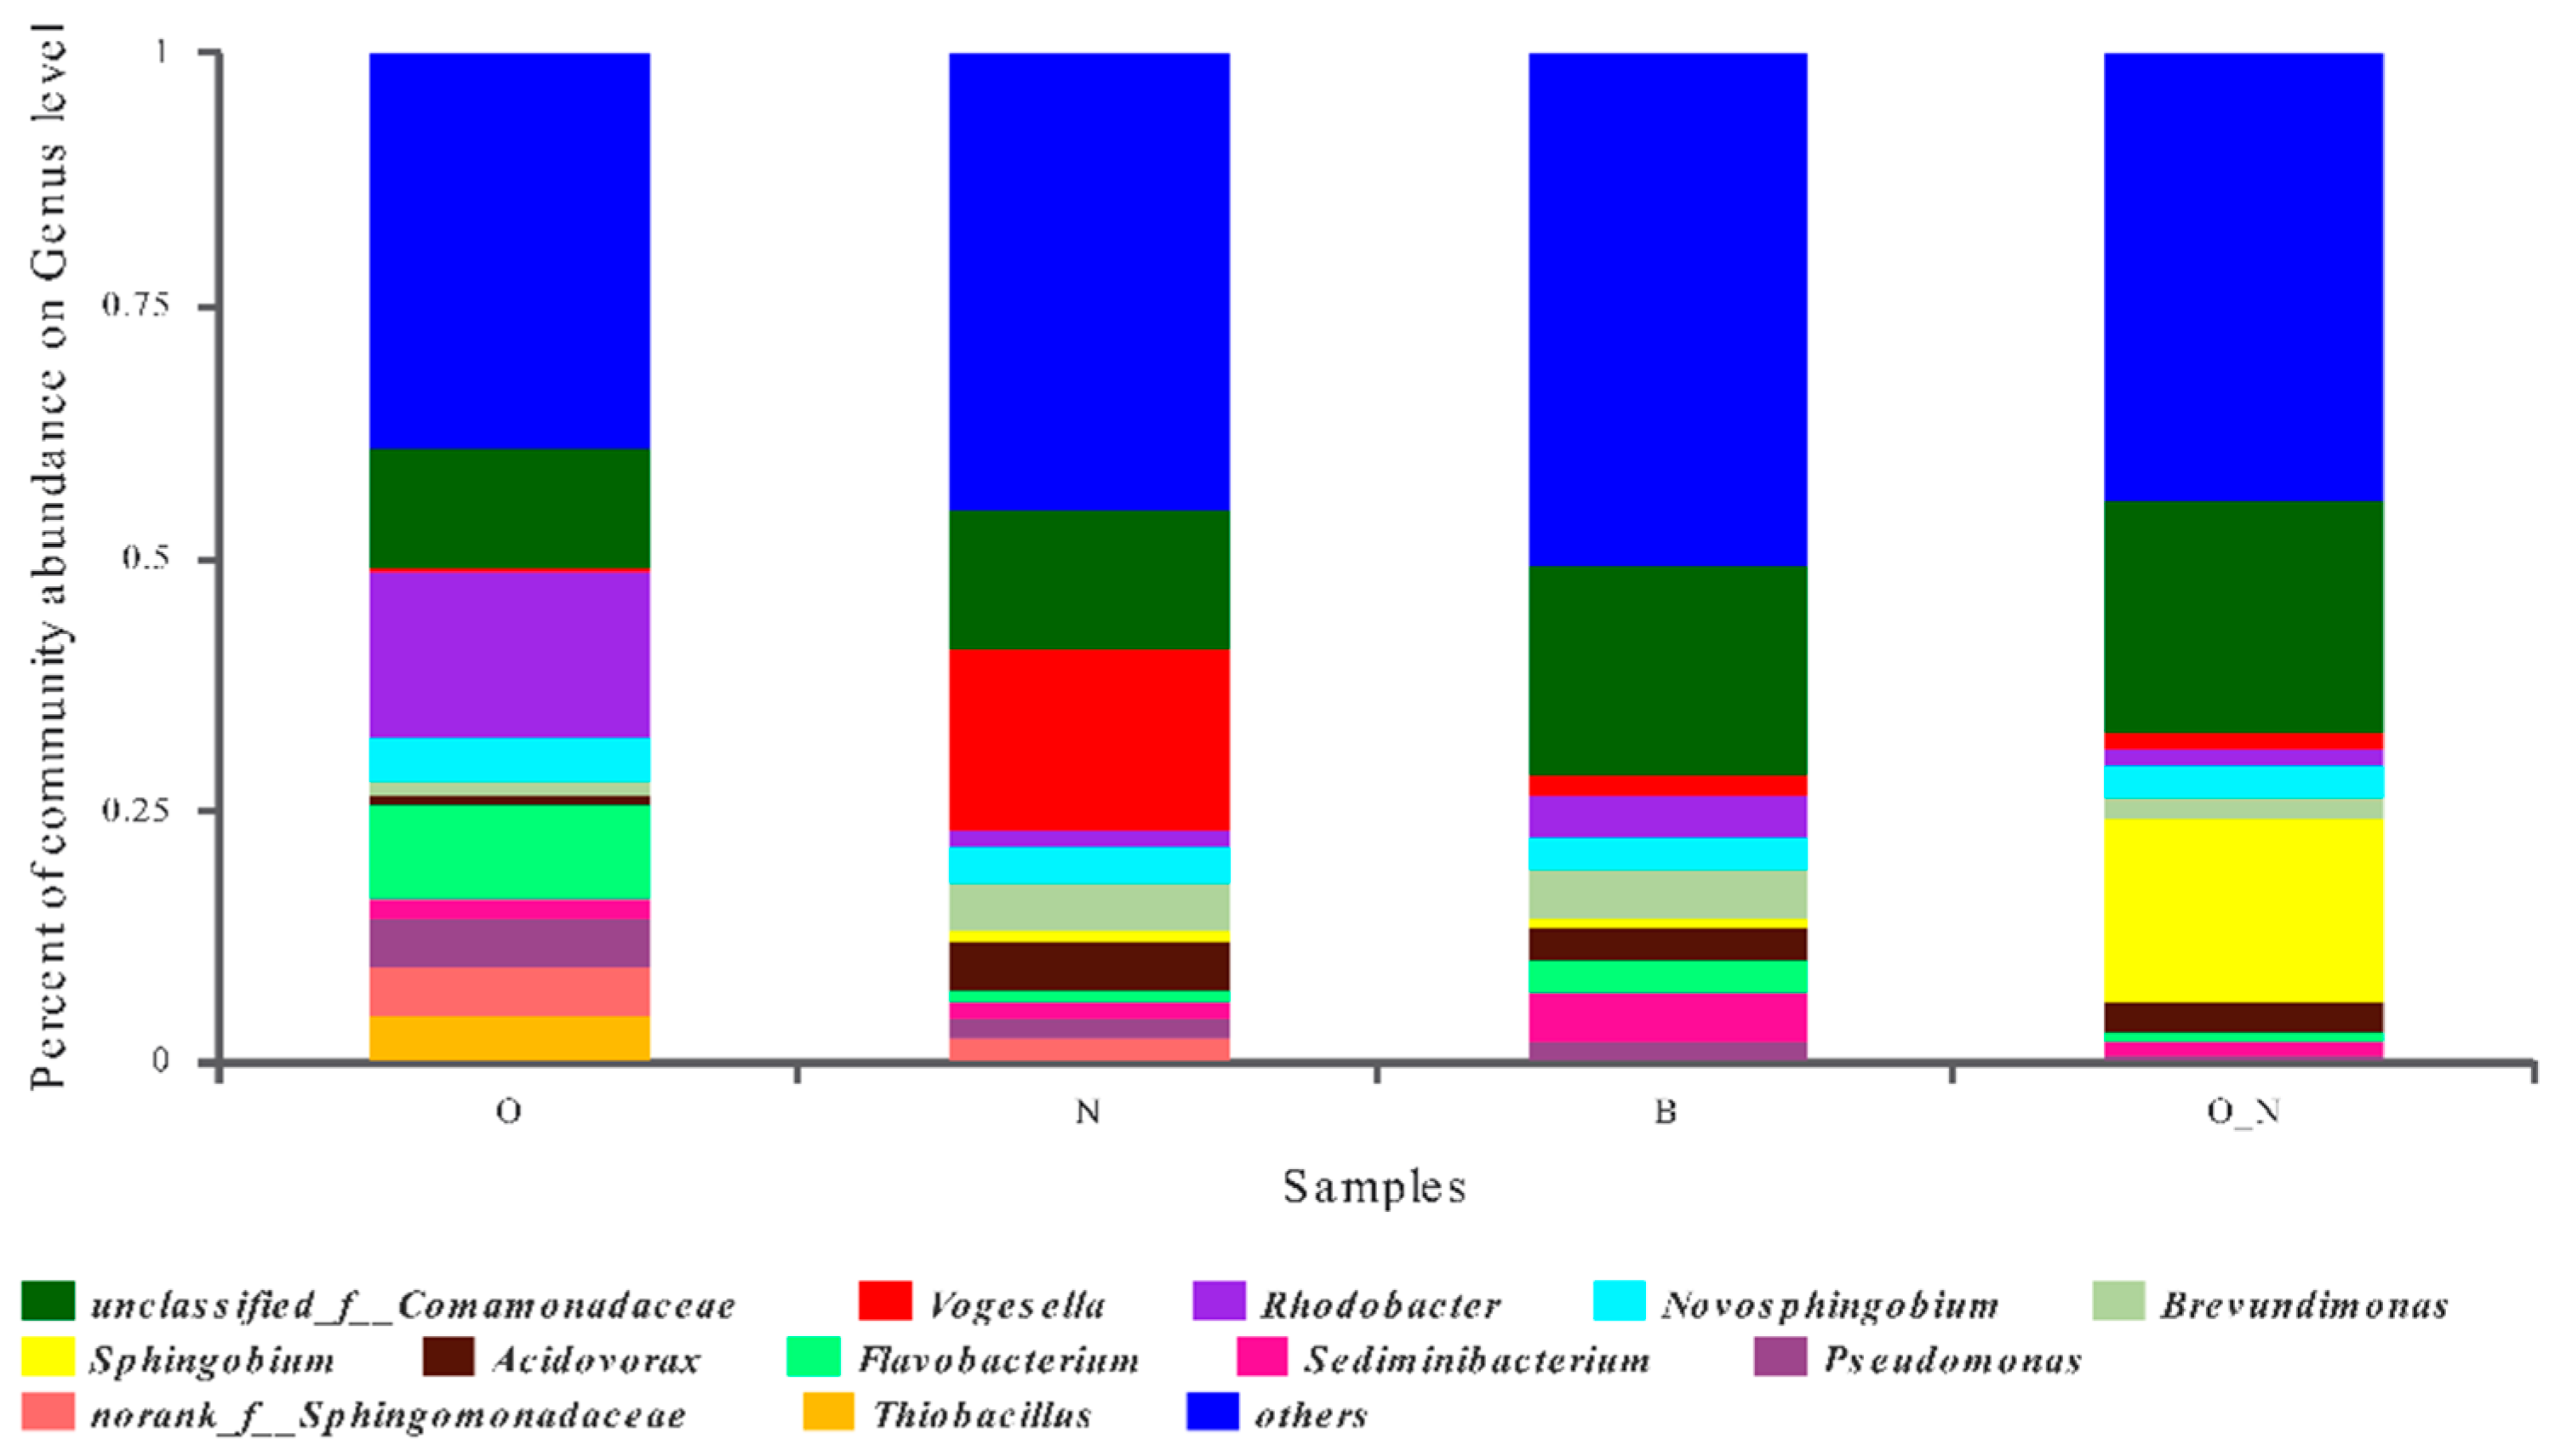
The analysis of representative microorganisms included a community composition analysis and a test of significant difference between groups. The samples’ community composition at the genus level is shown in Figure 7. The information mainly covered: (1) Genus composition of microorganisms in different groups; (2) relative abundance of microorganisms in each group. The unclassified_f_Comamonadaceae was widely distributed in different groups, and its abundance by group was ranked as O_N > B > N > O. Vogesella was more abundant in group N, amounting to 17.74% within the group. The abundance of Rhodobacter, Flavobacterium and Pseudomonas was higher in group O, accounting for 16.45%, 9.41% and 4.85% within the group, respectively. Sphingobium showed a higher abundance in group O_N, accounting for 18.05% within the group. Novosphingobium, Brevundimonas, Acidovorax, and Flavobacterium were found in all groups, though their abundances were low. These results suggest that nitrate contamination promoted the growth of Vogesella, organic contamination facilitated the growth of Rhodobacter, whereas organic-nitrate contamination contributed to the growth of Sphingobium. Despite their relatively high abundance, whether these genera were representative between groups and could distinguish between groups needs to be verified by a test of significant difference between groups.
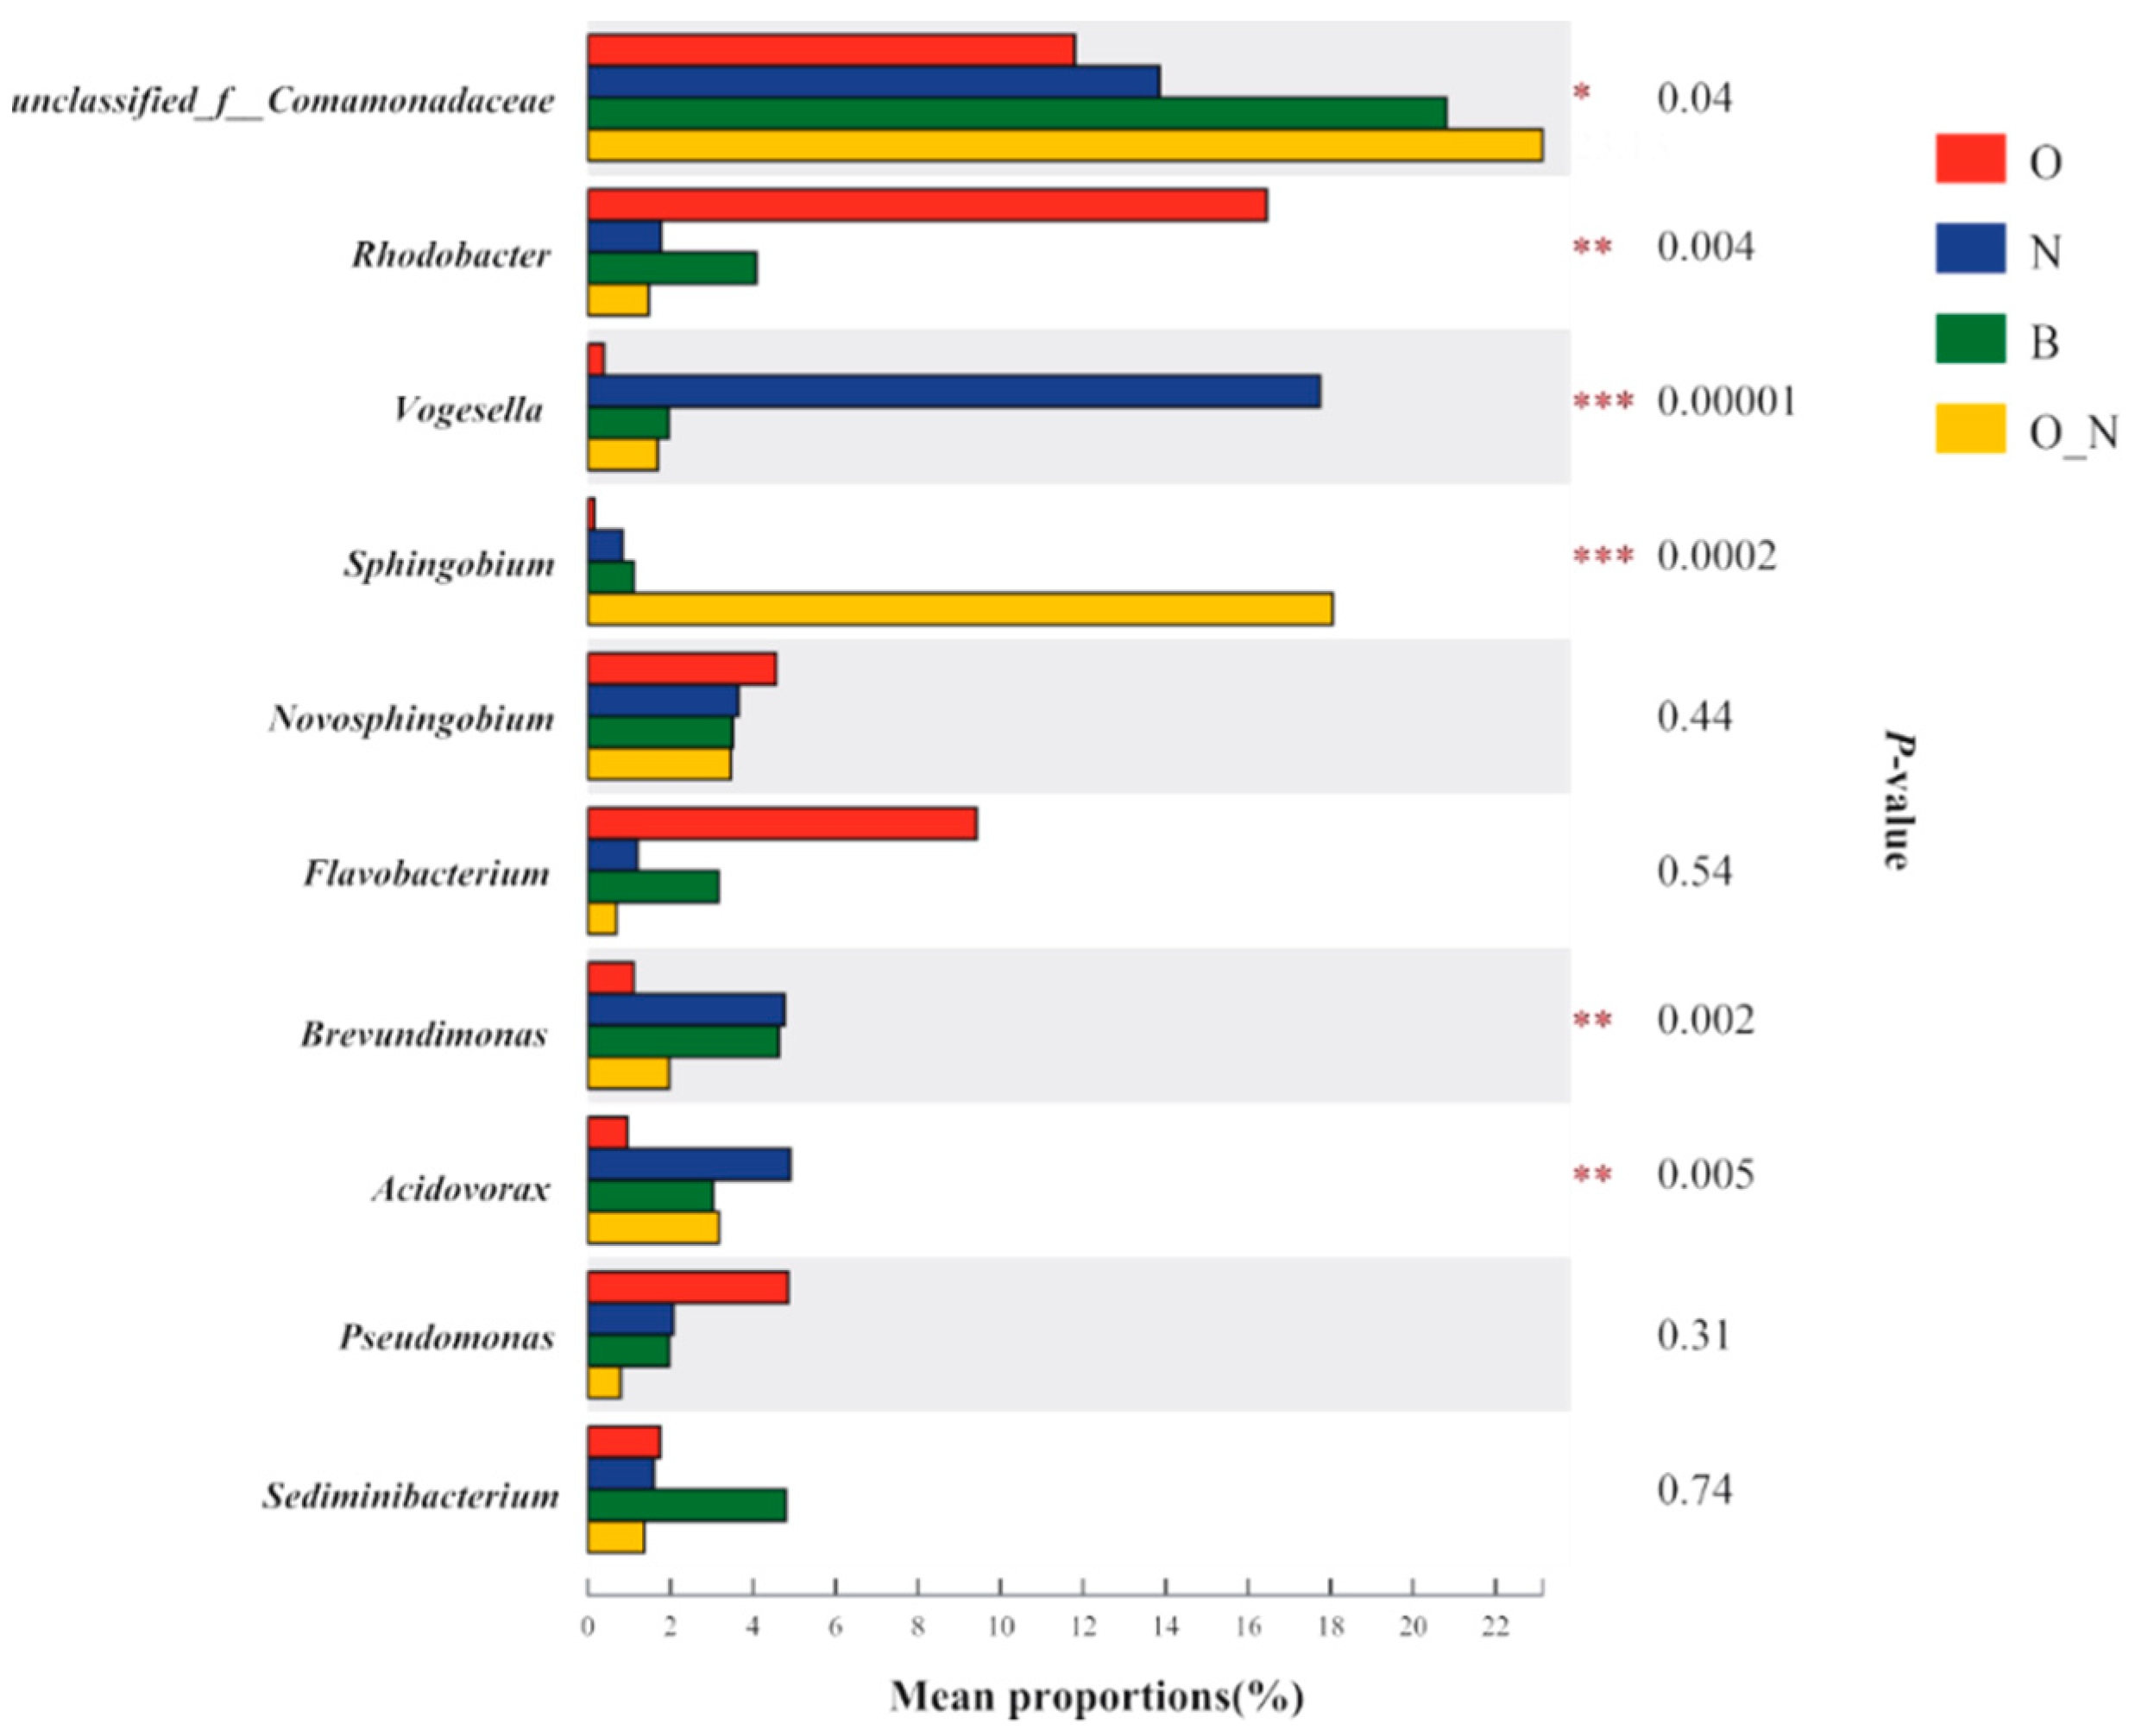
The test of significant difference between groups can evaluate the significance level of difference in species abundance, and therefore obtain the representative microorganisms between groups. Here, the Kruskal–Wallis H test was used to examine significant difference between groups and identify representative microorganisms (Figure 8).
In group O, the abundance of Rhodobacter was highest and showed a significant difference to other three groups (p = 0.004). The abundance of Vogesella in group N appeared to be highest, and its abundance was significantly different to other three groups (p = 0.00001). In addition, the abundance of Sphingobium in group O_N was highest and significantly different to the other three groups (p = 0.0002). These microorganisms were identified as representatives of corresponding groups. The remaining genera with relatively high abundance but low difference, such as unclassified_f_Comamonadaceae, could not be used as representative microorganisms to distinguish between various groups. Although Brevundimonas and Acidovorax showed significant differences, their abundance was relatively high in more than two groups, and therefore could not be used to distinguish between different groups. As for Novosphingobium, Flavobacterium, Pseudomonas, and Sediminibacterium, despite their relatively high abundance, no significant differences were observed between groups and these were not taken as representative microorganisms.
To analyze whether the representative microorganisms selected from each group were functional indicator microorganisms, we first determined the relationship between representative microorganisms and contamination-related environmental factors and clarified whether the representative microorganisms in the samples played an indicative role for environmental changes. Next, we explored the roles of these representative microorganisms in purifying the ecosystem and identified representative microorganisms that were indicators of contamination and had self-purification effects as functional indicator microorganisms.
The relationship between representative microorganisms and groundwater contamination-related environmental factors was revealed using a correlation heatmap (Figure 9).
In group O, Rhodobacter was positively correlated with COD and negatively correlated with NO3 and DO; these relationships indicate that Vogesella is an anaerobic and not related to nitrate contamination. In group N, Vogesella had a good correlation with NO3, while it was also significantly positively correlated with DO and significantly negatively correlated with COD. These relationships suggest that Vogesella is aerobic and not related to organic contamination. In group O_N, Sphingobium was positively correlated with COD and NO3, but not correlated with DO; these relationships indicate that Sphingobium comprises pollutant-degrading microorganisms in the organic-nitrate contamination area.
Previous studies have shown that the representative microorganisms of group O, Rhodobacter, could degrade organic compounds such as petroleum hydrocarbons [37] and pesticides [38] in the ecosystem. Members of Rhodobacter mainly produce biosurfactants to promote the degradation of organic compounds. The representative microorganisms of group N, Voesella, are a group of denitrifying bacteria capable of reducing nitrate to nitrite [39]. This genus has also been isolated in spring water, where it plays a role in aerobic denitrification [40]. Therefore, Voesella does have indication and purification effects on nitrate contamination. The representative microorganisms of group O_N, Sphingobium, are widely found organic-degrading bacteria, which can degrade polycyclic aromatic hydrocarbons [41], aromatic hydrocarbons [42], and hexachlorobenzene [43], as well as perform aerobic denitrification [44,45]. These findings clearly demonstrate the indicative and self-purifying roles that Sphingobium plays in organic-nitrate contamination. Based on the above analysis, we identified the functional indicator microorganisms to be Rhodobacter in group O, Vogesella in group N, and Sphingobium in group O_N. These three groups of microorganisms can be used for subsequent studies on molecular biodiagnosis of groundwater contamination in this region.
For the microorganisms present in the shallow groundwater of the Tanghe-Dasha River Basin, group N showed the highest diversity while group O had a relatively low diversity. The possible mechanism may be that the microbial community structure responded to groundwater contamination, that is, microorganisms differing from the background occurred in the ecosystem. Those genera with significant differences in this area and significant dominance in a particular contamination group can serve as indicators for groundwater contamination.
In this study, an attempt was made to standardize the number of samples in each group. However, the number of samples in each group did not match the expectations due to the complexity of groundwater hydrogeology, the heterogeneity of strata lithology, and the nonlinearity of contamination diffusion. Although this discrepancy would not affect the analyses of microbial community structure and functional indicator microorganisms, it might lead to deviations in the quantitative analysis of relevant microorganisms between groups. Therefore, regional hydrogeological features should be combined more fully in the future when designing the distribution of sampling points. Here, the indicators of organic and nitrate contamination—NO3, COD, and DO—were selected as environmental factors and used as representatives to analyze the response of microbial community structure. In the groundwater ecosystem, there exist many environmental factors related to the contamination process. In-depth studies on the response relationship between microbial community structure and other environmental variables should be carried out to reveal a more comprehensive response mechanism of microorganisms to groundwater contamination.

5. Conclusions

1. The grouping of samples using the cumulative probability distribution method, and the acquired inflection point, were close to the thresholds in the Chinese standard for groundwater quality.
2. The O group exhibited lower diversity than other groups. Community structure analysis indicated that Rhodobacter, Vogesella, and Sphingobium dominated in the O_N group, N group, and O group, respectively, and accounted for 18.05%, 17.74%, 16.45% in each group at genus level, respectively.
3. The functional indicator microorganisms related to organic contamination, nitrate contamination and organic-nitrate contamination were Rhodobacter, Vogesella and Sphingobium, respectively.

Author Contributions

Data curation, Z.N.; formal analysis, Z.H.; investigation, H.C. and H.W; writing—original draft, Z.H.; writing—review and editing, Z.H. and M.Y.; supervision, J.S.; project administration, M.Y. and G.H.

Funding

This study was financially supported by the National Key R&D Program of China (2018YFC1803002), China Geological Survey Program (DD20160309), the National Natural Science Foundation of China (41602261).

Acknowledgments

We are very thankful to anonymous reviewers for comments and suggestions on the manuscript. We thank Jeremy kamen PhD from Liwen Bianji, Edanz Editing China (www.liwenbianji.cn/ac), for editing the English text of a draft of this manuscript.

Conflicts of Interest

The authors declare no conflict of interest. The founding sponsors had no role in the design of the study; in the collection, analyses, or interpretation of data; in the writing of the manuscript, and in the decision to publish the results.

References

  1. Steube, C.; Richter, S.; Griebler, C. First attempts towards an integrative concept for the ecological assessment of groundwater ecosystems. Hydrogeol. J. 2009, 17, 23–35. [Google Scholar] [CrossRef]
  2. Struckmeier, W.; Rubin, Y.; Jones, J. Groundwater-Reservoir for a Thirsty Planet? Earth Sciences for Society; a Prospectus for a Key Theme of the International Year of Planet Earth; IUGS International Union of Geological Sciences Secretariat, Geological Survey of Norway: Trondheim, Norway, 2005. [Google Scholar]
  3. Hu, K.; Huang, Y.; Li, H.; Li, B.; Chen, D.; White, R.E. Spatial variability of shallow groundwater level, electrical conductivity and nitrate concentration, and risk assessment of nitrate contamination in North China Plain. Environ. Int. 2005, 31, 896–903. [Google Scholar] [CrossRef]
  4. Liu, C.; Yu, J.; Kendy, E. Groundwater Exploitation and Its Impact on the Environment in the North China Plain. Water Int. 2001, 26, 265–272. [Google Scholar] [CrossRef]
  5. Gu, X.; Xiao, Y.; Yin, S.; Hao, Q.; Liu, H.; Hao, Z.; Meng, G.; Pei, Q.; Yan, H. Hydrogeochemical characterization and quality assessment of groundwater in a long-term reclaimed water irrigation area, North China Plain. Water 2018, 10, 1209. [Google Scholar] [CrossRef]
  6. Shi, J.; Wang, Z.; Zhang, Z.; Fei, Y.; Yasong, L.I.; Zhang, F.; Chen, J. Preliminary analysis on the organic contamination of groundwater in the North China Plain. Ecol. Environ. Sci. 2011, 20, 1695–1699. [Google Scholar] [CrossRef]
  7. Li, F.; Tang, C.; Yang, Y.; Zhang, Q.; Liu, C.; Zhang, W. Nitrate contamination of groundwater in the alluvial fans of the Taihang Mts and Yanshan Mts. IAHS Publ. 2008, 43, 579–603. [Google Scholar] [CrossRef]
  8. Volkmer, B.G.; Ernst, B.; Simon, J.; Kuefer, R.; Bartsch, G.; Bach, D.; Gschwend, J.E. Influence of nitrate levels in drinking water on urological malignancies: A community-based cohort study. Br. J. Urol. Int. 2015, 95, 972–976. [Google Scholar] [CrossRef]
  9. Farhadian, M.; Vachelard, C.; Duchez, D.; Larroche, C. In situ bioremediation of monoaromatic pollutants in groundwater: A review. Bioresour. Technol. 2008, 99, 5296–5308. [Google Scholar] [CrossRef] [PubMed]
  10. Anderson, R.T.; Lovley, D.R. Ecology and Biogeochemistry of in Situ Groundwater Bioremediation; Springer: Boston, MA, USA, 1997; pp. 289–350. [Google Scholar] [CrossRef]
  11. Khodaei, K.; Nassery, H.R.; Asadi, M.M.; Mohammadzadeh, H.; Mahmoodlu, M.G. BTEX biodegradation in contaminated groundwater using a novel strain (Pseudomonas sp. BTEX-30). Int. Biodeterior. Biodegrad. 2017, 116, 234–242. [Google Scholar] [CrossRef]
  12. Cunningham, J.A.; Rahme, H.; Hopkins, G.D.; Lebron, C.; Reinhard, M. Enhanced in situ bioremediation of BTEX-contaminated groundwater by combined injection of nitrate and sulfate. Environ. Sci. Technol. 2001, 35, 1663–1670. [Google Scholar] [CrossRef] [PubMed]
  13. Ministry of Land and Resources of the People’s Republic of China. Specification for Regional Groundwater Contamination Survey and Evaluation. In DZT0288-2015; Ministry of Land and Resources of the People’s Republic of China: Beijing, China, 2015. [Google Scholar]
  14. Heide, S.; Claudia, K.; Schmidt, S.I.; Heike, B.; Christian, S.; Berkhoff, S.E.; Andreas, F.; Hans Jürgen, H.; Barbara, T.; Christian, G. The potential use of fauna and bacteria as ecological indicators for the assessment of groundwater quality. J. Environ. Monit. 2010, 12, 242–254. [Google Scholar] [CrossRef]
  15. Ning, Z.; Zhang, M.; He, Z.; Cai, P.; Guo, C.; Wang, P. Spatial Pattern of Bacterial Community Diversity Formed in Different Groundwater Field Corresponding to Electron Donors and Acceptors Distributions at a Petroleum-Contaminated Site. Water 2018, 10, 842. [Google Scholar] [CrossRef]
  16. Wright, J.; Kirchner, V.; Bernard, W.; Ulrich, N.; McLimans, C.; Campa, M.F.; Hazen, T.; Macbeth, T.; Marabello, D.; McDermott, J. Bacterial Community Dynamics in Dichloromethane-Contaminated Groundwater Undergoing Natural Attenuation. Front. Microbiol. 2017, 8, 2300. [Google Scholar] [CrossRef]
  17. He, Z.; Zhang, P.; Wu, L.; Rocha, A.M.; Tu, Q.; Shi, Z.; Wu, B.; Qin, Y.; Wang, J.; Yan, Q. Microbial functional gene diversity predicts groundwater contamination and ecosystem functioning. mBio 2018, 9, e02435-17. [Google Scholar] [CrossRef]
  18. Falkowski, P.G.; Tom, F.; Delong, E.F. The microbial engines that drive Earth’s biogeochemical cycles. Science 2008, 320, 1034–1039. [Google Scholar] [CrossRef] [PubMed]
  19. Haack, S.K.; Fogarty, L.R.; West, T.G.; Alm, E.W.; Mcguire, J.T.; Long, D.T.; Hyndman, D.W.; Forney, L.J. Spatial and temporal changes in microbial community structure associated with recharge-influenced chemical gradients in a contaminated aquifer. Environ. Microbiol. 2004, 6, 438–448. [Google Scholar] [CrossRef]
  20. Kao, C.-M.; Liao, H.-Y.; Chien, C.-C.; Tseng, Y.-K.; Tang, P.; Lin, C.-E.; Chen, S.-C. The change of microbial community from chlorinated solvent-contaminated groundwater after biostimulation using the metagenome analysis. J. Hazard. Mater. 2016, 302, 144–150. [Google Scholar] [CrossRef]
  21. Xinshuang, M.; Shengyong, L.; Mingliang, L.; Yinguo, R. Research of Groundwater Prediction Model in Shallow Groundwater Over-Exploitation Zone in the Northern Area. South-to-North Water Divers. Water Sci. Technol. 2011, 9, 134–136. [Google Scholar] [CrossRef]
  22. Zhao, W.; Xiao, L.; Zhu, X.; Chen, H.; Shi, J.; Zhang, Z.; Fei, Y.; Li, Y.; Zhang, F.E.; Chen, J. Transport and sorption of organic contaminants during infiltration from Cihe River to groundwater. In Proceedings of the International Symposium on Water Resource & Environmental Protection, Xi’an, China, 20–22 May 2011. [Google Scholar]
  23. Thompson, L.R.; Sanders, J.G.; Mcdonald, D.; Amir, A.; Ladau, J.; Locey, K.J.; Prill, R.J.; Tripathi, A.; Gibbons, S.M.; Ackermann, G. A communal catalogue reveals Earth’s multiscale microbial diversity. Nature 2017, 551, 457. [Google Scholar] [CrossRef]
  24. Lepeltier, C. A simplified statistical treatment of geochemical data by graphical representation. Econ. Geol. 1969, 64, 538–550. [Google Scholar] [CrossRef]
  25. Matschullat, J.; Ottenstein, R.; Reimann, C. Geochemical background–can we calculate it? Environ. Geol. 2000, 39, 990–1000. [Google Scholar] [CrossRef]
  26. National Standard of the People’s Republic of China. Standard for groundwater quality. In GB/T 14848-2017; National Standard of the People’s Republic of China: Beijing, China, 2017. [Google Scholar]
  27. Chen, B.; Teh, B.S.; Sun, C.; Hu, S.; Lu, X.; Boland, W.; Shao, Y. Biodiversity and Activity of the Gut Microbiota across the Life History of the Insect Herbivore Spodoptera littoralis. Sci. Rep. 2016, 6, 29505. [Google Scholar] [CrossRef]
  28. Ye, J.; Joseph, S.D.; Ji, M.; Nielsen, S.; Mitchell, D.R.G.; Donne, S.; Horvat, J.; Wang, J.; Munroe, P.; Thomas, T. Chemolithotrophic processes in the bacterial communities on the surface of mineral-enriched biochars. ISME J. 2017, 11, 1087–1101. [Google Scholar] [CrossRef]
  29. Dai, J.; Wu, S.; Wu, X.; Xue, W.; Yang, Q.; Zhu, S.; Wang, F.; Chen, D. Effects of Water Diversion from Yangtze River to Lake Taihu on the Phytoplankton Habitat of the Wangyu River Channel. Water 2018, 10, 759. [Google Scholar] [CrossRef]
  30. Nemec, A.F.L.; Brinkhurst, R.O. Using the Bootstrap to Assess Statistical Significance in the Cluster. Can. J. Fish. Aquat. Sci. 1988, 45, 965–970. [Google Scholar] [CrossRef]
  31. Zhou, Z.; Huang, T.; Gong, W.; Li, Y.; Liu, Y.; Zhao, F.; Dou, Y.; Zhou, S.; Ma, W. In Situ Water Quality Improvement Mechanism (Nitrogen Removal) by Water-Lifting Aerators in a Drinking Water Reservoir. Water 2018, 10, 1051. [Google Scholar] [CrossRef]
  32. Wang, Y.; Li, P.; Jiang, Z.; Sinkkonen, A.; Wang, S.; Tu, J.; Wei, D.; Dong, H.; Wang, Y. Microbial Community of High Arsenic Groundwater in Agricultural Irrigation Area of Hetao Plain, Inner Mongolia. Front. Microbiol. 2016, 7, 1917. [Google Scholar] [CrossRef]
  33. Ding, Y.; Liang, Z.; Guo, Z.; Li, Z.; Hou, X.; Jin, C. The Performance and Microbial Community Identification in Mesophilic and Atmospheric Anaerobic Membrane Bioreactor for Municipal Wastewater Treatment Associated with Different Hydraulic Retention Times. Water 2019, 11, 160. [Google Scholar] [CrossRef]
  34. Walega, A.; Młyński, D.; Bogdał, A.; Kowalik, T. Analysis of the course and frequency of high water stages in selected catchments of the upper Vistula basin in the south of Poland. Water 2016, 8, 394. [Google Scholar] [CrossRef]
  35. Peng, M.; Zi, X.; Wang, Q. Bacterial community diversity of oil-contaminated soils assessed by high throughput sequencing of 16S rRNA genes. Int. J. Environ. Res. Public Health 2015, 12, 12002–12015. [Google Scholar] [CrossRef]
  36. Shanghai Majorbio. I-sanger Cloud Platform Home Page. Available online: http://www.i-sanger.com (accessed on 6 February 2018).
  37. Jiao, H.; Luo, J.; Zhang, Y.; Xu, S.; Bai, Z.; Huang, Z. Bioremediation of petroleum hydrocarbon contaminated soil by Rhodobacter sphaeroides biofertilizer and plants. Pak. J. Pharm. Sci. 2015, 28, 1881–1886. [Google Scholar]
  38. Du, J.; Ying, Z.; Ma, Y.; Li, J.; Zhang, Q. Simulation Study of Atrazine-contaminated Soil Biodegradation by Strain W16. Procedia Environ. Sci. 2011, 11, 1488–1492. [Google Scholar] [CrossRef]
  39. Grimes, D.J.; Woese, C.R.; Macdonell, M.T.; Colwell, R.R. Systematic study of the genus Vogesella gen. nov. and its type species, Vogesella indigofera comb. nov. Int. J. Syst. Bacteriol. 1997, 47, 19–27. [Google Scholar] [CrossRef]
  40. Chou, Y.J.; Chou, J.H.; Lin, M.C.; Arun, A.B.; Young, C.C.; Chen, W.M. Vogesella perlucida sp. nov., a non-pigmented bacterium isolated from spring water. Int. J. Syst. Evol. Microbiol. 2008, 58, 2677. [Google Scholar] [CrossRef]
  41. Michael, C.; Kertesz, M.A. Effect of Sphingobium yanoikuyae B1 inoculation on bacterial community dynamics and polycyclic aromatic hydrocarbon degradation in aged and freshly PAH-contaminated soils. Environ. Pollut. 2006, 144, 228–237. [Google Scholar] [CrossRef]
  42. Quanfeng, L.; Gareth, L.J. Sphingobium scionense sp. nov., an aromatic hydrocarbon-degrading bacterium isolated from contaminated sawmill soil. Int. J. Syst. Evol. Microbiol. 2010, 60, 413. [Google Scholar] [CrossRef]
  43. Rup, L.; Mandeep, D.; Kirti, K.; Pooja, S.; Ajaib, S.; Hansi, K.; Simran, J.; Sanjay Kumar, G.; Aeshna, N.; Devi, L. Pseudomonas sp. to Sphingobium indicum: A journey of microbial degradation and bioremediation of Hexachlorocyclohexane. Indian J. Microbiol. 2008, 48, 3–18. [Google Scholar] [CrossRef]
  44. Li, L. Influence of microbial community structure of seed sludge on the properties of aerobic nitrifying granules. J. Environ. Sci. 2015, 35, 144–150. [Google Scholar] [CrossRef]
  45. Pavić, A.; Stanković, S.; Marjanović, Ž. Biochemical characterization of a sphingomonad isolate from the ascocarp of white truffle (Tuber magnatum Pico). Arch. Biol. Sci. 2011, 63, 697–704. [Google Scholar] [CrossRef]
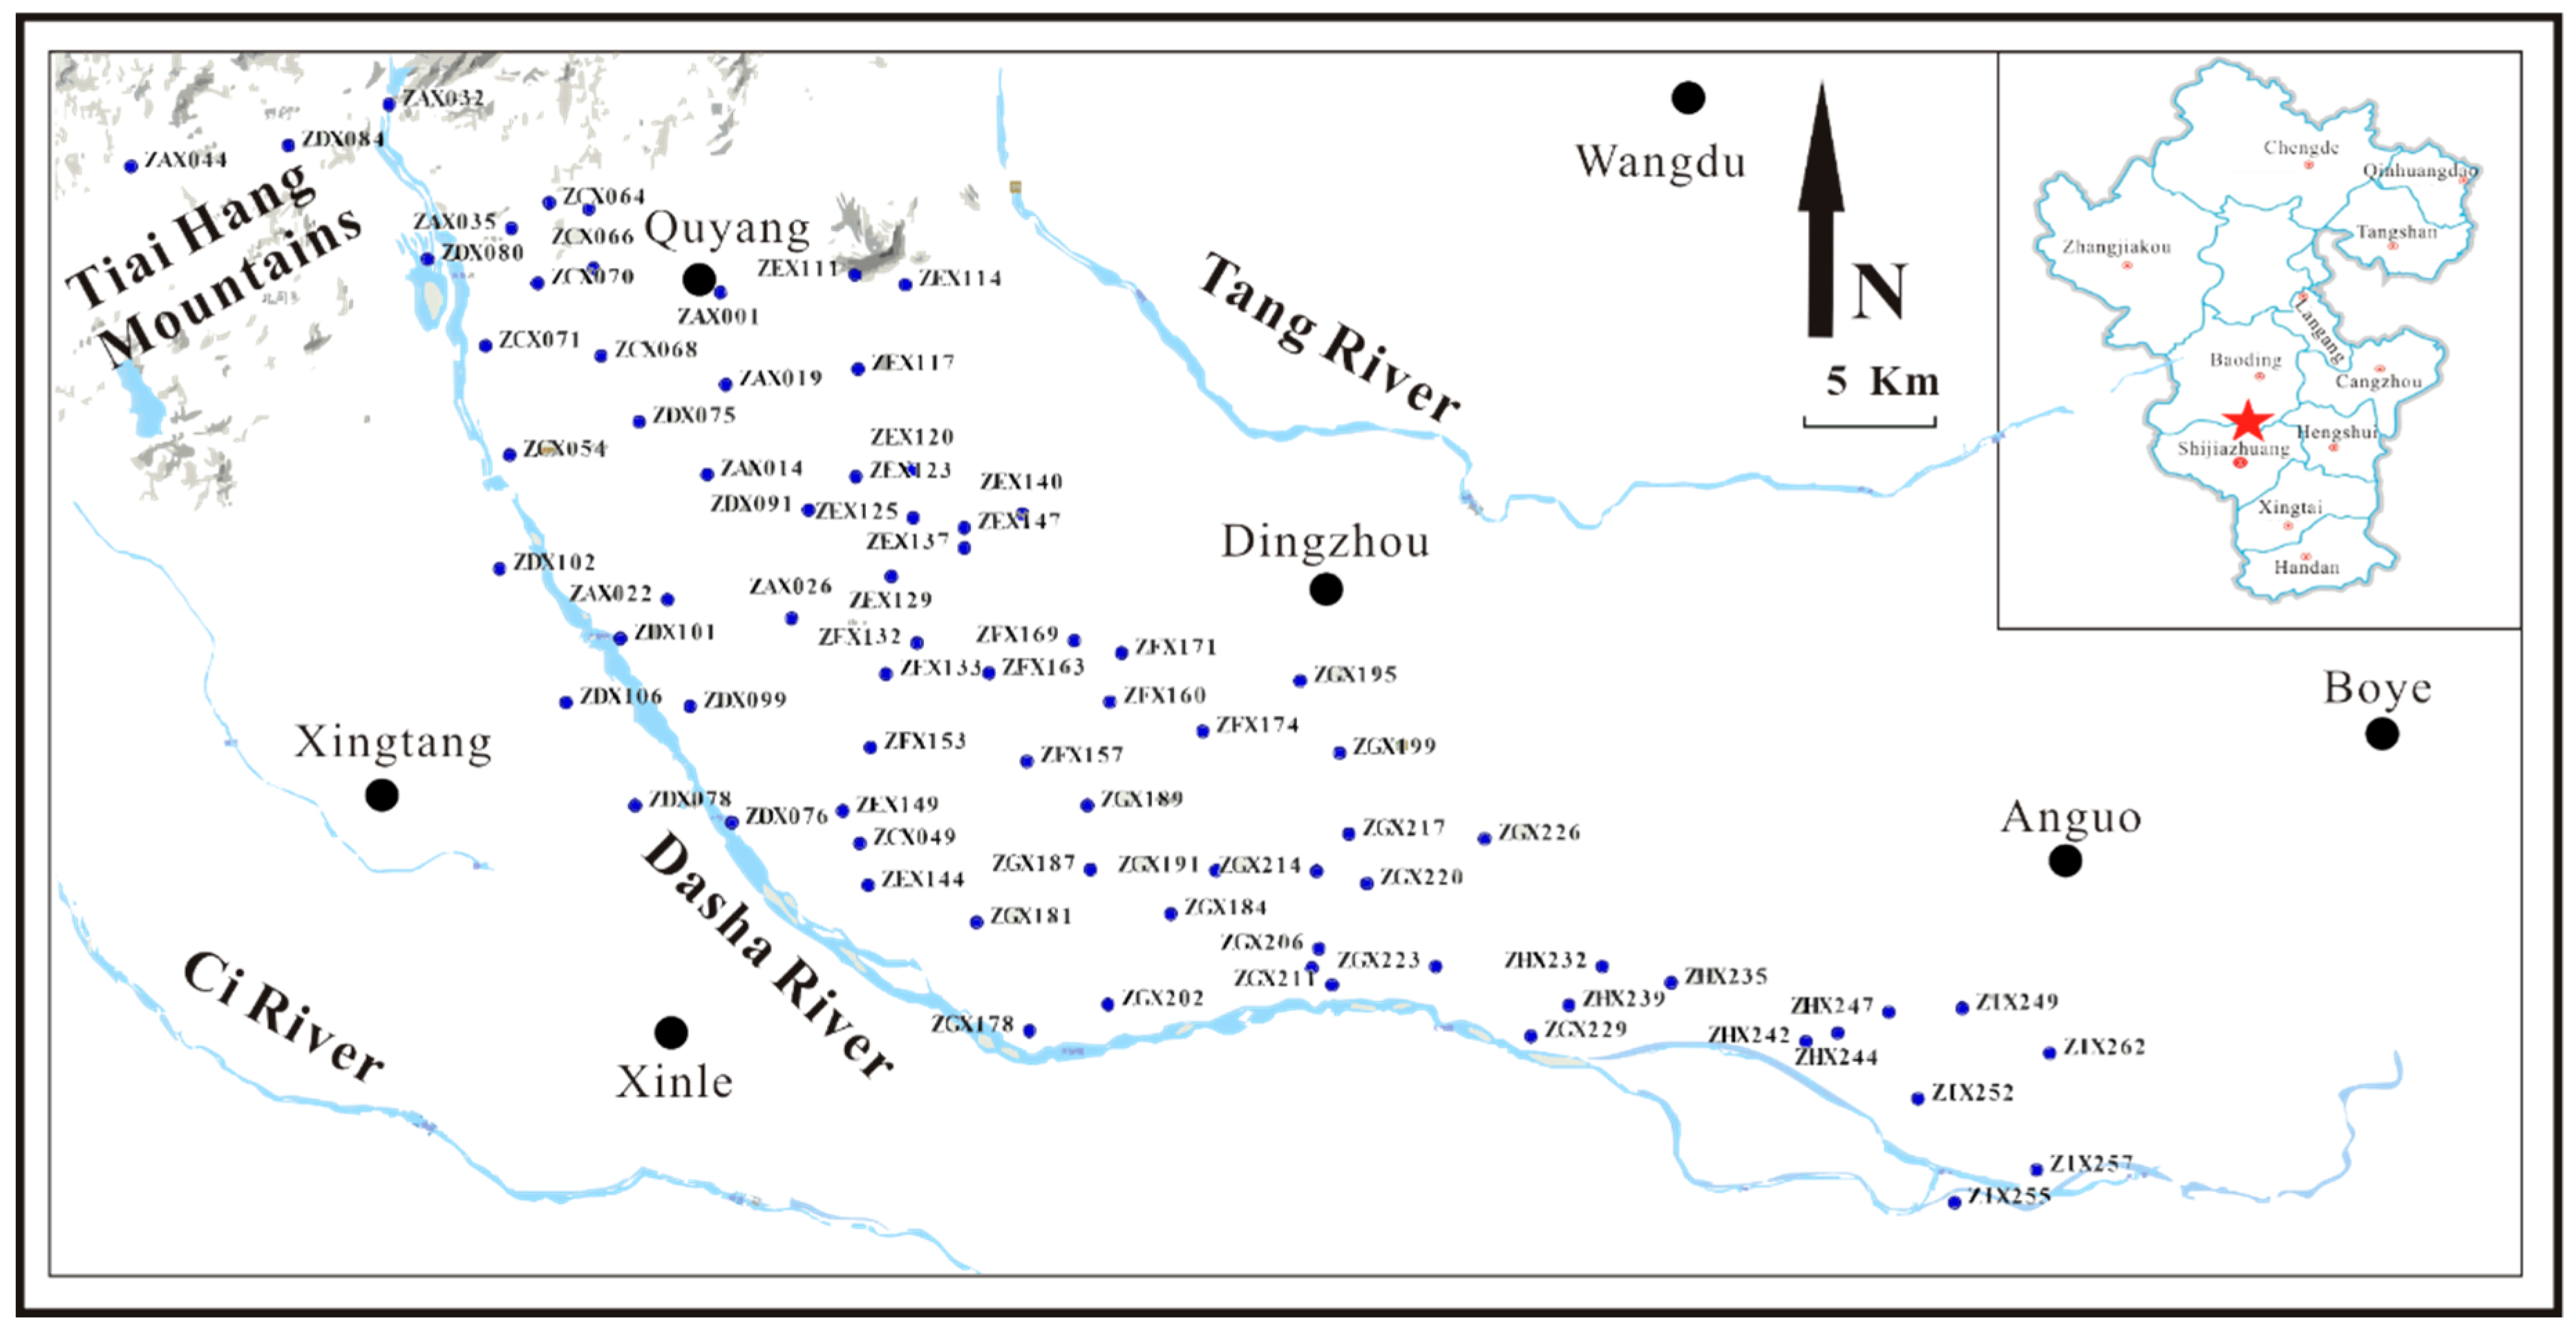
Figure 1. The distribution of shallow groundwater sampling points.
Water 11 00736 g001
Figure 2. Cumulative probability curve analysis of dissolved oxygen (DO), nitrate (NO3), and chemical oxygen demand (COD) concentrations in shallow groundwater.
Water 11 00736 g002
Figure 3. Rarefaction curves of each sample at a cutoff level of 3% sequence dissimilarity: (a) Sample-based rarefaction curves (Sobs) for four groups; (b) species richness estimators (Shannon) for four groups.
Water 11 00736 g003
Figure 4. Hierarchical clustering tree on operational taxonomic unit (OTU) level.
Water 11 00736 g004
Figure 5. Principal coordinate analysis (PCoA) scores plot of beta diversity.
Water 11 00736 g005
Figure 6. Venn diagram of representing the number on OTU level of groups B, N, O, and O_N.
Water 11 00736 g006
Figure 7. Comparison of bacteria groups on genus level (abundance > 5%) of groups B, N, O, and O_N.
Water 11 00736 g007
Figure 8. The tests of statistically significant differences between groups. The ten most abundant genera are shown. The length of corresponding columns denotes the mean relative abundance of a genus in different groups; the p-value of significance is shown on the right side, *, 0.01 < p < 0.05; **, 0.001 < p < 0.01; ***, p < 0.001.
Water 11 00736 g008
Figure 9. Heatmap plot for the first 10 dominant genera. Numbers in the table are the R value, the right legend is the color interval of different R values. A p-value of more than 0.01 and less than 0.05 is marked as the superscript of numbers with an *.
Water 11 00736 g009
Table 1. Grouping rules of different pollutant type (unit: mg/L).
COD > 1.0COD < 1.0
DO > 3.0DO < 3.0DO > 3.0DO < 3.0
NO3 < 88.57BOOO
NO3 > 88.57NO_NO_NO_N
Table 2. The alpha diversity of samples (mean ± SD).
GroupsCoverageChaoACESobsShannonSimpson
B0.990 ± 0.0041054 ± 3521261 ± 472682 ± 2243.70 ± 0.630.087 ± 0.10
O0.990 ± 0.0041044 ± 4881197 ± 476662 ± 3693.16 ± 1.050.16 ± 0.093
N0.989 ± 0.0041113 ± 3861359 ± 483687 ± 2533.67 ± 0.520.084 ± 0.046
O_N0.989 ± 0.0051077 ± 5341294 ± 588687 ± 3803.60 ± 0.690.085 ± 0.050