Climate Change Impacts on Drought-Flood Abrupt Alternation and Water Quality in the Hetao Area, China


Abstract
1. Introduction
2. Materials and Methods
2.1. Study Area
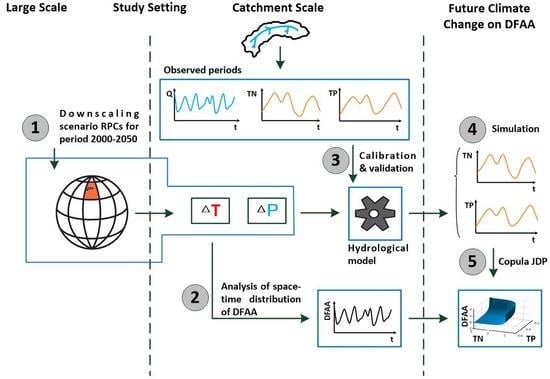
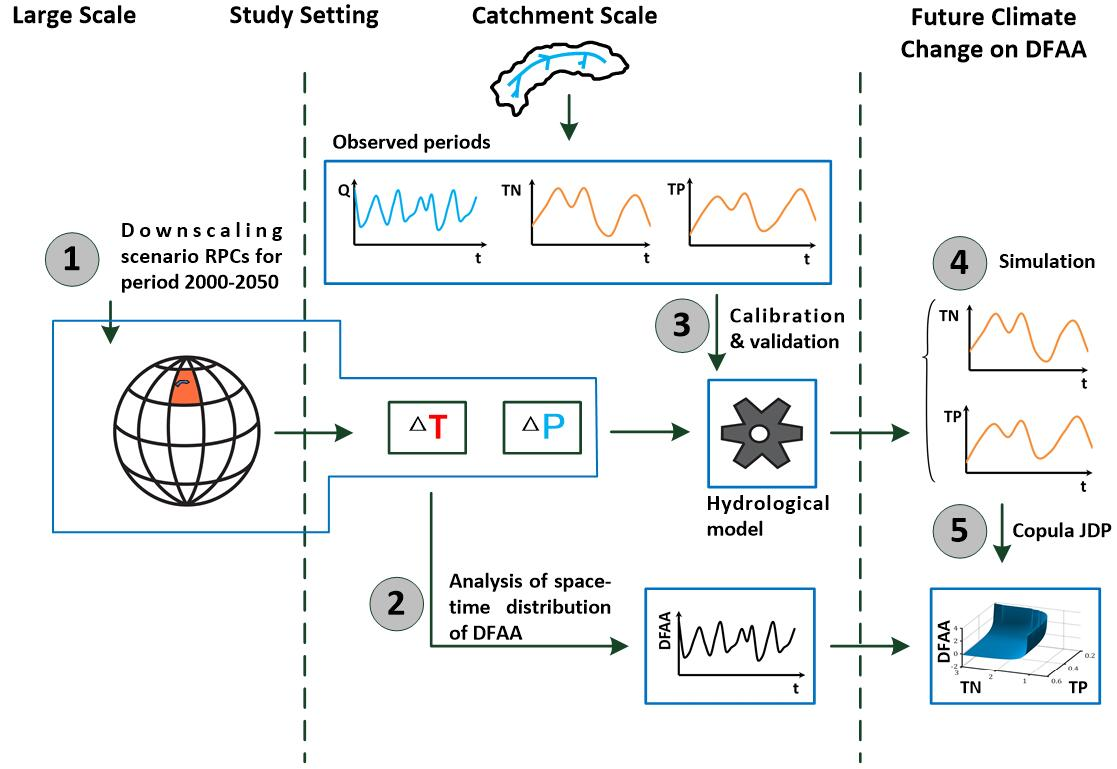
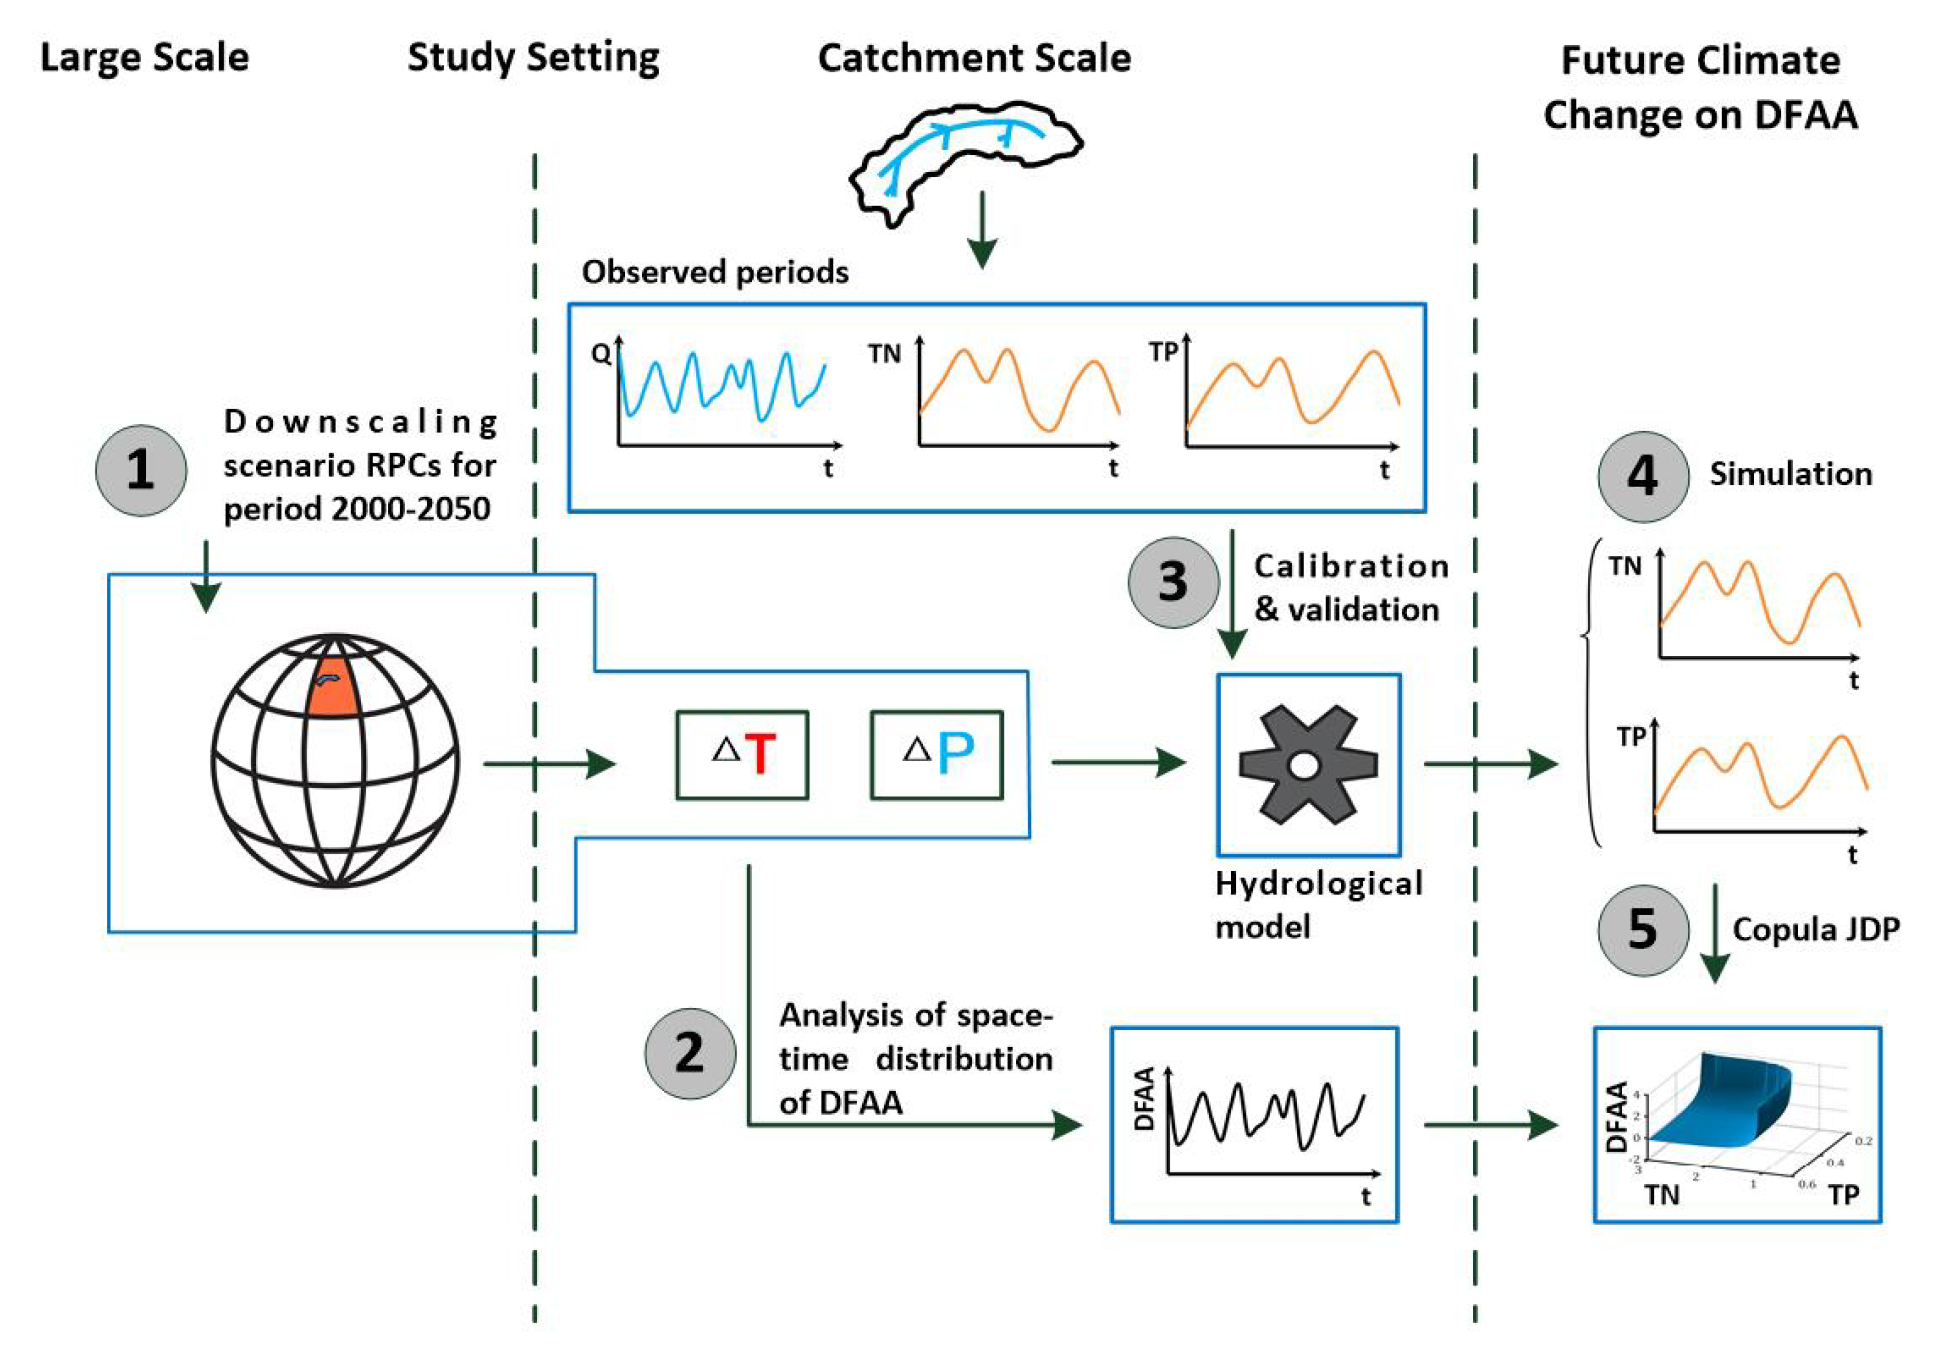
2.2. Research Ideas
- (1)
- Changes in precipitation and temperature cause changes in the runoff process [9], thereby exerting direct impact on the temporal and spatial distribution and frequency of future DFAA. This section is based on the RCPs climate scenarios, aiming to estimate future precipitation and temperature in the Hetao area. LDFAI and SDFAI were calculated by using the future precipitation of the Hetao area.
- (2)
- DFAA and its typical spatial distribution are prone to cause sudden major water pollution in the Ulansuhai Nur Lake [17,20]. We can predict the locations and time of potential DFAA in the future and respond to possible extreme DFAA in advance. This part of assessment used the established distributed water quantity and quality coupling model and future precipitation and temperature data to simulate and analyze the spatial and temporal changes in the water quantity and quality in the Ulansuhai Nur Lake inlet. The probability of joint distribution of DFAA and water quality in the lake inlet was constructed through the Copula function to estimate the probability of sudden water pollution in future DFAA scenarios.
2.3. Evaluation Indicators
2.3.1. DFAA Indexes
2.3.2. Evaluation of the Relationship between DFAA and Water Quality
2.4. Data Collection and Arrangement
3. Results
3.1. Law Analysis of DFAA
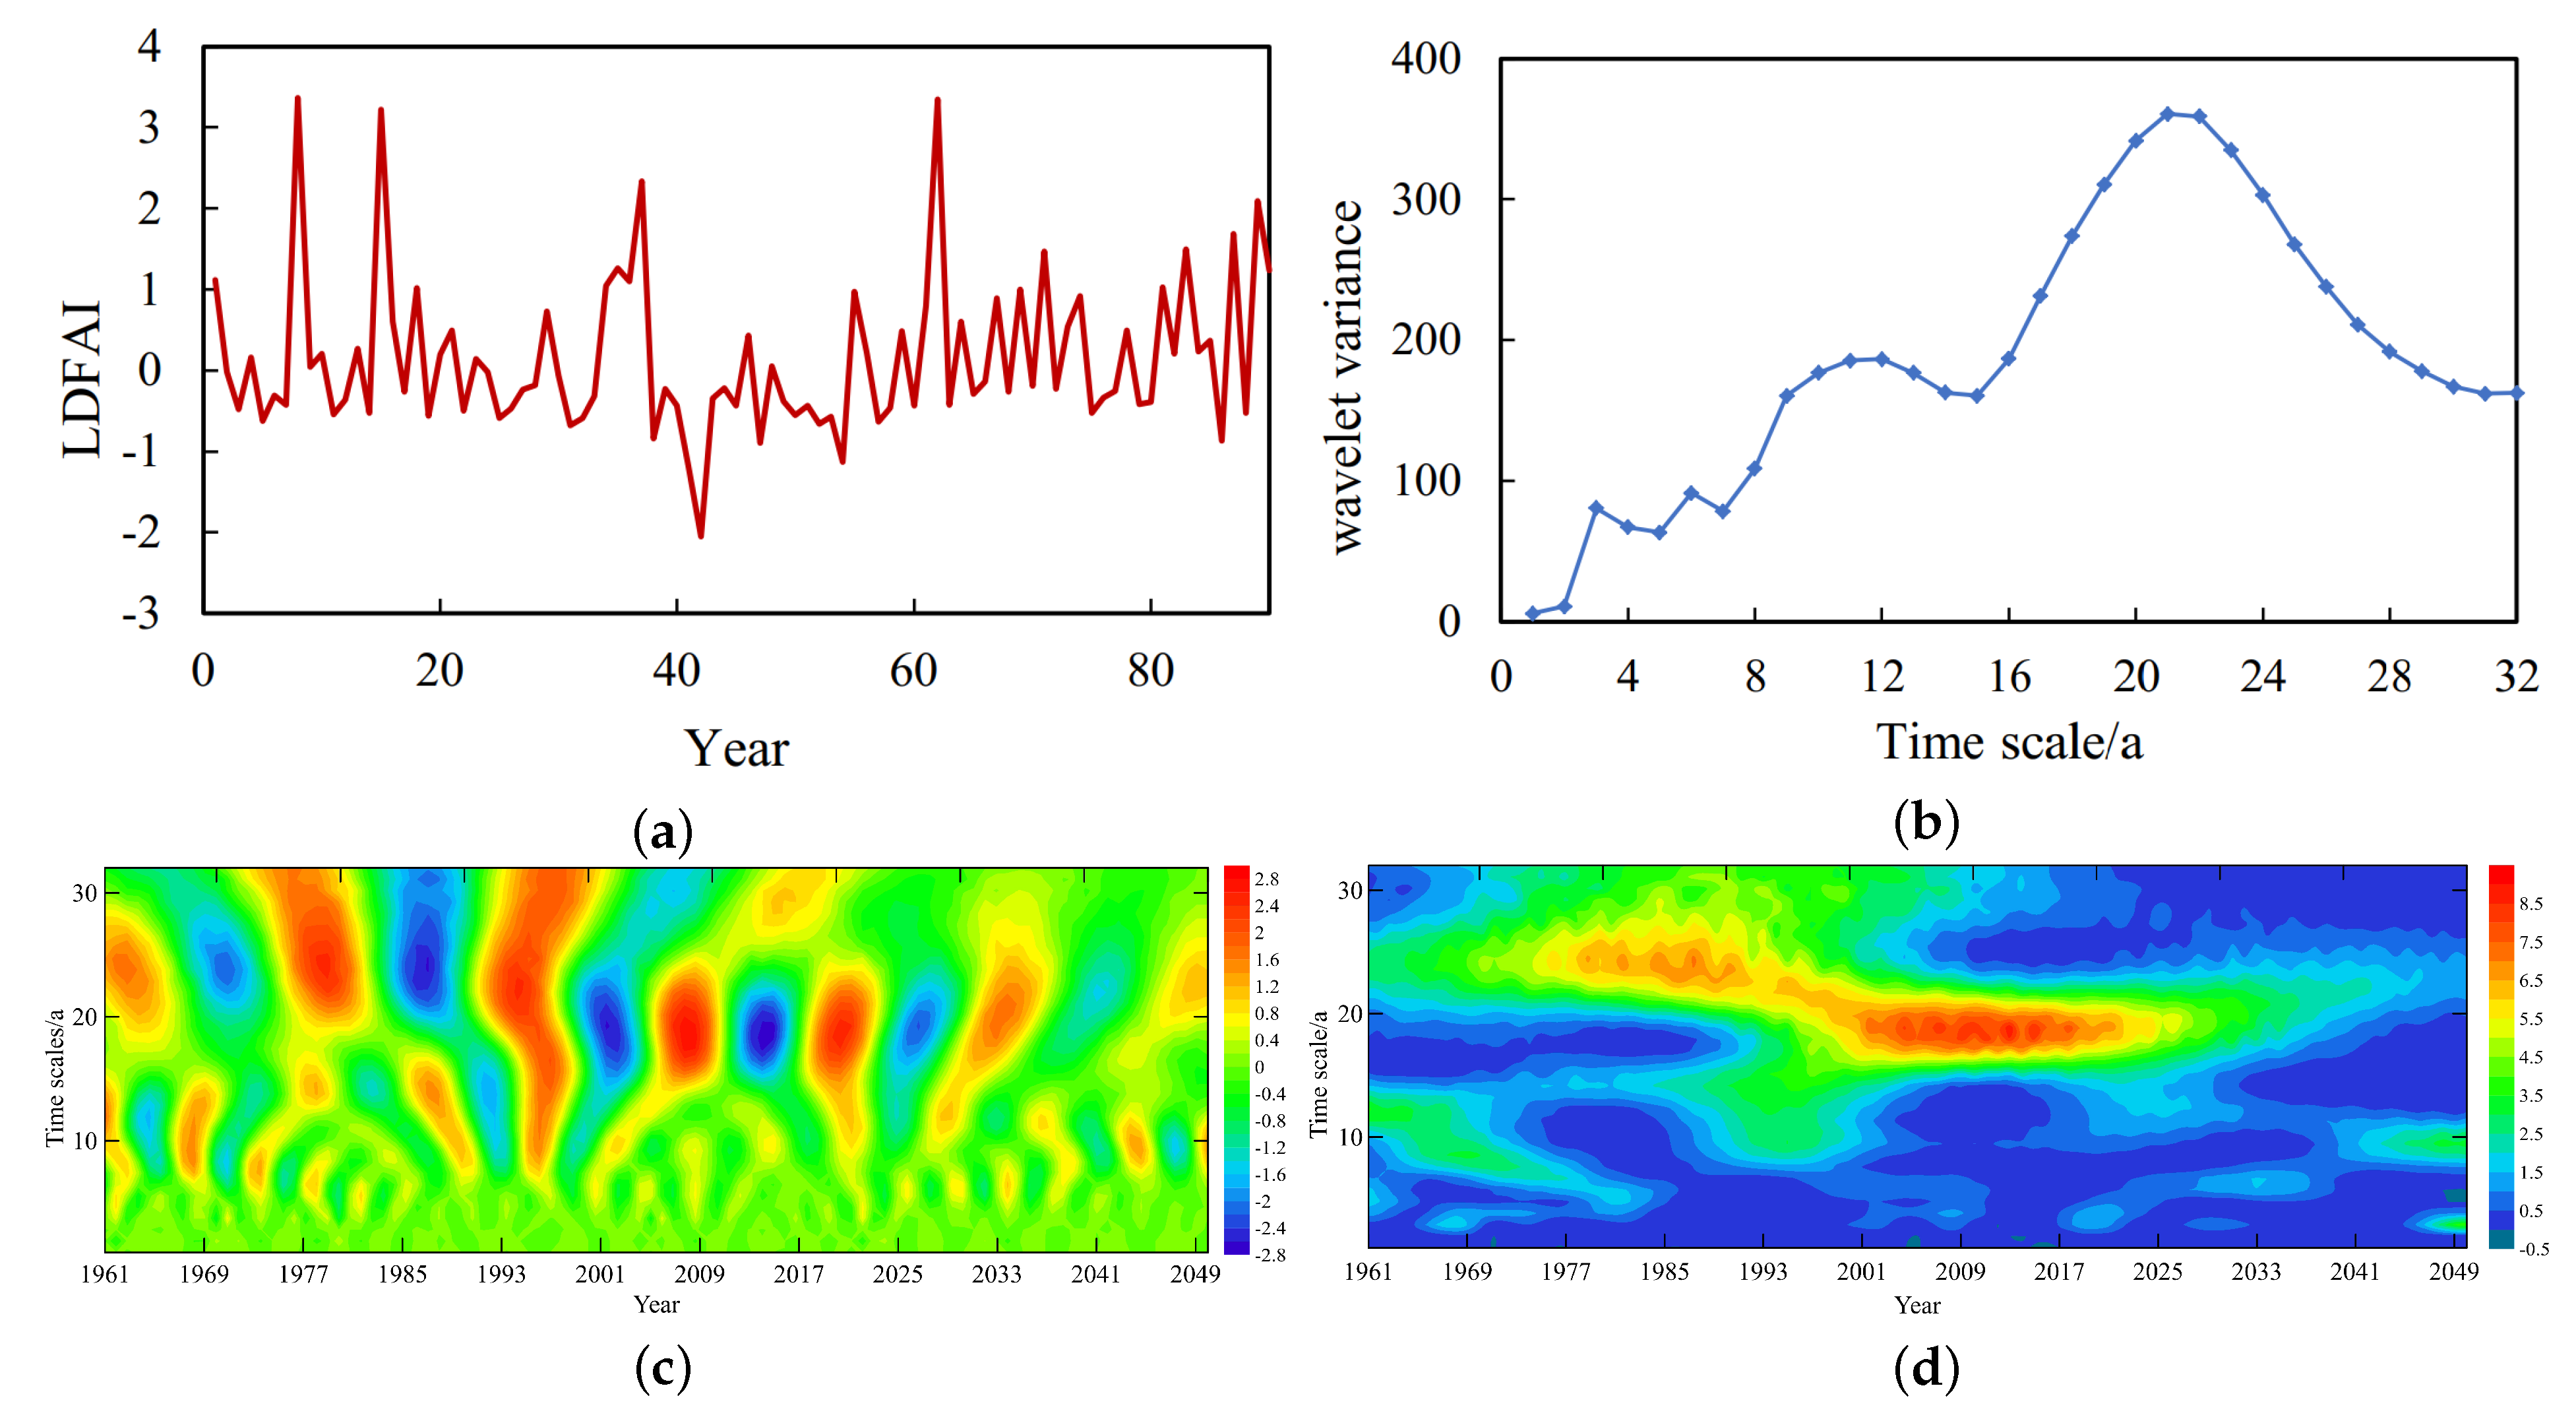
3.1.1. Analysis of DFAA on the Time Scale
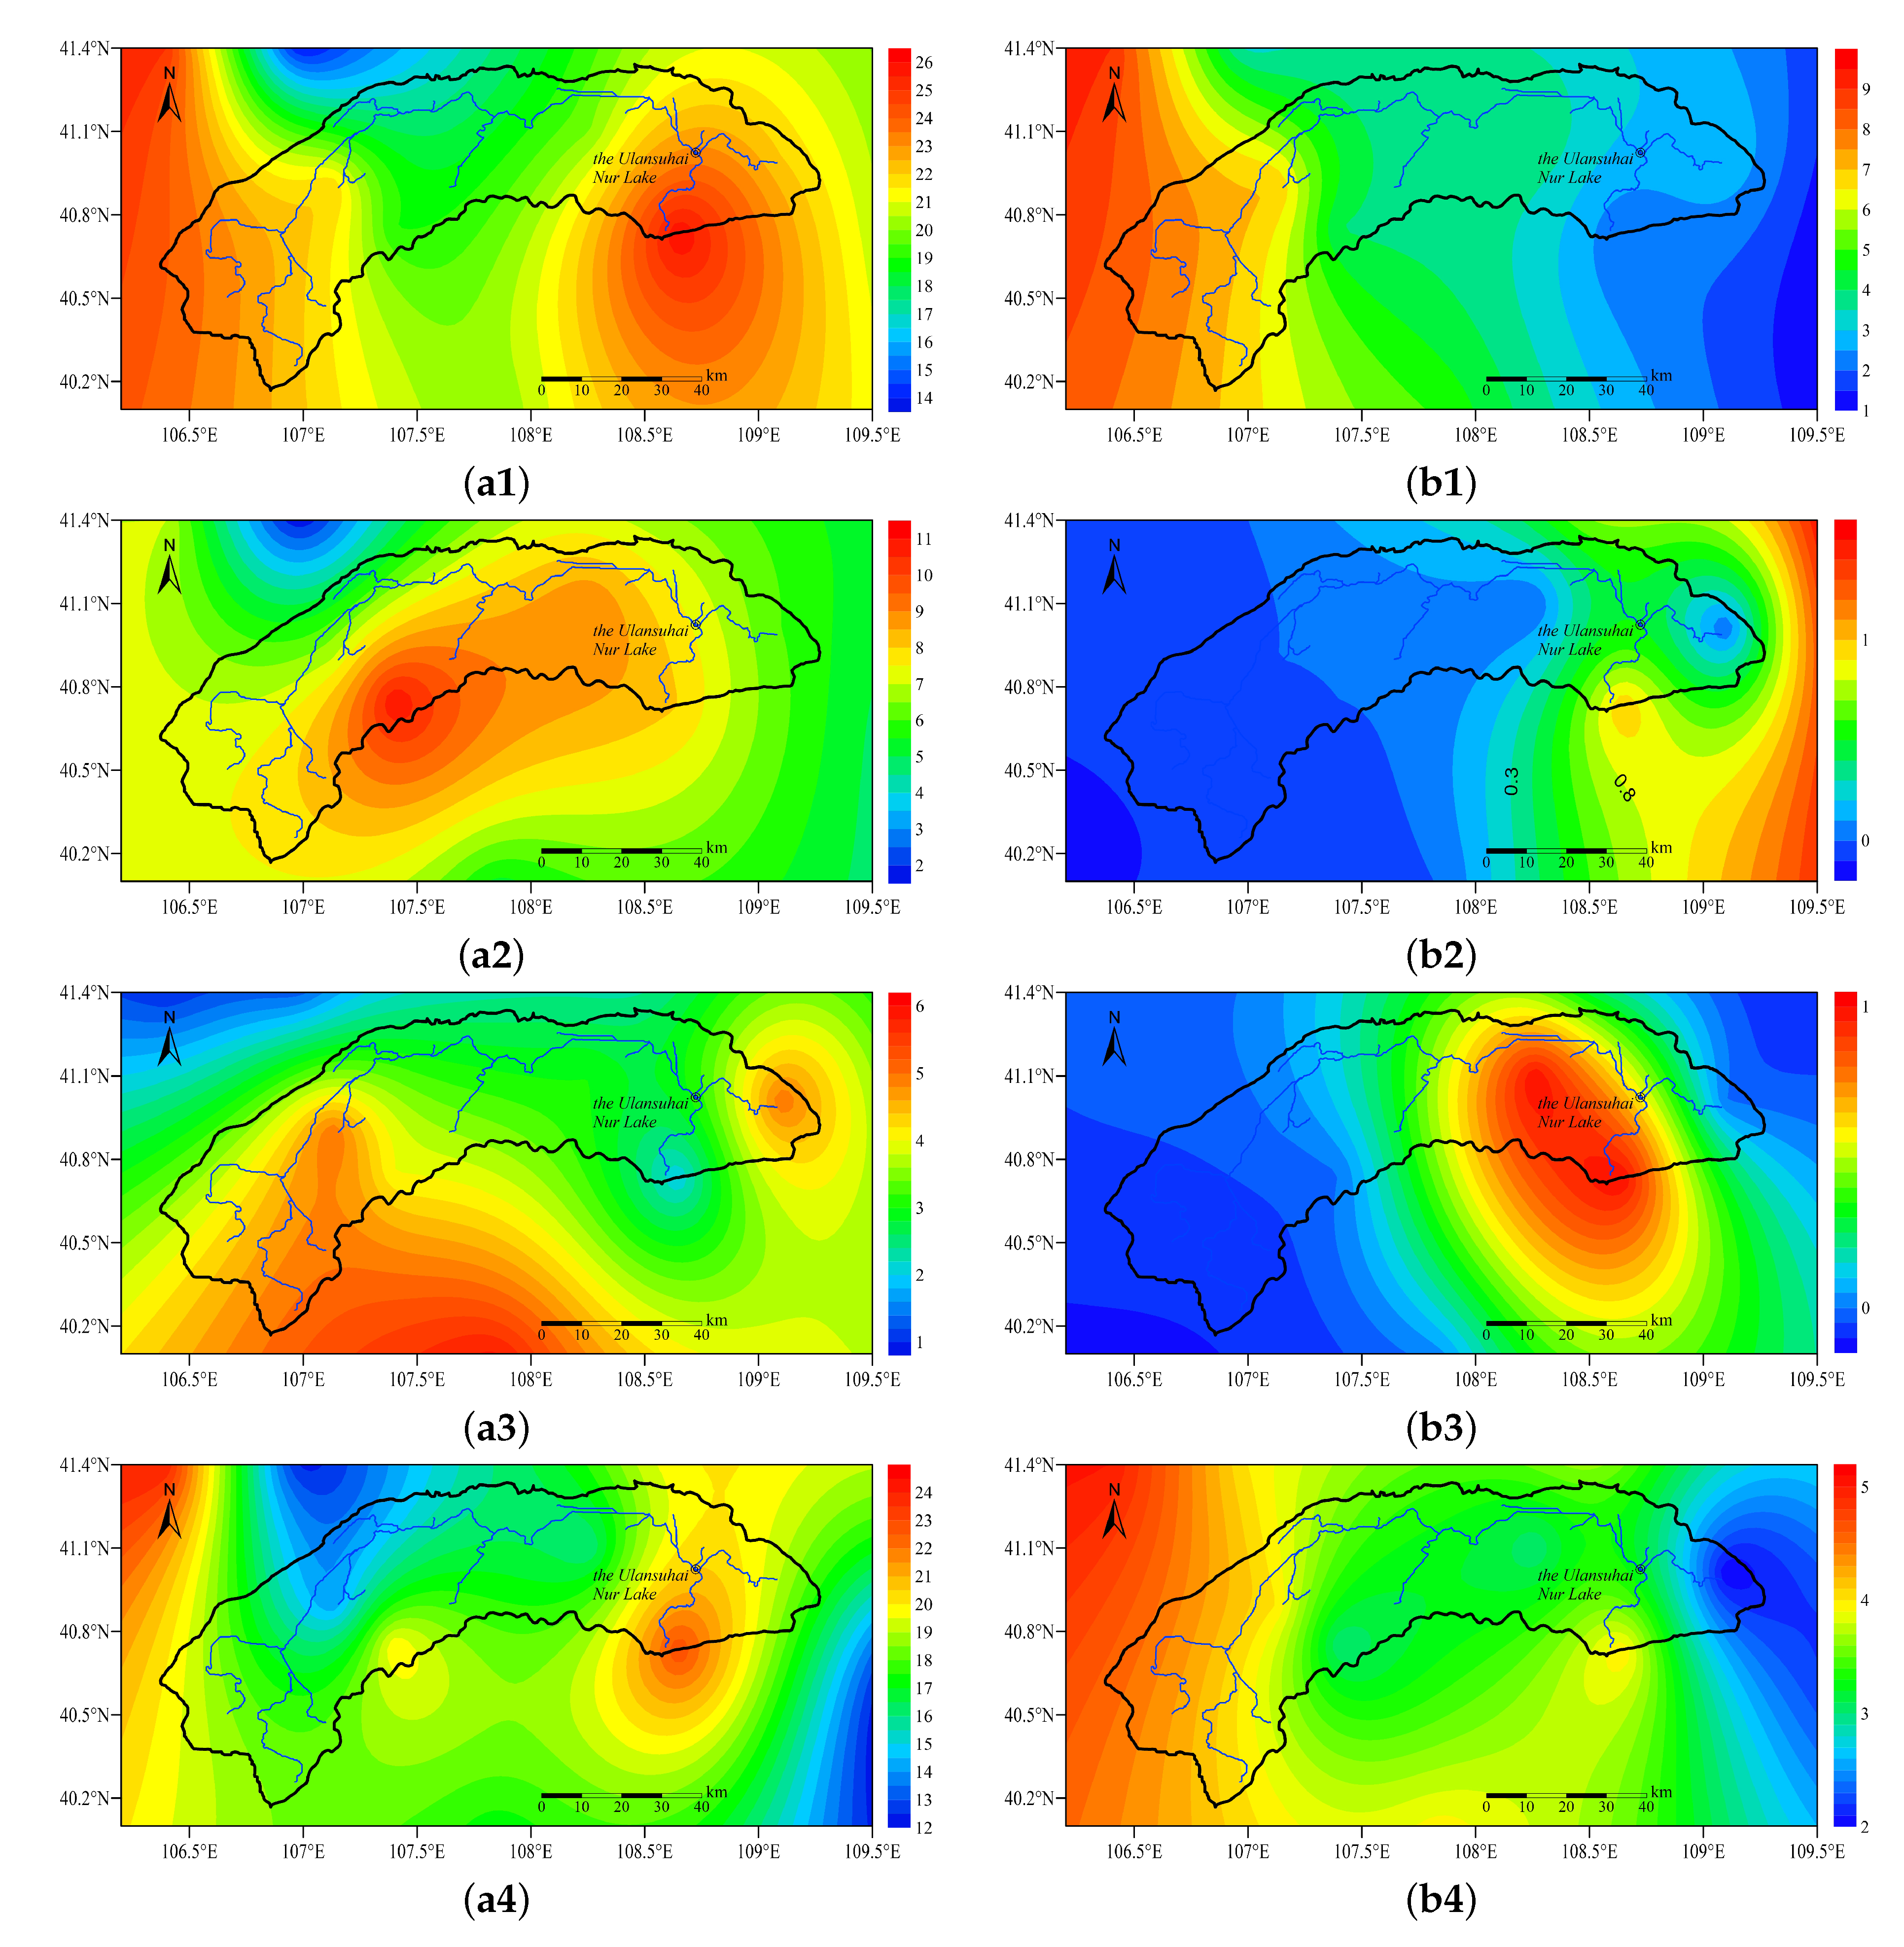
3.1.2. Analysis of Spatial Differentiation Characteristics of DFAA
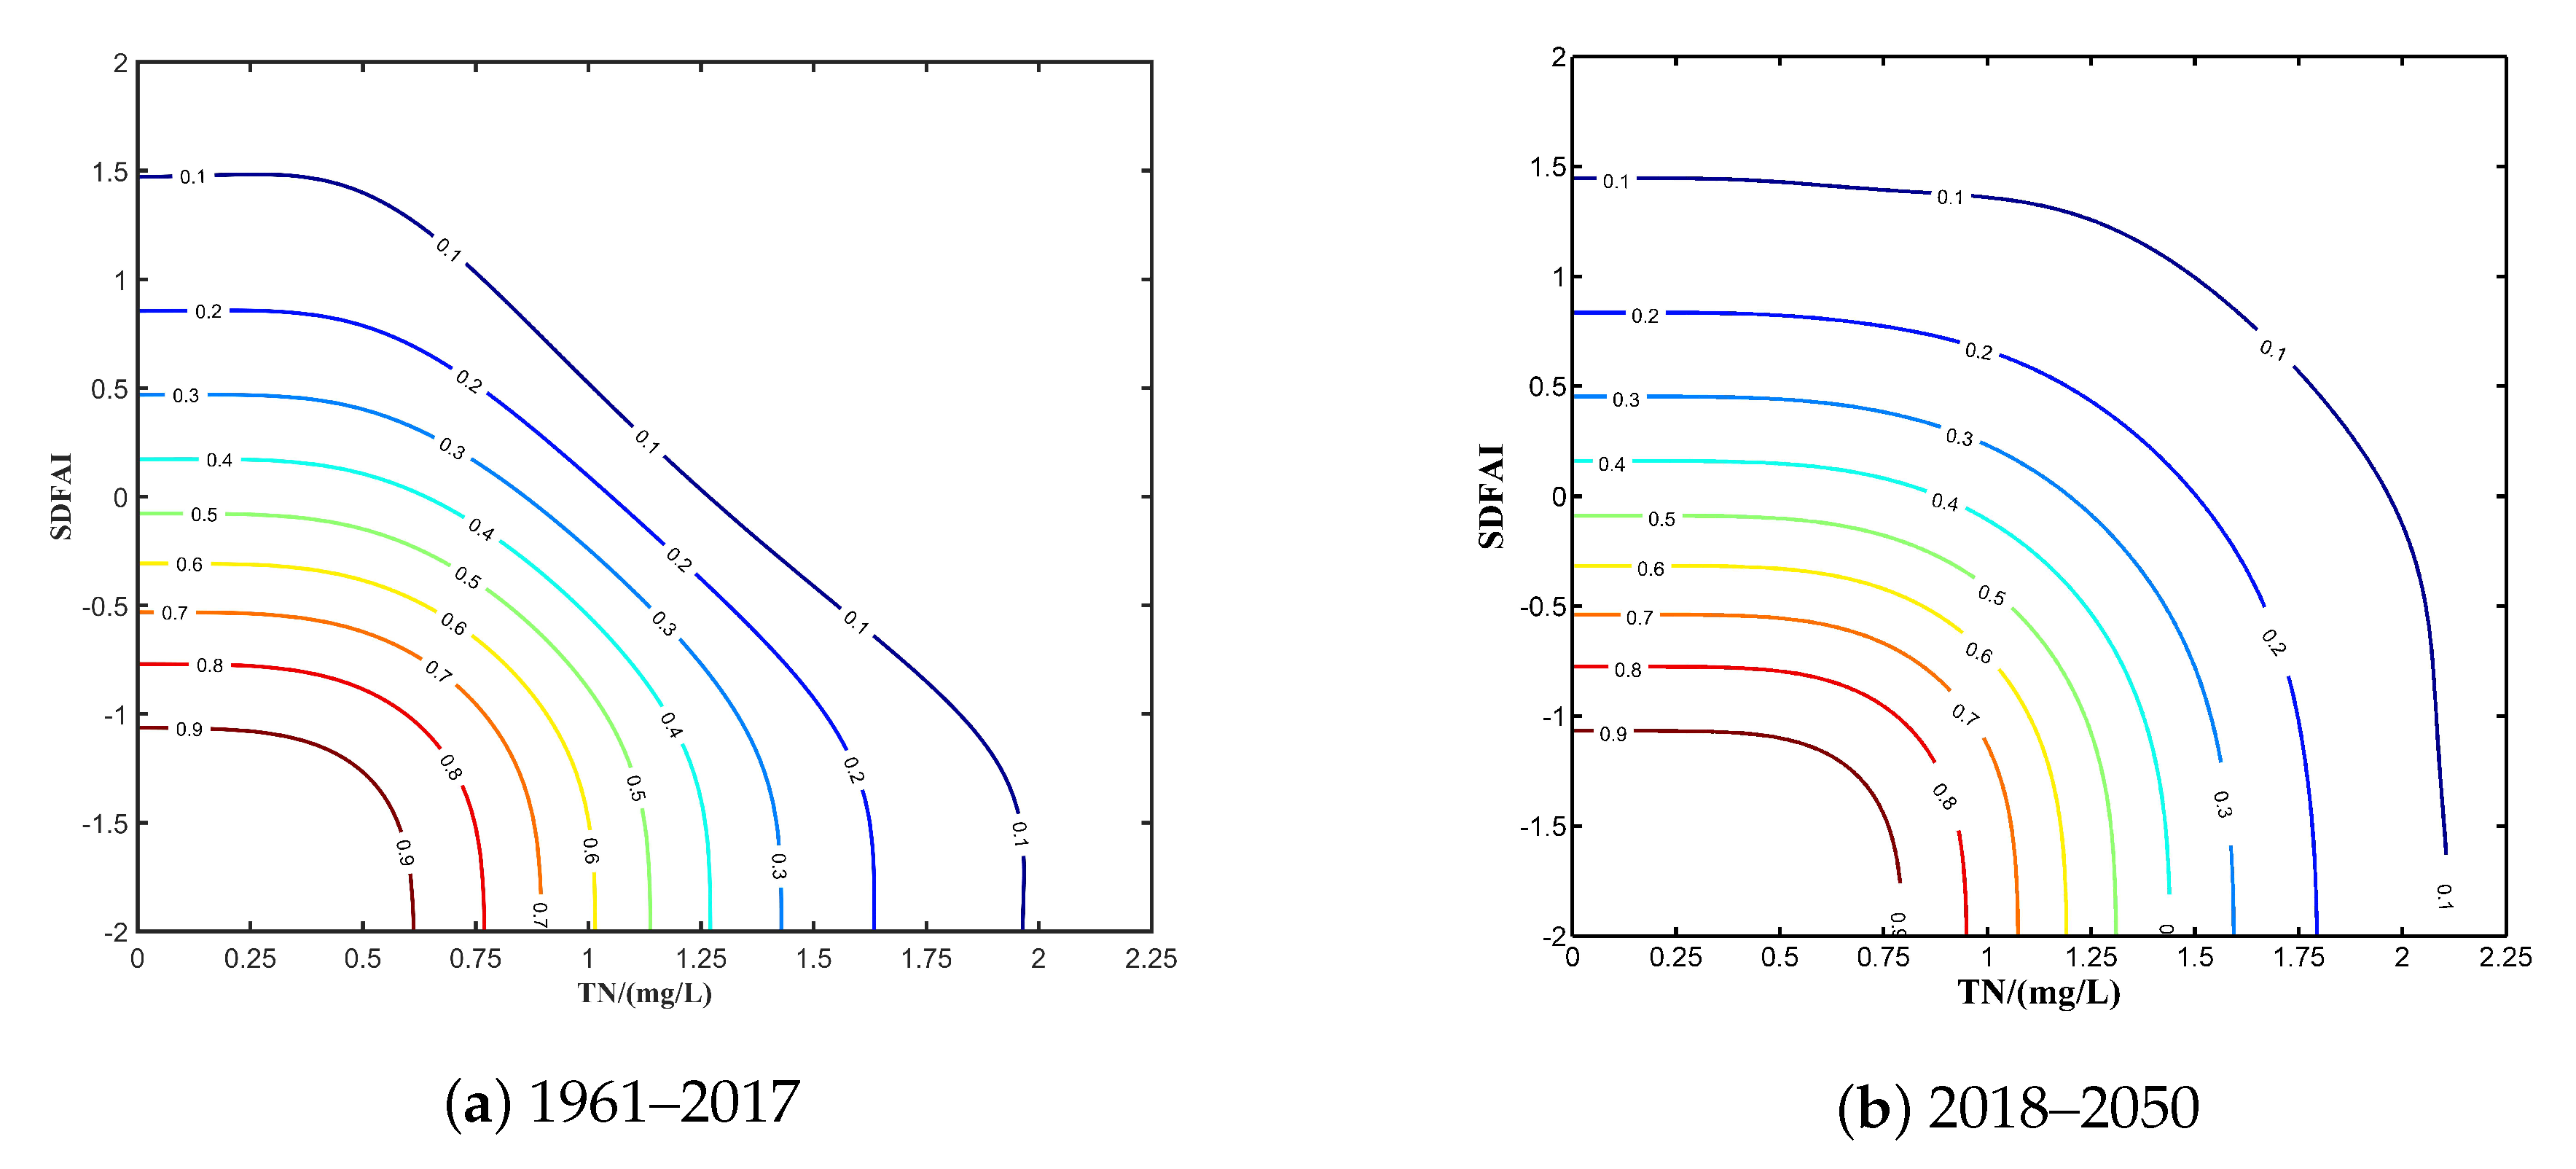
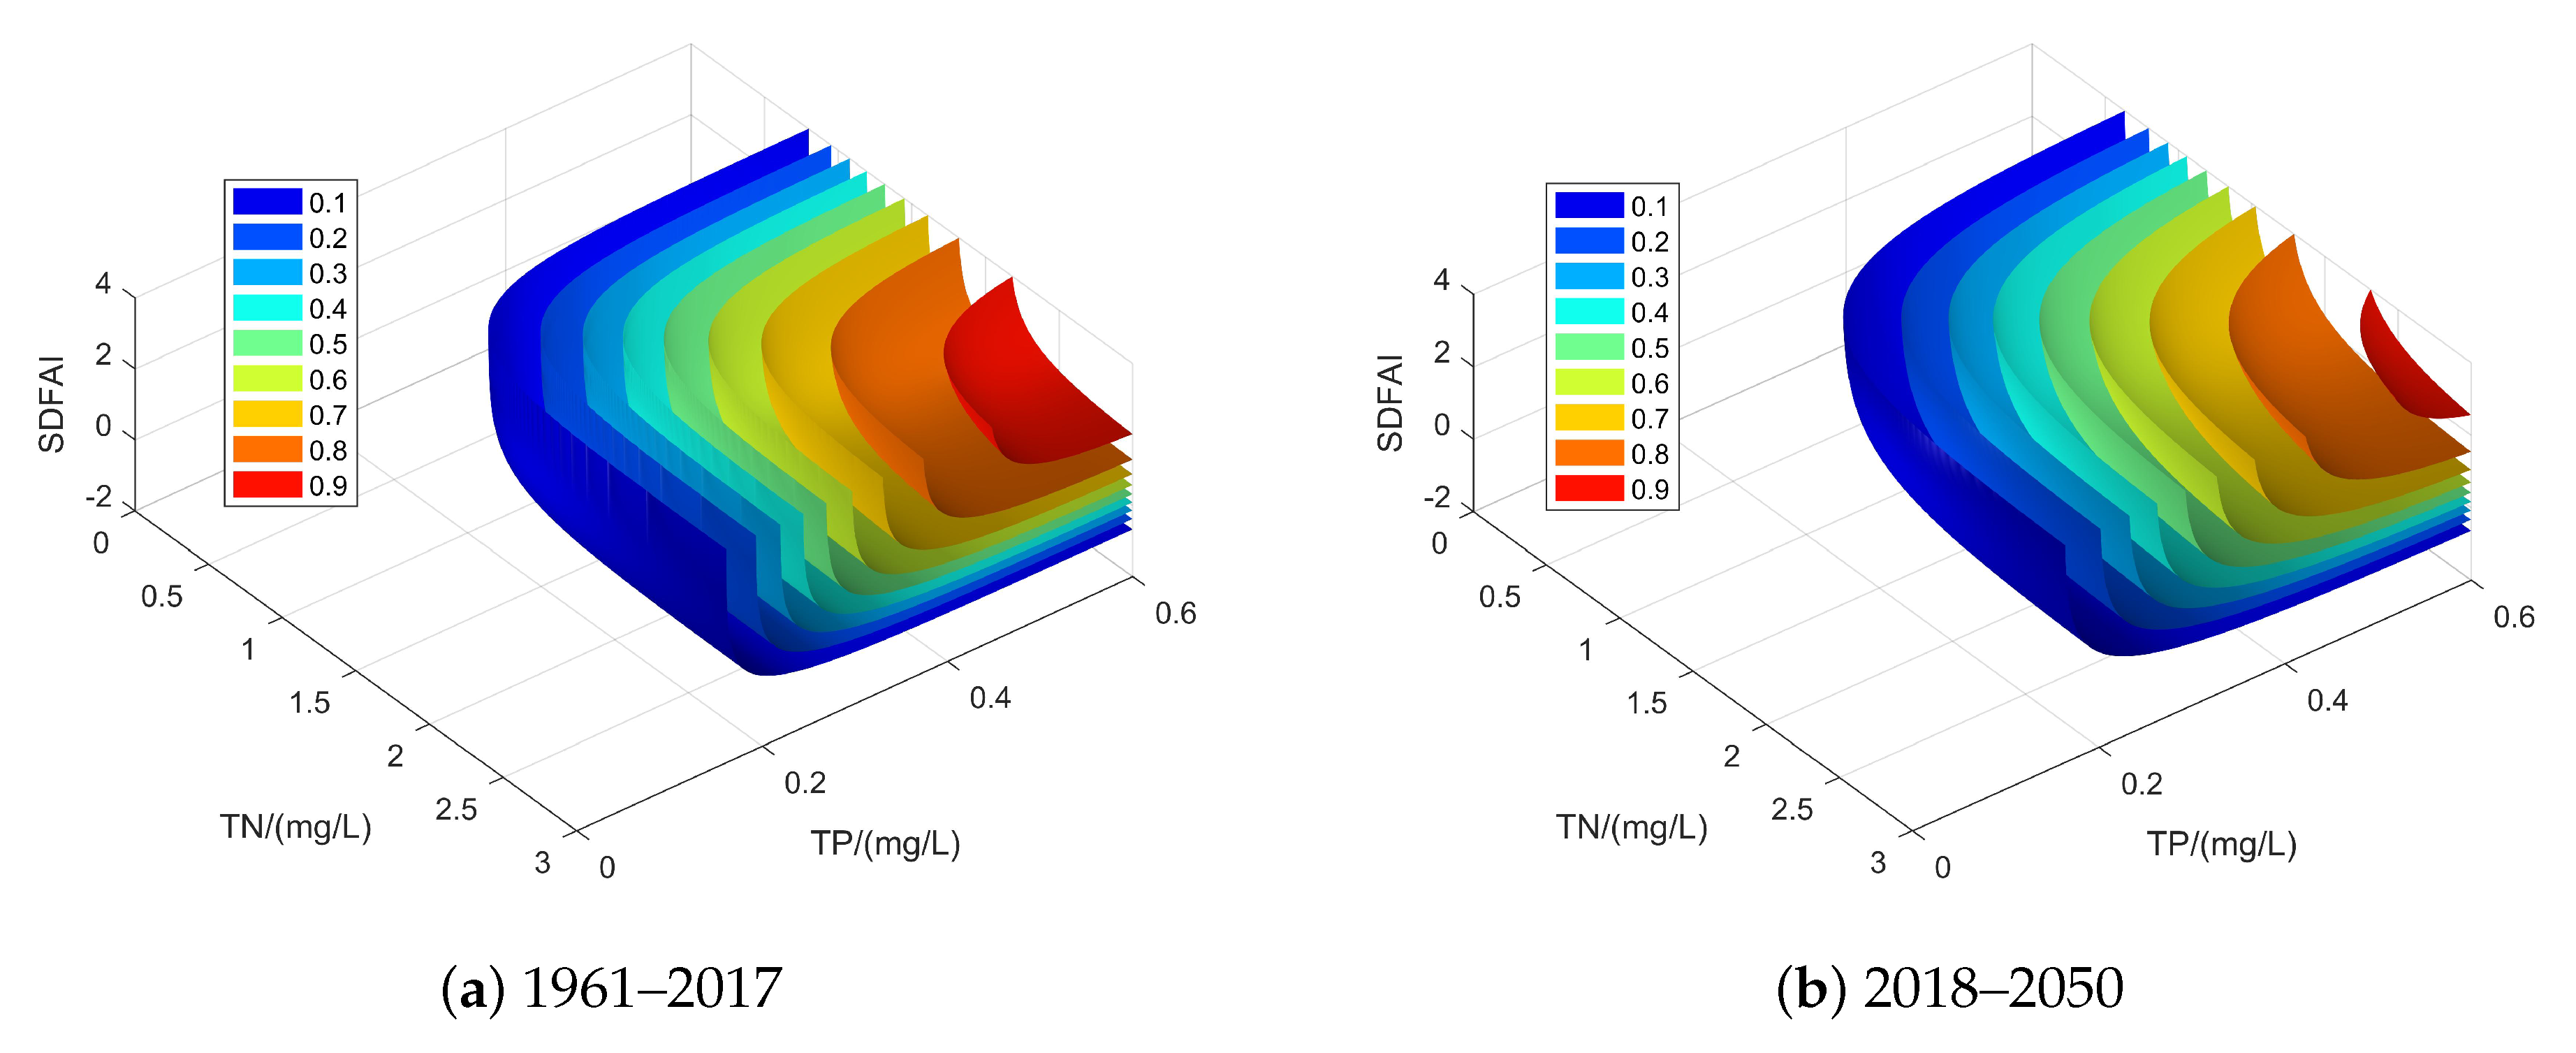
3.2. The Relationship between DFAA and Water Quality
4. Discussion
- (1)
- With the increase in precipitation processes, rainwater and runoff pass through the ground, and the pollutants accumulated on the surface are carried into the water body, causing pollution of surface water and even groundwater within the drainage area, especially in the vicinity of farmland or industrial land, which will form serious non-point source pollution [41]. Therefore, the change in precipitation intensity and frequency will affect non-point source pollution. As two of the main elements of non-point source pollution, nitrogen and phosphorus are greatly affected by precipitation process. If precipitation and its strength increase, then the runoff scouring effect will intensify, and the nitrogen and phosphorus loads flowing into the water body will increase accordingly [42].
- (2)
- With the increase in air temperature, the water surface temperature will also increase, which leads to an increase in the temperature difference and thermocline in the upper and lower layers of water. The presence of thermoclines can lead to the formation of anoxic layers at the bottom of water bodies such as rivers or lakes. Nitrogen and phosphorus release easily from sediment to bottom water in an anoxic bottom water environment, and lead to an increase in nitrogen and phosphorus concentrations in surface water, which is the main reason that nitrogen and phosphorus loads increase with surface runoff coming into the water environment. The increase in water temperature will also increase the activities of microorganisms and promote the release of endogenous nitrogen and phosphorus in sediment. If the nitrogen concentration in the water reaches a certain level, eutrophication will be intensified when environmental conditions such as temperature and light are satisfied [43].
- (3)
- Under drought conditions, runoff is reduced and the water temperature is relatively high, which will increase the concentration of NH and NO in the water. Some studies have shown that concentrations of NH and NO increased by 1.9 and 1.3 times, respectively, in a dry year and a normal year [44]. The increasing frequency of DFAA will cause a large number of surface pollutants to enter water bodies. Drought-to-flood incidents were taken as an example: in the early stage of drought, the flow rate of the river channel decreased, leading to a decrease in the ability to dilute and transport substances and an increase in the concentration of pollutants in the water body and surrounding farmlands. In the later stage of rapid formation of flood, the hydrodynamic conditions increased rapidly, directly bringing a multitude of pollutants in the surrounding farmlands and the river channel into the Ulansuhai Nur Lake. These processes may occur simultaneously with DFAA. At the same time, DFAA will also cause a large amount of sediment to enter water bodies or cause sediment resuspension, which will affect the sediment content of the water body, thus further affecting the transport and transformation of pollutants, and water quality [45,46].
5. Conclusions
- (1)
- In the Hetao area, the phenomenon of the LDFAI was mainly for drought-to-flood events, and there is a trend that the frequency of DFAA will decrease in the future; the drought-to-flood incidents occurred frequently in May to July among the SDFAI, and flood-to-drought incidents occurred frequently from July to September.
- (2)
- Due to the uneven distribution of precipitation in the flood season in the Hetao area, the spatial distribution of the DFAA is not uniform; during the 57 years from 1961 to 2017, the high-frequency DFAA regions in the Hetao area were generally concentrated in the Ulansuhai Nur Lake in the eastern part of the region. From 2018 to 2050, frequent occurrences of DFAA occurred in the west.
- (3)
- The Copula function is used to calculate the JDP of SDFAI, TN and TP. The risk of water quality exceeding the standard will increase when the DFAA happens, and the probability of water quality exceeding the standard caused by drought-to-flood in the three variable joint distribution is greater than that in flood-to-drought.
- (4)
- Extreme weather such as an increase in future temperatures and an increase in extreme precipitation will exacerbate water pollution, causing further increases in the risk of excessive water quality in future DFAA, which is consistent with the conclusions of the IPCC report. The results can provide a basis for flood control and drought resistance and pollution control in the Hetao area.
Author Contributions
Funding
Conflicts of Interest
Abbreviations
| DFAA | Drought-flood abrupt alternation |
| RCPs | Representative Concentration Pathways |
| TN | Total nitrogen |
| TP | Total phosphorus |
| IPCC | Intergovernmental Panel on Climate Change |
| DEM | Digital Elevation Model |
| GCM | Global Climate Model |
| LDFAI | Long-cycle drought-flood abrupt alternation index |
| SDFAI | Short-cycle drought-flood abrupt alternation index |
| JPD | Joint probability distribution |
References
- IPCC. Summary for Policymakers. In Global Warming of 1.5 ∘C; An IPCC Special Report on the Impacts of Global Warming of 1.5 ∘C above Pre-Industrial Levels and Related Global Greenhouse Gas Emission Pathways, In the Context of Strengthening the Global Response to the Threat of Climate Change, Sustainable Development, and Efforts to Eradicate Poverty; Intergovernmental Panel on Climate Change (IPCC): Geneva, Switzerland, 2018. [Google Scholar]
- Walther, G.R.; Post, E.; Convey, P.; Menzel, A.; Parmesan, C.; Beebee, T.J.C.; Fromentin, J.M.; Hoegh-Guldberg, O.; Bairlein, F. Ecological responses to recent climate change. Nature 2002, 416, 389–395. [Google Scholar] [CrossRef] [PubMed]
- Rogelj, J.; Meinshausen, M.; Knutti, R. Global warming under old an new scenarios using IPCC climate sensitivity range estimates. Nat. Clim. Chang. 2012, 2, 248–253. [Google Scholar] [CrossRef]
- Harvell, C.D.; Mitchell, C.E.; Ward, J.R.; Altizer, S.; Dobson, A.P.; Ostfeld, R.S.; Samuel, M.D. Climate warming and disease risks for terrestrial and marine biota. Science 2002, 296, 58–62. [Google Scholar] [CrossRef] [PubMed]
- Walter, K.M.; Zimov, S.A.; Chanton, J.P.; Verbyla, D.; Chapin, F.S. Methane bubbling from Siberian thaw lakes as a positive feedback to climate warming. Nature 2006, 443, 71–75. [Google Scholar] [CrossRef] [PubMed]
- Parmesan, C.; Yohe, G. A globally coherent fingerprint of climate change impacts across natural systems. Nature 2003, 443, 37–42. [Google Scholar] [CrossRef]
- Yang, S.Y.; Wu, B.Y.; Zhang, R.H.; Zhou, S.W. Relationship between an abrupt drought-flood transition over mid-low reaches of the Yangtze River in 2011 and the intraseasonal oscillation over mid-high latitudes of East Asia. Acta Meteorol. Sin. 2013, 27, 129–143. [Google Scholar] [CrossRef]
- Espinoza, J.C.; Ronchail, J.; Guyot, J.L.; Junquas, C.; Drapeau, G.; Martinez, J.M.; Santini, W.; Vauchel, P.; Lavado, W.; Ordonez, J.; et al. From drought to flooding: Understanding the abrupt 2010–11 hydrological annual cycle in the Amazonas River and tributaries. Environ. Res. Lett. 2012, 7, 1–7. [Google Scholar] [CrossRef]
- Vogel, J.L.; Huff, F.A. Relation Between the St-Louis Urban Precipitation Anomaly and Synoptic Weather Factors. J. Appl. Meteorol. Clim. 1978, 17, 1141–1152. [Google Scholar] [CrossRef]
- Trenberth, K.E.; Guillemot, C.J. Physical Processes Involved in the 1988 Drought and 1993 Floods in North America. J. Clim. 1996, 9, 1288–1298. [Google Scholar] [CrossRef]
- Cook, B.I.; Seager, R.; Miller, R.L. Atmospheric circulation anomalies during two persistent north american droughts: 1932–1939 and 1948–1957. Clim. Dyn. 2011, 36, 2339–2355. [Google Scholar] [CrossRef]
- Garnett, E.R.; Khandekar, M.L. The impact of large-scale atmospheric circulations and anomalies on Indian monsoon droughts and floods and on world grain yields-a statistical analysis. Agric. For. Meteorol. 1992, 61, 113–128. [Google Scholar] [CrossRef]
- Hastenrath, S.; Polzin, D.; Mutai, C. Diagnosing the droughts and floods in equatorial East Africa during boreal autumn 2005–08. J. Clim. 2010, 23, 813–817. [Google Scholar] [CrossRef]
- Zhang, Z.Z.; Chao, B.F.; Chen, J.L.; Wilson, C.R. Terrestrial water storage anomalies of Yangtze River Basin droughts observed by GRACE and connections with ENSO. Glob. Planet. Chang. 2015, 126, 35–45. [Google Scholar] [CrossRef]
- Keyantash, J.; Dracup, J.A. The Quantification of Drought: An Evaluation of Drought Indices. Am. Meteorol. Soc. 2002, 83, 1167–1180. [Google Scholar] [CrossRef]
- Tote, C.; Patricio, D.; Boogaard, H.; van der Wijngaart, R.; Tarnavsky, E.; Funk, C. Evaluation of Satellite Rainfall Estimates for Drought and Flood Monitoring in Mozambique. Remote Sens. 2015, 7, 1758–1776. [Google Scholar] [CrossRef]
- Li, X.H.; Zhang, Q.; Zhang, D.; Ye, X.C. Investigation of the drought-flood abrupt alternation of streamflow in Poyang Lake catchment during the last 50 years. Hydrol. Res. 2017, 48, 1402–1417. [Google Scholar] [CrossRef]
- Gao, C.; Tian, R. The influence of climate change and human activities on runoff in the middle reaches of the Huaihe River Basin, China. J. Geogr. Sci. 2018, 28, 79–92. [Google Scholar] [CrossRef]
- Wu, Z.W.; Li, J.P.; He, J.H.; Jiang, Z.H. Occurrence of droughts and floods during the normal summer monsoons in the mid and lower reaches of the Yangtze River. Geophys. Res. Lett. 2006, 33, L05813. [Google Scholar] [CrossRef]
- Wu, Z.W.; Li, J.P.; He, J.H.; Jiang, Z.H. Large-scale atmospheric singularities and summer long-cycle droughts-floods abrupt alternation in the middle and lower reaches of the Yangtze River. Chin. Sci. Bull. 2006, 51, 2028–2034. [Google Scholar] [CrossRef]
- Mosavi, A.; Ozturk, P.; Chau, K.W. Flood Prediction Using Machine Learning Models: Literature Review. Water 2018, 10, 1536. [Google Scholar] [CrossRef]
- Mosavi, A.; Edalatifar, M. A Hybrid Neuro-Fuzzy Algorithm for Prediction of Reference Evapotranspiration. In Proceedings of the International Conference on Global Research and Education, Iasi, Romania, 25–28 September 2017; pp. 235–243. [Google Scholar]
- Choubin, B.; Moradi, E.; Golshan, M.; Adamowski, J.; Sajedi-Hosseini, F.; Mosavi, A. An ensemble prediction of flood susceptibility using multivariate discriminant analysis, classification and regression trees, and support vector machines. Sci. Total Environ. 2019, 10, 2087–2096. [Google Scholar] [CrossRef] [PubMed]
- Yang, C.G.; Yu, Z.B.; Hao, Z.C.; Zhang, J.Y.; Zhu, J.T. Impact of climate change on flood and drought events in Huaihe River Basin, China. Hydrol. Res. 2012, 43, 14–22. [Google Scholar] [CrossRef]
- Hurlbert, M.; Gupta, J. Adaptive Governance, Uncertainty, and Risk: Policy Framing and Responses to Climate Change, Drought, and Flood. Risk Anal. 2016, 36, 339–356. [Google Scholar] [CrossRef]
- Zhu, D.N.; Ryan, M.C.; Sun, B.; Li, C.Y. The influence of irrigation and Wuliangsuhai Lake on groundwater quality in eastern Hetao Basin, Inner Mongolia, China. Hydrogeol. J. 2014, 22, 1101–1114. [Google Scholar] [CrossRef]
- Wu, Y.; Shi, X.H.; Li, C.Y.; Zhao, S.N.; Pen, F.; Green, T.R. Simulation of Hydrology and Nutrient Transport in the Hetao Irrigation District, Inner Mongolia, China. Water 2017, 9, 169. [Google Scholar] [CrossRef]
- Zhang, H.; Ma, D.; Hu, X. Arsenic pollution in groundwater from Hetao Area, China. Environ. Geol. 2002, 41, 638–643. [Google Scholar] [CrossRef]
- Mou, S.Y.; Shi, P.; Qu, S.M.; Ji, X.M.; Zhao, L.L.; Feng, Y.; Chen, C.; Dong, F.C. Uncertainty Analysis of Two Copula-Based Conditional Regional Design Flood Composition Methods: A Case Study of Huai River, China. Water 2018, 10, 1872. [Google Scholar] [CrossRef]
- Aranda, J.A.; Garcia-Bartual, R. Synthetic Hydrographs Generation Downstream of a River Junction Using a Copula Approach for Hydrological Risk Assessment in Large Dams. Water 2018, 10, 1570. [Google Scholar] [CrossRef]
- Cai, W.Y.; Di, H.; Liu, X.P. Estimation of the Spatial Suitability of Winter Tourism Destinations Based on Copula Functions. Int. J. Environ. Res. Public Health 2019, 16, 186. [Google Scholar] [CrossRef]
- Arnold, J.G.; Moriasi, D.N.; Gassman, P.W.; Abbaspour, K.C.; White, M.J.; Srinivasan, R.; Santhi, C.; Harmel, R.D.; van Griensven, A.; Van Liew, M.W.; et al. Swat: Model Use, Calibration, and Validation. Trans. Asabe 2012, 55, 1491–1508. [Google Scholar] [CrossRef]
- Nazari-Sharabian, M.; Taheriyoun, M.; Ahmad, S.; Karakouzian, M.; Ahmadi, A. Water Quality Modeling of Mahabad Dam Watershed—Reservoir System under Climate Change Conditions, Using SWAT and System Dynamics. Water 2019, 11, 394. [Google Scholar] [CrossRef]
- Abbaspour, K.C.; Yang, J.; Maximov, I.; Siber, R.; Bogner, K.; Mieleitner, J.; Zobrist, J.; Srinivasan, R. Modelling hydrology and water quality in the pre-alpine/alpine Thur watershed using SWAT. J. Hydrol. 2007, 333, 413–430. [Google Scholar] [CrossRef]
- Srinivasan, R.; Ramanarayanan, T.S.; Arnold, J.G.; Bednarz, S.T. Large area hydrologic modeling and assessment—Part II: Model application. J. Am. Water Resour. Assoc. 1998, 34, 142–149. [Google Scholar] [CrossRef]
- Moriasi, D.N.; Arnold, J.G.; Van Liew, M.W.; Bingner, R.L.; Harmel, R.D.; Veith, T.L. Model Evaluation Guidelines for Systematic Quantification of Accuracy in Watershed Simulations. Trans. Asabe 2007, 50, 885–900. [Google Scholar] [CrossRef]
- Kovacs, J.; Gaborhatvani, I.; Korponai, J.; Kovacs, I.S. Morlet wavelet and autocorrelation analysis of long-term data series of the Kis-Balaton water protection system (KBWPS). Ecol. Eng. 2010, 36, 1469–1477. [Google Scholar] [CrossRef]
- Whitehead, P.G.; Wilby, R.L.; Battarbee, R.W.; Kernan, M.; Wade, A.J. A review of the potential impacts of climate change on surface water quality. Hydrolog. Sci. J. 2009, 54, 101–123. [Google Scholar] [CrossRef]
- Ducharne, A. Importance of stream temperature to climate change impact on water quality. Hydrol. Earth Syst. Sci. 2008, 12, 797–810. [Google Scholar] [CrossRef]
- Stocker, T.F.; Qin, D.; Plattner, G.K.; Tignor, M.M.B.; Allen, S.K.; Boschung, J.; Nauels, A.; Xia, Y.; Bex, V.; Midgley, P.M. Climate Change 2013: The Physical Science Basis; University Press: Cambridge, UK, 2013; pp. 1–33. [Google Scholar]
- Kaste, O.; Wright, R.F.; Barkved, L.J.; Bjerkeng, B.; Engen-Skaugen, T.; Magnusson, J.; Saelthun, N.R. Linked models to assess the impacts of climate change on nitrogen in a Norwegian river basin and FJORD system. Sci. Total Environ. 2006, 365, 1–3. [Google Scholar] [CrossRef]
- Whitehead, P.G.; Butterfield, D.; Wade, A.J. The title of the cited article. Hydrol. Res. 2009, 40, 113–122. [Google Scholar] [CrossRef]
- Luo, Y.Z.; Ficklin, D.L.; Liu, X.M.; Zhang, M.H. Assessment of climate change impacts on hydrology and water quality with a watershed modeling approach. Sci. Total Environ. 2013, 450, 72–82. [Google Scholar] [CrossRef]
- Vliet, M.T.H.V.; Zwolsman, J.J.G. Impact of summer droughts on the water quality of the meuse river. J. Hydrol. 2008, 353, 1–17. [Google Scholar] [CrossRef]
- Breivik, K.; Wania, F.; Muir, D.C.G.; Alaee, M.; Backus, S.; Pacepavicius, G. Empirical and modeling evidence of the long-range atmospheric transport of decabromodiphenyl ether. Environ. Sci. Technol. 2006, 40, 4612–4618. [Google Scholar] [CrossRef] [PubMed]
- Hilscherova, K.; Dusek, L.; Kubik, V.; Cupr, P.; Hofman, J.; Klanova, J.; Holoubek, I. Redistribution of organic pollutants in river sediments and alluvial soils related to major floods. J. Soil Sediment. 2007, 7, 167–177. [Google Scholar] [CrossRef]


| Type | Data | Scale | Source |
|---|---|---|---|
| GIS | DEM | Grid (90 m × 90 m) | Institute of Geographic Sciences and Natural Resources Research |
| Land use | 1:1,000,000 | Institute of Geographic Sciences and Natural Resources Research | |
| Agrotype | 1:4,000,000 | Institute of Geographic Sciences and Natural Resources Research | |
| Meteorology | Meteorological station | 11 stations (1961–2017) | China Meteorological Administration |
| GCM | Grid (1 × 1 C) (2001–2050) | IPCC Fifth Assessment Report | |
| Hydrology | Hydrological station | 1 station (1980–2000) | Hetao Irrigation Administration Bureau |
| Water quality station | 6 stations (2012–2015) | Hetao Irrigation Administration Bureau |
| Station | Variety | Calibration | Validation | ||
|---|---|---|---|---|---|
| R | Ens | R | Enst | ||
| Zongpaigan | Runoff | 0.69 | 0.61 | 0.73 | 0.63 |
| Xidatan | TN | 0.8 | 0.74 | 0.46 | 0.45 |
| TP | 0.69 | 0.68 | 0.62 | 0.51 | |
| Wayaotan | TN | 0.79 | 0.77 | 0.79 | 0.7 |
| TP | 0.76 | 0.74 | 0.81 | 0.67 | |
| Budong | TN | 0.72 | 0.67 | 0.89 | 0.46 |
| TP | 0.68 | 0.57 | 0.73 | 0.57 | |
| Dabeikou | TN | 0.71 | 0.56 | 0.75 | 0.51 |
| TP | 0.81 | 0.56 | 0.62 | 0.52 | |
| Hekou | TN | 0.62 | 0.51 | 0.71 | 0.48 |
| TP | 0.73 | 0.53 | 0.67 | 0.58 | |
| Sizhi | TN | 0.73 | 0.61 | 0.63 | 0.52 |
| TP | 0.62 | 0.49 | 0.65 | 0.54 | |
| Year | P (TN > 1 ∣ SDFAI > 1) | P (TN > 1 ∣ SDFAI < −1) | P (TN > 1 ∣ −1 ≤ SDFAI ≤ 1) |
|---|---|---|---|
| 1961–2017 | 0.576 | 0.732 | 0.578 |
| 2018–2050 | 0.712 | 0.797 | 0.432 |
| Year | P (A SDFAI > 1) | P (A SDFAI < −1) | P (B SDFAI≤ 1) |
|---|---|---|---|
| 1961–2017 | 0.94 | 0.827 | 0.346 |
| 2018–2050 | 0.958 | 0.851 | 0.336 |
© 2019 by the authors. Licensee MDPI, Basel, Switzerland. This article is an open access article distributed under the terms and conditions of the Creative Commons Attribution (CC BY) license (http://creativecommons.org/licenses/by/4.0/).
Share and Cite
Yang, Y.; Weng, B.; Bi, W.; Xu, T.; Yan, D.; Ma, J. Climate Change Impacts on Drought-Flood Abrupt Alternation and Water Quality in the Hetao Area, China. Water 2019, 11, 652. https://doi.org/10.3390/w11040652
Yang Y, Weng B, Bi W, Xu T, Yan D, Ma J. Climate Change Impacts on Drought-Flood Abrupt Alternation and Water Quality in the Hetao Area, China. Water. 2019; 11(4):652. https://doi.org/10.3390/w11040652
Chicago/Turabian StyleYang, Yuheng, Baisha Weng, Wuxia Bi, Ting Xu, Dengming Yan, and Jun Ma. 2019. "Climate Change Impacts on Drought-Flood Abrupt Alternation and Water Quality in the Hetao Area, China" Water 11, no. 4: 652. https://doi.org/10.3390/w11040652
APA StyleYang, Y., Weng, B., Bi, W., Xu, T., Yan, D., & Ma, J. (2019). Climate Change Impacts on Drought-Flood Abrupt Alternation and Water Quality in the Hetao Area, China. Water, 11(4), 652. https://doi.org/10.3390/w11040652