On the Connection between Atmospheric Moisture Transport and Dry Conditions in Rainfall Climatological Zones of the Niger River Basin


Abstract
1. Introduction
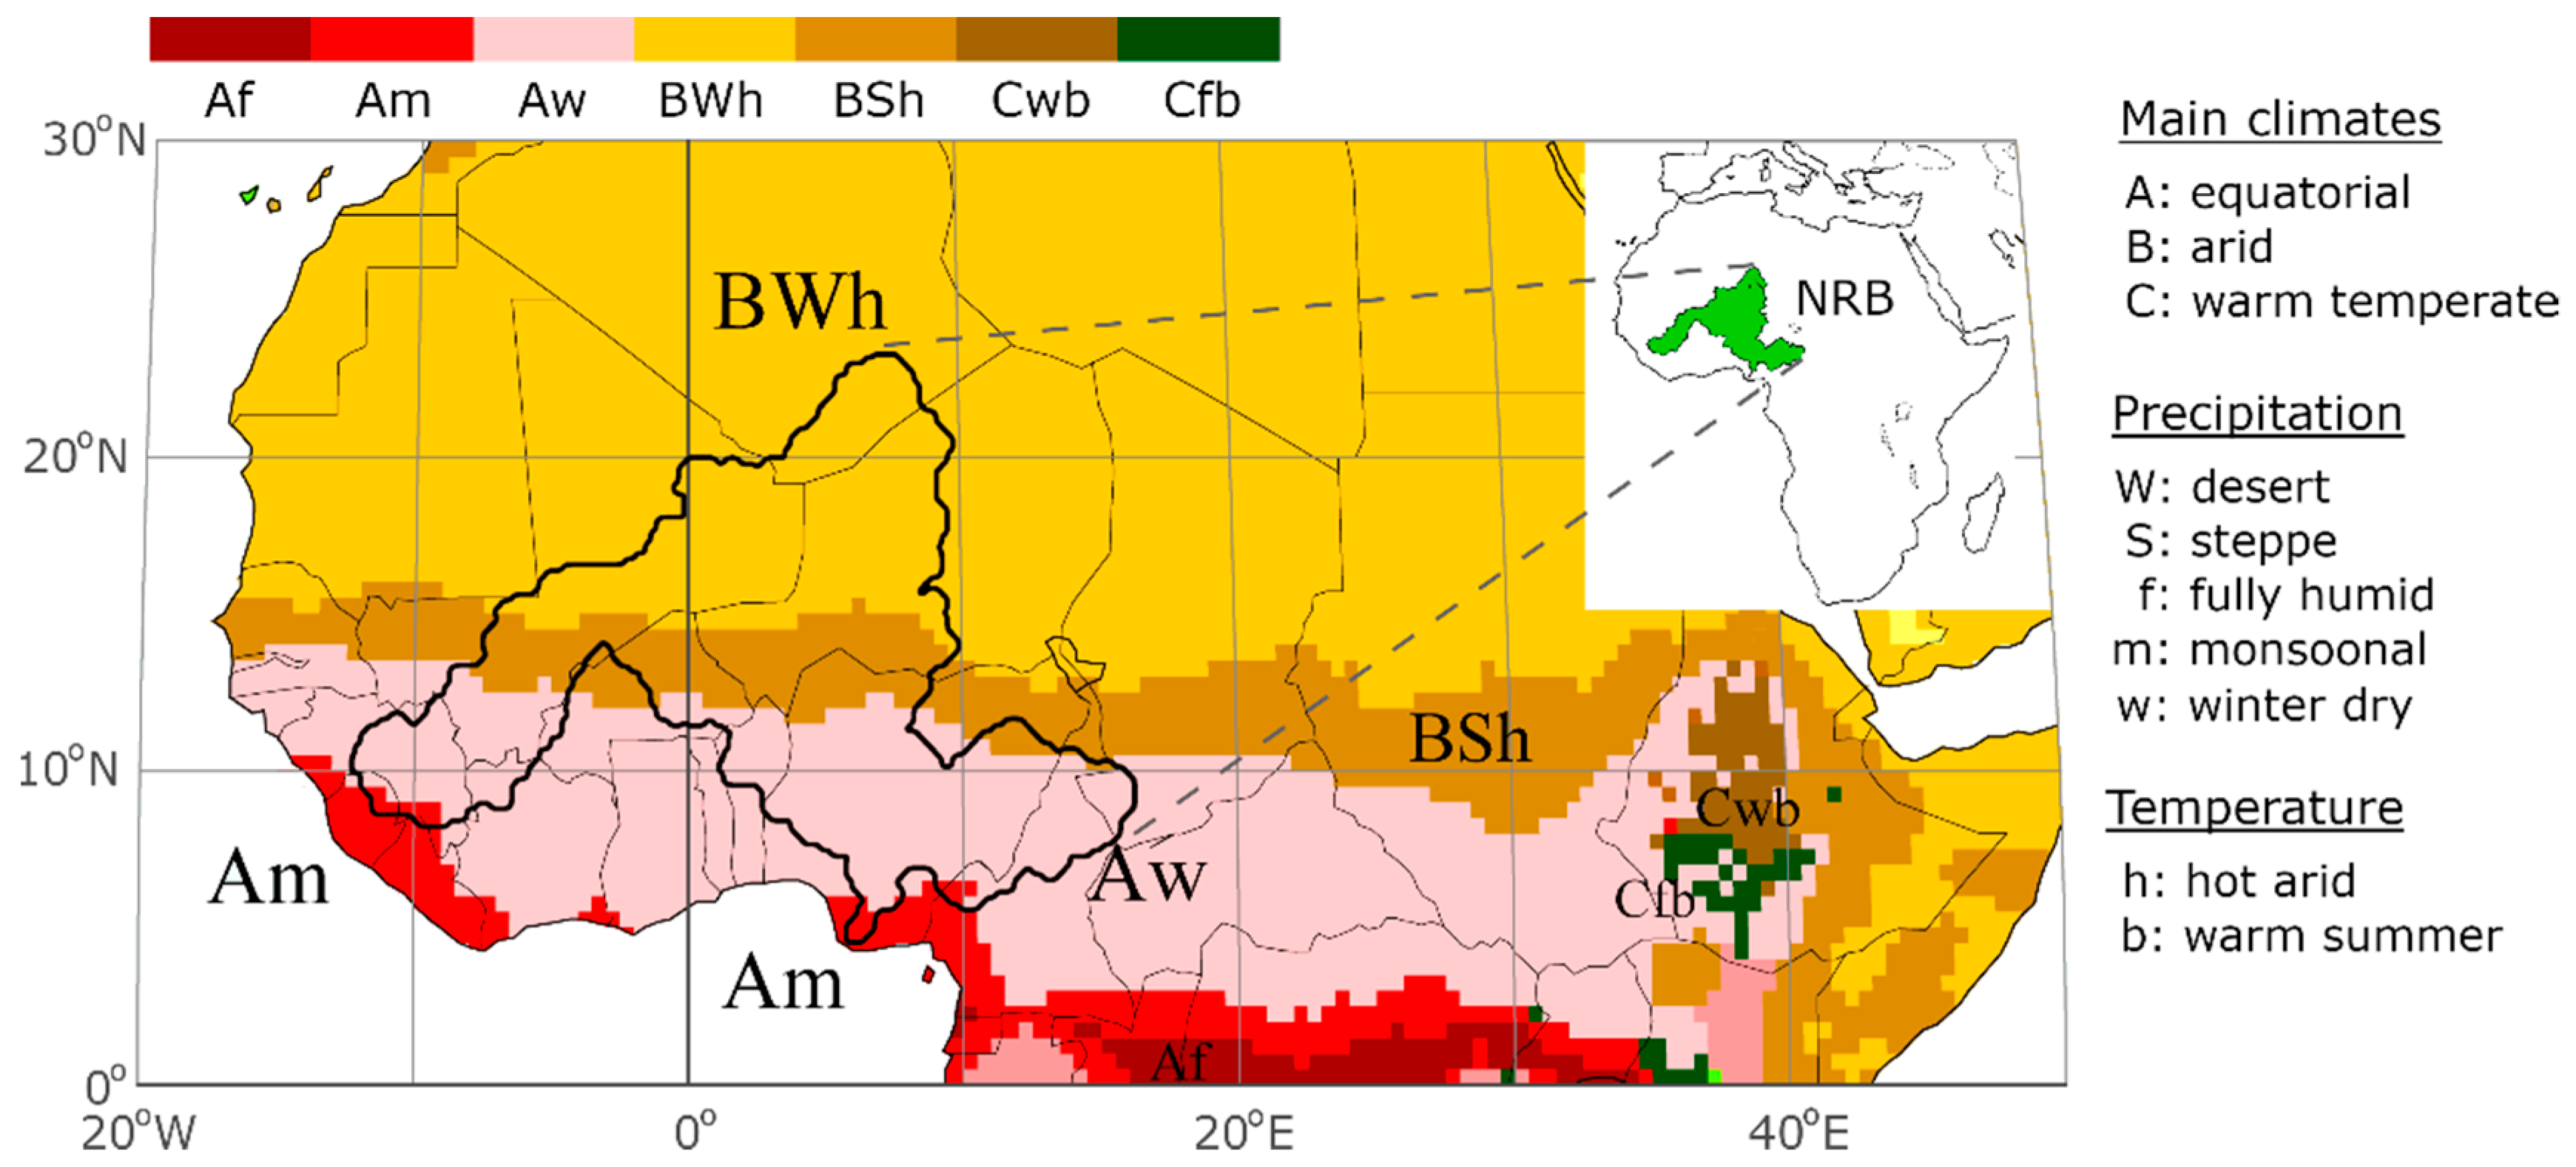
2. Study Region
3. Materials and Methods
3.1. Methods
3.1.1. Identification of Climatological Rainfall Zones (CRZs)
3.1.2. Identification of Monthly Climatological Moisture Sources
3.1.3. Identification of Dry and Wet Conditions
3.2. Data
4. Results and Discussion
4.1. Rainfall over the NRB
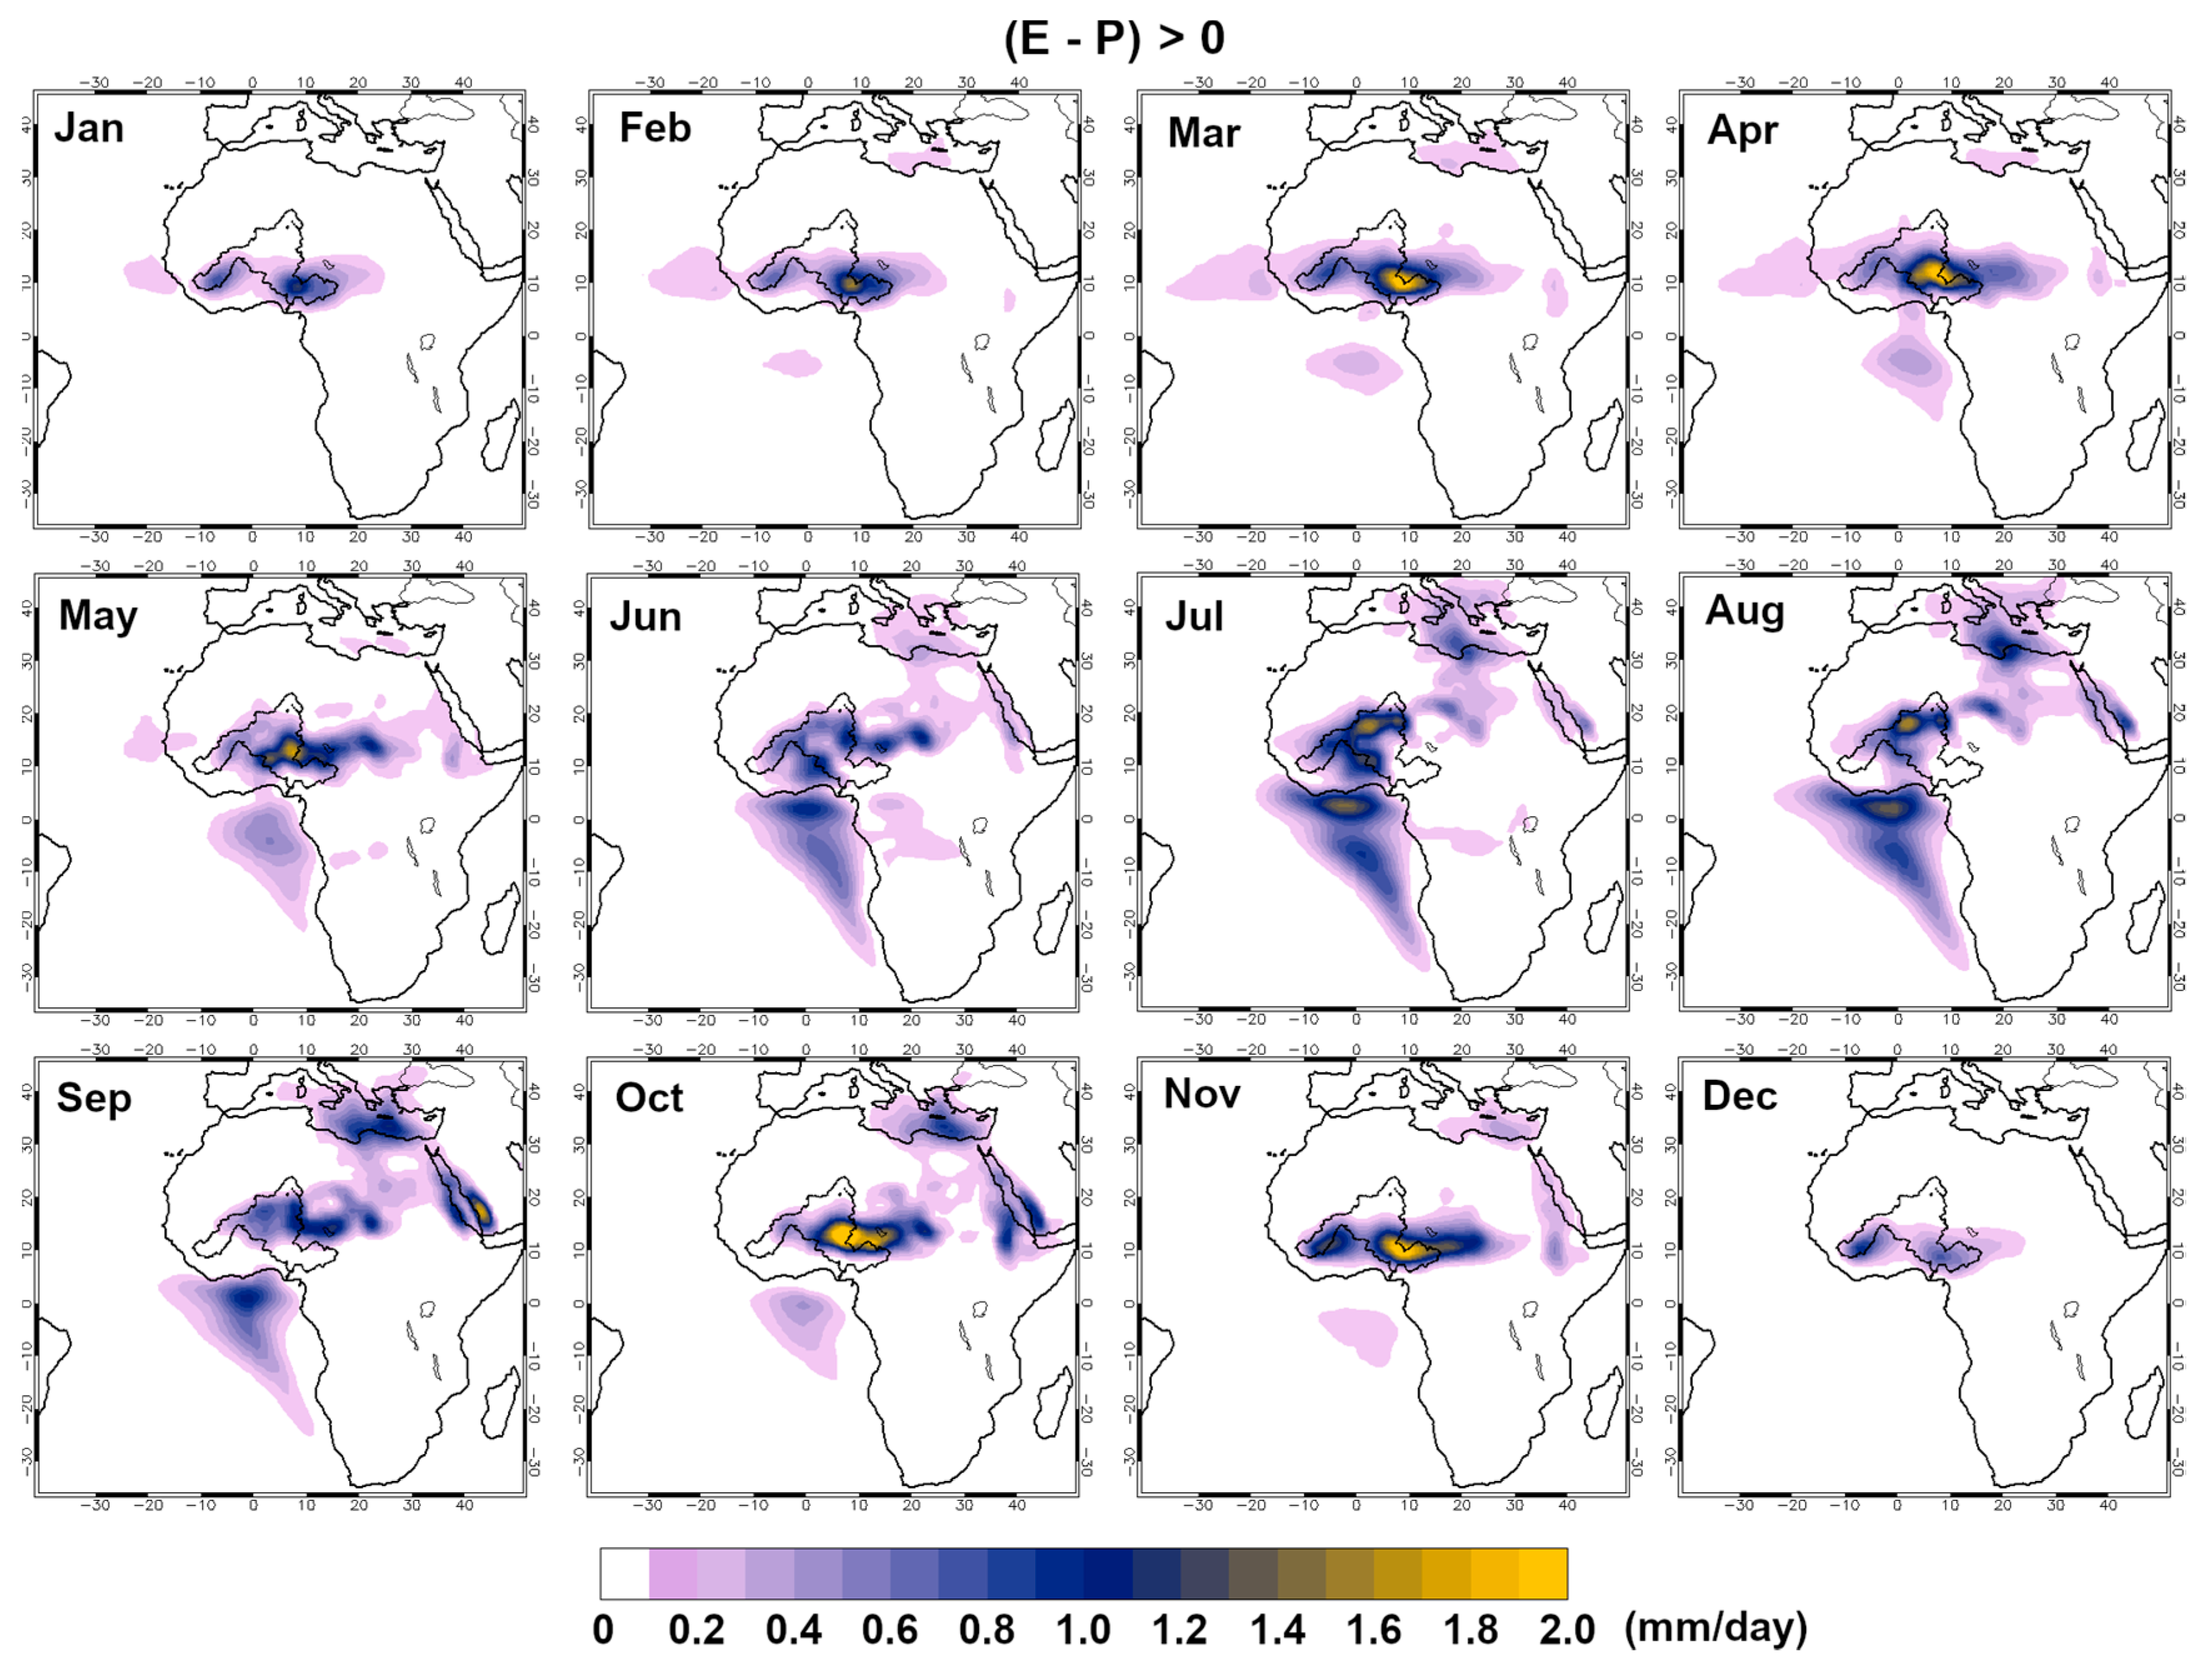
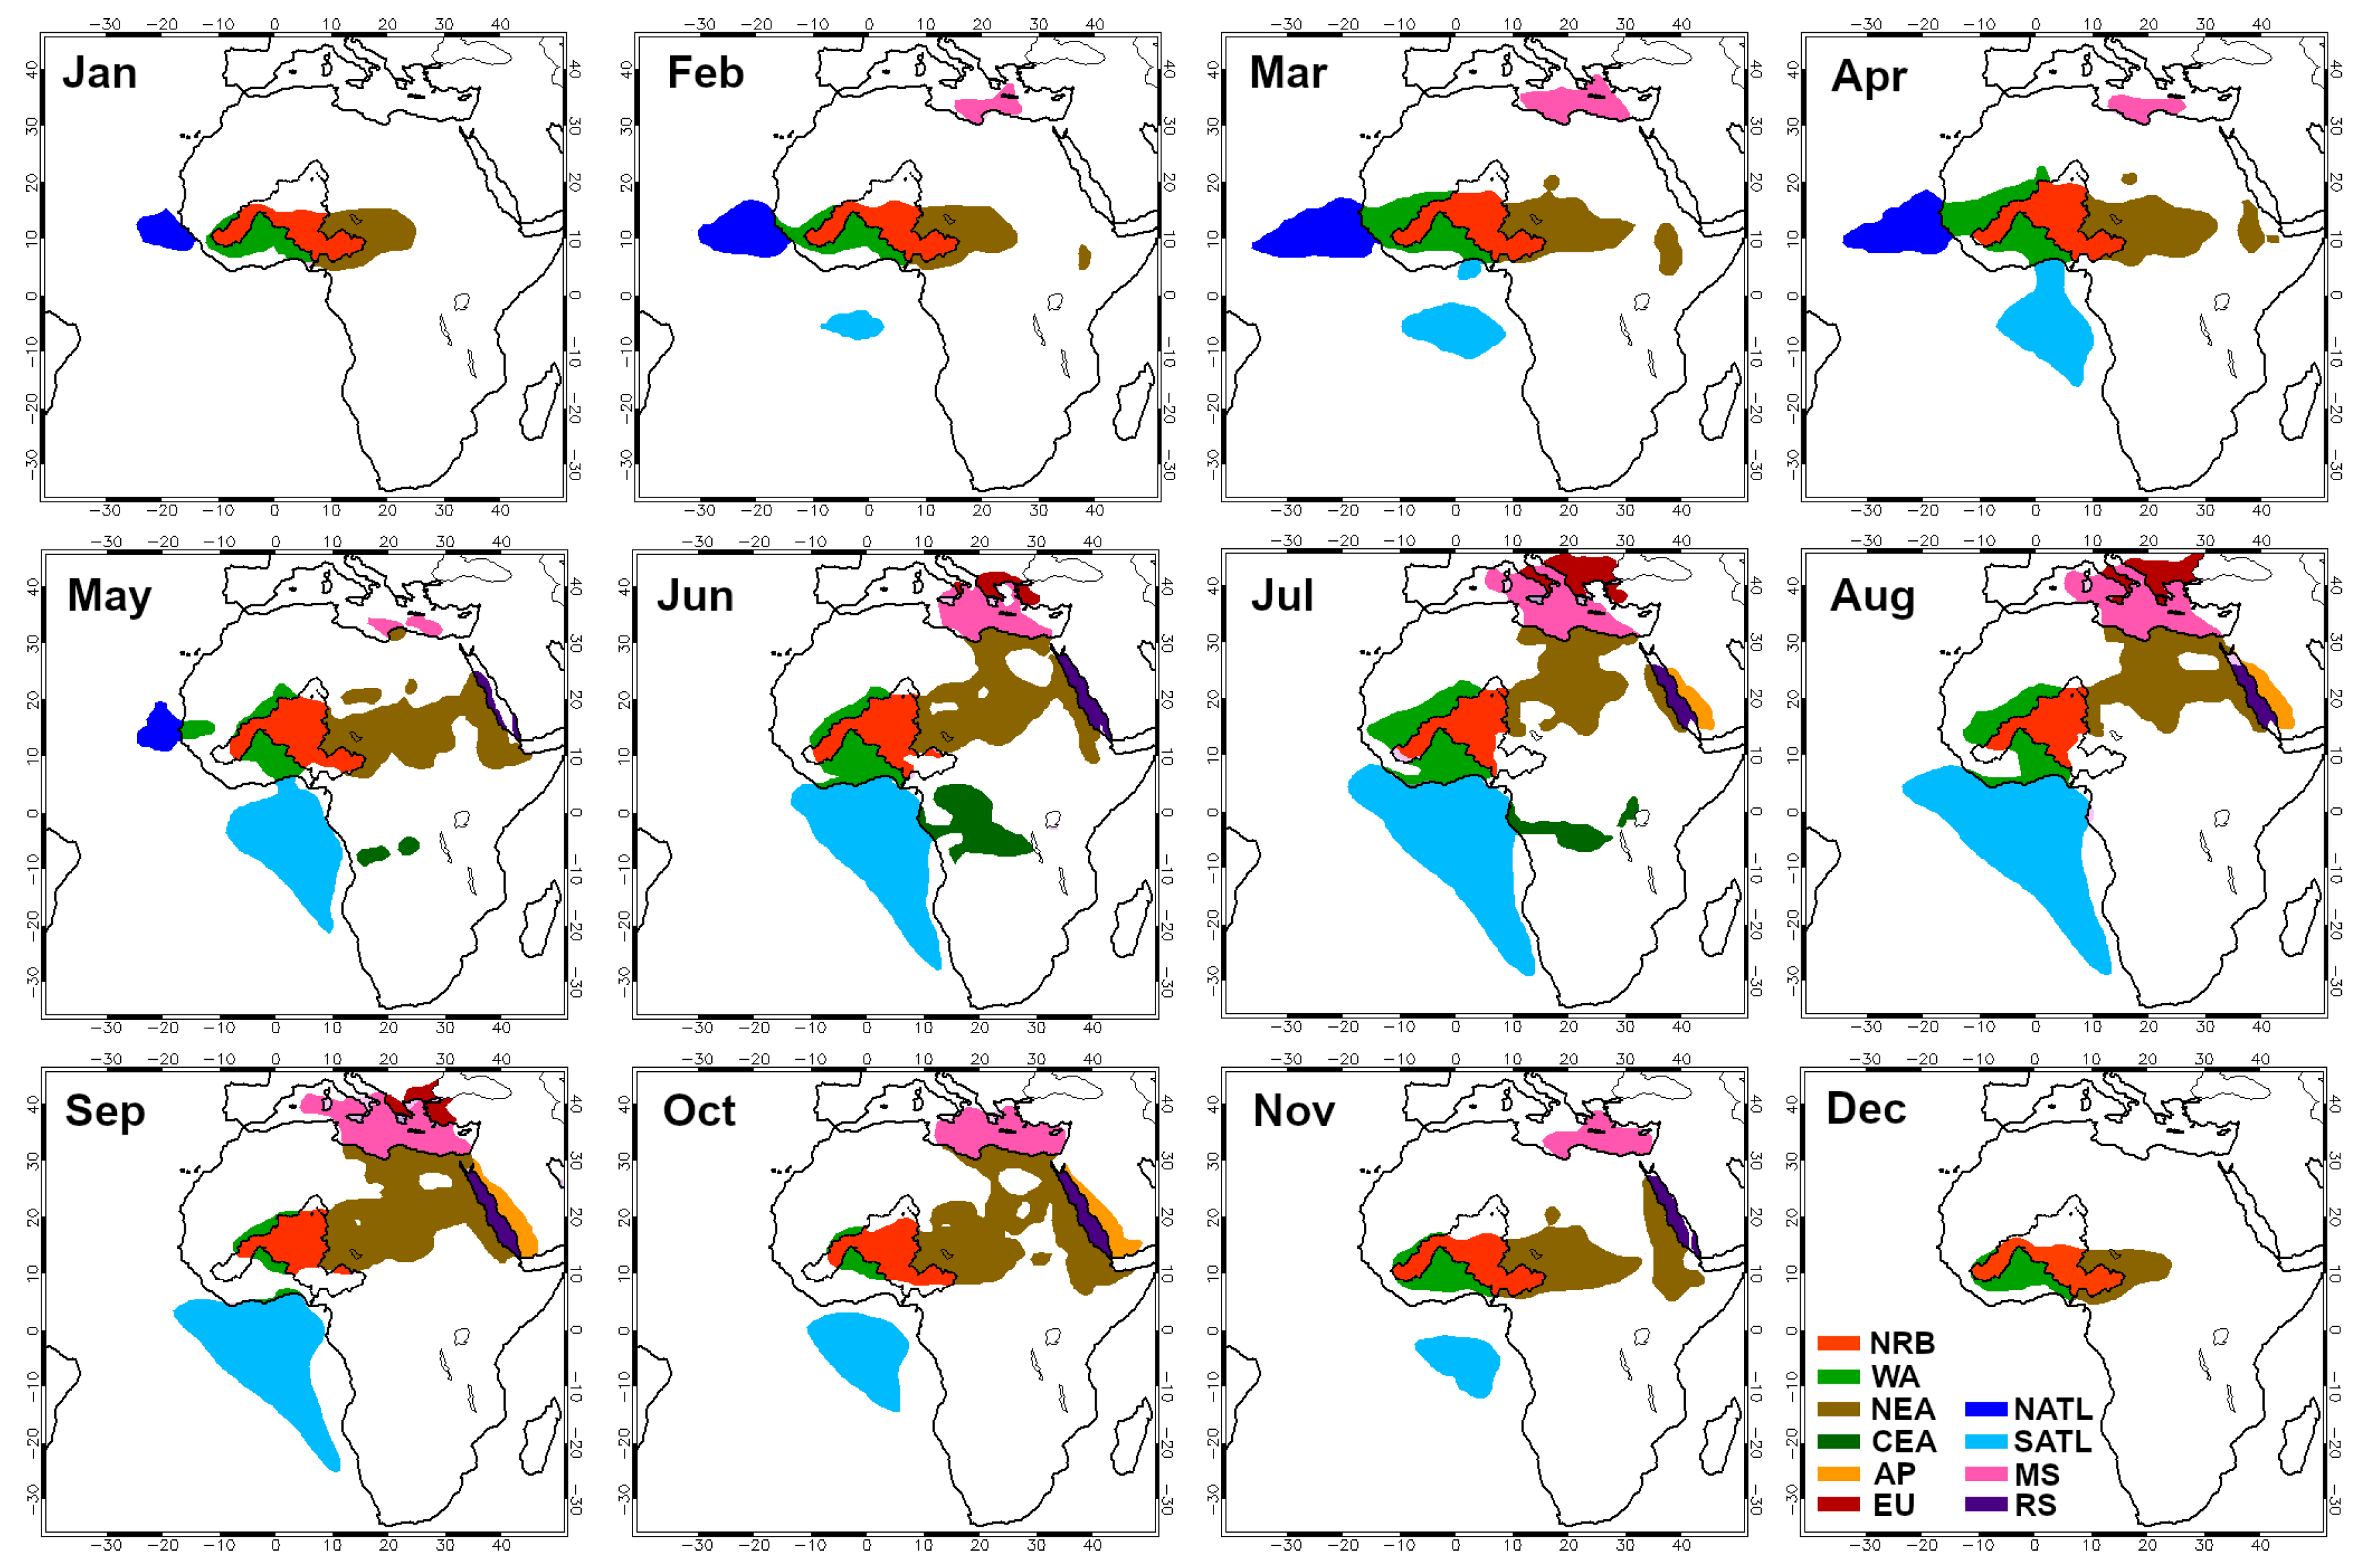
4.2. Identification of Moisture Sources
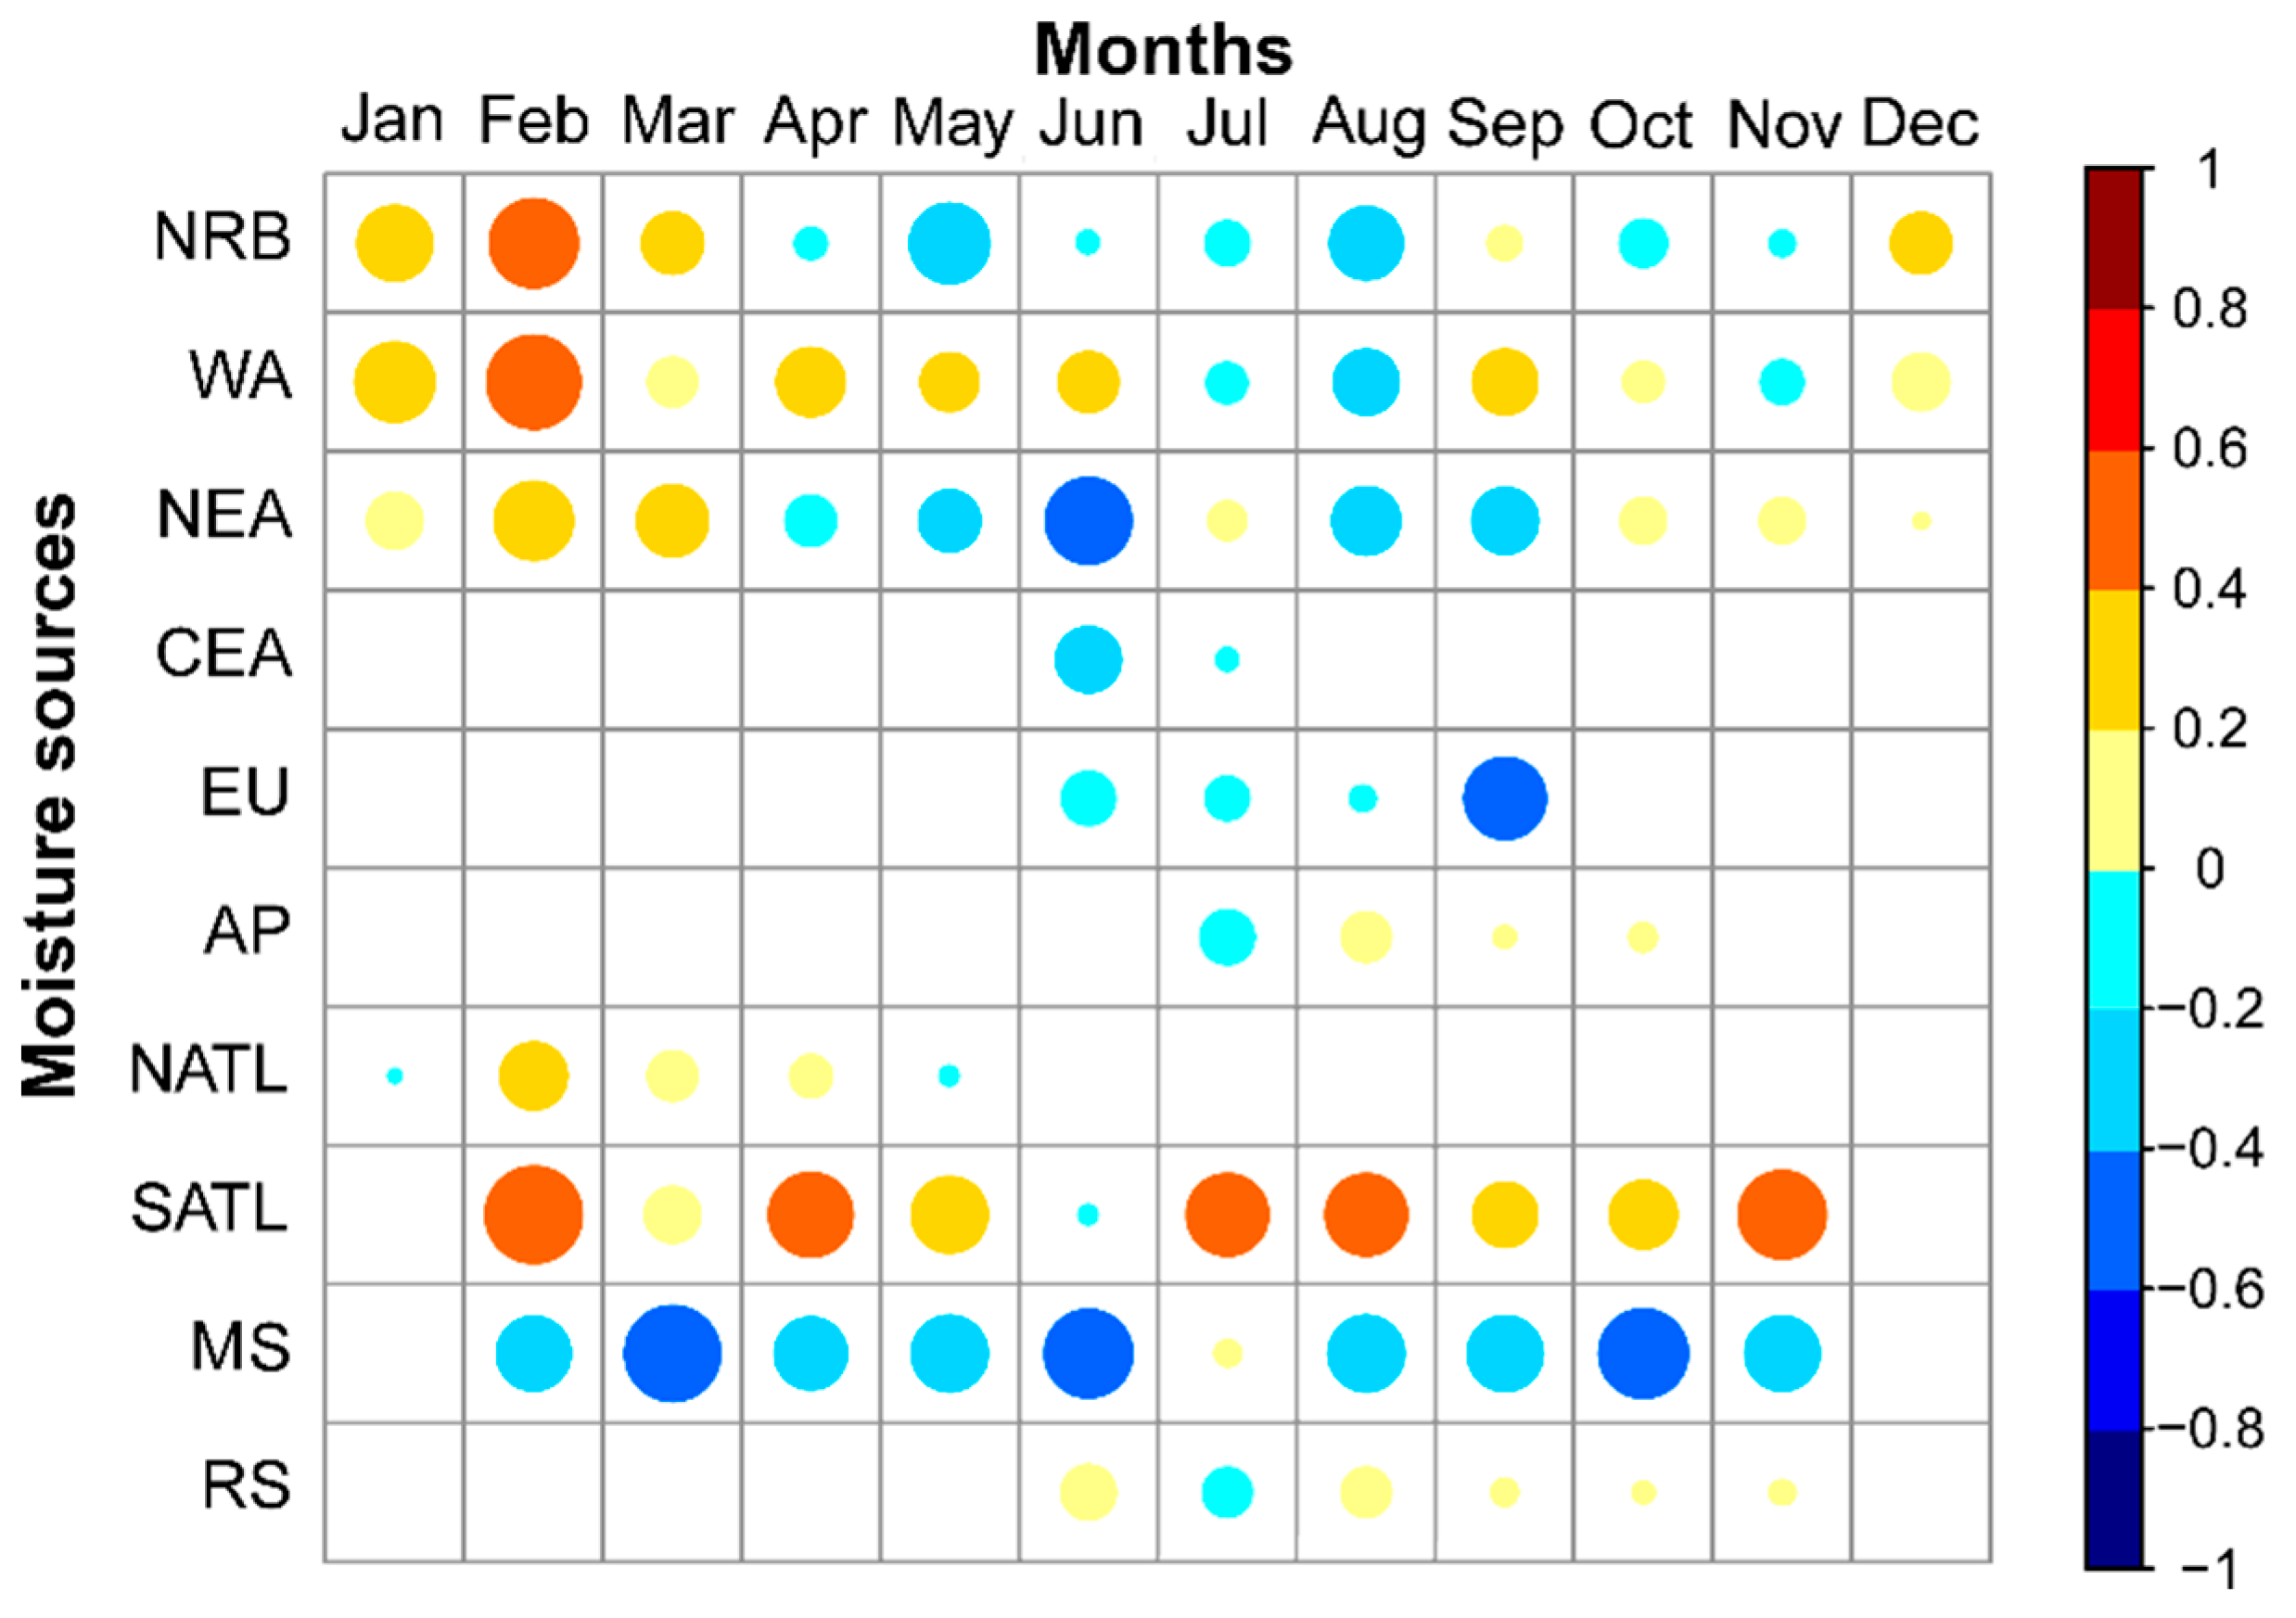
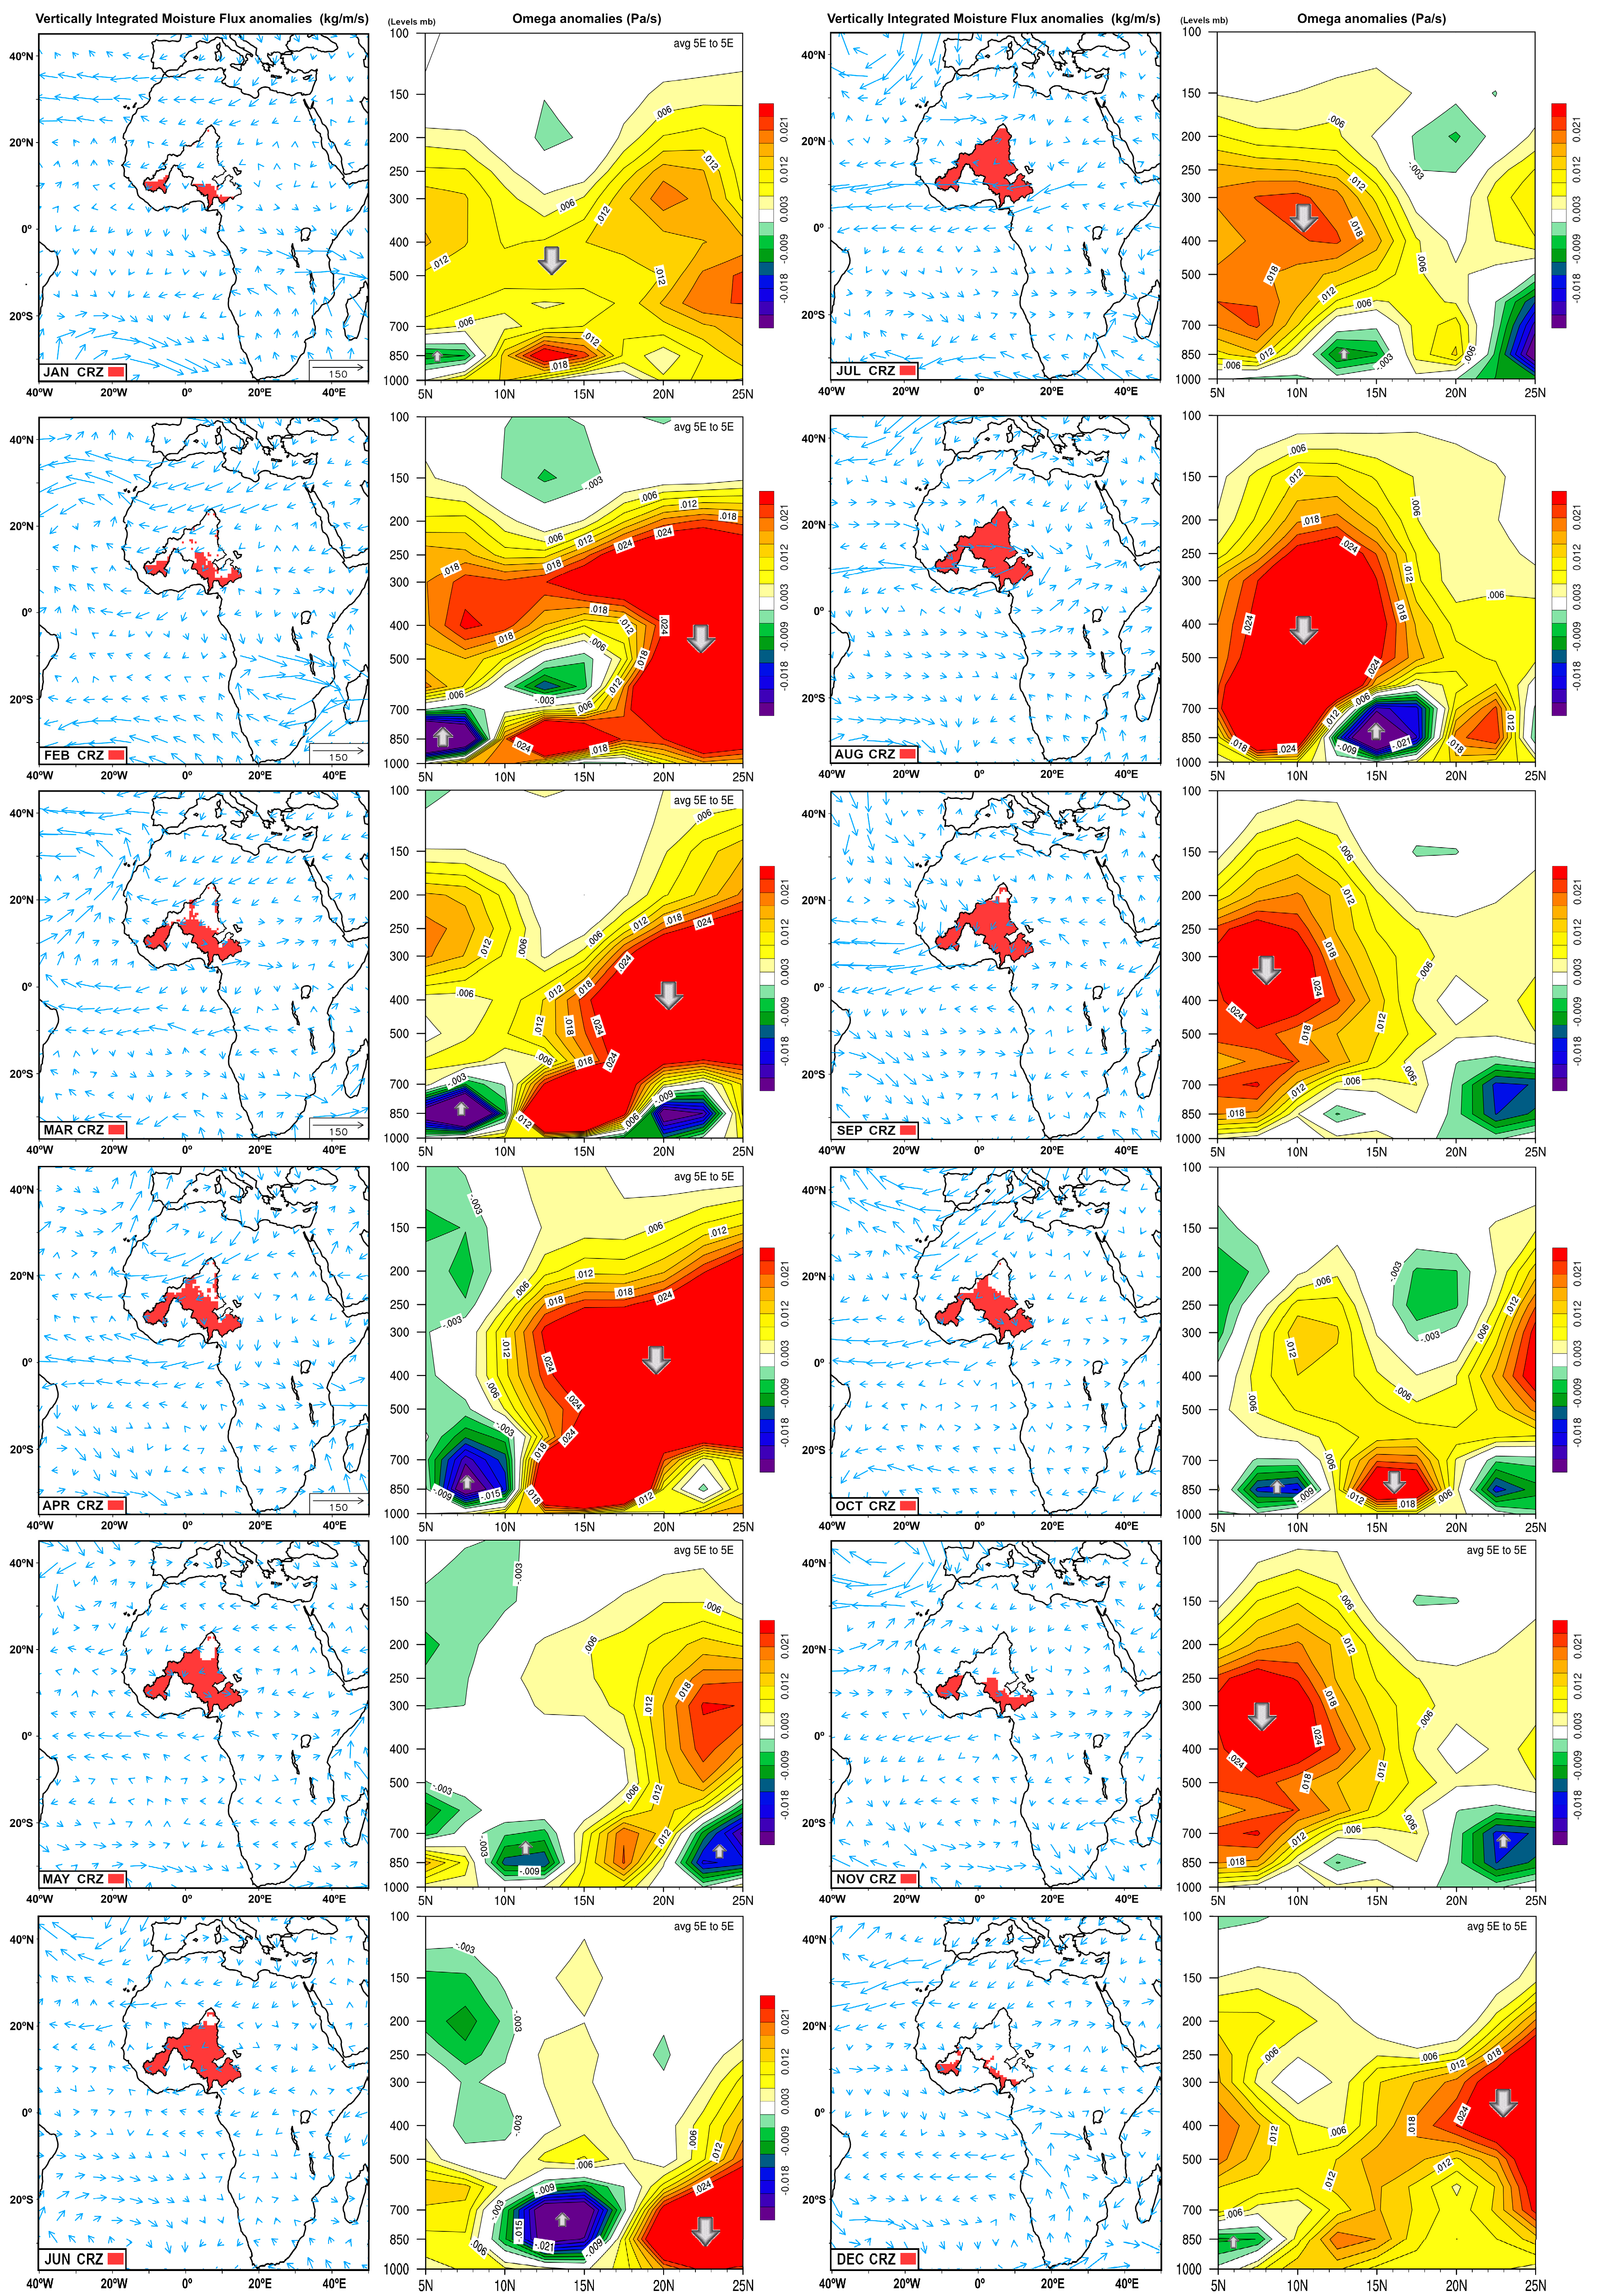
Moisture Uptake from the Sources
4.3. Identification of Dry and Wet Conditions in the CRZs
4.4. Moisture Uptake and SPI1 Relationship
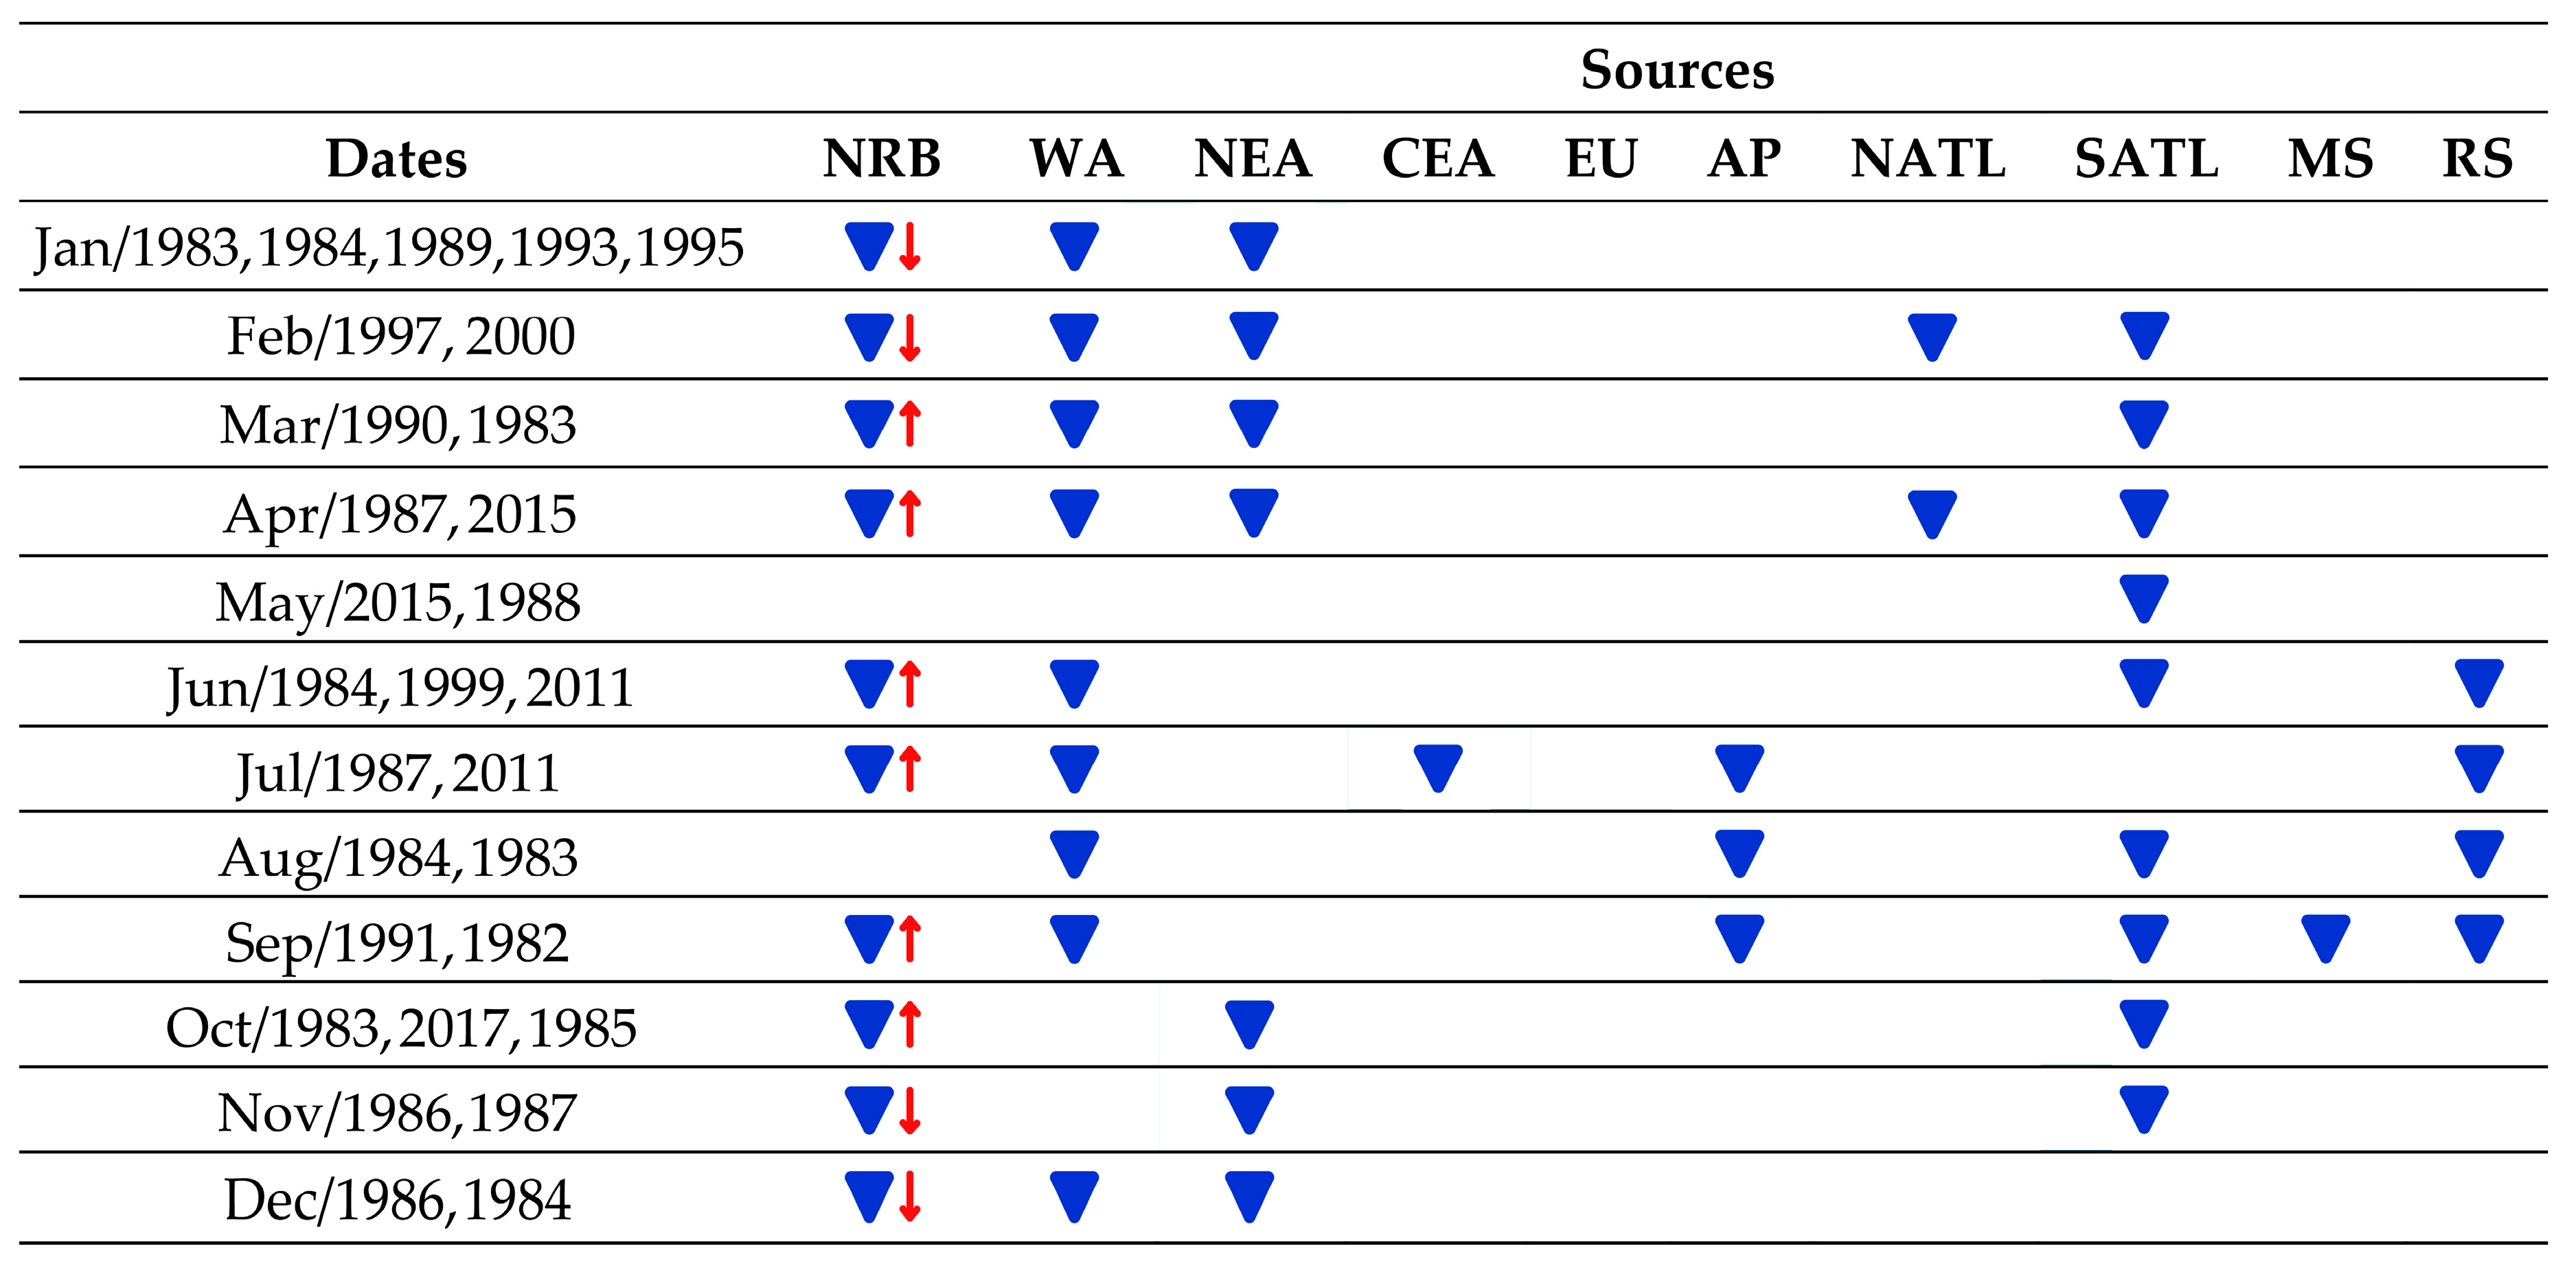
Roles of the Sources during Extremely Dry Conditions
5. Conclusions
Author Contributions
Funding
Acknowledgments
Conflicts of Interest
References
- Oyerinde, G.T.; Hountondji, F.C.C.; Wisser, D.; Diekkruger, B.; Lawin, A.E.; Odofin, A.J.; Afouda, A. Hydro-climatic changes in the Niger basin and consistency of local perceptions. Reg. Environ. Chang. 2015, 15, 1627–1637. [Google Scholar] [CrossRef]
- Zhang, W.; Brandt, M.; Guichard, F.; Tian, Q.; Fensholt, R. Using long-term daily satellite based rainfall data (1983–2015) to analyze spatio-temporal changes in the sahelian rainfall regime. J. Hydrol. 2017, 550, 427–440. [Google Scholar] [CrossRef]
- Lebel, T.; Diedhiou, A.; Laurent, H. Seasonal cycle and interannual variability of the Sahelian rainfall at hydrological scales. J. Geophys. Res. 2003, 108, 1401–1411. [Google Scholar] [CrossRef]
- Nicholson, S.E. The West African Sahel: A Review of Recent Studies on the Rainfall Regime and Its Interannual Variability. ISRN Meteorol. 2013, 2013, 453521. [Google Scholar] [CrossRef]
- Druyan, L.M.; Koster, R.D. Sources of Sahel Precipitation for Simulated Drought and Rainy Seasons. J. Clim. 1989, 2, 1438–1446. [Google Scholar] [CrossRef]
- Pu, B.; Cook, K.H. Role of the West African westerly jet in Sahel rainfall variations. J. Clim. 2012, 25, 2880–2896. [Google Scholar] [CrossRef]
- Rodríguez-Fonseca, B.; Mohino, E.; Mechoso, C.R.; Caminade, C.; Biasutti, M.; Gaetani, M.; Garcia-Serranog, J.; Vizyh, E.K.; Cookh, K.; Xue, Y.; et al. Variability and Predictability of West African Droughts: A Review on the Role of Sea Surface Temperature Anomalies. J. Clim. 2015, 28, 4034–4060. [Google Scholar] [CrossRef]
- Wang, S.; Gillies, R.R. Observed change in Sahel rainfall, circulations, African easterly waves, and Atlantic hurricanes since 1979. Int. J. Geophys. 2011, 2011, 259529. [Google Scholar] [CrossRef]
- Fontaine, B.; Roucou, P.; Gaetani, M.; Marteau, R. Recent changes in precipitations, ITCZ convection and northern tropical circulation over North Africa (1979–2007). Int. J. Climatol. 2011, 31, 633–648. [Google Scholar] [CrossRef]
- Van der Ent, R.J. A New View on the Hydrological Cycle over Continents. Ph.D. Thesis, Delft University of Technology, Delft, The Netherlands, 2014. [Google Scholar]
- Sorí, R.; Nieto, R.; Drumond, A.; Gimeno, L. The Niger River Basin Moisture Sources: A Lagrangian Analysis. Atmosphere 2017, 8, 38. [Google Scholar] [CrossRef]
- Okpara, J.N.; Tarhule, A.A.; Perumal, M. Study of Climate Change in Niger River Basin, West Africa: Reality Not a Myth. Chapter 1. In Climate Change—Realities, Impacts Over Ice Cap, Sea Level and Risks; IntechOpen: Rijeka, Croatia, 2013. [Google Scholar] [CrossRef]
- Adelekan, I.O.; Adegebo, B.O. Variation in onset and cessation of the rainy season in Ibadan. J. Sci. Res. 2014, 13, 13–21. [Google Scholar]
- Dunning, C.M.; Black, E.C.; Allan, R.P. The onset and cessation of seasonal rainfall over Africa. J. Geophys. Res. Atmos. 2016, 121, 11405–11424. [Google Scholar] [CrossRef]
- Odekunle, T.O.; Eludoyin, A.O. Sea surface temperature patterns in the Gulf of Guinea: Their implications for the spatio-temporal variability of precipitation in West Africa. Int. J. Climatol. 2008, 28, 1507–1517. [Google Scholar] [CrossRef]
- Joly, M.; Voldoire, A. Role of the Gulf of Guinea in the inter-annual variability of the West African monsoon: What do we learn from CMIP3 coupled simulations? Int. J. Climatol. 2010, 30, 1843–1856. [Google Scholar] [CrossRef]
- Ali, K.E.; Kouadio, K.Y.; Zahiri, E.-P.; Aman, A.; Assamoi, A.P.; Bourles, B. Influence of the Gulf of Guinea Coastal and Equatorial Upwellings on the Precipitations along its Northern Coasts during the Boreal Summer Period. Asian J. Appl. Sci. 2011, 4, 271–285. [Google Scholar] [CrossRef]
- Nnamchi, H.C.; Li, J.; Kang, I.-S.; Kucharski, F. Simulated impacts of the South Atlantic Ocean Dipole on summer precipitation at the Guinea Coast. Clim. Dyn. 2013, 41, 677. [Google Scholar] [CrossRef]
- Trenberth, K.E. Atmospheric Moisture Recycling: Role of Advection and Local Evaporation. J. Clim. 1999, 12, 1368–1381. [Google Scholar] [CrossRef]
- Gong, C.; Eltahir, E.A.B. Sources of Moisture for Rainfall in West Africa. Water Resour. Res. 1996, 32, 3115–3121. [Google Scholar] [CrossRef]
- Nieto, R.; Gimeno, L.; Trigo, R.M. A Lagrangian identification of major sources of Sahel moisture. Geophys. Res. Lett. 2006, 33, 1–6. [Google Scholar] [CrossRef]
- van der Ent, R.J.; Savenije, H.H.G.; Schaefli, B.; Steele-Dunne, S.C. Origin and fate of atmospheric moisture over continents. Water Resour. Res. 2010, 46, W09525. [Google Scholar] [CrossRef]
- Knoche, H.R.; Kunstmann, H. Tracking atmospheric water pathways by direct evaporation tagging: A case study for West Africa. J. Geophys. Res. Atmos. 2013, 118, 12345–12358. [Google Scholar] [CrossRef]
- Arnault, J.; Knoche, R.; Wei, J.; Kunstmann, H. Evaporation tagging and atmospheric water budget analysis with WRF: A regional precipitation recycling study for West Africa. Water Resour. Res. 2016, 52, 1544–1567. [Google Scholar] [CrossRef]
- DelSole, T.; Dirmeyer, P.; Zhao, M. Collaborative Research: Characterizing Land Surface Memory to Advance Climate Prediction; Annual Report: 0233320; Institute for Global Environmental Strategies: Hayama, Japan, 2009. [Google Scholar]
- Kelemen, F.D.; Ludwig, P.; Reyers, M.; Ulbrich, S.; Pinto, J.G. Evaluation of moisture sources for the Central European summer flood of May/June 2013 based on regional climate model simulations. Tellus A Dyn. Meteorol. Oceanogr. 2016, 68, 29288. [Google Scholar] [CrossRef]
- Ciric, D.; Nieto, R.; Ramos, A.M.; Drumond, A.; Gimeno, L. Wet Spells and Associated Moisture Sources Anomalies across Danube River Basin. Water 2017, 9, 615. [Google Scholar] [CrossRef]
- Drumond, A.; Nieto, R.; Gimeno, L. A Lagrangian approach for investigating anomalies in the moisture transport during drought episodes. Cuadernos de Investigación Geográfica 2016, 42, 113–125. [Google Scholar] [CrossRef]
- Sorí, R.; Nieto, R.; Drumond, A.; Vicente-Serrano, S.V.; Gimeno, L. A Lagrangian perspective of the hydrological cycle in the Congo River basin. Earth Syst. Dyn. 2017, 8, 653–675. [Google Scholar] [CrossRef]
- Gimeno, L. Grand challenges in atmospheric science. Front. Earth Sci. 2013, 1, 1–5. [Google Scholar] [CrossRef]
- Tallaksen, L.M.; Van Lanen, H.A. Hydrological Drought: Processes and Estimation Methods for Streamflow and Groundwater; Elsevier: Amsterdam, The Netherlands, 2004; Volume 48. [Google Scholar]
- Masih, I.; Maskey, S.; Mussá, F.E.F.; Trambauer, P. A review of droughts on the African continent: A geospatial and long-term perspective. Hydrol. Earth Syst. Sci. 2014, 18, 3635–3649. [Google Scholar] [CrossRef]
- Nicholson, S. On the question of the “recovery” of the rains in the West African Sahel. J. Arid Environ. 2005, 63, 615–641. [Google Scholar] [CrossRef]
- Okpara, J.N.; Tarhule, A. Evaluation of Drought Indices in the Niger Basin, West Africa. J. Geogr. Earth Sci. 2015, 3, 1–32. [Google Scholar] [CrossRef]
- Hagos, S.M.; Cook, K.H. Ocean warming and late-twentieth-century Sahel drought and recovery. J. Clim. 2008, 21, 3797–3814. [Google Scholar] [CrossRef]
- Gautier, D.; Denis, D.; Locatelli, B. Impacts of drought and responses of rural populations in West Africa: A systematic review. WIREs Clim. Chang. 2016, 7, 666–681. [Google Scholar] [CrossRef]
- Sorí, R.; Marengo, J.; Nieto, R.; Drumond, A.; Gimeno, L. The Atmospheric Branch of the Hydrological Cycle over the Negro and Madeira River Basins in the Amazon Region. Water 2018, 10, 738. [Google Scholar] [CrossRef]
- Stojanovic, M.; Drumond, A.; Nieto, R.; Gimeno, L. Anomalies in Moisture Supply during the 2003 Drought Event in Europe: A Lagrangian Analysis. Water 2018, 10, 467. [Google Scholar] [CrossRef]
- Stojanovic, M.; Drumond, A.; Nieto, R.; Gimeno, L. Variations in Moisture Supply from the Mediterranean Sea during Meteorological Drought Episodes over Central Europe. Atmosphere 2018, 9, 278. [Google Scholar] [CrossRef]
- Drumond, A.; Gimeno, L.; Nieto, R.; Trigo, R.M.; Vicente-Serrano, S.M. Drought episodes in the climatological sinks of the Mediterranean moisture source: The role of moisture transport. Glob. Planet. Chang. 2017, 151, 4–14. [Google Scholar] [CrossRef]
- Food and Agriculture Organization of the United Nations (FAO). Irrigation Potential in Africa. A Basin Approach; FAO Land and Water Bulletin: Roma, Italy, 1997; Volume 4. [Google Scholar]
- Lienou, G.; Mahe, G.; Dieulin, C.; Paturel, J.E.; Bamba, F.; Sighomnou, D.; Dessouassi, R. The River Niger water availability: Facing future needs and climate change. In Global Change: Facing Risks and Threats to Water Resources, Proceedings of the Sixth World FRIEND Conference, Fez, Morocco, 25–29 October 2010; IAHS Publ. 340; IAHS Press: Wallingford, UK, 2010. [Google Scholar]
- Andersen, I.; Dione, O.; Jarosewich-Holder, M.; Olivry, J.-C. The Niger River Basin: A Vision for Sustainable Management; World Bank: Washington, DC, USA, 2005. [Google Scholar]
- Kottek, M.; Grieser, J.; Beck, C.; Rudolf, B.; Rubel, F. World Map of the Köppen-Geiger climate classification updated. Meteorol. Z. 2006, 15, 259–263. [Google Scholar] [CrossRef]
- Food and Agriculture Organization of the United Nations (FAO). Disaster Risk Management Strategy in West Africa and the Sahel (2011–2013); FAO: Rome, Italy, 2011. [Google Scholar]
- Chou, C.; Chen, C.A.; Tan, P.H.; Chen, K.T. Mechanisms for global warmingimpacts on precipitation frequency and intensity. J. Clim. 2012, 25, 3291–3306. [Google Scholar] [CrossRef]
- Deni, S.M.; Jemain, A.A.; Ibrahim, K. The spatial distribution of wet and dry spells over Peninsular Malaysia. Theor. Appl. Climatol. 2008, 94, 163–173. [Google Scholar] [CrossRef]
- Nandargi, S.; Mulye, S.S. Relationships between rainy days, mean daily intensity, and seasonal rainfall over the Koyna catchment during 1961–2005. Sci. World J. 2012, 2012, 894313. [Google Scholar] [CrossRef] [PubMed]
- Stohl, A.; James, P. A Lagrangian analysis of the atmospheric branch of the global water cycle. Part 1: Method description, validation, and demonstration for the August 2002 flooding in central Europe. J. Hydrometeorol. 2004, 5, 656–678. [Google Scholar] [CrossRef]
- Stohl, A.; James, P. A Lagrangian analysis of the atmospheric branch of the global water cycle: 2. Earth’s river catchments, ocean basins, and moisture transports between them. J. Hydrometeorol. 2005, 6, 961–984. [Google Scholar] [CrossRef]
- Seibert, P.; Frank, A. Source-receptor matrix calculation with a Lagrangian particle dispersion model in backward mode. Atmos. Chem. Phys. 2004, 4, 51–63. [Google Scholar] [CrossRef]
- Numaguti, A. Origin and recycling processes of precipitating water over the Eurasian continent: Experiments using an atmospheric general circulation model. J. Geophys. Res. 1999, 104, 1957–1972. [Google Scholar] [CrossRef]
- Gimeno, L.; Stohl, A.; Trigo, R.M.; Dominguez, F.; Yoshimura, K.; Yu, L.; Drumond, A.; Durán-Quesada, A.M.; Nieto, R. Oceanic and terrestrial sources of continental precipitation. Rev. Geophys. 2012, 50, RG4003. [Google Scholar] [CrossRef]
- Stojanovic, M.; Drumond, A.; Nieto, R.; Gimeno, L. Moisture Transport Anomalies over the Danube River Basin during Two Drought Events: A Lagrangian Analysis. Atmosphere 2017, 8, 193. [Google Scholar] [CrossRef]
- Dirmeyer, P.A.; Brubaker, K.L. Contrasting evaporative moisture sources during the drought of 1988 and the flood of 1993. J. Geophys. Res. 1999, 104, 19383–19397. [Google Scholar] [CrossRef]
- Drumond, A.; Marengo, J.; Ambrizzi, T.; Nieto, R.; Moreira, L.; Gimeno, L. The role of the Amazon Basin moisture in the atmospheric branch of the hydrological cycle: A Lagrangian analysis. Hydrol. Earth Syst. Sci. 2014, 18, 2577–2598. [Google Scholar] [CrossRef]
- Bin, C.; Xu, X.-D.; Zhao, T. Main moisture sources affecting lower Yangtze River Basin in boreal summers during 2004–2009. Int. J. Climatol. 2013, 33, 1035–1046. [Google Scholar] [CrossRef]
- Drumond, A.; Nieto, R.; Gimeno, L.; Ambrizzi, T. A Lagrangian identification of major sources of moisture over Central Brazil and La Plata Basin. J. Geophys. Res. Atmos. 2008, 113. [Google Scholar] [CrossRef]
- Ciric, D.; Stojanovic, M.; Drumond, A.; Nieto, R.; Gimeno, L. Tracking the Origin of Moisture over the Danube River Basin Using a Lagrangian Approach. Atmosphere 2016, 7, 162. [Google Scholar] [CrossRef]
- World Meteorological Organization. Standardized Precipitation Index User Guide; WMO-No. 1090; Svoboda, M., Hayes, M., Wood, D., Eds.; World Meteorological Organization: Geneva, Switzerland, 2012. [Google Scholar]
- Heim, J.R. A review of twentieth-century drought indices used in the United States, B. Am. Meteorol. Soc. 2002, 83, 1149–1165. [Google Scholar] [CrossRef]
- Zargar, A.; Sadiq, R.; Naser, B.; Khan, F.I. A review of drought indices. Environ. Rev. 2011, 19, 333–349. [Google Scholar] [CrossRef]
- McKee, T.B.; Doesken, N.J.; Kleist, J. The relationship of drought frequency and duration to time scales. In Proceedings of the Eighth Conference on Applied Climatology, Anaheim, CA, USA, 17–22 January 1993; pp. 179–184. [Google Scholar]
- Wu, H.; Svoboda, M.D.; Hayes, M.J.; Wilhite, D.A.; Wen, F. Appropriate application of the Standardized Precipitation Index in arid locations and dry seasons. Int. J. Climatol. 2007, 27, 65–79. [Google Scholar] [CrossRef]
- Beguería, S.; Vicente-Serrano, S.M.; Reig, F.; Latorre, B. Standardized Precipitation Evapotranspiration Index (SPEI) revisited: Parameter fitting, evapotranspiration models, tools, datasets and drought monitoring. Int. J. Climatol. 2014, 34, 3001–3023. [Google Scholar] [CrossRef]
- Fischer, T.; Gemmer, M.; Luliu, L.; Buda, S. Temperature and precipitation trends and dryness/wetness pattern in the Zhujiang River Basin, South China, 1961–2007, 1961–2007. Quat. Int. 2011, 244, 138–148. [Google Scholar] [CrossRef]
- Guttman, N.B. Accepting the standardized precipitation index: A calculation algorithm. J. Am. Water Resour. Assoc. 1999, 35, 311–322. [Google Scholar] [CrossRef]
- Agnew, C.T. Using the SPI to identify drought. Drought Netw. News 2000, 12, 6–12. [Google Scholar]
- Dee, D.P.; Uppala, S.M.; Simmons, A.J.; Berrisford, P.; Poli, P.; Kobayashi, S.; Andrae, U.; Balmaseda, M.A.; Balsamo, G.; Bauer, P.; et al. The ERA-Interim reanalysis: Configuration and performance of the data assimilation system. Q. J. R. Meteorol. Soc. 2011, 137, 553–597. [Google Scholar] [CrossRef]
- Rienecker, M.M.; Suarez, M.J.; Gelaro, R.; Todling, R.; Bacmeister, J.; Liu, E.; Bosilovich, M.G.; Schubert, S.D.; Takacs, L.; Kim, G.-K.; et al. MERRA: NASA’s Modern-Era Retrospective Analysis for Research and Applications. J. Clim. 2011, 24, 3624–3648. [Google Scholar] [CrossRef]
- Saha, S.; Moorthi, S.; Pan, H.; Wu, X.; Wang, J.; Nadiga, S.; Tripp, P.; Kistler, R.; Woollen, J.; Behringer, D.; et al. The NCEP Climate Forecast System Reanalysis. Bull. Am. Meteorol. Soc. 2010, 91, 1015–1058. [Google Scholar] [CrossRef]
- Lorenz, C.; Kunstmann, H. The hydrological cycle in three state-of-the-art reanalyses: Intercomparison and performance analysis. J. Hydrometeorol. 2012, 13, 1397–1420. [Google Scholar] [CrossRef]
- Copernicus Climate Change Service (C3S). ERA5: Fifth Generation of ECMWF Atmospheric Reanalyses of the Global Climate; Copernicus Climate Change Service Climate Data Store (CDS): Geneva, Switzerland, 2017. [Google Scholar]
- Harris, I.; Jones, P.D.; Osborn, T.J.; Lister, D.H. Updated high-resolution grids of monthly climatic observations—The CRU TS3.10 Dataset. Int. J. Climatol. 2014, 34, 623–642. [Google Scholar] [CrossRef]
- Martens, B.; Miralles, D.G.; Lievens, H.; van der Schalie, R.; de Jeu, R.A.M.; Fernández-Prieto, D.; Beck, H.E.; Dorigo, W.A.; Verhoest, N.E.C. GLEAM v3: Satellite-based land evaporation and root-zone soil moisture. Geosci. Model. Dev. 2017, 10, 1903–1925. [Google Scholar] [CrossRef]
- Miralles, D.G.; Holmes, T.R.H.; de Jeu, R.A.M.; Gash, J.H.; Meesters, A.G.C.A.; Dolman, A.J. Global land-surface evaporation estimated from satellite-based observations. Hydrol. Earth Syst. Sci. 2011, 15, 453–469. [Google Scholar] [CrossRef]
- Kalnay, E.; Kanamitsu, M.; Kistler, R.; Collins, W.; Deaven, D.; Gandin, L.; Iredell, M.; Saha, S.; White, G.; Woollen, J.; et al. The NCEP/NCAR 40-year reanalysis project. Bull. Am. Meteorol. Soc. 1996, 77, 437–470. [Google Scholar] [CrossRef]
- Siegmund, J.; Bliefernicht, J.; Laux, P.; Kunstmann, H. Toward a seasonal precipitation prediction system for West Africa: Performance of CFSv2 and high-resolution dynamical downscaling. J. Geophys. Res. Atmos. 2015, 20. [Google Scholar] [CrossRef]
- Rodrigues, L.R.L.; García-Serrano, J.; Doblas-Reyes, F. Seasonal forecast quality of the West African monsoon rainfall regimes by multiple forecast systems. J. Geophys. Res. Atmos. 2014, 119, 7908–7930. [Google Scholar] [CrossRef]
- Lélé, I.M.; Leslie, L.M.; Lamb, P.J. Analysis of Low-Level Atmospheric Moisture Transport Associated with the West African Monsoon. J. Clim. 2015, 28, 4414–4430. [Google Scholar] [CrossRef]
- Zeng, N.; Neelin, J.D.; Lau, K.M.; Tucker, C.J. Enhancement of interdecadal climate variability in the Sahel by vegetation interaction. Science 1999, 286, 1537–1540. [Google Scholar] [CrossRef] [PubMed]
- Dirmeyer, P.A.; Wei, J.; Bosilovich, M.G.; Mocko, D.M. Comparing evaporative sources of terrestrial precipitation and their extremes in MERRA using relative entropy. J. Hydrometeorol. 2014, 15, 102–116. [Google Scholar] [CrossRef]
- Miralles, D.G.; Jiménez, C.; Jung, M.; Michel, D.; Ershadi, A.; McCabe, M.F.; Hirschi, M.; Martens, B.; Dolman, A.J.; Fisher, J.B.; et al. The WACMOS-ET project—Part 2: Evaluation of global terrestrial evaporation data sets. Hydrol. Earth Syst. Sci. 2016, 20, 823–842. [Google Scholar] [CrossRef]
- Sims, A.P.; Nigoyi, D.S.; Raman, S. Adopting indices for estimating soil moisture: A North Carolina case study. Geophys. Res. Lett. 2002, 29, 1–4. [Google Scholar] [CrossRef]
- Douville, H.; Conil, S.; Tuteca, S.; Voldoire, A. Soil moisture memory and West African monsoon predictability: Artefact or reality? Clim. Dyn. 2007, 28, 723–742. [Google Scholar] [CrossRef]
- Savenije, H.H. The runoff coefficient as the key to moisture recycling. J. Hydrol. 1996, 176, 219–225. [Google Scholar] [CrossRef]
- Vicente-Serrano, S.M. Spatial and temporal analysis of droughts in the Iberian Peninsula (1910–2000). Hydrol. Sci. J. 2006, 51, 83–97. [Google Scholar] [CrossRef]
- Eltahir, E.A.B. A Soil Moisture–Rainfall Feedback Mechanism: 1. Theory and observations. Water Resour. Res. 1998, 34, 765–776. [Google Scholar] [CrossRef]
- Zheng, X.; Eltahir, E.A.B. A Soil Moisture–Rainfall Feedback Mechanism: 2. Numerical experiments. Water Resour. Res. 1998, 34, 777–785. [Google Scholar] [CrossRef]
- Oloruntadea, A.J.; Mohammad, T.A.; Ghazalib, A.H.; Wayayoka, A. Analysis of meteorological and hydrological droughts in the Niger-South Basin, Nigeria. Glob. Planet. Chang. 2017, 155, 225–233. [Google Scholar] [CrossRef]
- Shukla, S.; Wood, A.W. Use of a standardized runoff index for characterizing hydrologic drought. Geophys. Res. Lett. 2008, 35, 1–7. [Google Scholar] [CrossRef]
- Mohino, E.; Serge, J.; Bader, J. Sahel rainfall and decadal to mlti-decadal sea surface temperature variability. Clim. Dyn. 2011, 37, 411–440. [Google Scholar] [CrossRef]
- Dutra, E.; Di Giuseppe, F.; Wetterhall, F.; Pappenberger, F. Seasonal forecasts of droughts in African basins using the Standardized Precipitation Index. Hydrol. Earth Syst. Sci. 2013, 17, 2359–2373. [Google Scholar] [CrossRef]
- Yuan, X.; Wood, E.F.; Chaney, N.W.; Sheffield, J.; Kam, J.; Liang, M.; Guan, K. Probabilistic Seasonal Forecasting of African Drought by Dynamical Models. J. Hydrometeorol. 2013, 14, 1706–1720. [Google Scholar] [CrossRef]
- Yu, Y.; Notaro, M.; Wang, F.; Mao, J.; Shi, X.; Wei, Y. Observed positive vegetation-rainfall feedbacks in the Sahel dominated by a moisture recycling mechanism. Nat. Commun. 2017, 8, 1873. [Google Scholar] [CrossRef]
- Bosilovich, M.G.; Sud, Y.C.; Schubert, S.D.; Walker, G.K. Numerical simulation of the large-scale North Amer-ican monsoon water sources. J. Geophys. Res. 2003, 108, 8614. [Google Scholar] [CrossRef]
- Domínguez, F.; Kumar, P.; Vivoni, E.R. Precipitation Recy-cling Variability and Ecoclimatological Stability—A Study Us-ing NARR Data. Part II: North American Monsoon Region. J. Clim. 2008, 5187–5203. [Google Scholar] [CrossRef]
- Lamb, P.J. Case studies of tropical Atlantic surface circulation patterns during recent sub-Saharan weather anomalies: 1967 and 1968. Mon. Weather Rev. 1978, 106, 482–491. [Google Scholar] [CrossRef]
- Okonkwo, C.; Demoz, B.; Tesfai, S. Characterization of West African jet streams and their association to ENSO events and rainfall in ERA-Interim 1979–2011. Adv. Meteorol. 2014, 2014, 405617. [Google Scholar] [CrossRef]
- Ta, S.; Kouadio, K.Y.; Ali, K.E.; Toualy, E.; Aman, A.; Yoroba, F. West Africa Extreme Rainfall Events and Large-Scale Ocean Surface and Atmospheric Conditions in the Tropical Atlantic. Adv. Meteorol. 2016, 2016, 1940456. [Google Scholar] [CrossRef]


| SPI | Probability | Category |
|---|---|---|
| >1.65 | 0.05 | Extremely humid |
| >1.28 | 0.1 | Severely humid |
| >0.84 | 0.2 | Moderately humid |
| >−0.84 and <0.84 | 0.6 | Normal |
| <−0.84 | 0.2 | Moderately dry |
| <−1.28 | 0.1 | Severely dry |
| <−1.65 | 0.05 | Extremely dry |
| Sources | Months | |||||||||||
|---|---|---|---|---|---|---|---|---|---|---|---|---|
| Continental | Jan | Feb | Mar | Apr | May | Jun | Jul | Aug | Sep | Oct | Nov | Dec |
| NRB | 51.5 | 43.8 | 36.9 | 34.2 | 27.1 | 17.8 | 16.6 | 13.3 | 13.0 | 23.1 | 35.0 | 59.3 |
| WA | 14.9 | 12.2 | 13.1 | 13.9 | 9.0 | 10.1 | 11.7 | 7.5 | 2.4 | 2.5 | 10.8 | 20.9 |
| NEA | 26.9 | 25.1 | 26.9 | 30.6 | 37.4 | 24.5 | 15.9 | 17.8 | 31.7 | 36.6 | 40.7 | 19.8 |
| CEA | 5.6 | 2.3 | ||||||||||
| EU | 1.1 | 2.5 | 2.1 | 0.9 | ||||||||
| AP | 1.5 | 2.7 | 6.0 | 5.1 | ||||||||
| Total | 93.3 | 81.1 | 76.9 | 78.7 | 73.5 | 59.1 | 50.5 | 43.4 | 54.0 | 67.3 | 86.5 | 100 |
| Oceanic | ||||||||||||
| NATL | 6.7 | 11.3 | 9.1 | 6.4 | 3.2 | |||||||
| SATL | 3.8 | 8.6 | 13.3 | 21.9 | 33.9 | 39.3 | 42.3 | 25.6 | 13.3 | 5.0 | ||
| MS | 3.8 | 5.4 | 1.7 | 1.4 | 5.0 | 8.9 | 12.4 | 16.2 | 15.0 | 6.1 | ||
| RS | 2.0 | 1.3 | 1.9 | 4.2 | 4.4 | 2.4 | ||||||
| Total | 6.7 | 18.9 | 23.1 | 21.3 | 26.5 | 40.9 | 49.5 | 56.6 | 46.0 | 32.7 | 14.5 | |
© 2019 by the authors. Licensee MDPI, Basel, Switzerland. This article is an open access article distributed under the terms and conditions of the Creative Commons Attribution (CC BY) license (http://creativecommons.org/licenses/by/4.0/).
Share and Cite
Sorí, R.; Nieto, R.; Drumond, A.; Stojanovic, M.; Gimeno, L. On the Connection between Atmospheric Moisture Transport and Dry Conditions in Rainfall Climatological Zones of the Niger River Basin. Water 2019, 11, 622. https://doi.org/10.3390/w11030622
Sorí R, Nieto R, Drumond A, Stojanovic M, Gimeno L. On the Connection between Atmospheric Moisture Transport and Dry Conditions in Rainfall Climatological Zones of the Niger River Basin. Water. 2019; 11(3):622. https://doi.org/10.3390/w11030622
Chicago/Turabian StyleSorí, Rogert, Raquel Nieto, Anita Drumond, Milica Stojanovic, and Luis Gimeno. 2019. "On the Connection between Atmospheric Moisture Transport and Dry Conditions in Rainfall Climatological Zones of the Niger River Basin" Water 11, no. 3: 622. https://doi.org/10.3390/w11030622
APA StyleSorí, R., Nieto, R., Drumond, A., Stojanovic, M., & Gimeno, L. (2019). On the Connection between Atmospheric Moisture Transport and Dry Conditions in Rainfall Climatological Zones of the Niger River Basin. Water, 11(3), 622. https://doi.org/10.3390/w11030622