Article

Optimization of Tank Bottom Shape for Improving the Anti-Deposition Performance of a Prefabricated Pumping Station

1
School of Energy and Power Engineering, Jiangsu University, Zhenjiang 212013, China
2
Key Laboratory of China Machinery Industry for Centrifugal Pumps, Zhenjiang 212013, China
*
Author to whom correspondence should be addressed.
Water 2019, 11(3), 602; https://doi.org/10.3390/w11030602
Submission received: 13 February 2019 / Revised: 21 March 2019 / Accepted: 21 March 2019 / Published: 22 March 2019
(This article belongs to the Section Hydraulics and Hydrodynamics)

Abstract

:
High flexibility of prefabricated pumping stations in collecting and transporting storm water has been recognized. Nevertheless, flows inside such a complex system have rarely been reported. The present study aims to reveal water-sand flow characteristics in a prefabricated pumping station and to optimize geometric parameters of the tank to mitigate sand particle deposition. Five tank schemes, varying in the ratio of the diameter to the height of the tank bottom (D/L), were investigated. Flows in the pumping station were simulated using the computational fluid dynamics (CFD) technique. Test data were used to validate the numerical scheme. Three-dimensional water-sand flows in the pumping station were described. Underlying mechanisms of sand particle deposition were explained. The results indicate that the risk of deposition is high at the tank bottom side, close to the tank inlet. Both the tank bottom geometry and the inlet suction of the pump contribute to sand particle deposition. The averaged sand volume fraction at the pump inlet reaches its minimum at D/L = 3. Sand particle velocity at the pump inlet varies inversely with D/L. The highest intensity of the vortex at the pump inlet arises at D/L = 3. The best anti-deposition performance of the pumping station is attained at D/L = 3.

1. Introduction

The collection and transportation of storm water is of great importance for flood control and urban water management. Traditional pumping stations cannot be installed in urban areas due to the inconvenience in infrastructure and maintenance. A rather new device—the prefabricated pumping station (PPS)—was introduced recently. In comparison with traditional pumping stations, the PPS is free of the shortages of large volume and high-cost maintenance [1,2]. Moreover, such a new pumping station can be used to transport liquid at high flow rates, which is beneficial for the treatment of storm water in urban areas [3]. In general, the prefabricated pumping station is composed of the storage tank, single or multiple pumps, pipes, and fittings. As the mixture of water and sand particles is transported, flows in the prefabricated pumping station are complex and significantly influence the operation of the pumping station. Particularly, deposition of solid particles at the tank bottom is of high possibility. Severe deposition results in the blocking or even the malfunction of the whole pumping station. Heretofore, flow issues associated with the prefabricated pumping station have rarely been reported.
The storage tank of the prefabricated pumping station is installed underground. Therefore, cleaning is not an easy task once solid particles deposit at the bottom of the storage tank. The deposition hinders further inhalation of solid particles by the pump and even incurs the operation instability of the whole unit. In consideration of the structure of the prefabricated pumping station, it is impractical to measure the inner flow using optical flow-measurement instruments [4]. Alternatively, computational fluid dynamics (CFD) technique can be employed in treating flows in pumps as well as flows exposed to the pumping effect [5,6]. Azimi et al. simulated solid-liquid two-phase jets using a commercial CFD code [7]. Gandhi et al. obtained numerically the effect of solid-liquid two-phase flows on the performance of a centrifugal pump and proved that both the particle concentration and particle size affect the pump head and efficiency [8]. Cheng et al. investigated effects of solid-phase parameters on flows in a molten-salt pump via numerical simulation; the results agreed well with the experimental data [9]. Numerical simulation has also been used widely in treating flows in conventional pumping stations. Lu illustrated flow patterns in different suction boxes through numerical simulation and thereby proposed an optimized design scheme [10]. Cong et al. analyzed numerically flow structures in the sump of a large-scale pump station and evaluated the function of the anti-vortex device [11]. Deshmukh et al. analyzed the flow at the pump inlet based on numerical results and substantiated significant effects of local geometry on flow patterns in the pumping station [12].
Investigation of the flow in the prefabricated pumping station has rarely been reported. Common knowledge of flows in impeller pumps is inadequate to support the clarification of flow characteristics of the prefabricated pumping station. Large flow structures in the tank and the interaction between the pump and the tank bottom are of particular interest for such a complex flow system. Wear of hydraulic components takes place frequently, which is attributable to the sand deposition.
The emphasis of the presented work is placed on water-sand two-phase flows in a prefabricated pumping station. The flows in the pumping station were simulated using the computational fluid dynamics technique. The deposition of sand particles at the bottom of the storage tank was described. A further attempt of optimizing the tank bottom geometry to mitigate the deposition was executed. Five tank bottom schemes, with different ratios of the diameter to the height of the tank bottom were devised respectively. Two-phase flows associated with the five schemes were compared. More specifically, the sand volume fraction and the sand particle velocity were analyzed. Multifarious flow structures in the storage tank were disclosed. The optimum tank scheme was determined thereby. The phenomenon of solid particle deposition in the prefabricated pumping station is thereby elucidated. It is anticipated to provide a reference for the optimal design and stable operation of the prefabricated pumping station.

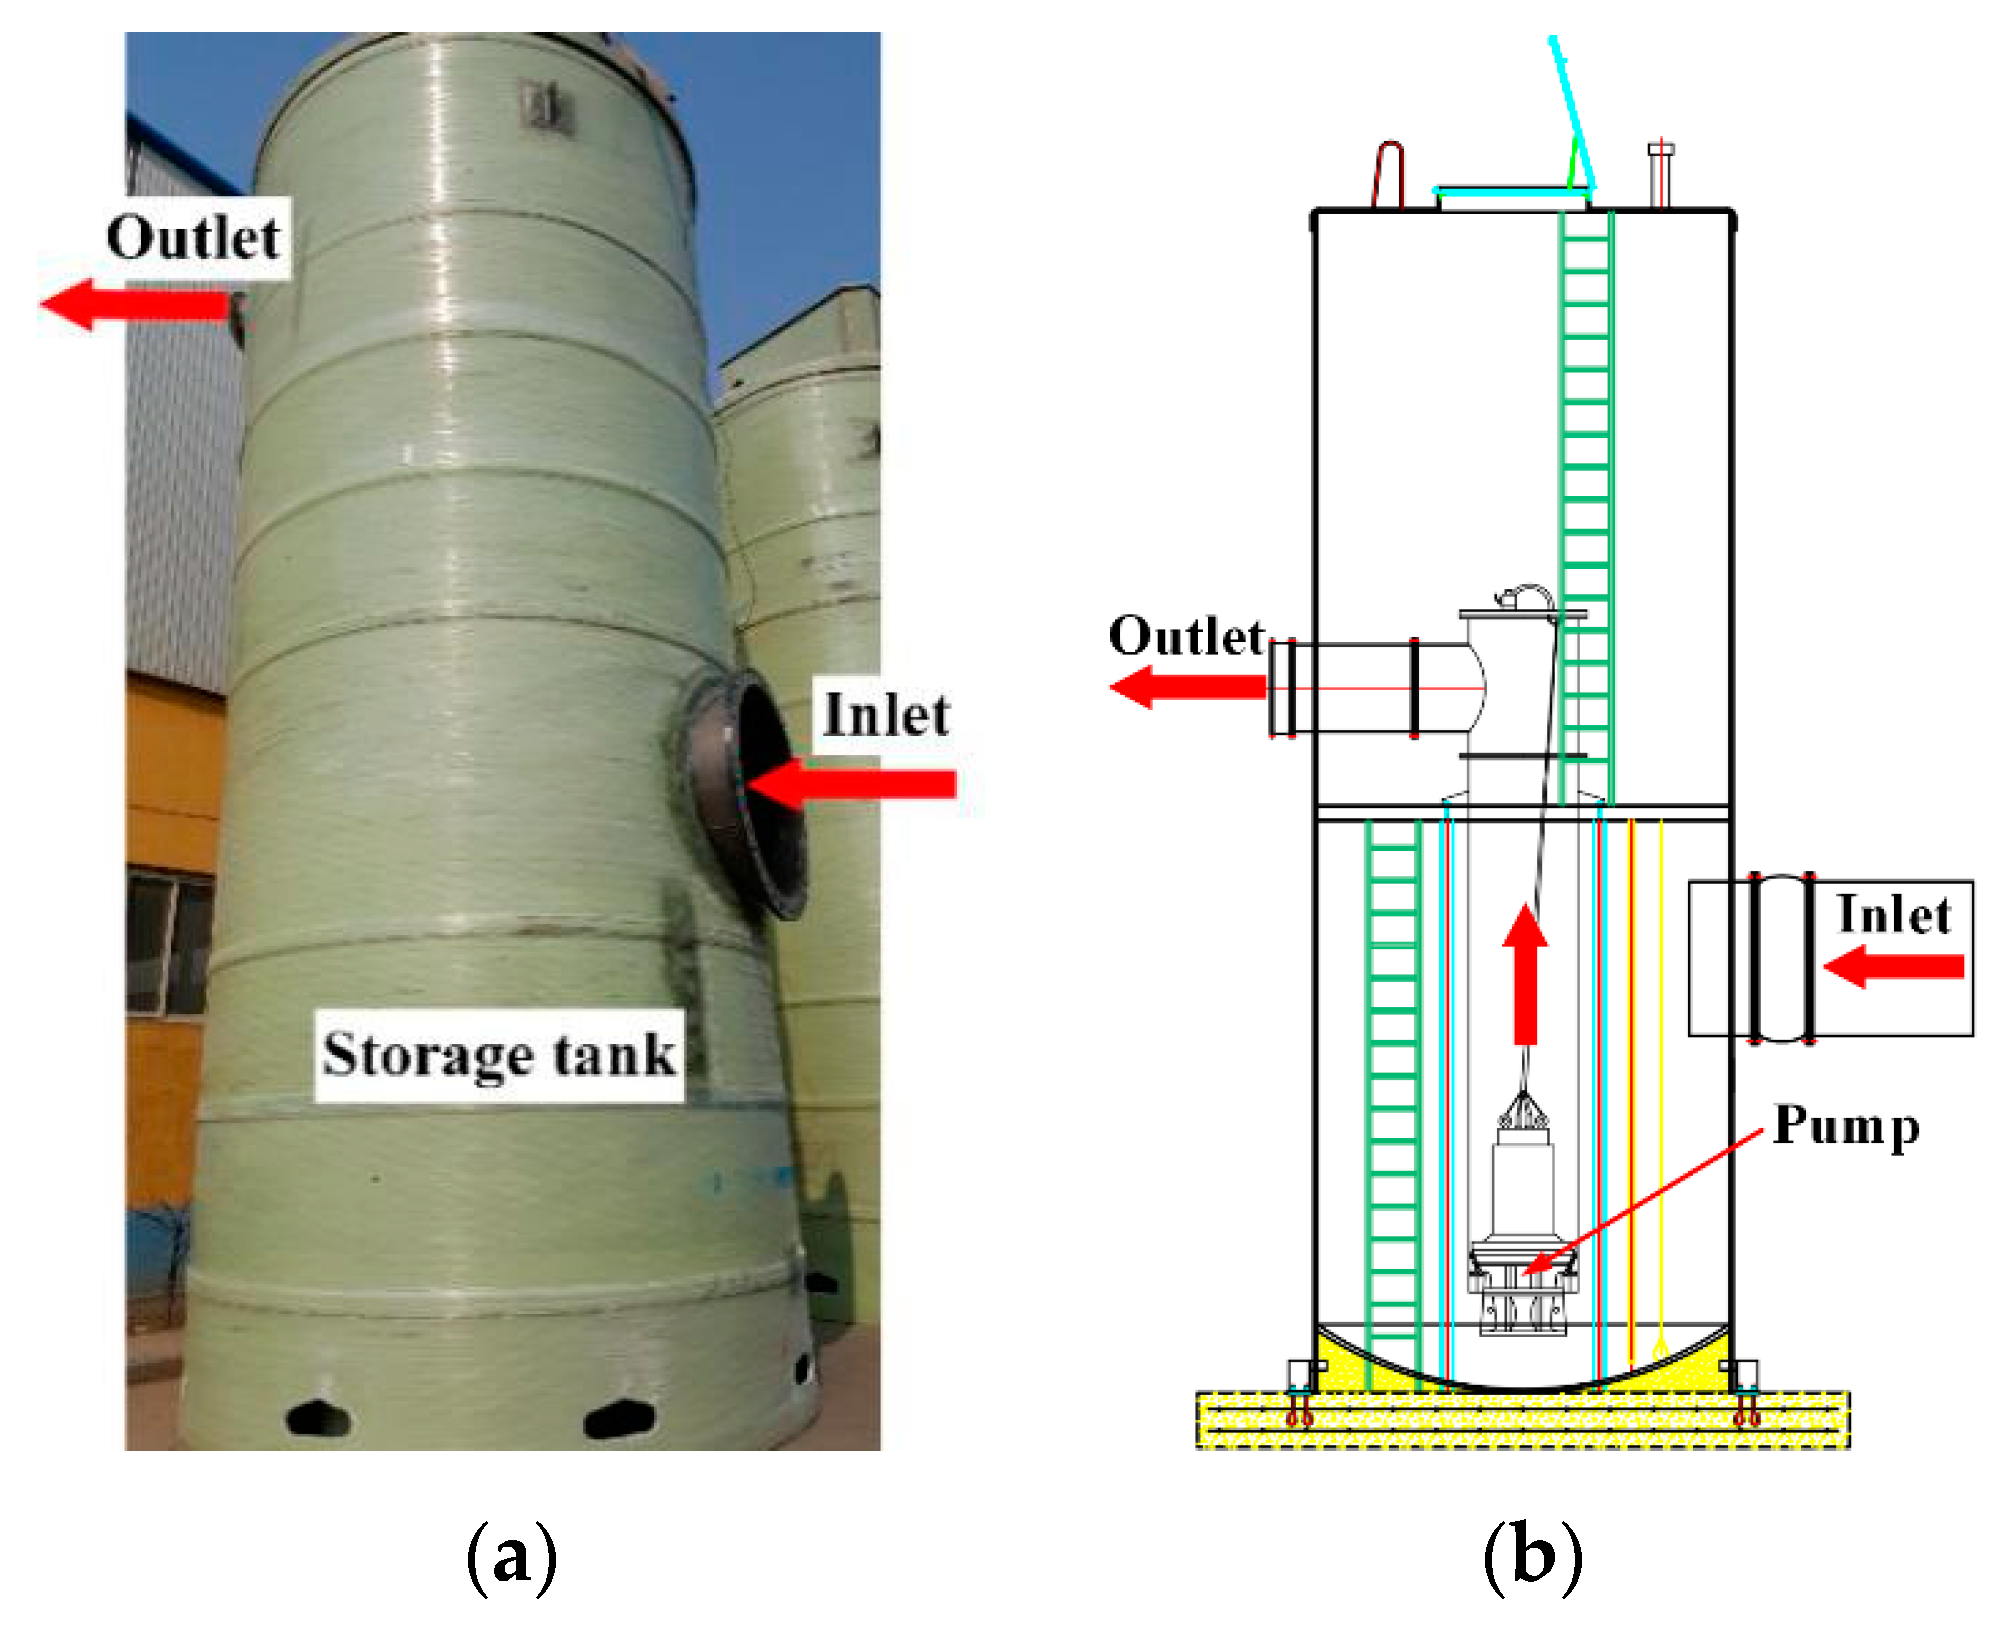
2. Prefabricated Pumping Station Model

A storage tank of the prefabricated pumping station is shown in Figure 1a. The tank is commonly made of fiber reinforced plastics (FRP) and there are some limitations on tank dimensions largely due to transportation. A cross-sectional view of the internal structure of the tank is displayed in Figure 1b. It is seen that the pump is vertically installed near the bottom of the tank. The pump imparts energy to the two-phase medium to overcome the difference of height between the tank inlet and outlet. Nevertheless, as sand particles involved in the liquid medium cannot be inhaled sufficiently and promptly, some sand particles will deposit and accumulate at the bottom of the tank.
The motion and spatial distribution of sand particles in the prefabricated pumping station are illustrated in Figure 2. The water-sand flow enters the tank horizontally and is then obstructed by the outlet pipe vertically installed in the tank. During this process, sand particles fall towards the tank bottom due to gravity. In consideration of the orientation of the inlet pipe, it is inferable that the distribution of sand particles at the tank bottom is non-uniform in a circumferential direction. Particularly, the operation of the pump imposes a strong disturbance to the two-phase medium in the tank. The pump inhales water as well as sand particles near the tank bottom and transports them towards the tank outlet. Meanwhile, the stimulated flow near the tank bottom churns the medium in the whole tank. Some sand particles are dispersed and suspended in the tank, while some others tend to move downwards. This depends on flow parameter distributions in the tank.
To alleviate sand particle deposition, the tank bottom is usually designed with an arc or trapezoidal skeleton. In comparison, the manufacturing of the arc bottom is more convenient. Essentially, different combinations of arc parameters lead to different arc shapes, which are responsible for different extents of sand particle deposition. Here, two arc parameters were investigated. The diameter of the tank, D, was fixed at 4000 mm, while the height of the tank bottom, L, was varied. Eventually, five tank schemes with a ratio of the diameter to the height of the tank bottom (D/L) of 2, 3, 4, 5, and 6 were devised, as shown in Figure 3. The inlet and outlet diameters of the tank are 750 and 890 mm, respectively. A mixed-flow pump is mounted at the center part of the storage tank. The inlet section of the flare tube of the pump is higher than the tank bottom by 100 mm. For such a pump, the design flow rate, qV0, is 3654 m3/h and the rotational speed, n, is 740 rpm. Under the design operation condition, the pump head, H0, reaches 8.0 m. The pump was kept submerged in the two-phase medium. The medium level in the tank was 6.0 m, which was kept constant during the numerical simulation.

3. Numerical Set-Up

3.1. Governing Equations

In parallel with practical requirements, the mixture of water and sand particles was selected as the medium to be transported. The density of sand was 2300 kg/m3, and the uniform diameter of sand particles was 0.5 mm. The volume fraction of sand in the mixture was 5%. Considering physical properties of the mixture and the attainable pump head, an incompressible flow was assumed. The flow was governed by Reynolds-averaged Navier-Stokes (RANS) equations [13,14,15]. The energy conservation equation was not taken into account, and the continuity equation takes the following form:
t ( ρ α r α ) + ( ρ α r α u α ) = 0
The momentum equation is expressed as:
t ( ρ α r α u α ) + ( r α ρ α u α u α ) = [ μ α ( u α + u α T ) ] + r α ( B ρ α ) + β = 1 N P c α β ( u β u α )
where r α is the volume fraction of Phase α, ρ α is the density of Phase α, u α is the velocity of Phase α, u β is the velocity of Phase β, μ α is the shear viscosity coefficient of Phase α. Here, two phases, water and sand, are considered and Equations (1) and (2) are applicable to the two phases.

3.2. Turbulence Model

The shear stress transport (SST) k–ω turbulence model was selected to accomplish the closure of Equations (1) and (2) [16,17,18]. Such a turbulence model absorbs advantages of kε and kω turbulence models and can accurately predict flow patterns exposed to the impeller rotation [19,20]. The Eulerian-Eulerian model was employed as the multiphase flow model. With such a two-fluid model, the solid and liquid phases are mixed on length scales smaller than that expected to resolve. Therefore, the two phases are treated as continuous. Conservations for mass, momentum, and energy are solved for each phase [21]. Flow parameters of each phase were coupled via the momentum and mass transfer models. Since the effect of sand particle movement on water was non-negligible, the heterogeneous model was introduced [7]. The interaction between water and sand particles can be demonstrated through the interphase velocity and the interface area [22]. In consideration of sand properties, the Gidaspow drag model, which combines the Wen-Yu model and Ergun’s equation, was adopted [23,24,25].

3.3. Boundary Conditions

At the inlet of the pumping station considered, the mass-flow boundary condition was defined, and the mass flow rate was calculated based on the density and volume fractions of the two phases. At the outlet of the pumping station, constant static pressure condition was defined, and the flow direction was perpendicular to the outlet section. An identical initial water level was specified for the five tanks, and the gravity effect was considered. The surface roughness of the impeller blades of the pump was set to 0.025 mm and other walls to 0.2 mm. No-slip boundary conditions were imposed on walls wetted by water, whereas free-slip boundary conditions were set for walls contacted with sand [26,27].

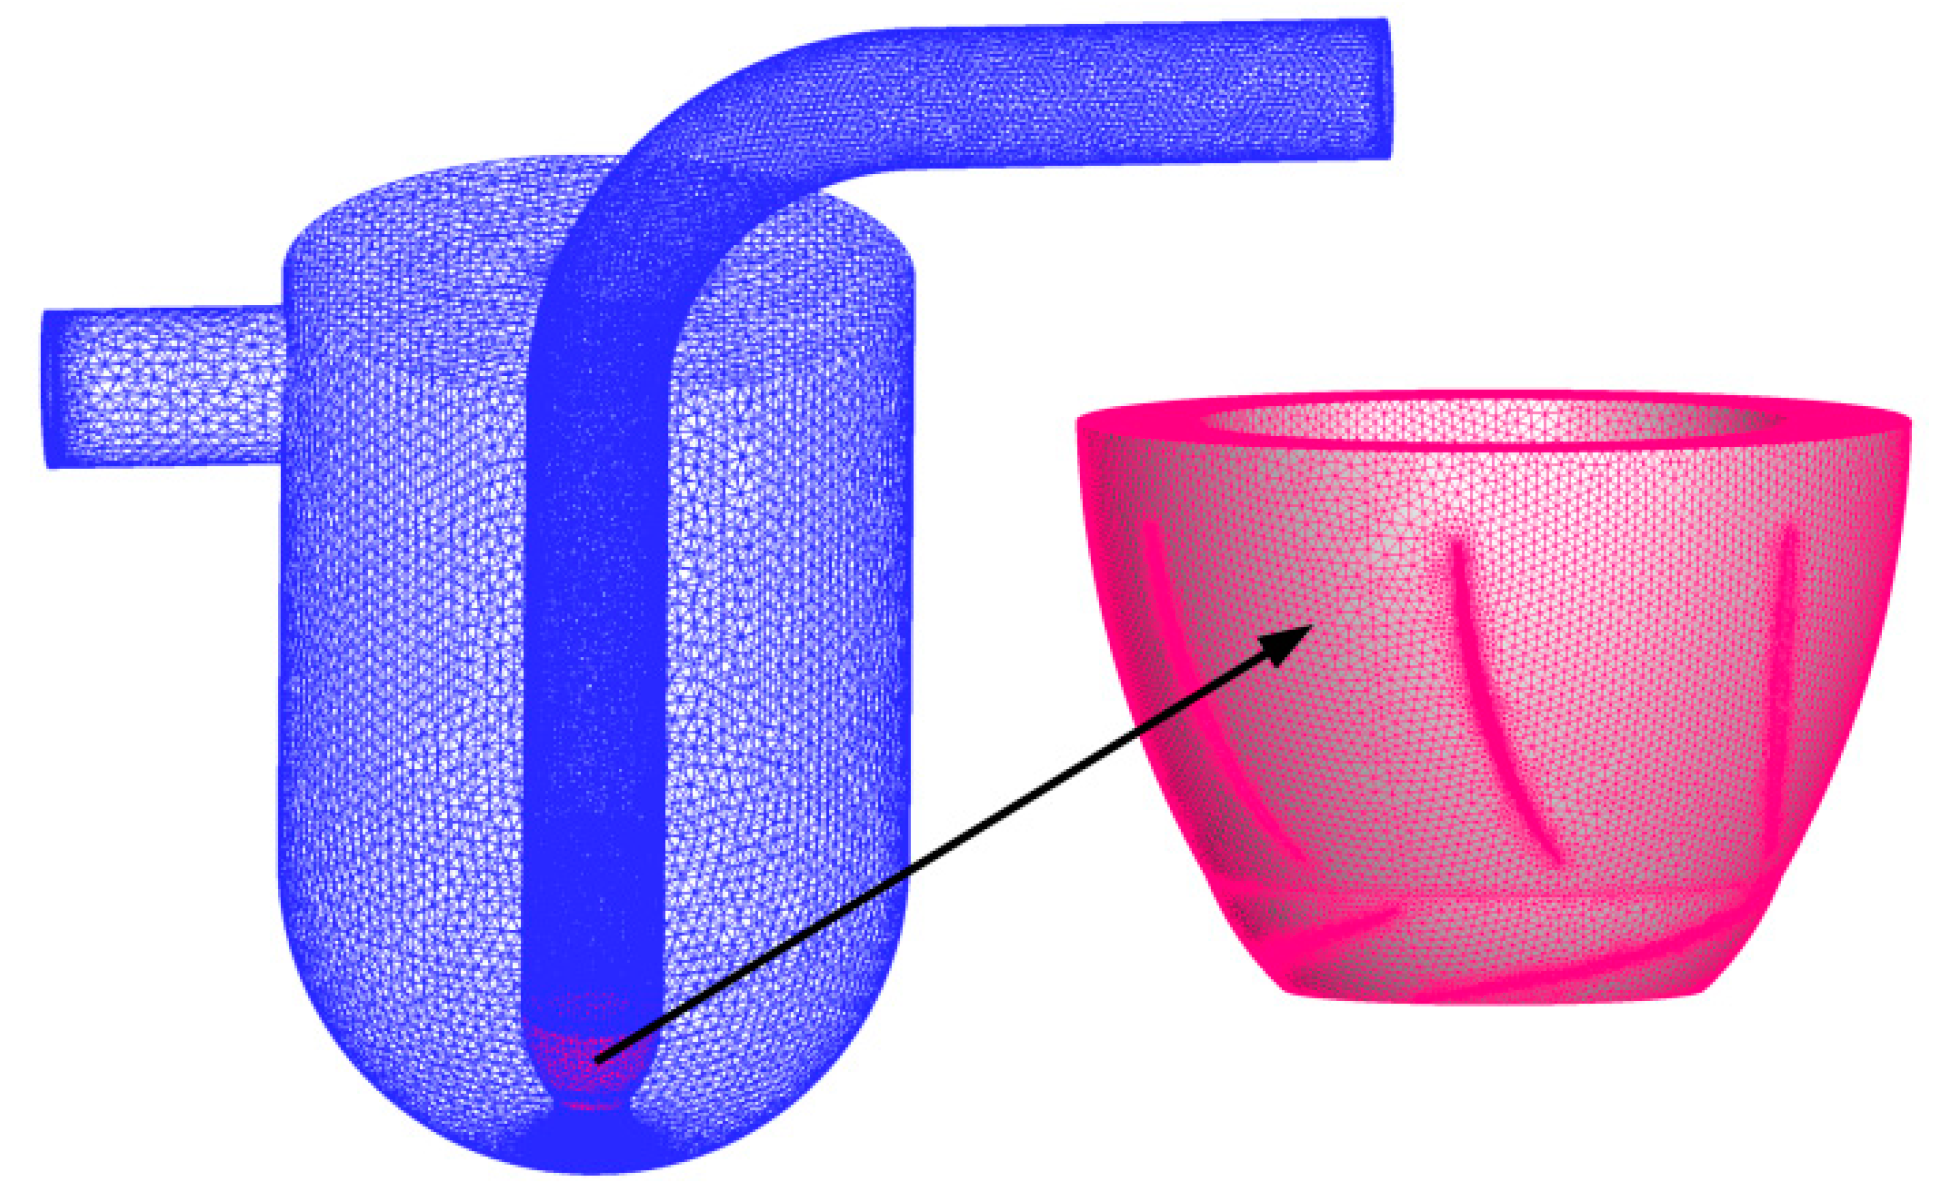
3.4. Grid Independence Examination

The whole computational domain incorporates subdomains with diverse geometries. Furthermore, the pump impeller and guide vane blades are featured by curved surfaces. Therefore, unstructured grids were employed to spatially discretize the subdomains. The commercial code of ICEM CFD was used for grid generation. To improve the accuracy and to capture flow phenomena subjected to high velocity gradients, grid refinement was performed at near-wall flow regions.
To evaluate the dependence of the numerical result on the grid number, for the D/L = 2 scheme, five sets of grids, with grid numbers of 3.23, 4.71, 6.35, 7.78, and 9.16 million, were tested. Regarding each grid scheme, y+ values ranged from 26 to 52. In the commercial grid-generation code of ICEM CFD, the values of grid quality for the grid scheme fell within 0.38–0.52 and the equiangle skewness ranged from 0.2 to 0.26. The pump head and pump efficiency were selected as a scale of the grid number effect. It was found that as the grid number exceeded 6.35 million, the gap between neighboring pump heads as well as the pump efficiencies was minimized. For the results with grid numbers of 7.78 and 9.16 million, the maximum relative deviation was less than 2.6%. Therefore, the gird scheme with 7.78 million grids was adopted in the subsequent simulation. Finally, determined grid numbers for the five tank schemes are listed in Table 1. Regarding the scheme of D/L = 2, grids for the computational domain are shown in Figure 4, where the red parts correspond to flow passages inside the pump.

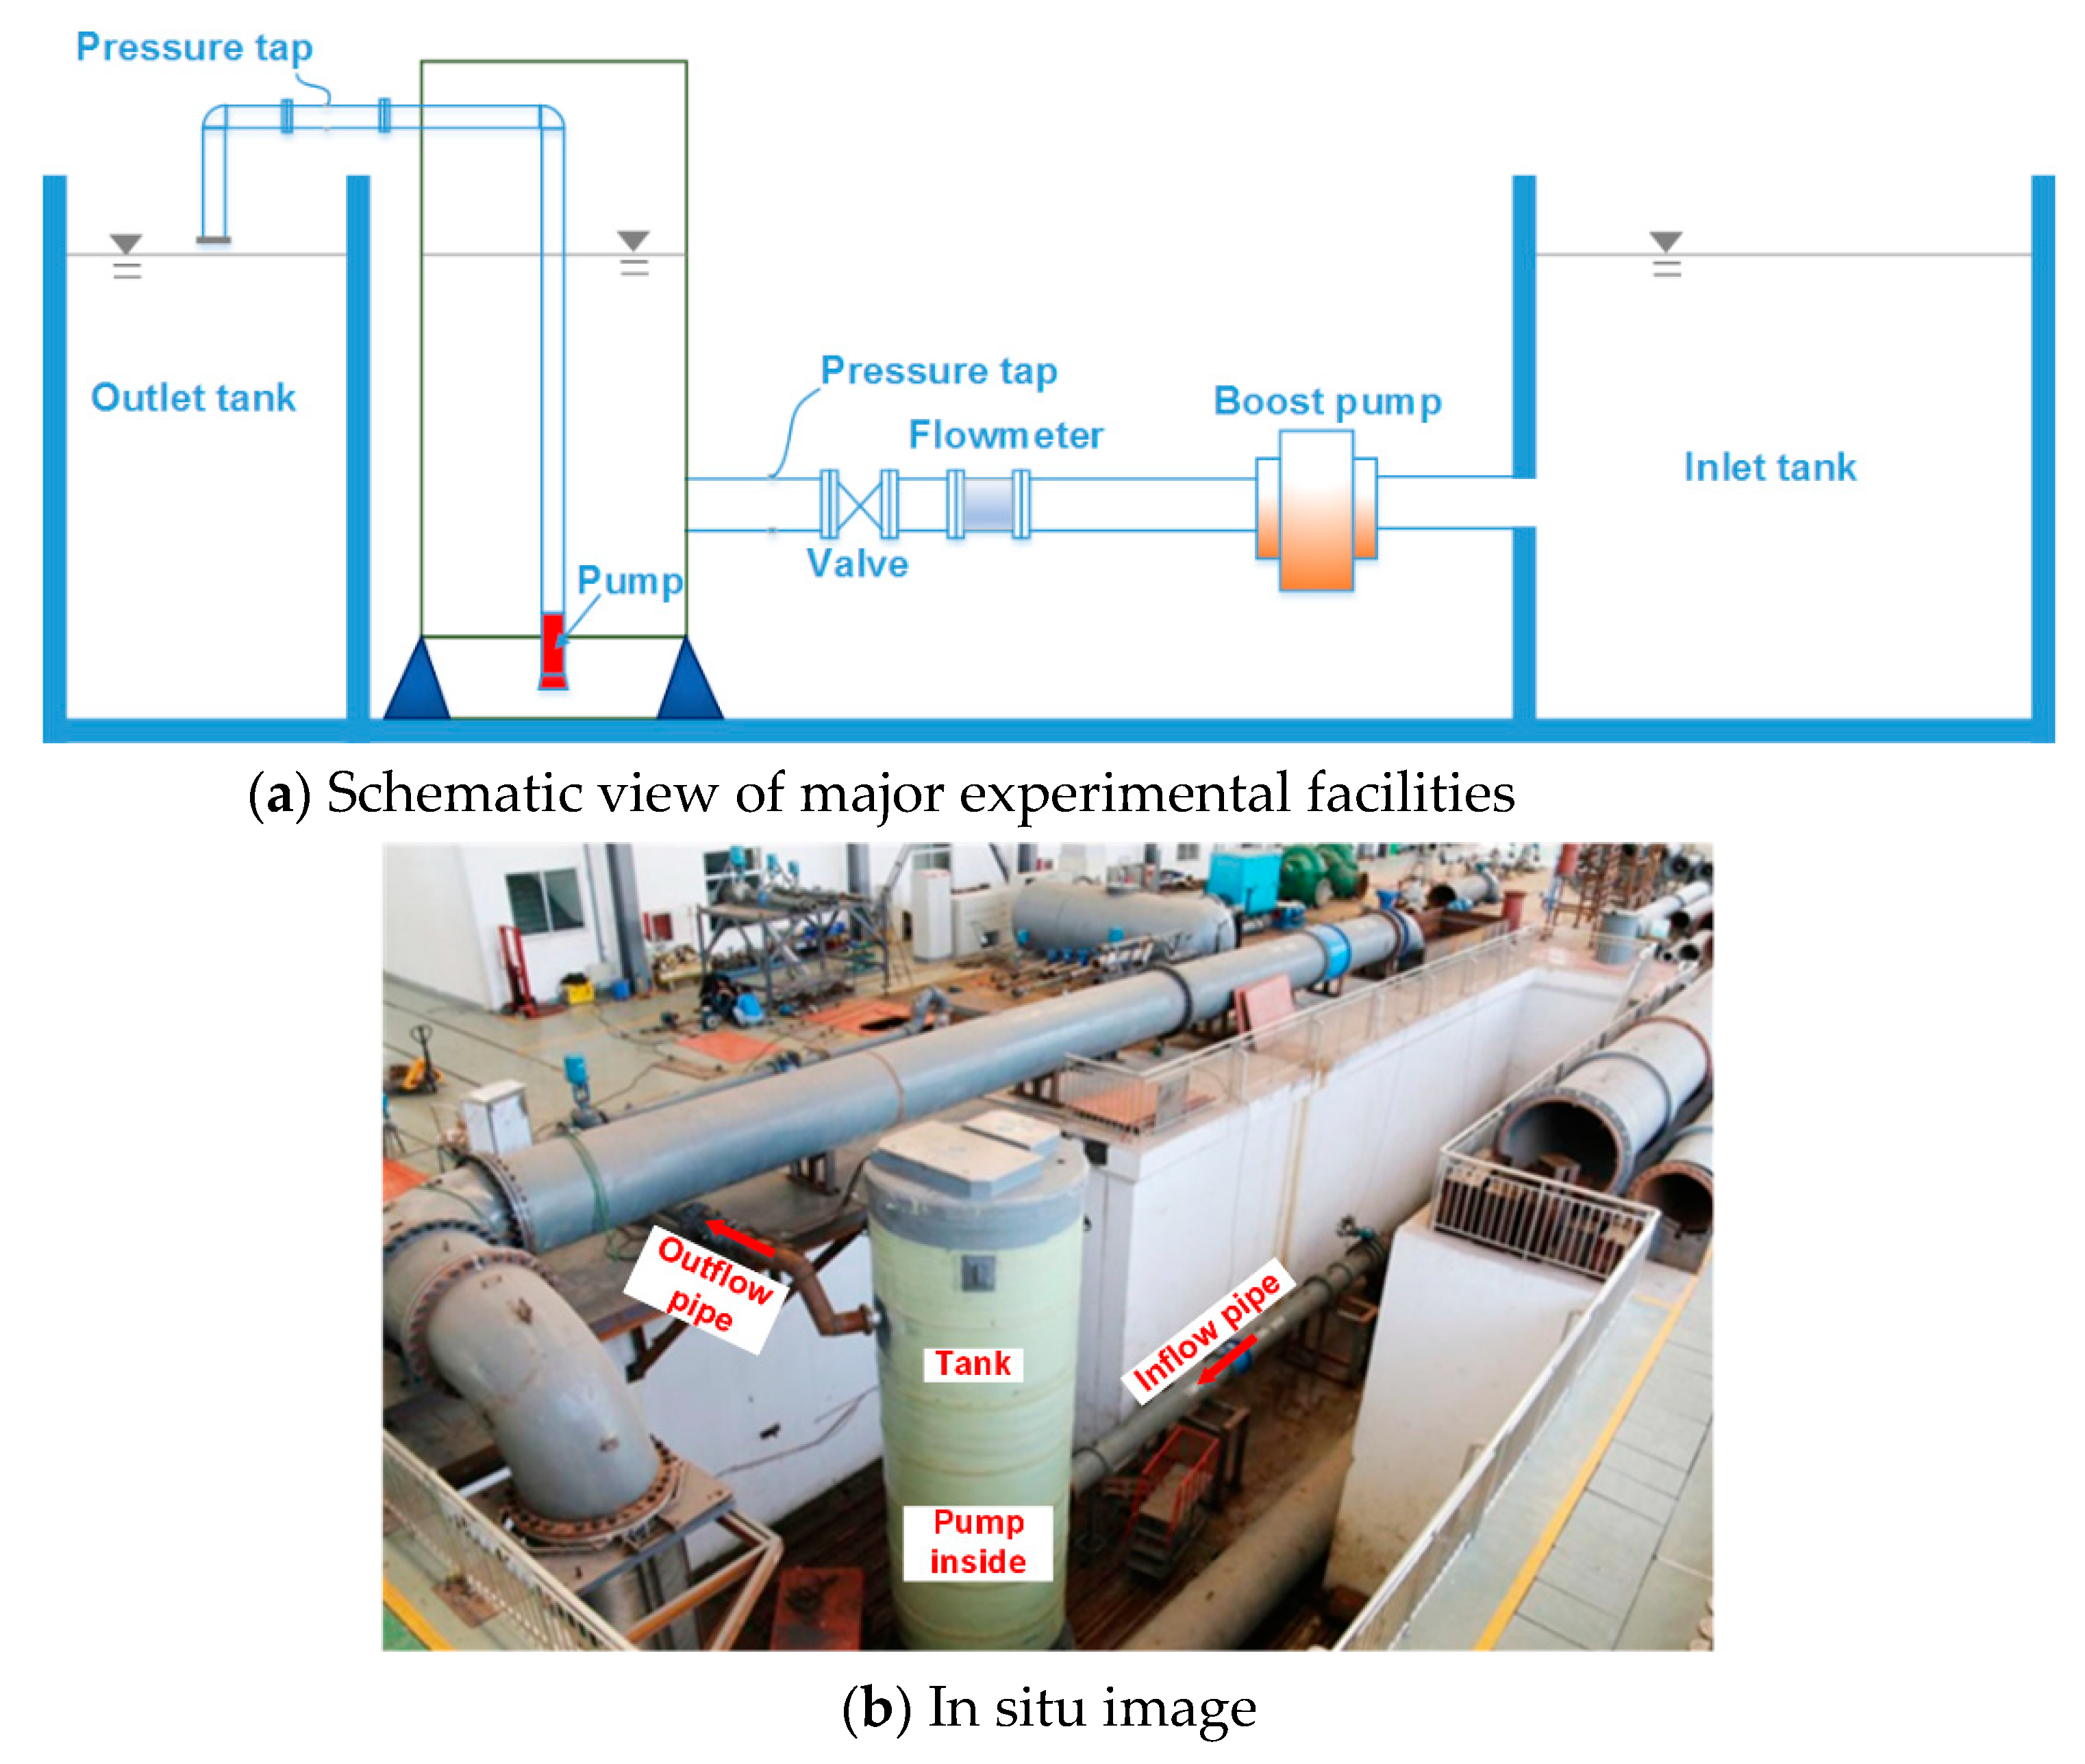
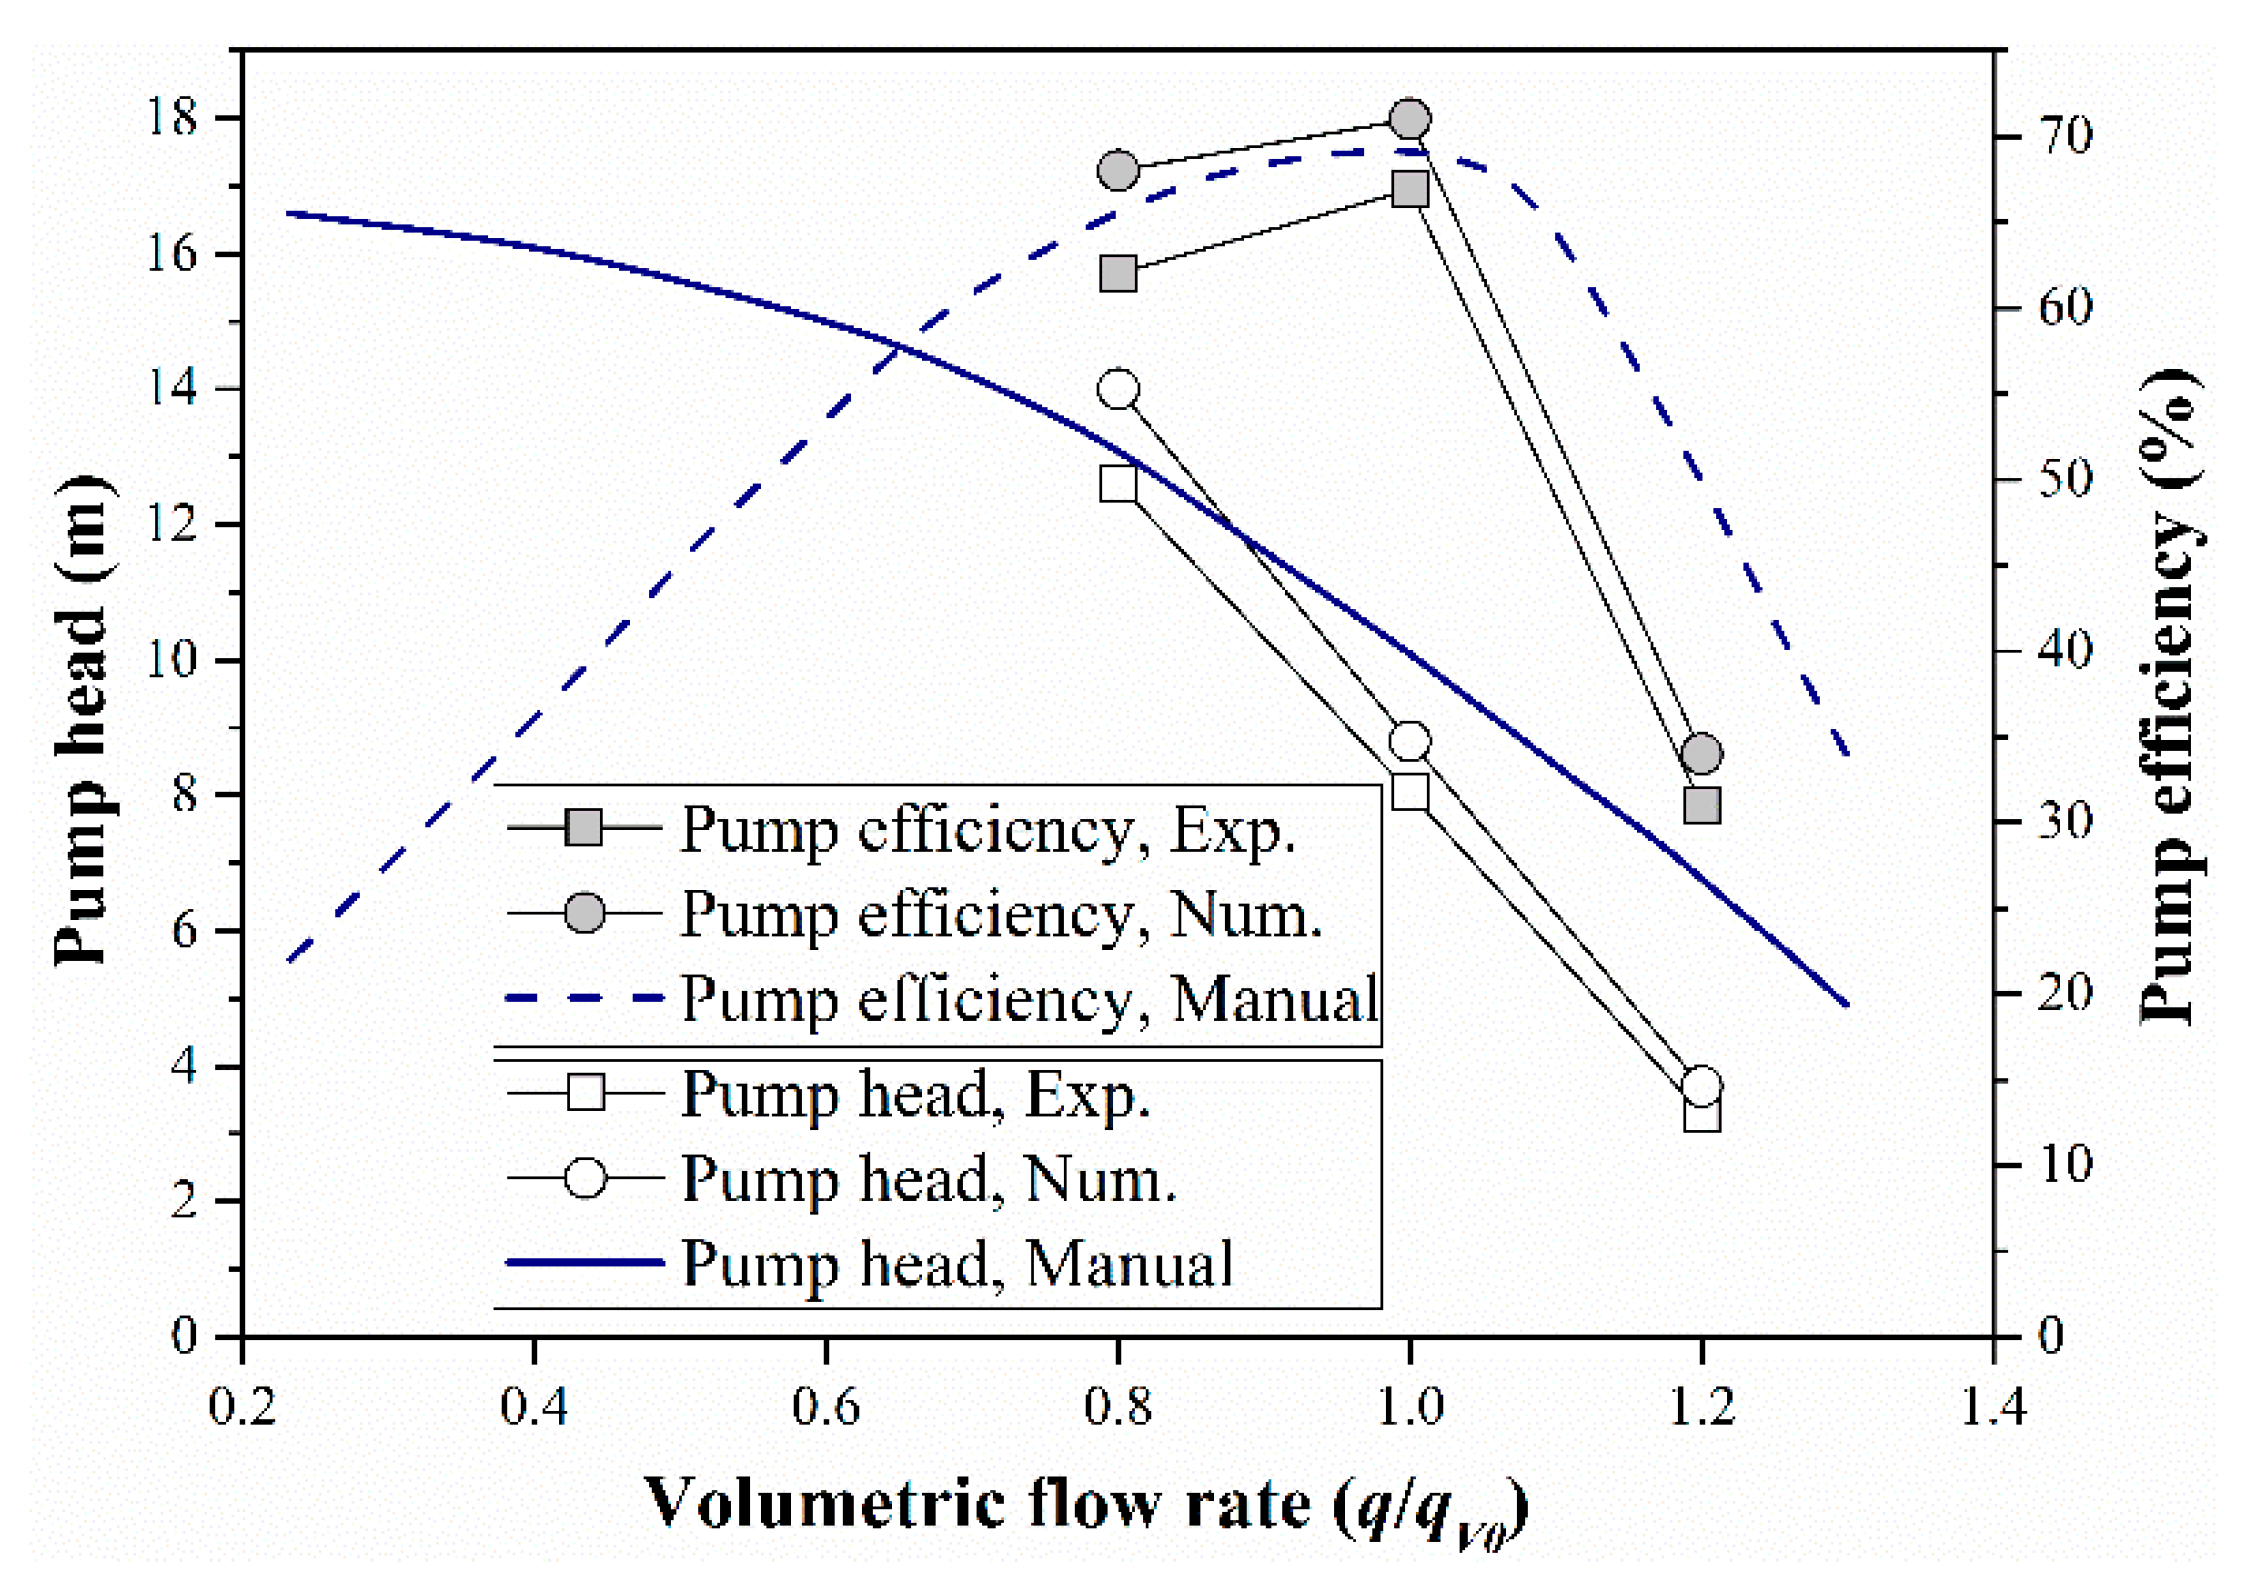
3.5. Validation of Numerical Results

To validate numerical results, a model experiment was carried out in the National Pump Inspection Center of China (Shandong province). The experimental rig is illustrated in Figure 5. The experimental rig and instruments for the prefabricated pumping station complied with the test standard of ISO 9906:2012. The tank of D/L = 2 was used in the experiment. Pure water was used as the transported medium in the experiment. The water level in the tank remained the same as that defined in the numerical simulation. The volumetric flow rate was acquired using an electromagnetic flowmeter. The pump head was calculated based upon the difference of the total energy between the tank inlet and the tank outlet. Two pressure gages were mounted, respectively, at the inlet and outlet pipes of the tank. The difference of total pressure between the tank inlet and the tank outlet was obtained based on measurement data. Then, the energy loss between the tank inlet and the pump inlet, and the energy loss between the pump outlet and the tank outlet, were calculated based on empirical formulae. Both test data and numerical results are plotted in Figure 6. Here, three typical operation conditions of 0.8, 1.0, and 1.2 q v 0 were selected for comparison. The pump characteristic curves provided by the manufacturer is presented as well, which are denoted by “Pump head Manual” and “Pump efficiency Manual”, respectively. It is apparent that both the experimental data were slightly smaller than the data provided by the manufacturer. This is due largely to the difference in the data acquisition. For the pump tested by the manufacturer, the inlet pressure of the pump is directly measured at the pump inlet using a pressure transmitter and a tube that accommodates the cables. In comparison, for the experimental rig used here, the inlet pressure for the pump was calculated with the consideration of the losses between the pump inlet and the tank inlet. At large flow rates, the deviation is enlarged.
In terms of variations of the pump head and efficiency with the volumetric flow rate, numerical and test results exhibit similar tendencies with the pump characteristic curves. It was seen that numerical data were consistently higher than their counterparts. This is reasonable since practical energy losses such as friction losses between the fluid and rotating hydraulic components and volumetric losses through the gap between the impeller shroud and the pump casing were not considered in numerical modeling. As indicated in Figure 6, the maximum deviation between the two results arises at 0.8 q V 0 and is less than 8%. With respect to the other two operation conditions, the relative deviations were smaller. It is worthy to note that the computational domains dedicated to the numerical simulation involve both the tank and the pump itself. Therefore, the overprediction of the pump performance by numerical simulation, as indicated in Figure 6, was related to flow situations in the two significantly different regions and falls within an acceptable range.

4. Results and Discussion

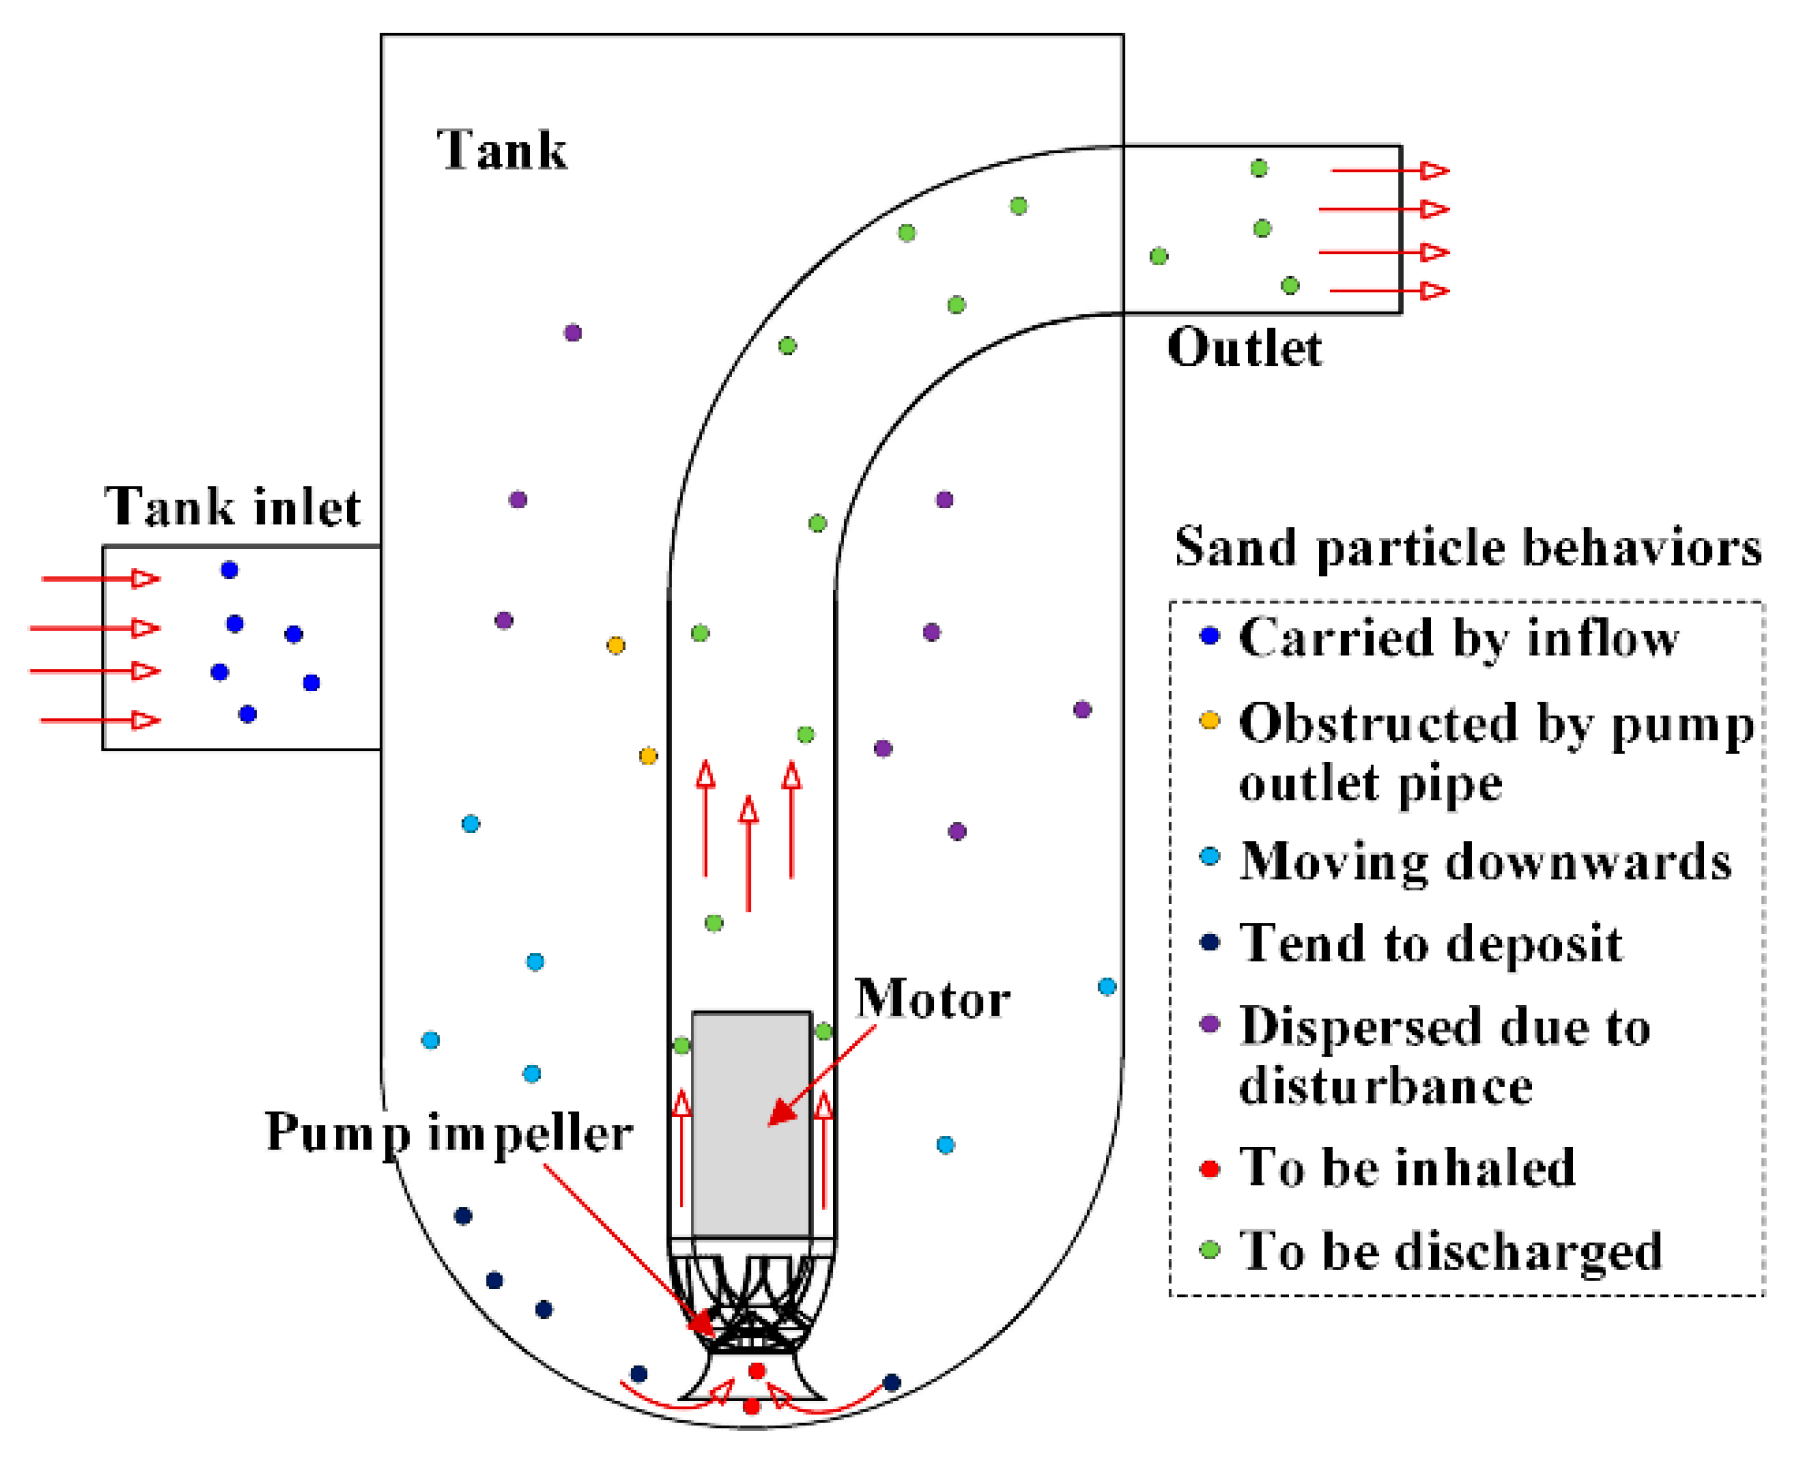
4.1. Motion of Sand Particles in the Pump

In the prefabricated pumping station, the pump is the only equipment that imparts energy to the transported medium. Flow patterns in the pump flow passages at the design flow rate are shown in Figure 7. As the two-phase medium is entrained into the impeller passage, it rapidly absorbs energy from the impeller. Although the distribution of sand particles in the passage is apparently non-uniform, the kinetic energy is sufficient to drive these particles into the vane passages. Subsequently, the mixture is discharged from the pumping station via the bended pipe connected to the pump passage. It can be inferred from Figure 7 that the pump is capable of delivering sand particles from the tank bottom to the outlet of the pumping station. Therefore, the most essential issue of anti-sedimentation is to make sure that the particles at the tank bottom can be entrained into the pump.

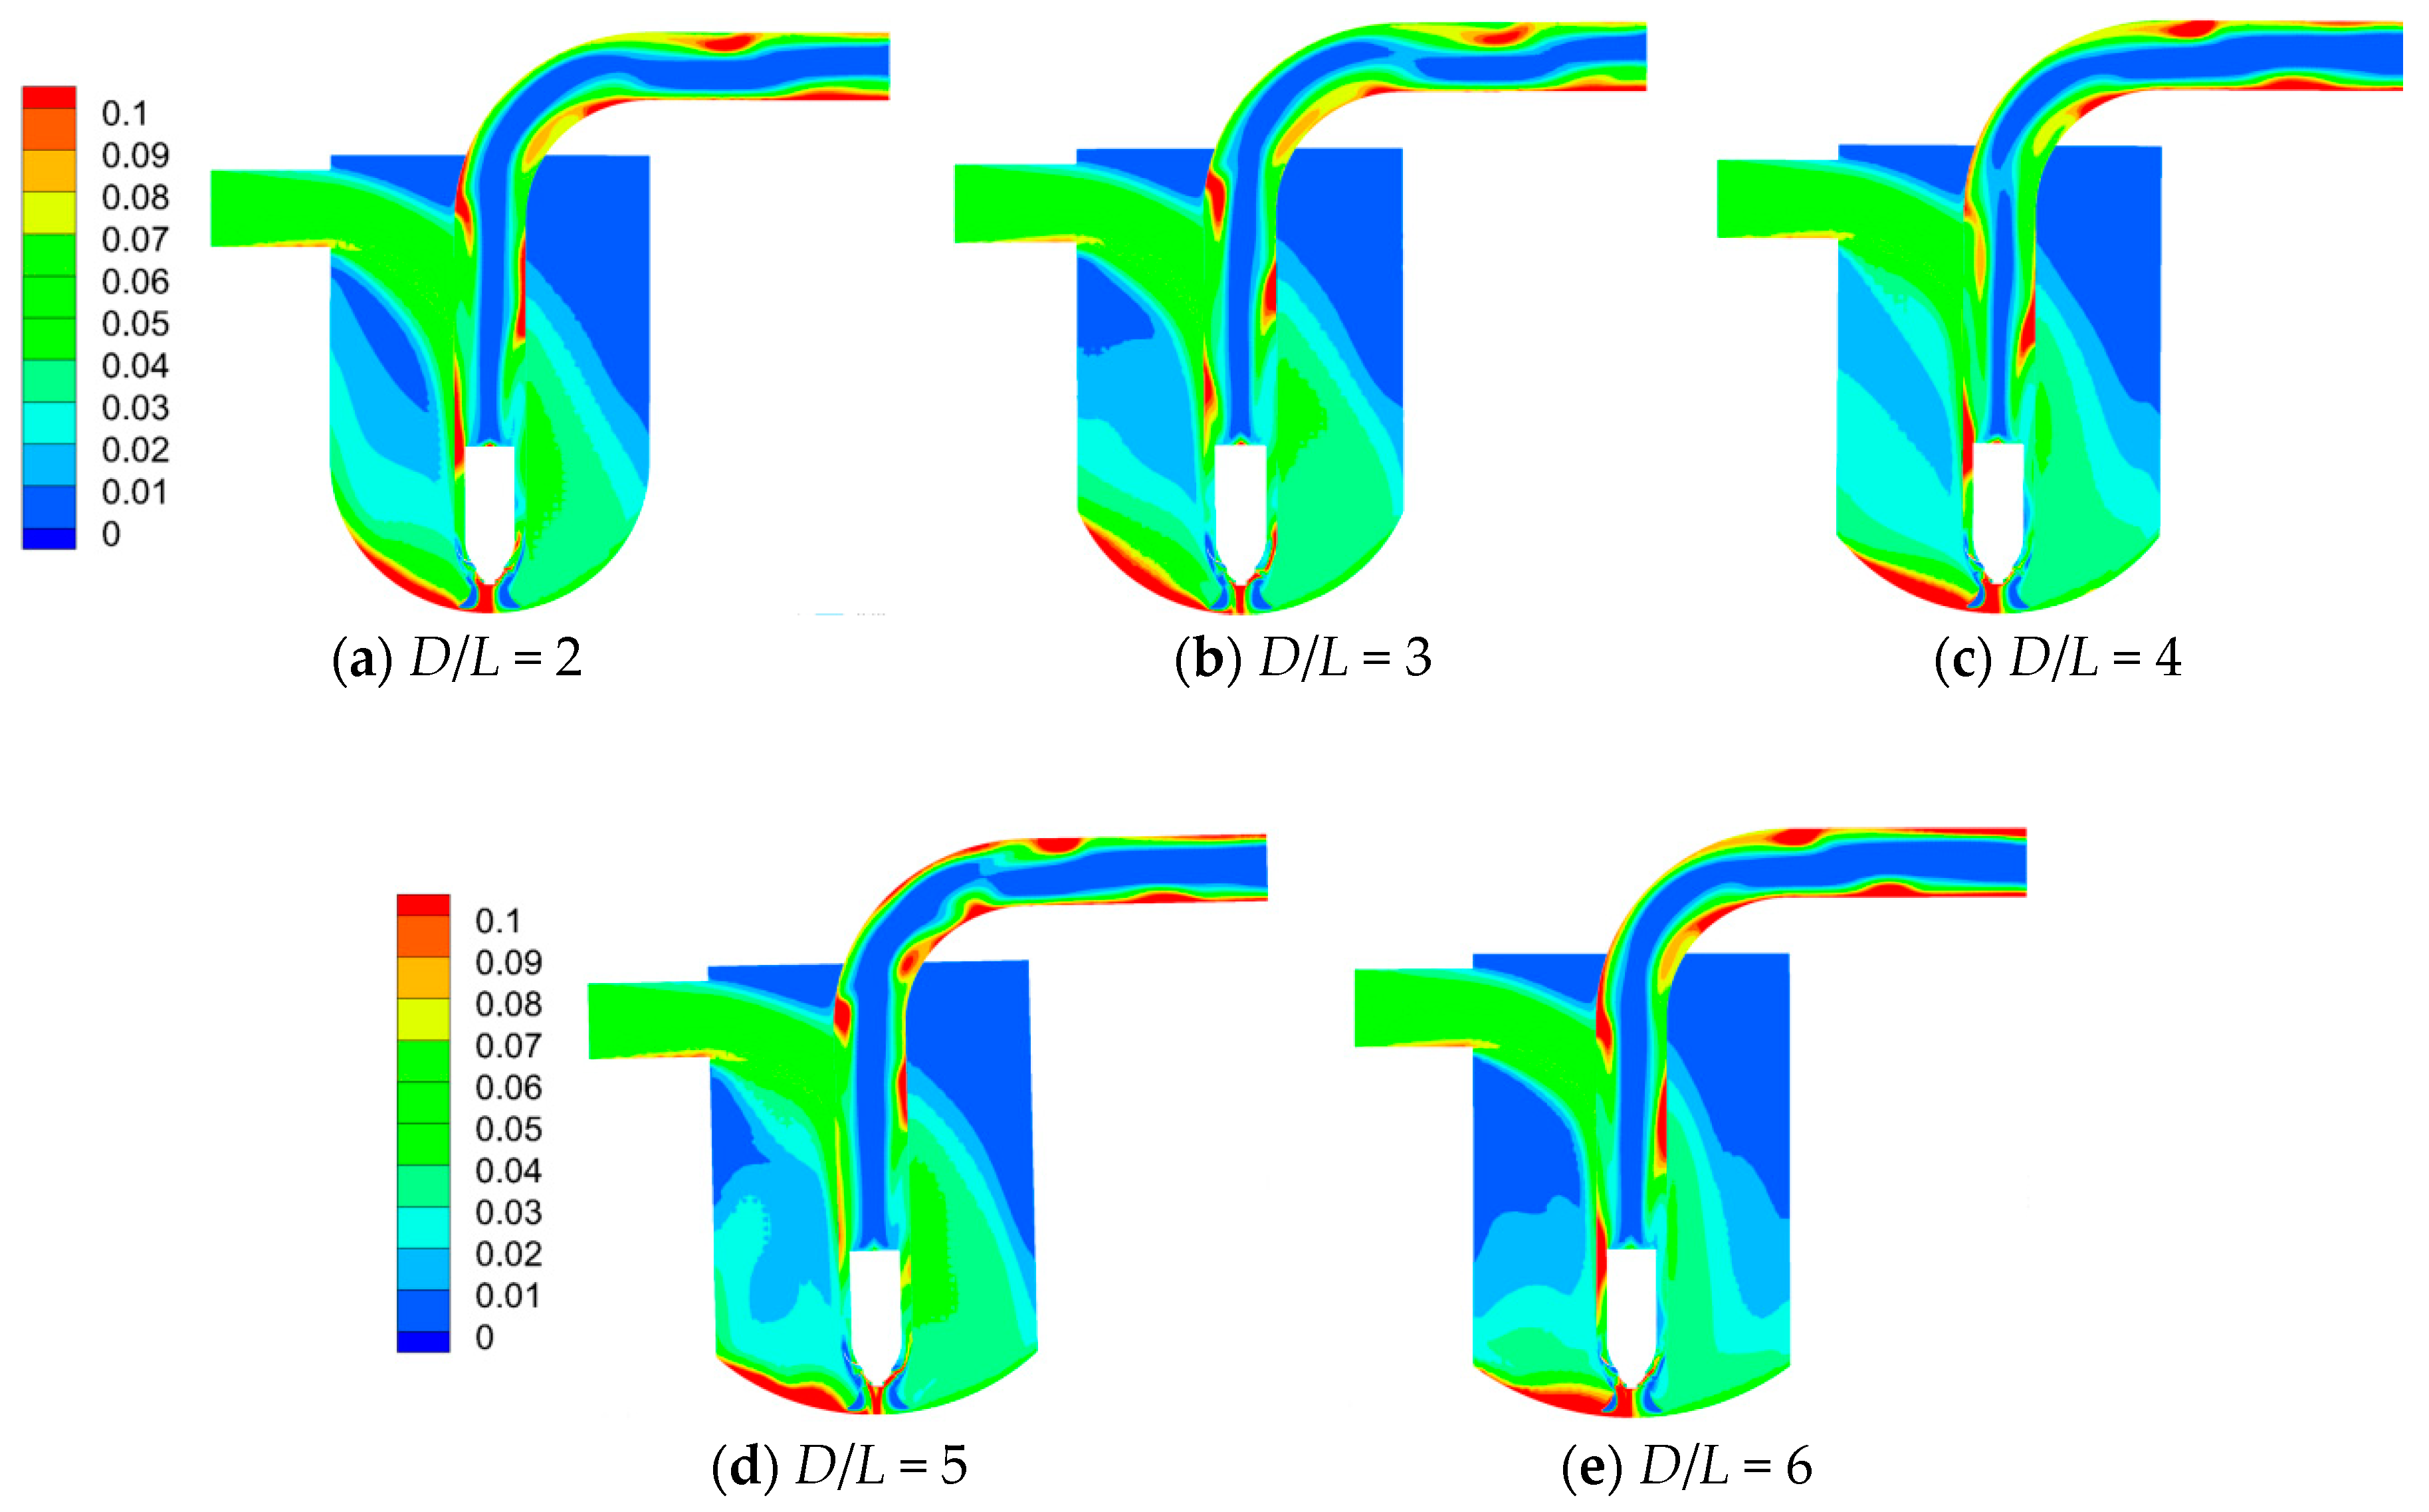
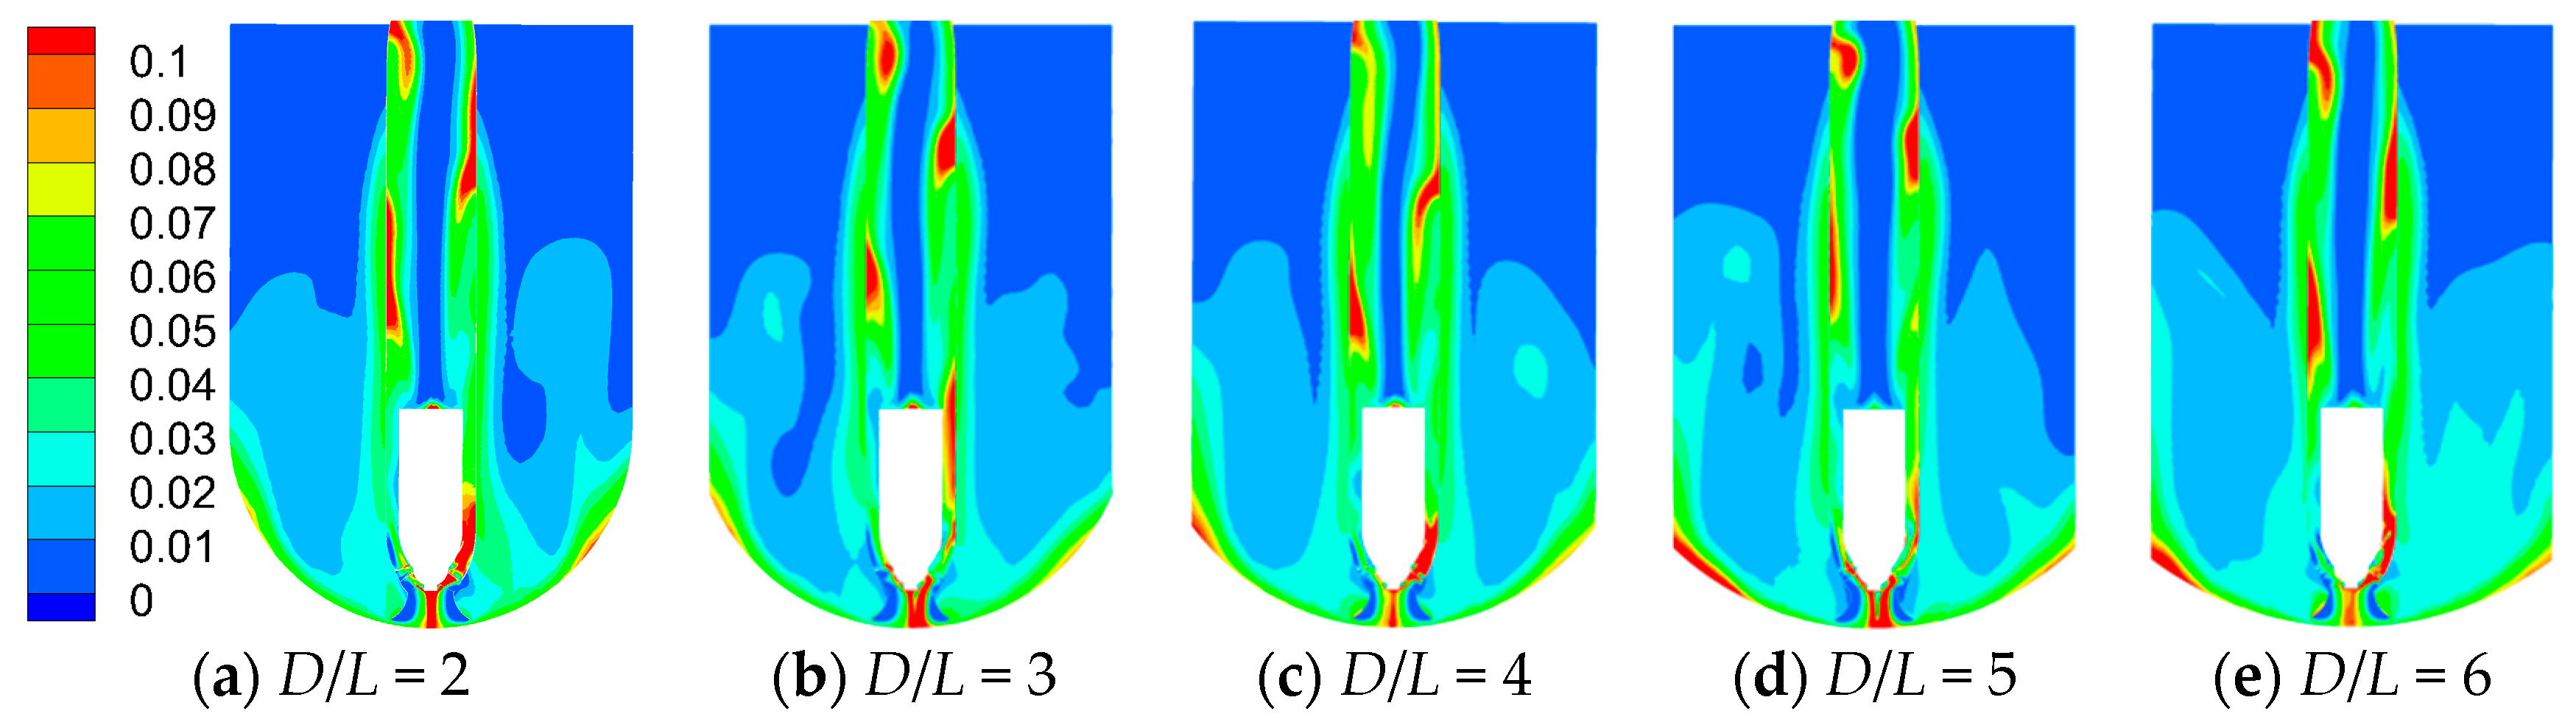
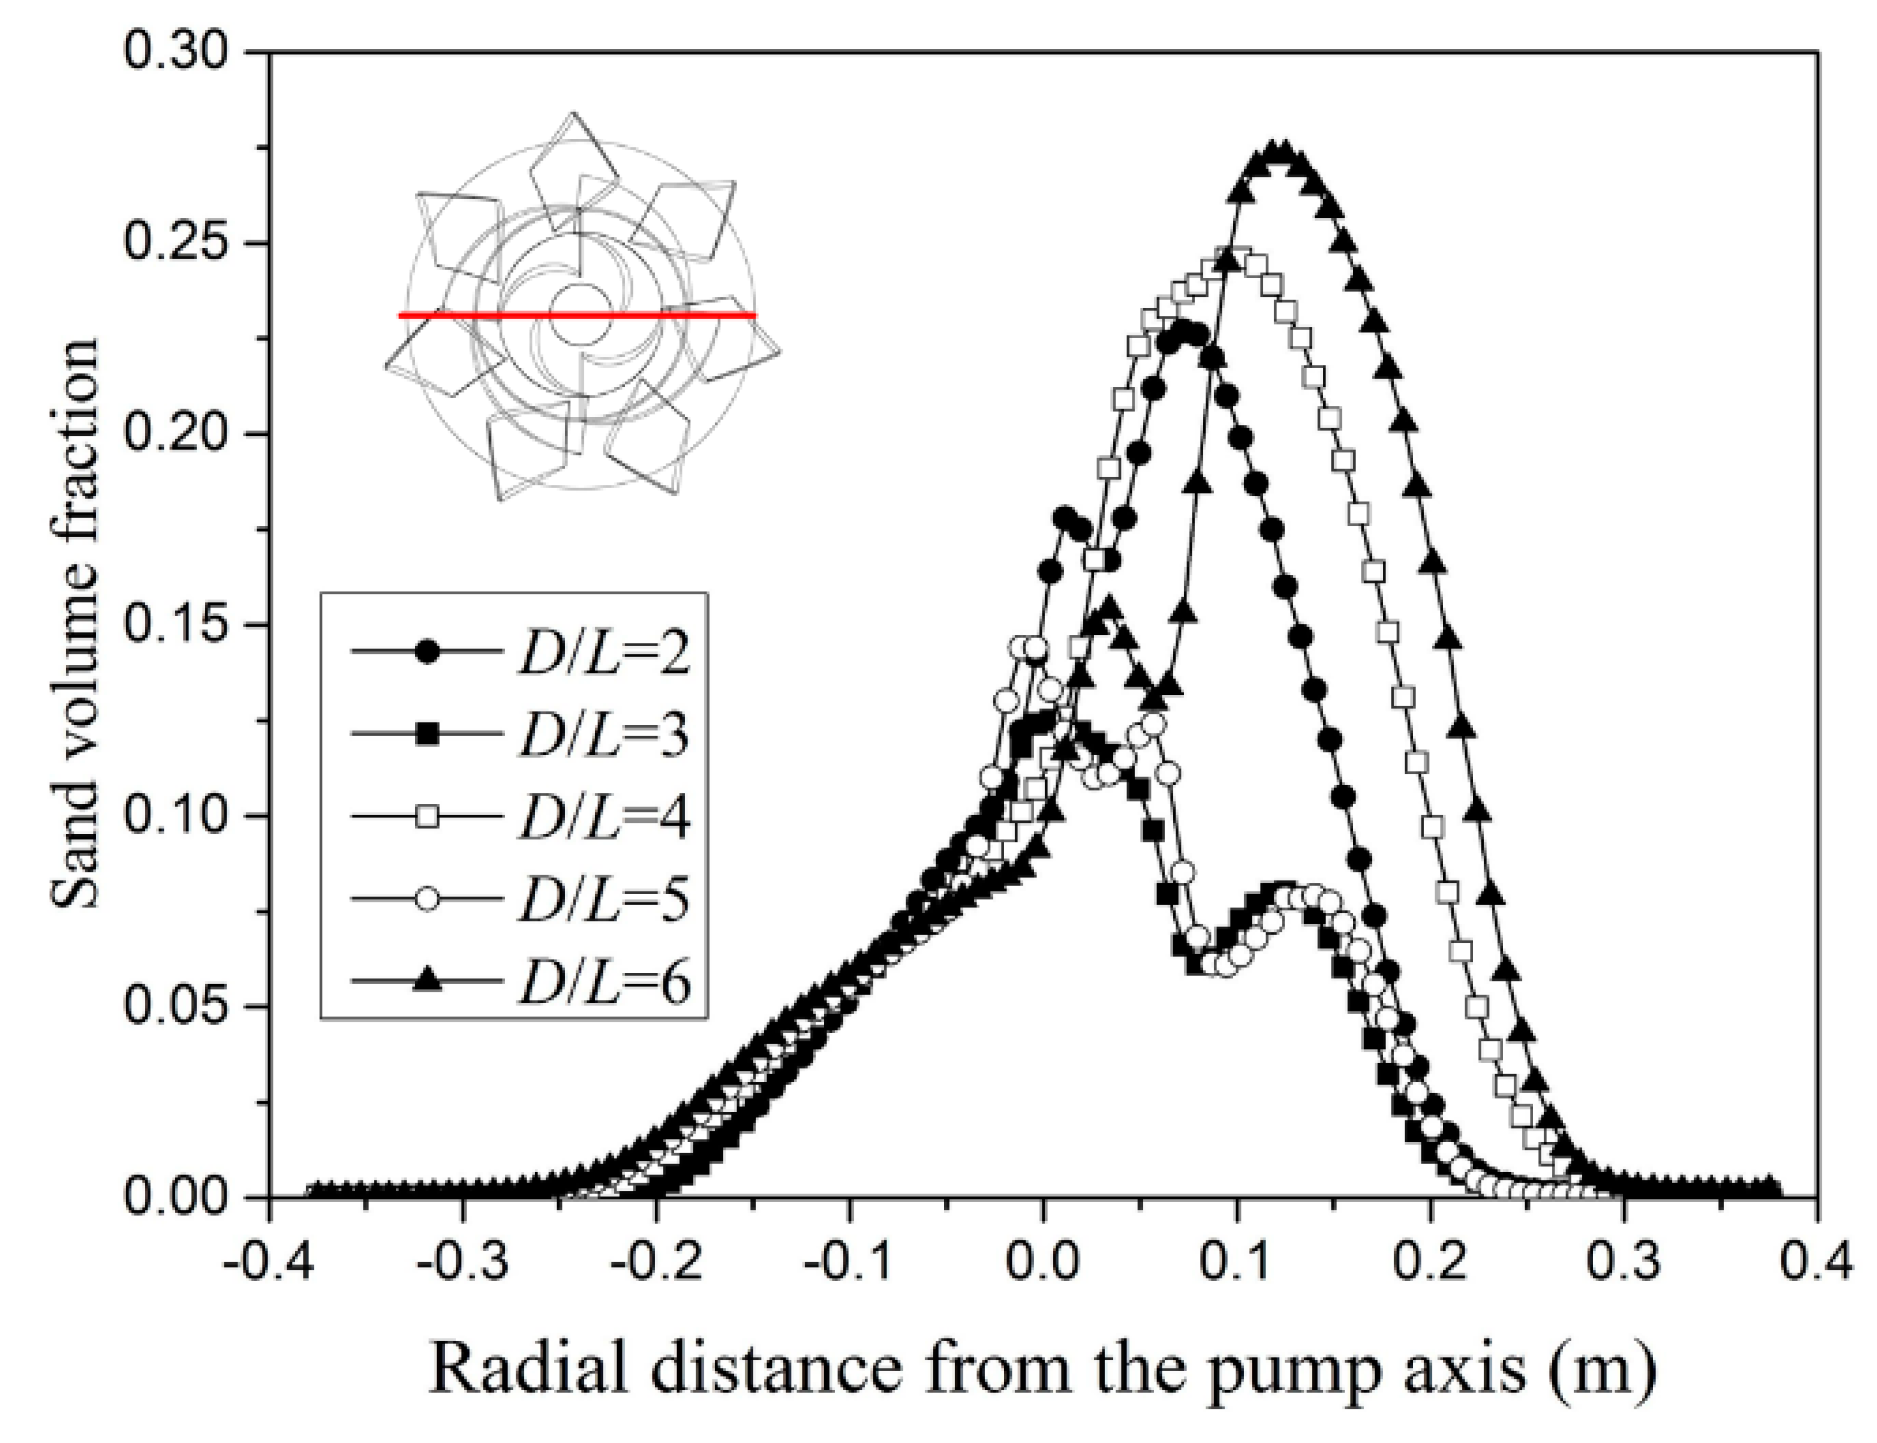
4.2. Distribution of Volume Fraction of Sand

A global view of the distribution of the sand volume fraction enables an assessment of the transport capability of the prefabricated pumping station. Cross-sectional distributions of the sand volume fraction are displayed in Figure 8. It is evident that all distributions displayed in Figure 8 are non-uniform. Nevertheless, overall distributions are similar for the five schemes. Disparity is obvious at the tank bottom, which is related to the bottom shape and the intake flow of the pump. In each tank, sand particles accumulate at the left part of the tank bottom, which is at the same side with the tank inlet. The extent of sand particle deposition varies slightly with D/L. At the pump inlet, high sand volume fraction is associated with weak sand particle deposition at the tank bottom. For D/L = 2, 4, and 6, the distributions of the sand volume fraction in the inlet flare tube of the pump are evidently asymmetric about the shaft axis of the pump.
In the pump outlet pipe, the liquid-solid medium spirals upwards, which is ascribed to the residual rotation effect of the impeller. Consequently, areas with high sand volume fraction appear alternatively along the vertical outlet pipe. In the horizontal segment of the outlet pipe, the movement of the medium is affected by the bend; the sand volume fraction near the pipe wall is relatively high, while near the centerline of the pipe, the sand volume fraction is low.
The other cross section, perpendicular to the cross section monitored in Figure 8 and passing through the shaft axis of the pump, was also selected to depict the spatial distribution of the sand volume fraction. The results are shown in Figure 9.
It is observable that overall distribution of the sand volume fraction is non-uniform, which is common for the five tank schemes. For the two schemes of D/L = 5 and 6, accumulation of sand particles is explicit at the outer part of the tank bottom. Essentially, the consequence of further development of such a distribution pattern is sand particle sedimentation. For the other three schemes, sand particles are effectively entrained by the pump, which is attributable to the shape of the tank bottom.
To quantify the entrainment of sand particles by the pump, distributions of the sand volume fraction along the centerline of the pump inlet section are plotted in Figure 10. The five schemes share the same overall tendency that the sand volume fraction decreases inversely with the radial distance from the center of the pump inlet section. For the five tank schemes, the difference in the highest sand volume fraction is significant. Peak values of sand volume fractions at D/L = 6 and D/L = 5, were 0.273 and 0.143, respectively. Moreover, among the five tank schemes, the deviation between positions where the highest sand volume fraction emerges is recognizable. The scheme of D/L=3 was associated with the lowest sand volume fraction. Furthermore, with such a scheme, sand particles accumulate near the center of the pump inlet section, ensuring a stable incoming flow for the pump.
To assess the overall level of sand particle accumulation, the sand volume fraction was averaged over the pump inlet section. In Figure 11, the sand volume fraction was plotted versus D/L. It is seen that the average sand volume fraction fluctuates with increasing D/L but with an overall rising trend. The averaged sand volume fraction reaches its minimum at D/L = 3. For D/L = 6, which represents the shallowest tank bottom, the averaged sand volume fraction was considerably higher than its counterparts. During the operation, as the medium continues to enter the tank, the interaction between sand particles at the pump inlet was drastic. Consequently, the accumulated particles enhance the burden on the pump suction, boosting the risk of sedimentation of sand particles at the tank bottom.

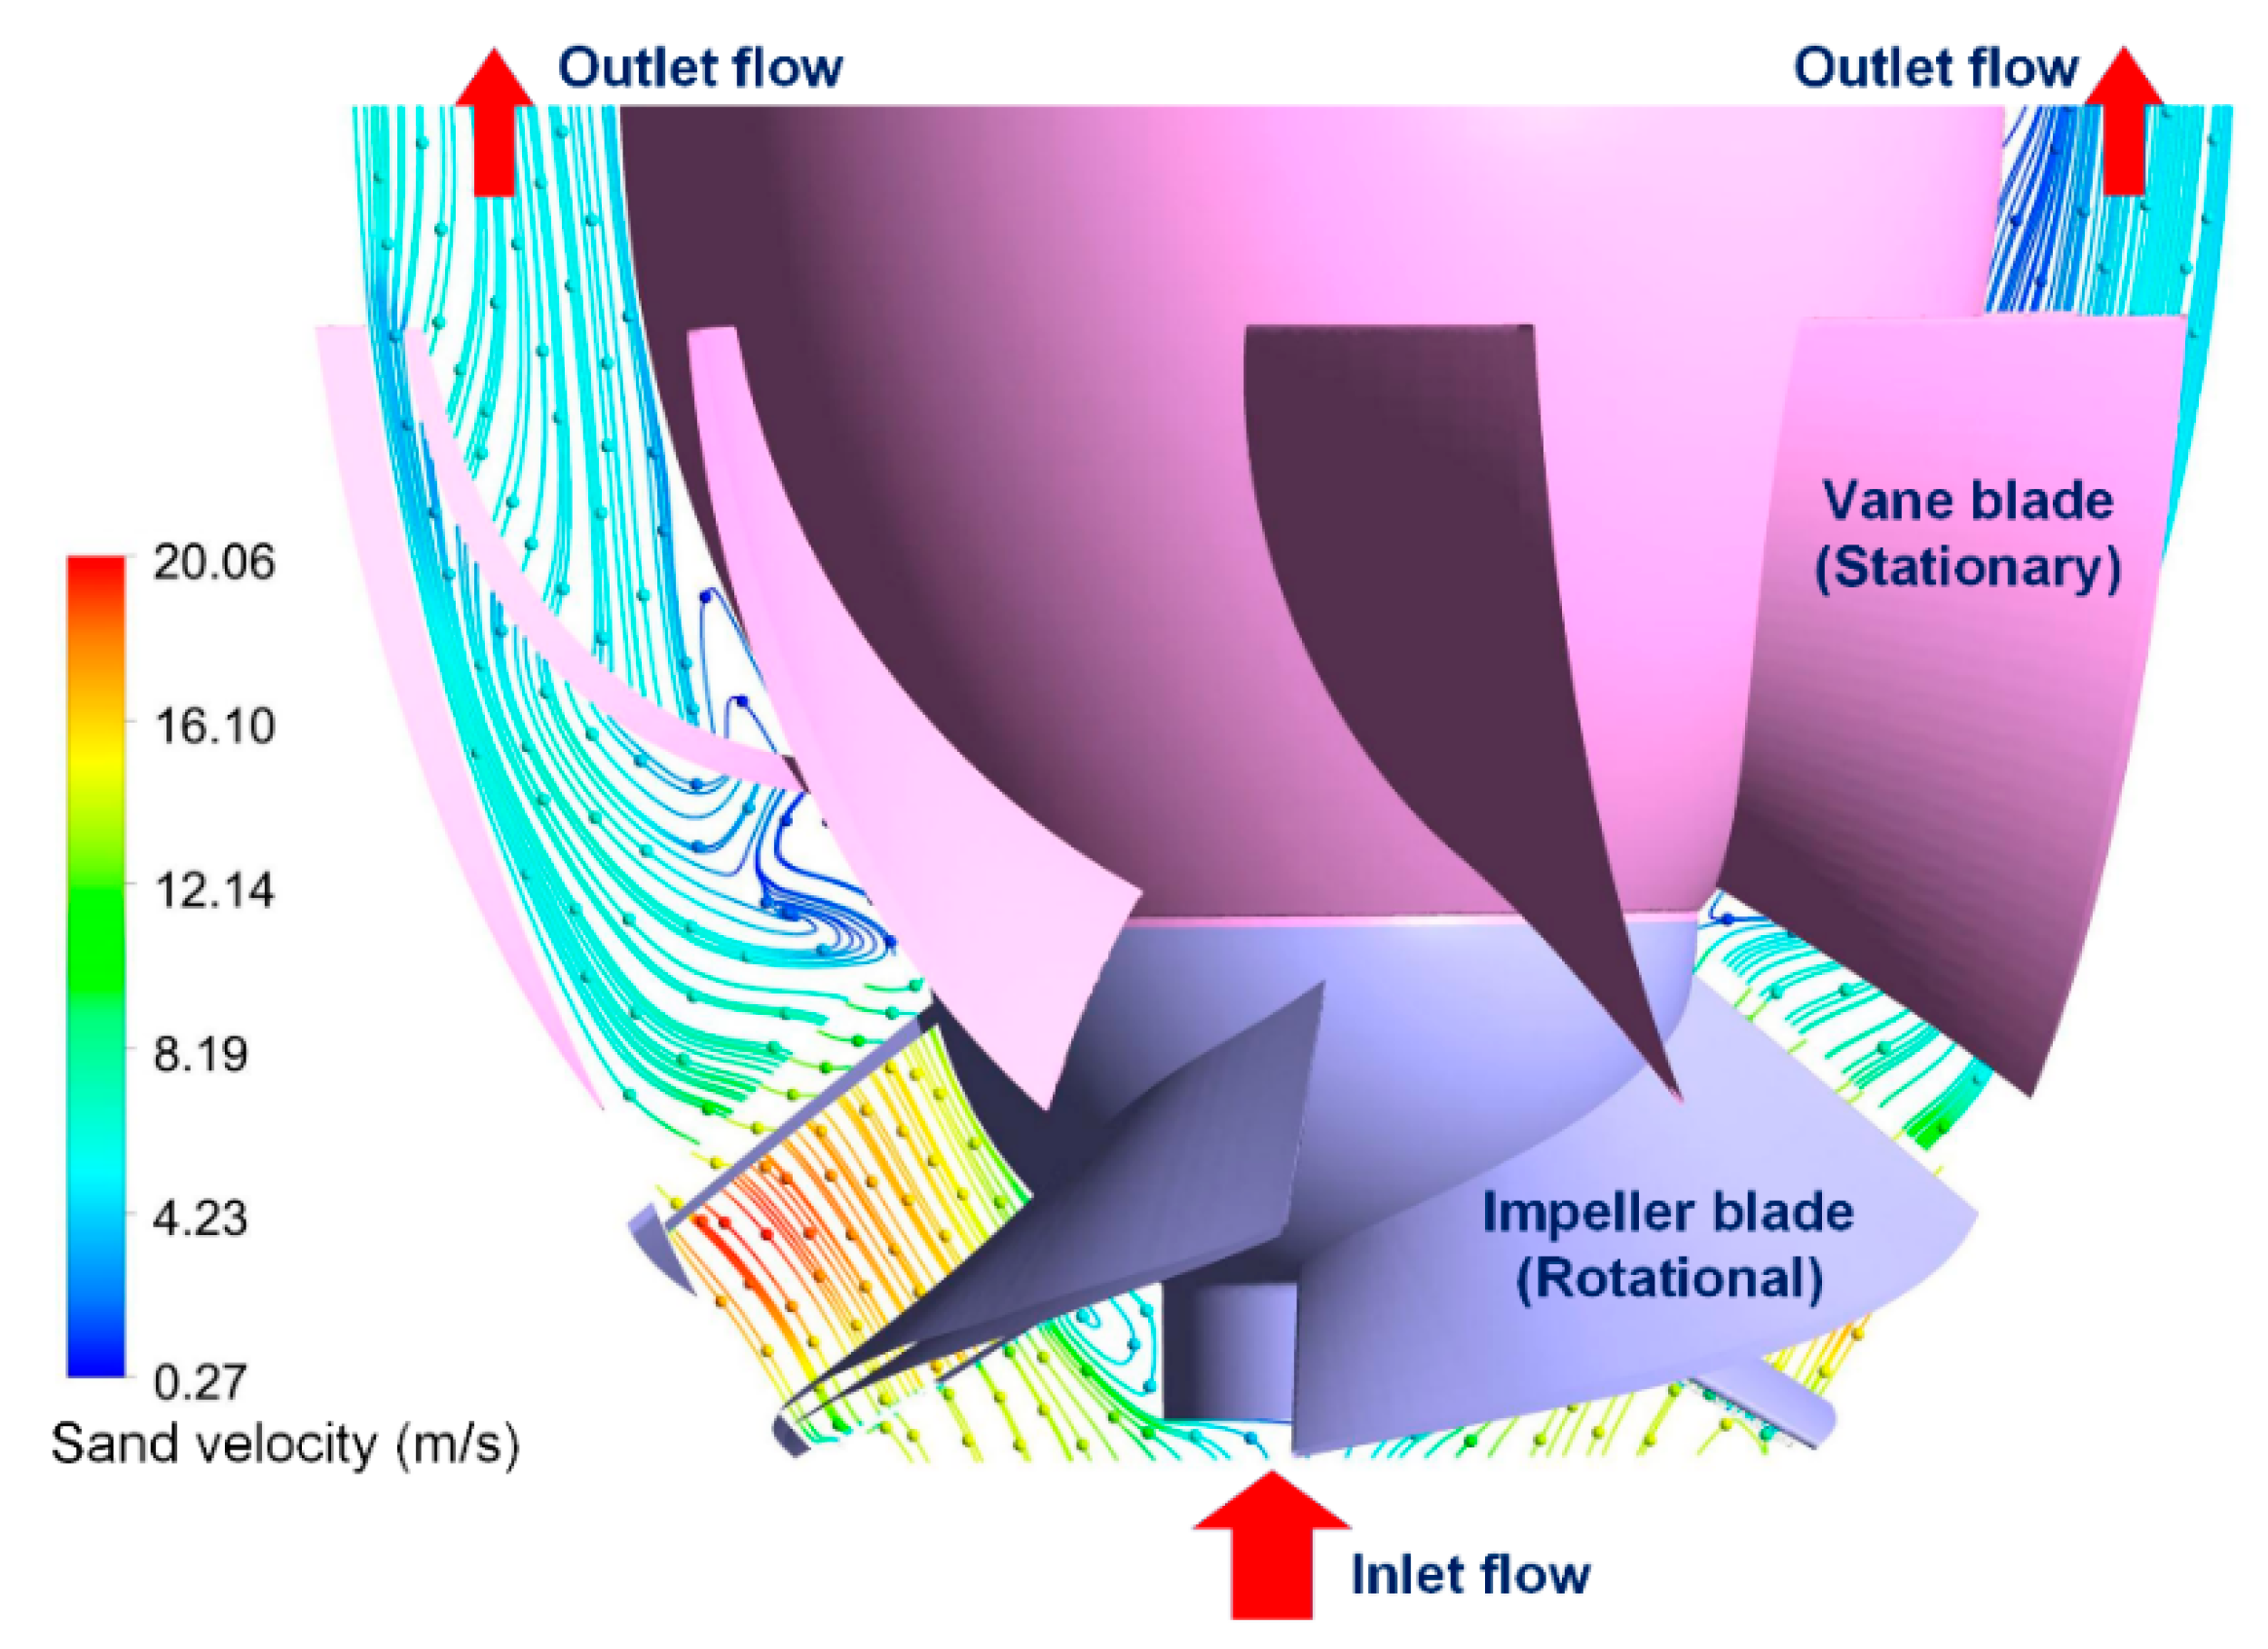
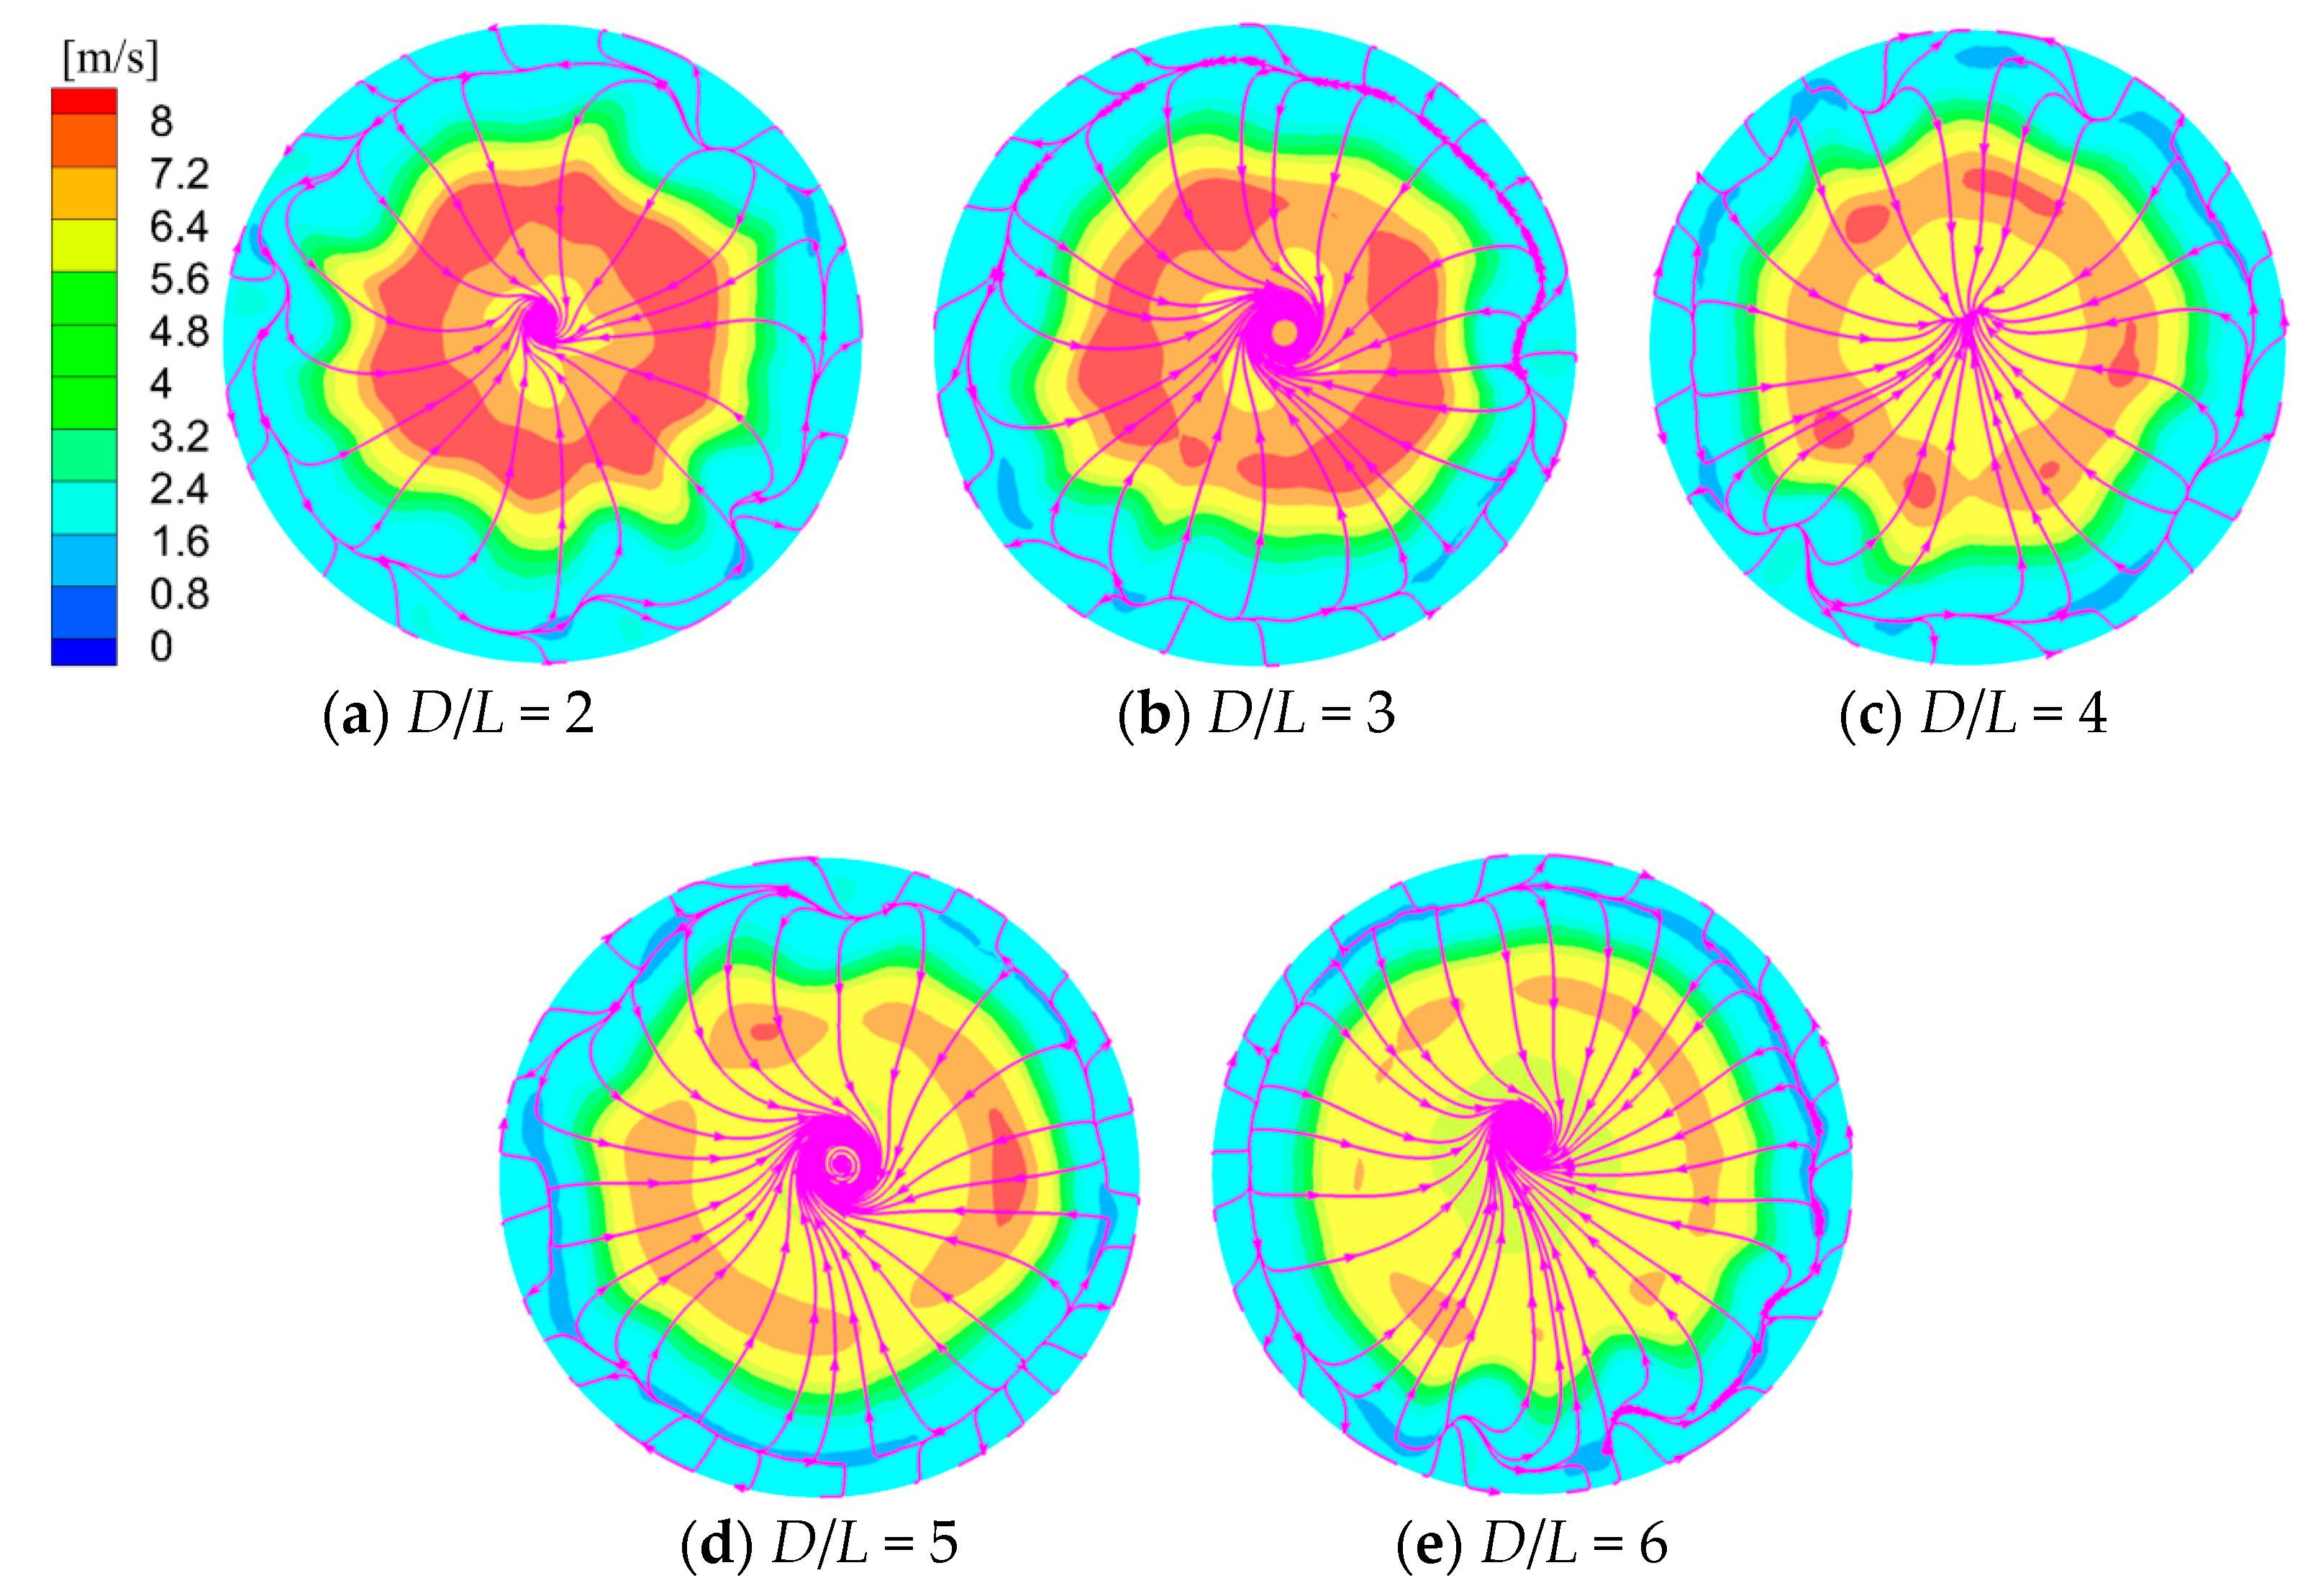
4.3. Velocity Distribution of Sand Particles

To describe the motion of sand particles, distributions of sand particle velocity as well as the streamlines on the cross section shown in Figure 8 were extracted and displayed in Figure 11. Sand particle velocity was low in the tank and increased at the pump inlet due to the sharp decrease in the flow area. In this context, as D/L increases, sand particle velocity in the pump inlet pipe gradually decreases. Moreover, a further increase in sand particle velocity takes place as the cross-sectional flow area decreases in the flare tube along the flow direction before sand particles enter the blade passages. In the pump, sand particle velocity continues to rise after the sand particles receive energy from the impeller blades, as indicated in Figure 7.
The formation of large-scale flow structures depends considerably on the geometry of the medium-wetted wall [28]. It is seen in Figure 12 that flow patterns in the tank were similar for the schemes of D/L = 2, 3, and 4. Near the left and right sides of the vertical pump outlet pipe, downward and upward motions of sand particles were rather smooth. For the schemes of D/L = 5 and 6, large-scale flow structures were distinct in the tank. In these two cases, the combination of the pump suction and the relatively flat tank bottom incurs not just energy loss but also unstable flow patterns. A close observation of the motion of sand particles in the proximity of the pump inlet indicates that sand particle velocities for schemes of D/L = 5 and 6 were fairly low. In this context, the chance of the concentration of sand particles at the pump inlet was high relative to other schemes. In Figure 12f, the sand particle velocity of the center point of the pump inlet section is plotted as a function of D/L. It is clearly evident that for the schemes of D/L = 3, 4, and 5, sand particle velocities were considerably lower than their counterparts, implying a relatively weak suction effect. In comparison, the two velocity magnitudes for D/L = 2 and 3 were nearly equivalent and both schemes can improve the transportation efficiency of sand particles and mitigate the particle deposition at the tank bottom.
Distributions of sand particle velocity and streamlines on the pump inlet section are displayed in Figure 13. It is seen that sand particle velocity decreases gradually as D/L rises from 2 to 6. The mutual point of the five schemes was that sand particles gathered towards the center of the pump inlet section. During this process, two phenomena were distinct. Near the wall, sand particles traveled in a circumferential direction, which was exposed to the influence of the impeller rotation. The other phenomenon was the vortex formed at the center of the pump inlet section. In Figure 13, all the five vortices are clockwise, but they vary in scale, intensity, and the position of the vortex core. Such a vortex symbolizes a strong entrainment force that is imposed on sand particles and the transport of sand particles will be facilitated thereby. As is evidently clear, that vortex intensity was particularly high at D/L = 3 and 5.
For traditional pumping stations, the intake vortex should be avoided or at least restricted in consideration of the negative impact of the vortex on stable operation of the pump [29]. In accordance with this principle, auxiliary devices have been attempted to suppress the inlet vortex [30,31,32]. However, for the prefabricated pumping station considered here, the pump inlet section was located near the tank bottom and the intake vortex promotes the entrainment of sand particles. The mixture of water and sand in the tank was disturbed by the vortex, so that sand particles were dispersed in water. For the scheme of D/L = 3, the intake vortex was developed, and high velocity was predominant at the pump inlet; therefore, the sand particle deposition at the tank bottom was mitigated.

5. Conclusions

  • Highly three-dimensional and non-uniform two-phase flow patterns in the prefabricated pumping station were revealed. The underlying mechanisms of sand particle sedimentation were explained from the flow aspect. The orientation of the tank inlet contributed to the high risk of sand deposition at the tank bottom side close to the tank inlet. Circumferential distribution of sand particles at the tank bottom was proved uneven.
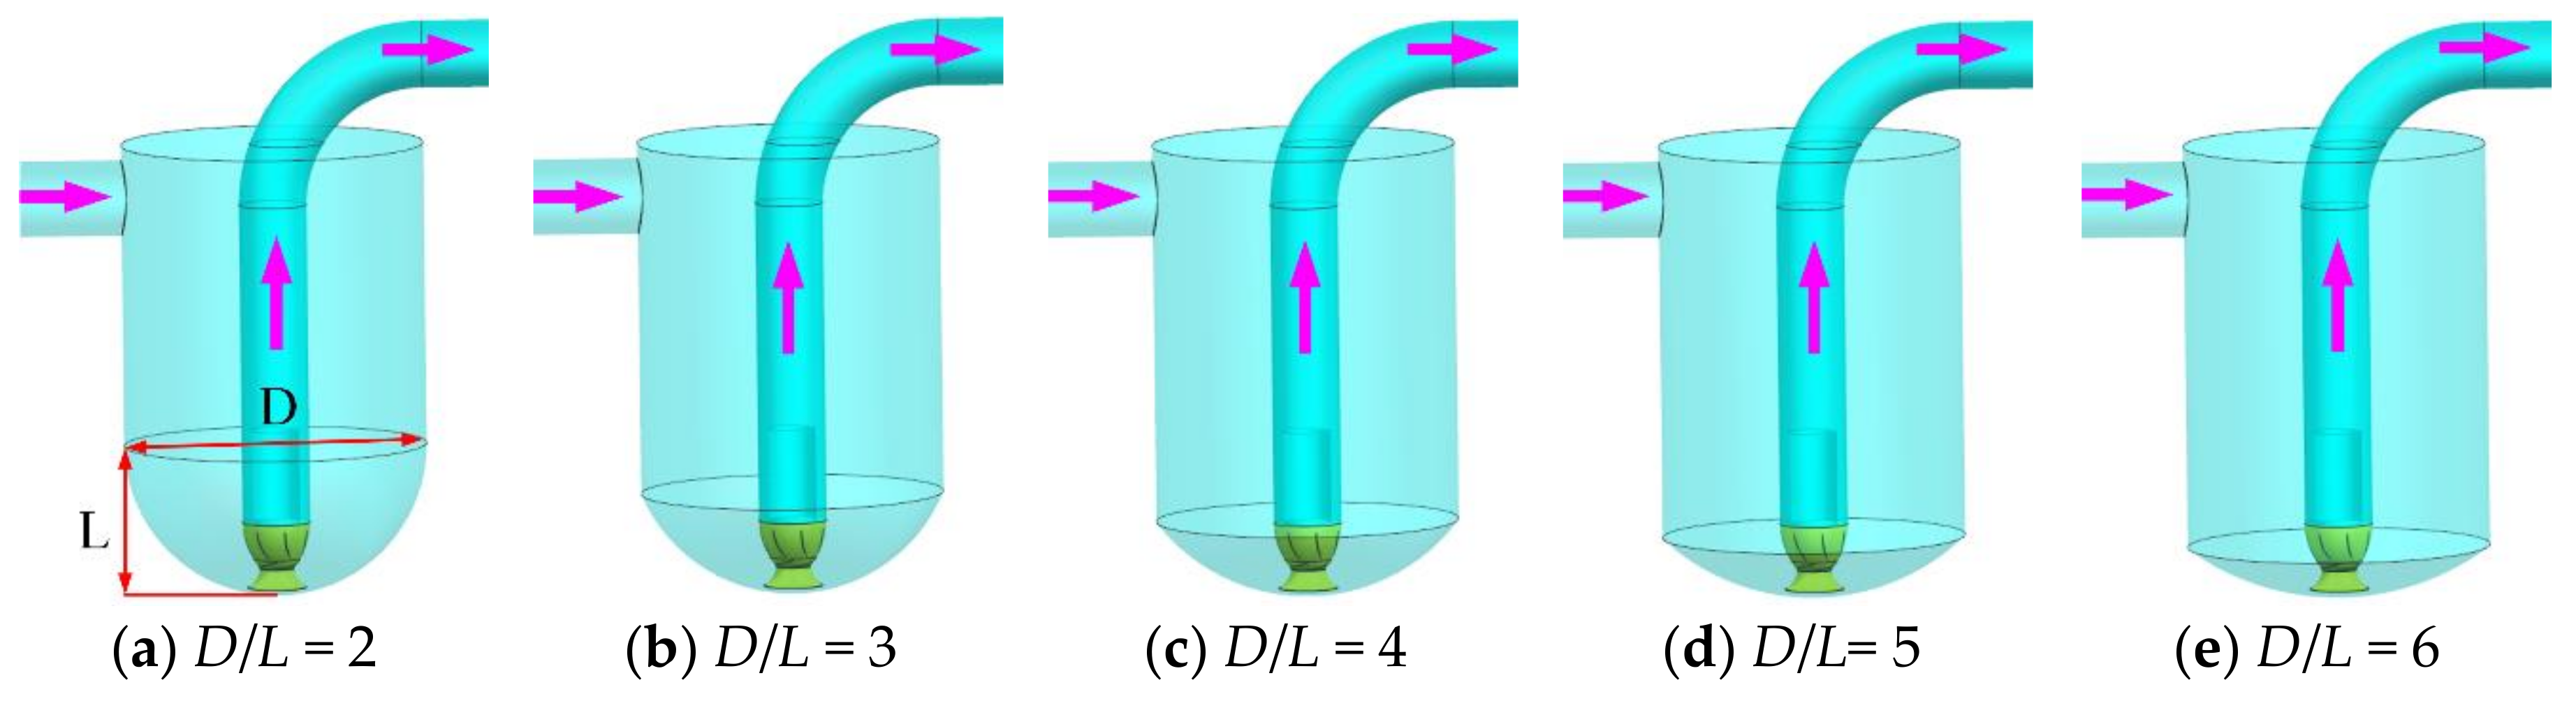
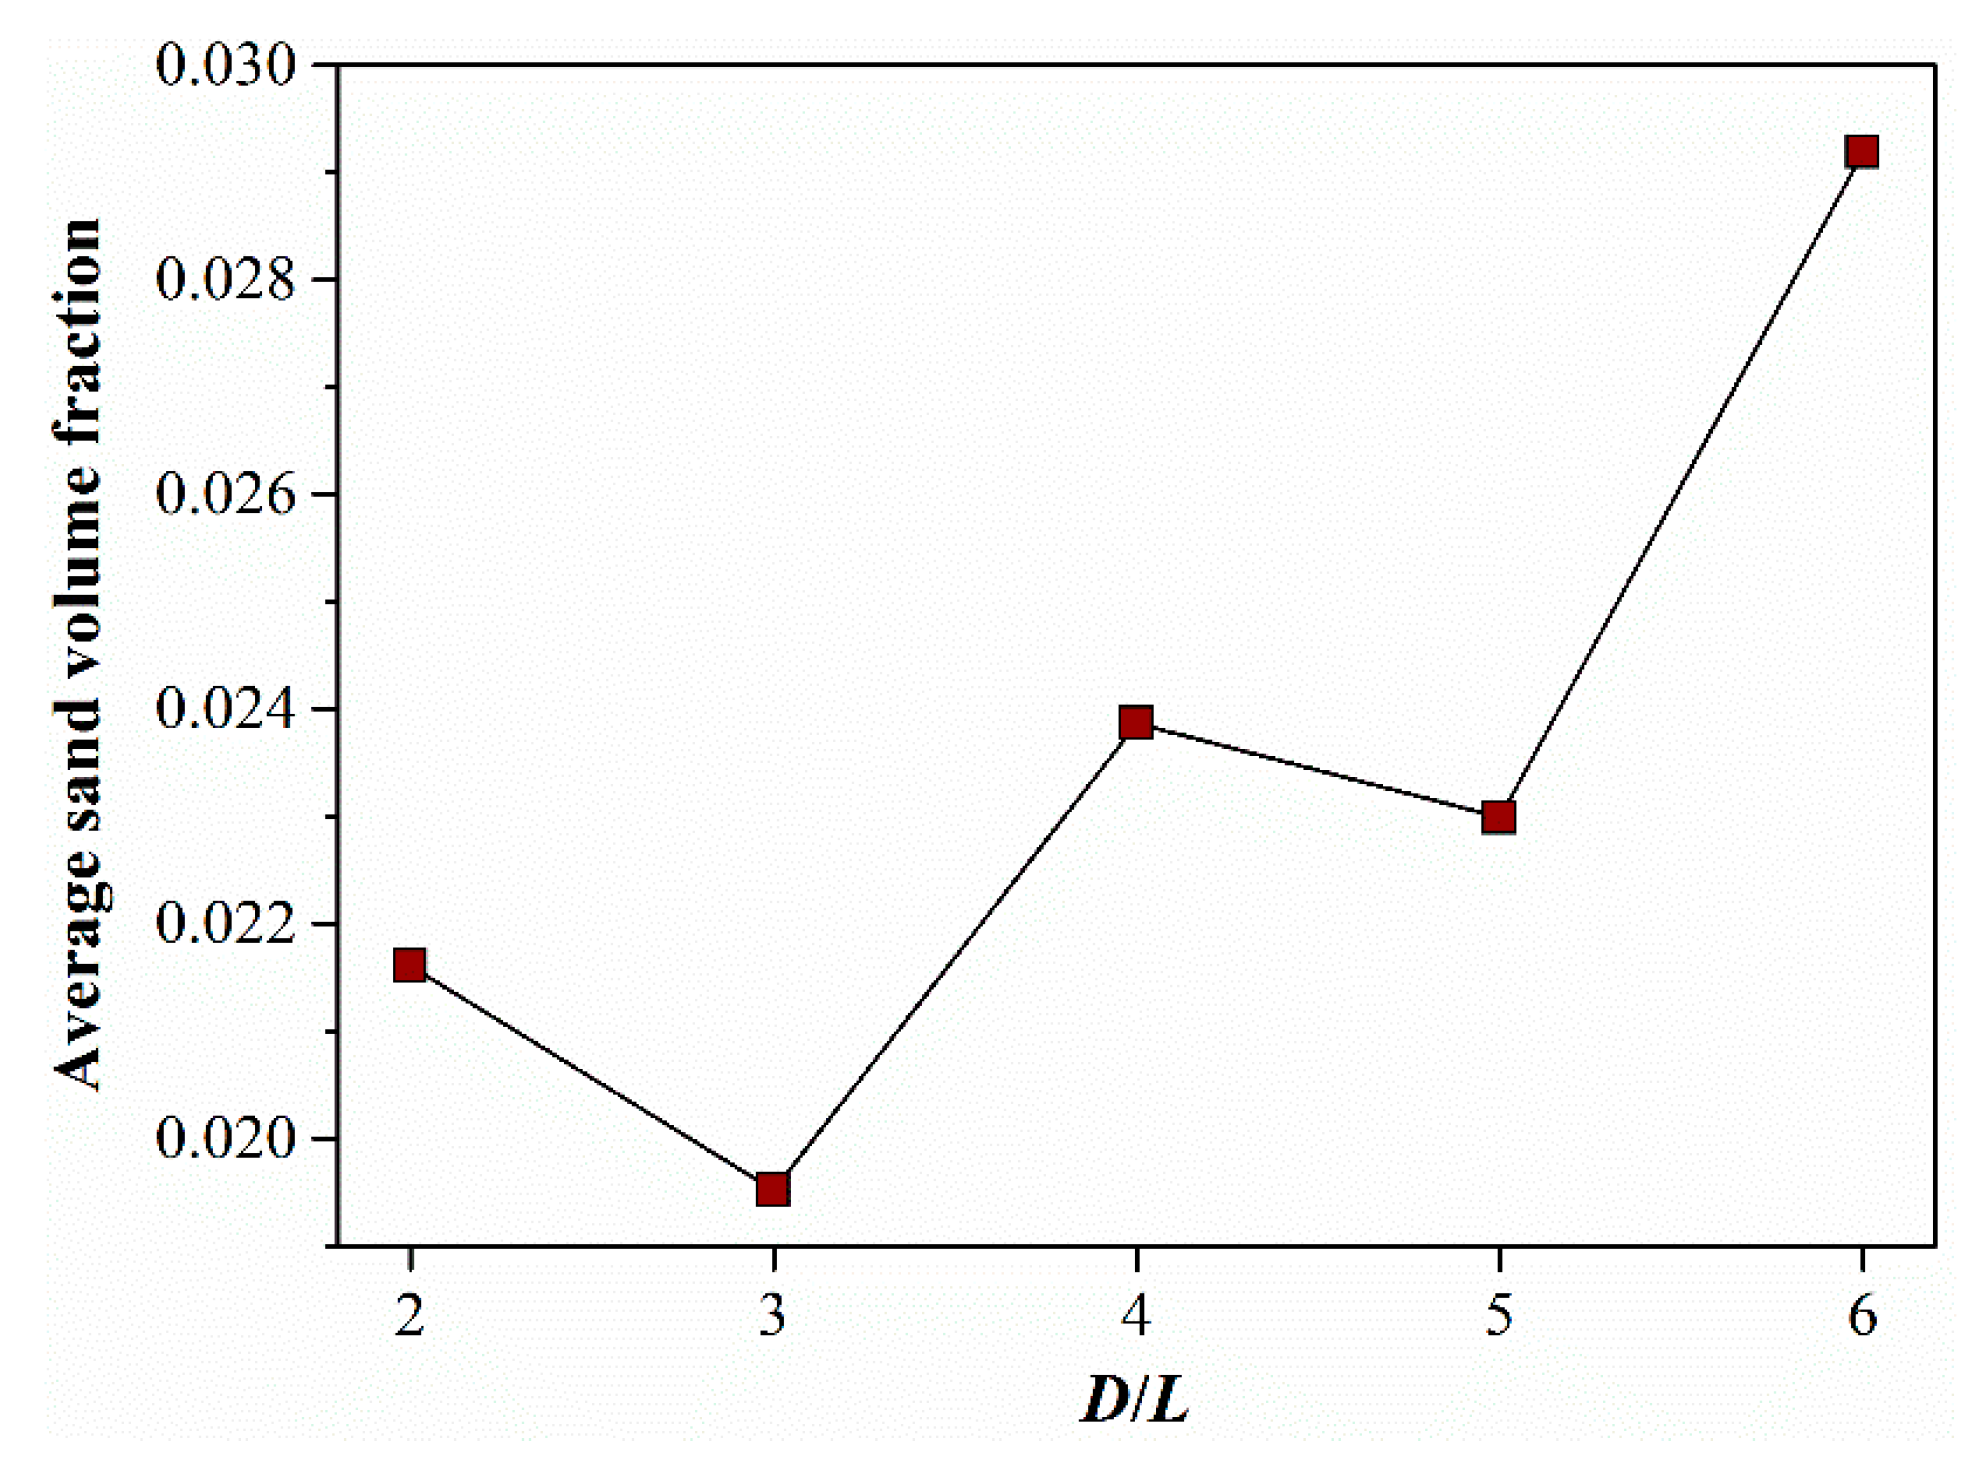
  • The tank bottom geometry imposed a significant effect on the deposition of sand particles. Since the pump kept inhaling sand particles and imparting energy into them, a reasonable distribution of the sand volume fraction at the pump inlet was critical. Such a distribution varies considerably with D/L. The averaged sand volume fraction at the pump inlet reaches its minimum at D/L = 3, which signifies an efficient suction of sand particles.
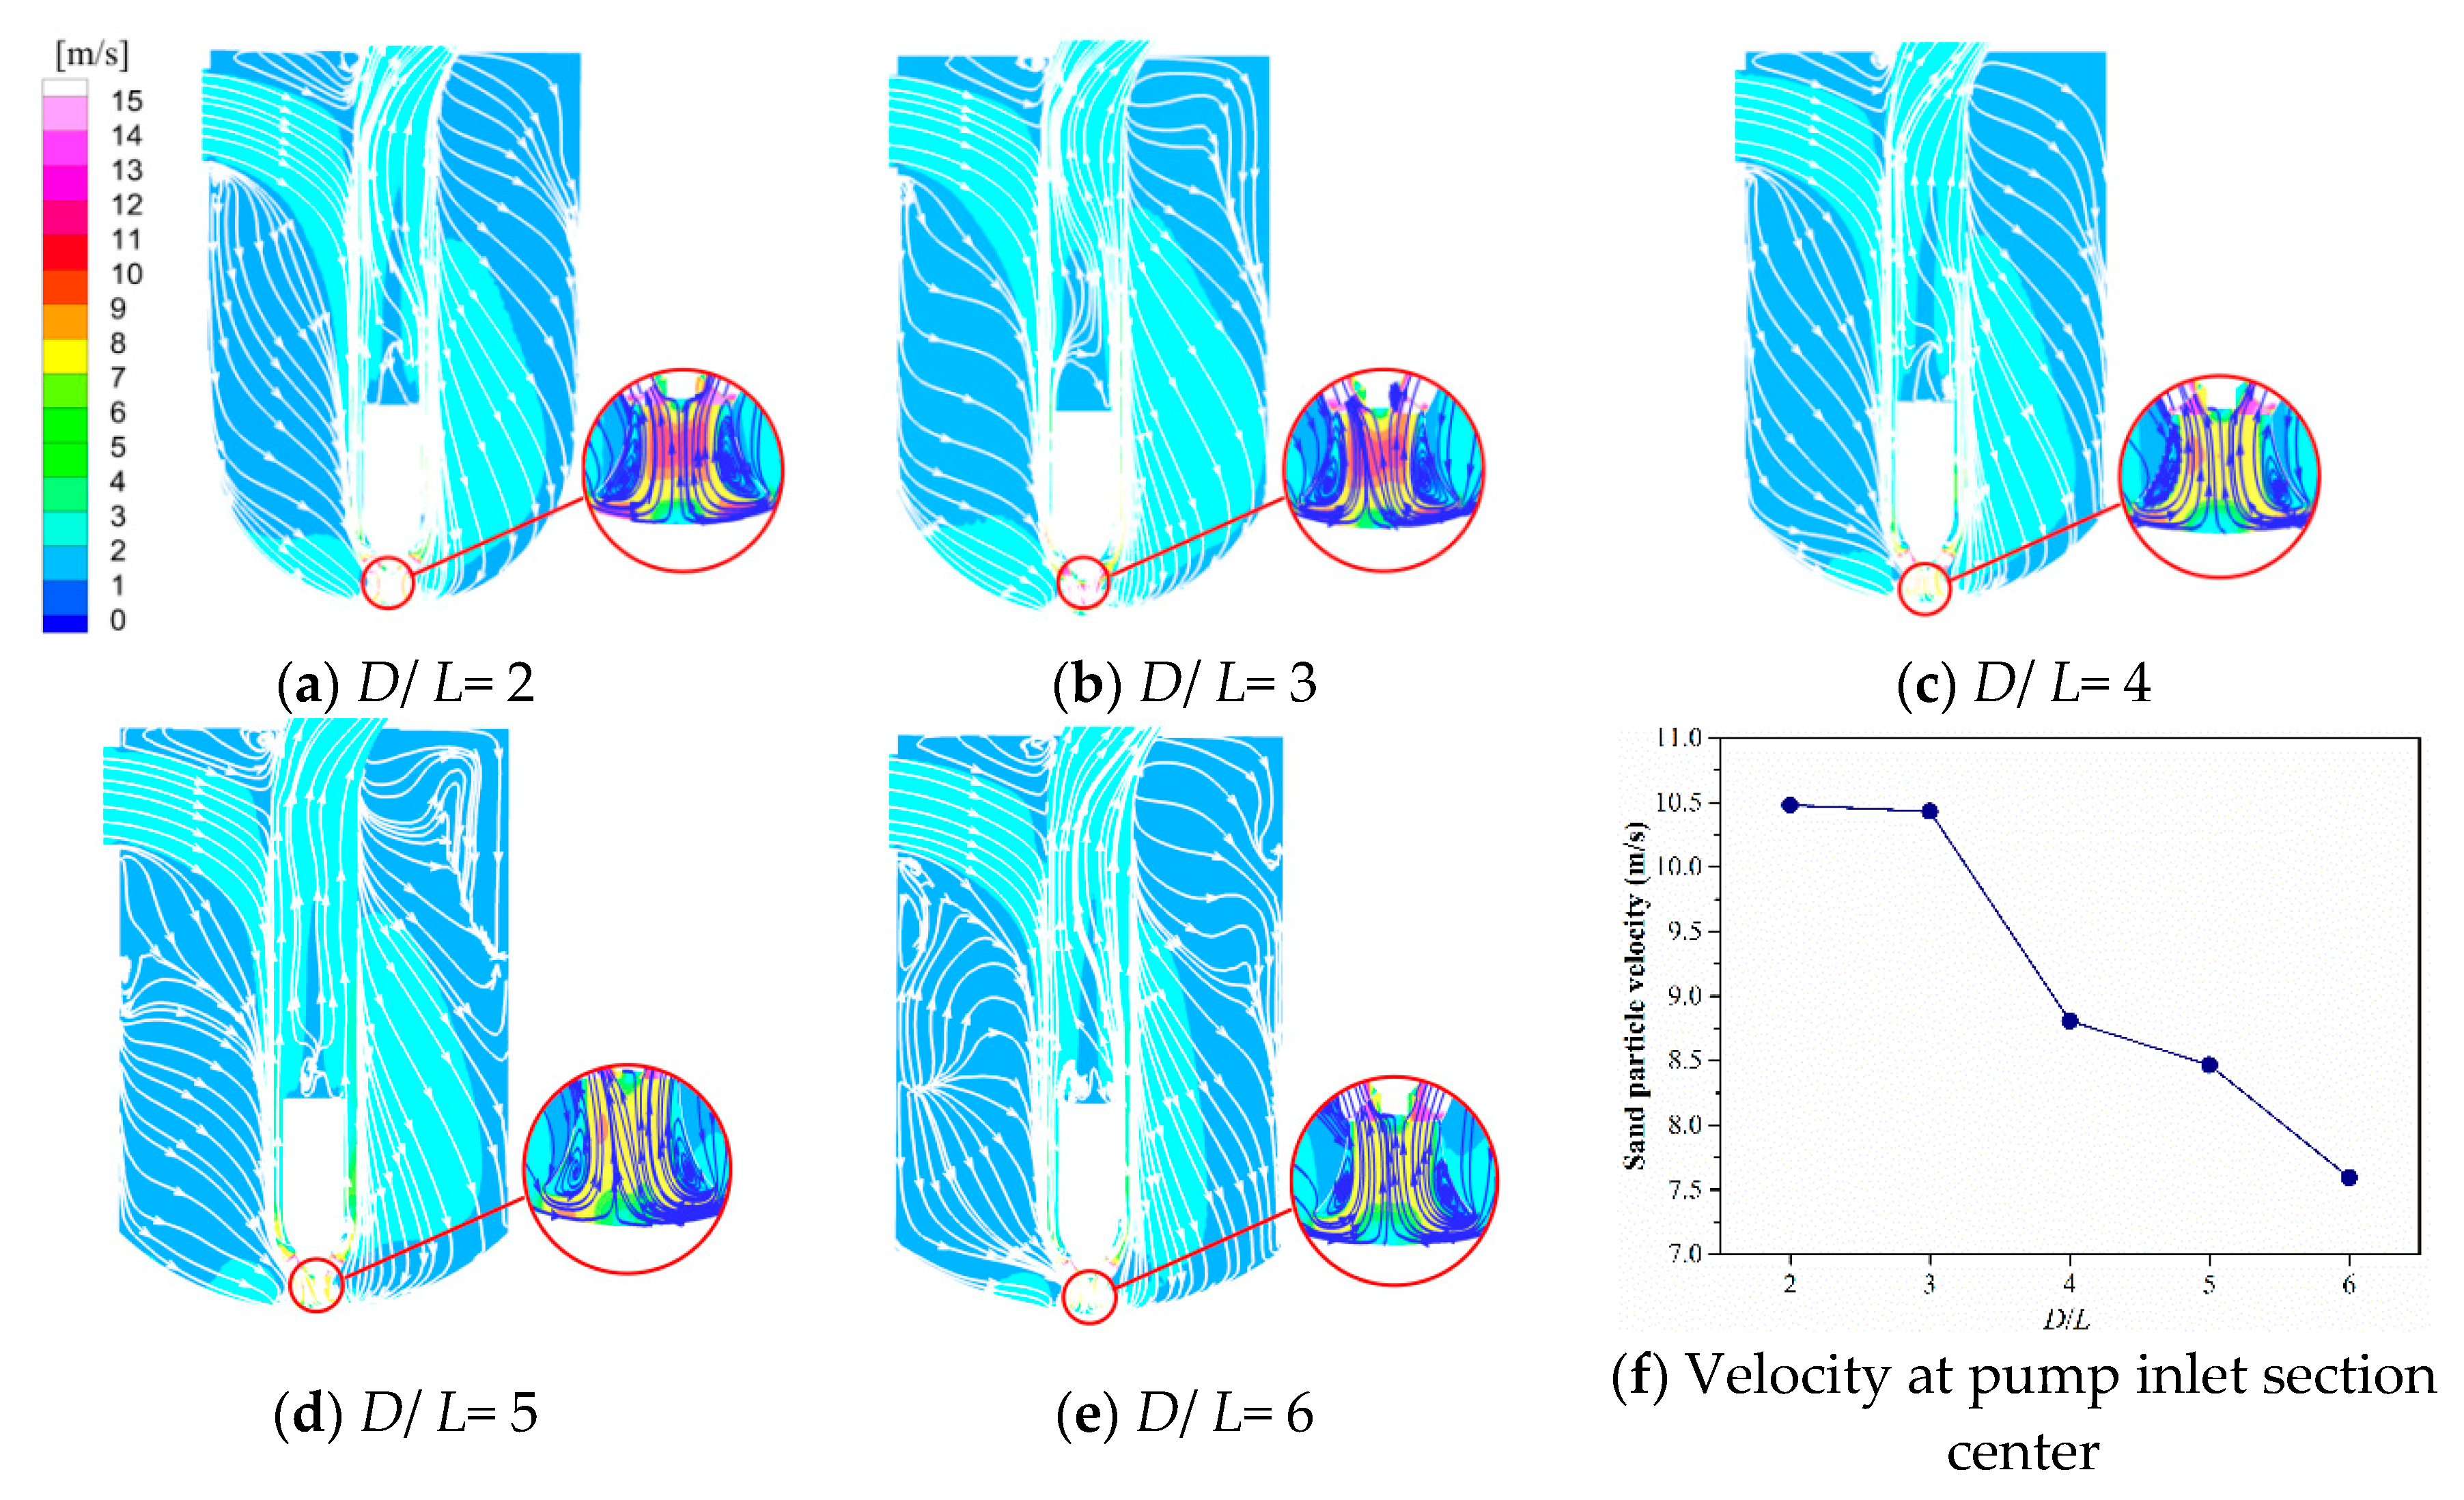
  • The motion of sand particles at the pump inlet should be sufficiently stimulated to restrict sand particle deposition. The sand particle velocity at the pump inlet decreased gradually with increasing D/L. The highest intensity of the large-scale vortex formed at the pump inlet arose at D/L = 3, which was also responsible for locally high sand particle velocity and active motion of sand particles. The best anti-sedimentation performance was attained at D/L = 3.

Author Contributions

Conceptualization, C.K. and M.L.; methodology, Q.L. and C.K.; software, S.T.; validation, Q.L. and S.T.; data analysis, C.K., Q.L., and M.L.; writing—original draft preparation, Q.L.; writing—review and editing, C.K.; funding acquisition, C.K.

Funding

This research was funded by the Six Talents Peak Project of Jiangsu Province of China, grant number 2015–ZBZZ–018.

Acknowledgments

The authors are grateful to the Computation Center of Jiangsu University for the high-performance computer cluster.

Conflicts of Interest

The authors declare no conflict of interest.

References

  1. Liu, H.; Jia, Y.; Niu, C. “Sponge city” concept helps solve China’s urban water problems. Environ. Earth Sci. 2017, 76, 473–477. [Google Scholar] [CrossRef]
  2. Zeferino, J.A.; Cunha, M.C.; Antunes, A.P. Adapted optimization model for planning regional wastewater systems: case study. Water Sci. Technol. 2017, 76, 1196–1205. [Google Scholar] [CrossRef]
  3. Li, Q.; Kang, C.; Li, M.Y. Flow features of a prefabricated pumping station operating under high flow rate conditions. Int. J. Fluid Mach. Syst. 2018, 11, 171–180. [Google Scholar] [CrossRef]
  4. Chen, H.X.; Guo, J.H. Numerical simulation of 3-D turbulent flow in the multi-intakes sump of the pump station. J. Hydrodyn. Ser. B 2007, 19, 42–47. [Google Scholar] [CrossRef]
  5. Li, X.; Jiang, Z.; Zhu, Z.; Si, Q.; Li, Y. Entropy generation analysis for the cavitating head-drop characteristic of a centrifugal pump. P. I. Mech. Eng. C-J. Mec. 2018, 232, 4637–4646. [Google Scholar] [CrossRef]
  6. Teaima, I.R.; El-Gamal, T. Improving flow performance of irrigation pump station intake. J. Appl. Water Eng. Res. 2013, 1, 31–42. [Google Scholar] [CrossRef]
  7. Azimi, A.H.; Zhu, D.Z.; Rajaratnam, N. Computational investigation of vertical slurry jets in water. Int. J. Multiphas. Flow 2012, 47, 94–114. [Google Scholar] [CrossRef]
  8. Gandhi, B.K.; Singh, S.N.; Seshadri, V. Performance characteristics of centrifugal slurry pumps. J. Fluid. Eng.-T. ASME 2001, 123, 271–280. [Google Scholar] [CrossRef]
  9. Cheng, W.; Gu, B.; Shao, C.; Wang, Y. Hydraulic characteristics of molten salt pump transporting solid-liquid two-phase medium. Nucl. Eng. Des. 2017, 324, 220–230. [Google Scholar] [CrossRef]
  10. Lu, L.G. Basic flow patterns and optimum hydraulic design of a suction box of pumping station. J. Hydrodyn. Ser. B 2000, 12, 46–51. [Google Scholar]
  11. Cong, G.; Wang, F. Numerical investigation on the flow structure and vortex behavior at a large scale pump sump. In Proceedings of the ASME-JSME Joint Fluids Engineering Conference, San Diego, CA, USA, 30 July–2 August 2007. [Google Scholar]
  12. Tanweer, S.; Desmukh, V.K.G. Numerical study of flow behaviour in a multiple intake pump sump. Int. J. Adv. Eng. Technol. 2011, 2, 118–128. [Google Scholar]
  13. Li, W.; Zhong, W. CFD simulation of hydrodynamics of gas-liquid-solid three-phase bubble column. Powder Technol. 2015, 286, 766–788. [Google Scholar] [CrossRef]
  14. Virdung, T.; Rasmuson, A. Hydrodynamic properties of a turbulent confined solid-liquid jet evaluated using PIV and CFD. Chem. Eng. Sci. 2007, 62, 5963–5978. [Google Scholar] [CrossRef]
  15. Zhou, W.; Zhao, Z.; Lee, T.S.; Winoto, S.H. Investigation of flow through centrifugal pump impellers using computational fluid dynamics. Int. J. Rotating Mach. 2007, 9, 49–61. [Google Scholar] [CrossRef]
  16. Menter, F.R. Two-equation eddy-viscosity turbulence models for engineering applications. AIAA J. 1994, 32, 1598–1605. [Google Scholar] [CrossRef]
  17. Rocha, P.A.C.; Rocha, H.H.B.; Carneiro, F.O.M.; Vieira da Silva, M.E.; Bueno, A.V. k–ω SST (shear stress transport) turbulence model calibration: A case study on a small scale horizontal axis wind turbine. Energy 2014, 65, 412–418. [Google Scholar] [CrossRef]
  18. Isaev, S.A.; Baranov, P.A.; Zhukova, Y.V.; Usachov, A.E.; Kharchenko, V.B. Correction of the shear-stress-transfer model with account of the curvature of streamlines in calculating separated flows of an incompressible viscous fluid. J. Eng. Phys. Thermophys. 2014, 87, 1002–1015. [Google Scholar] [CrossRef]
  19. Kim, H.J.; Park, S.W.; Rhee, D.S. Numerical analysis of the effects of anti-vortex device height on hydraulic performance of pump sump. KSCE J. Civ. Eng. 2017, 21, 1484–1492. [Google Scholar] [CrossRef]
  20. Moshfeghi, M.; Song, Y.J.; Xie, Y.H. Effects of near-wall grid spacing on SST k-ω model using NREL Phase VI horizontal axis wind turbine. J. Wind Eng. Ind. Aerod. 2012, 107–108, 94–105. [Google Scholar] [CrossRef]
  21. Messa, G.V.; Ferrarese, G.; Malavasi, S. A mixed Euler–Euler/Euler–Lagrange approach to erosion prediction. Wear 2015, 342–343, 138–153. [Google Scholar] [CrossRef]
  22. Azimi, A.H.; Zhu, D.Z.; Rajaratnam, N. Effect of particle size on the characteristics of sand jets in water. J. Eng. Mech. 2011, 137, 822–834. [Google Scholar] [CrossRef]
  23. Duarte, C.R.; Murata, V.V.; Barrozo, M.A.S. A study of the fluid dynamics of the spouted bed using CFD. Braz. J. Chem. Eng. 2005, 22, 263–270. [Google Scholar] [CrossRef]
  24. Shi, D.-P.; Luo, Z.-H.; Zheng, Z.-W. Numerical simulation of liquid-solid two-phase flow in a tubular loop polymerization reactor. Powder Technol. 2010, 198, 135–143. [Google Scholar] [CrossRef]
  25. Gómez, L.C.; Milioli, F.E. A numerical simulation analysis of the effect of the interface drag function on cluster evolution in a CFB riser gas-solid flow. Braz. J. Chem. Eng. 2004, 21, 569–583. [Google Scholar] [CrossRef]
  26. Xu, L.; Xia, Z.; Guo, X.; Chen, C. Application of population balance model in the simulation of slurry bubble column. Ind. Eng. Chem. Res. 2014, 53, 4922–4930. [Google Scholar] [CrossRef]
  27. Panneerselvam, R.; Savithri, S.; Surender, G.D. CFD simulation of hydrodynamics of gas-liquid-solid fluidised bed reactor. Chem. Eng. Sci. 2009, 64, 1119–1135. [Google Scholar] [CrossRef]
  28. Choi, J.W.; Choi, Y.D.; Kim, C.G.; Lee, Y.H. Flow uniformity in a multi-intake pump sump model. J. Mech. Sci. Technol. 2010, 24, 1389–1400. [Google Scholar] [CrossRef]
  29. Park, I.; Kim, H.-J.; Seong, H.; Rhee, D.S. Experimental studies on surface vortex mitigation using the floating anti-vortex device in sump pumps. Water 2018, 10, 441. [Google Scholar] [CrossRef]
  30. Kang, W.T.; Shin, B.R.; Doh, D.H. An effective shape of floor splitter for reducing sub-surface vortices in pump sump. J. Mech. Sci. Technol. 2014, 28, 175–182. [Google Scholar] [CrossRef]
  31. Kabiri-Samani, A.R.; Borghei, S.M. Effects of anti-vortex plates on air entrainment by free vortex. Sci. Iran. 2013, 20, 251–258. [Google Scholar]
  32. Ahmad, Z.; Jain, B.; Kumar, S.; Mittal, M.K. Rational design of a pump-sump and its model testing. J. Pipeline Syst. Eng. 2011, 2, 53–63. [Google Scholar] [CrossRef]
Figure 1. Storage tank of the prefabricated pumping station: (a) image; (b) schematic view of major components in the tank.
Water 11 00602 g001
Figure 2. Various behaviors of sand particles in the prefabricated pumping station.
Water 11 00602 g002
Figure 3. Five tank schemes with different tank bottom shapes.
Water 11 00602 g003
Figure 4. Grids for the computation domain of the scheme of D/L = 2.
Water 11 00602 g004
Figure 5. Experimental rig for the prefabricated pumping station.
Water 11 00602 g005
Figure 6. Comparison of numerical data and test data with the case of D/L = 2.
Water 11 00602 g006
Figure 7. Flow patterns in the pump on an azimuthal plane at the design flow rate.
Water 11 00602 g007
Figure 8. Cross-sectional distributions of the sand volume fraction (View 1).
Water 11 00602 g008
Figure 9. Cross-sectional distributions of the sand volume fraction (View 2).
Water 11 00602 g009
Figure 10. Distributions of the sand volume fraction over the centerline of the pump inlet section.
Water 11 00602 g010
Figure 11. Averaged sand volume fractions over the pump inlet section.
Water 11 00602 g011
Figure 12. Velocity distributions and streamlines of sand particles in the tank.
Water 11 00602 g012
Figure 13. Cross-sectional velocity distributions and flow patterns at the pump inlet.
Water 11 00602 g013
Table 1. Grid numbers adopted in final simulations.
Tank SchemeD/L = 2D/L = 3D/L = 4D/L = 5D/L = 6
Approximate grid number (×106)7.787.136.906.756.68

