3.1. Calibration and Validation of SIMDualKc with Sap Flow Data
The initial and calibrated values of the parameters relative to the SIMDualKc model are presented in
Table 2 and they refer to the conditions observed in field. The calibrated K
cb parameters are smaller than the initial ones, mainly those relative to the non-growing season and the initial periods (K
cb non-growing and K
cb ini). Differences for K
cb mid resulted relatively small. However, K
cb mid adjusted to the climate are slightly smaller than reported in
Table 2 (0.44 to 0.47) because local climate is dry and RH
min is small, while K
cb end are slightly increased (0.44 to 0.48) since RH
min is also increased by the end-season. The calibrated p parameters closely follow those proposed by FAO56 [
4]. Runoff CN changed little and deep percolation parameters did not change because these parameters were adjusted in a previous study [
19].
Most studies in literature report on actual K
cb values, that is, when the crop was affected by water stress since deficit irrigation is mostly used in olive orchards. In addition, most studies focus on the irrigation season only and data relative to other crop growth stages are quite scarce, namely for the non-growing period and initial crop stage. Moreover, K
cb values reported in literature are not adjusted to the climate. Therefore, it results difficult to compare our results with those relative to other studies. K
cb mid values of this study are similar to those reported by Santos et al. [
26] when using remote sensing observations of an olive orchard under water stress conditions. Slightly lower K
cb mid values were reported by Conceição et al. [
59]. Differently, López-Olivari et al [
69] reported much lower K
cb mid values, averaging 0.28, which is likely due to water stress as commonly imposed by farmers. Higher K
cb mid values (0.58 ± 0.14) were reported by Cammalleri et al. [
18] for an intensive olive orchard with f
c = 0.35. Er-Raki et al. [
20] also reported a higher K
cb mid of 0.54. Much higher K
cb values were proposed by Allen and Pereira [
43]. The p values are similar to those reported by Er-Raki et al. [
20] and by Rallo et al. [
79].
Results in
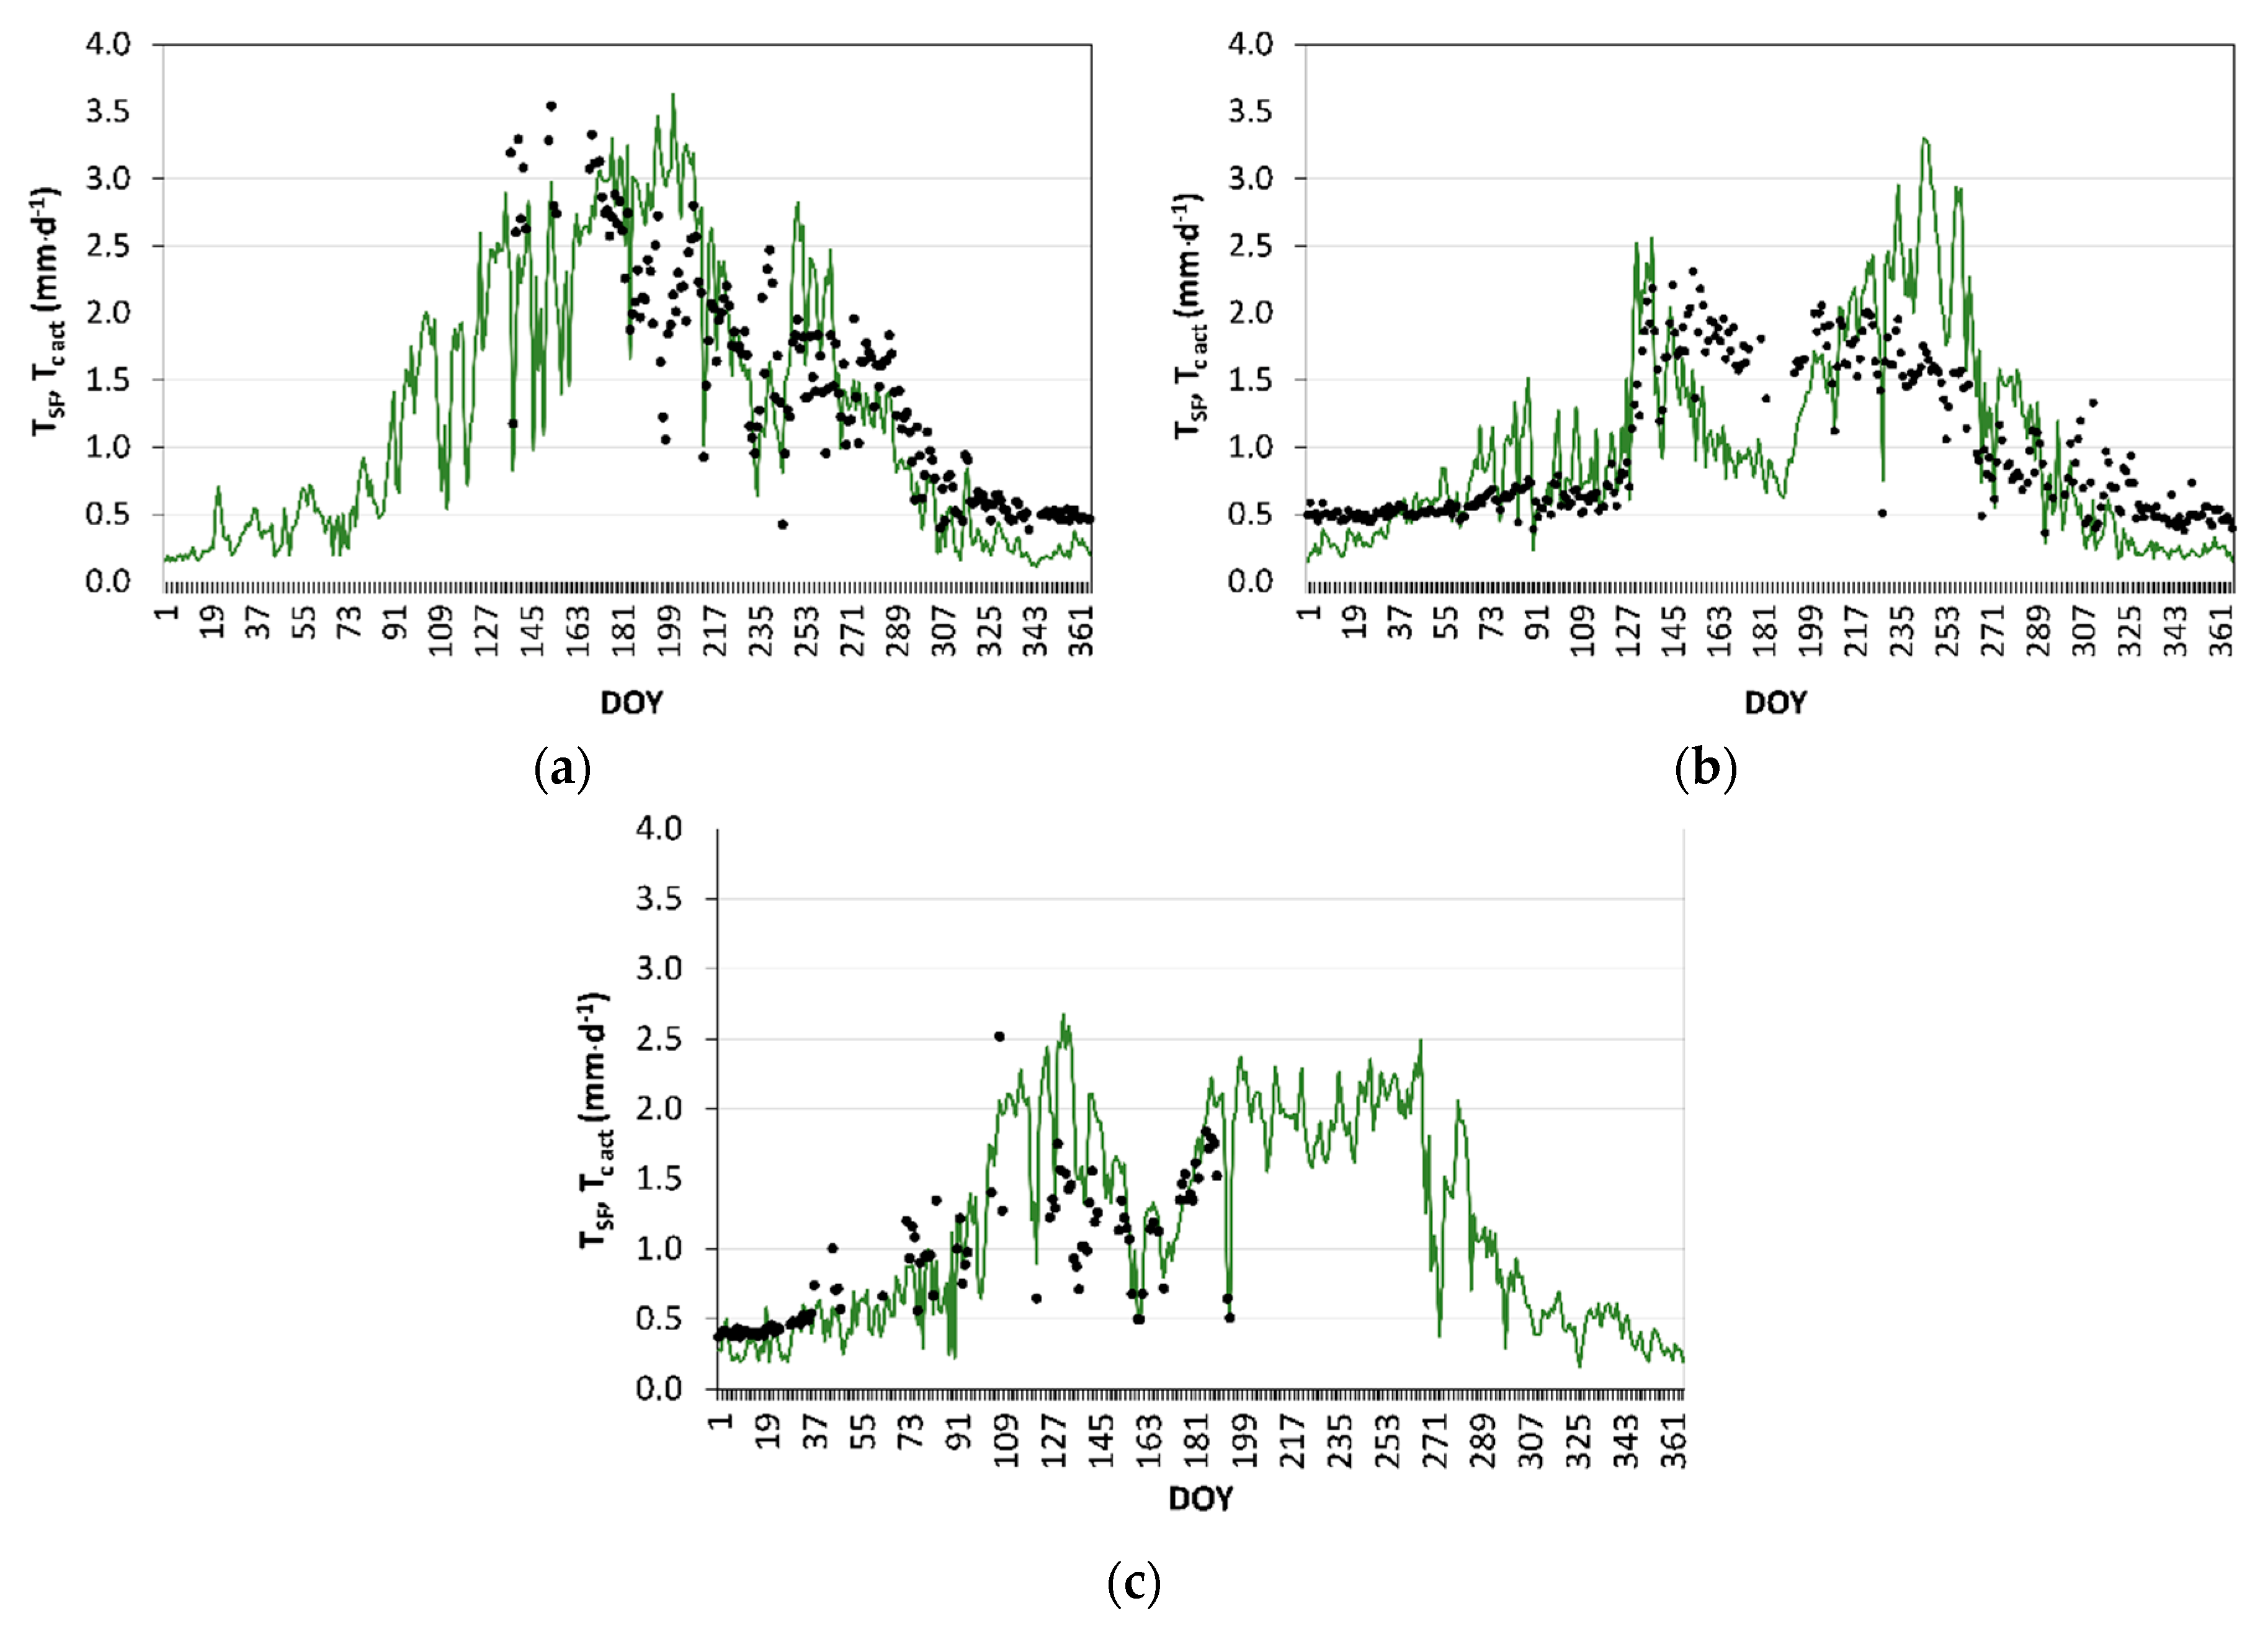
Figure 7, comparing model simulated T
c act with transpiration derived from sap-flow measurements (T
SF), show a good agreement between T
c act and T
SF along the three years of study. The dynamics of both T
c act and T
SF are coherently described for all three years but fitting is less good for 2012 due to the heavy frost and subsequent pruning that occurred by that winter. Apparently, the trees responded well to pruning and that exceptional condition could have justified using specific K
cb and p values but that option was not adopted because validating the model requires using the calibrated parameters. However, despite the peculiar condition occurring in 2012, as well as the uncertainties associated with deriving T
SF, model predicted T
c act described reasonably well the dynamics of transpiration of the olive orchard throughout the three experimental seasons.
The goodness-of-fit indicators (
Table 3) show a slight tendency for the model to over-estimate T
SF, with b
0 = 1.04 and PBIAS = 3.9% in the calibration year; the same trend for over-estimation was observed in 2012 and 2013, with b
0 of 1.03 and 1.17 and PBIAS of 5.2% and 13.3%. The determination coefficients are high for the first and third years, with respectively R
2 = 0.75 and 0.78; due to the problems identified to 2012, it resulted R
2 = 0.60, however reasonably high. These R
2 values indicate, therefore, that a large fraction of the variance of T
SF is explained by the model. Estimation errors are reasonably low, with RMSE ranging from 0.37 to 0.53 mm·d
−1 and AAE ranging from 0.25 to 0.42 mm·d
−1. The modelling efficiency is reasonably high for the calibration year, with EF = 0.57 and acceptable for the validation and testing years. Overall, results for the goodness-of-fit indicators show that the predicted T
c act values were statistically close to the sap-flow observed ones and that most of the variation of the observed values is explained by the model. Higher errors of estimation were reported by Rallo et al. [
79] when using a modification of the FAO56 approach for an intensive olive orchard, with RMSE ranging from 0.30 to 0.78 mm·d
−1. Er-Raki et al. [
20], also reported higher T
c act estimation errors, with RMSE = 0.59 mm·d
−1.
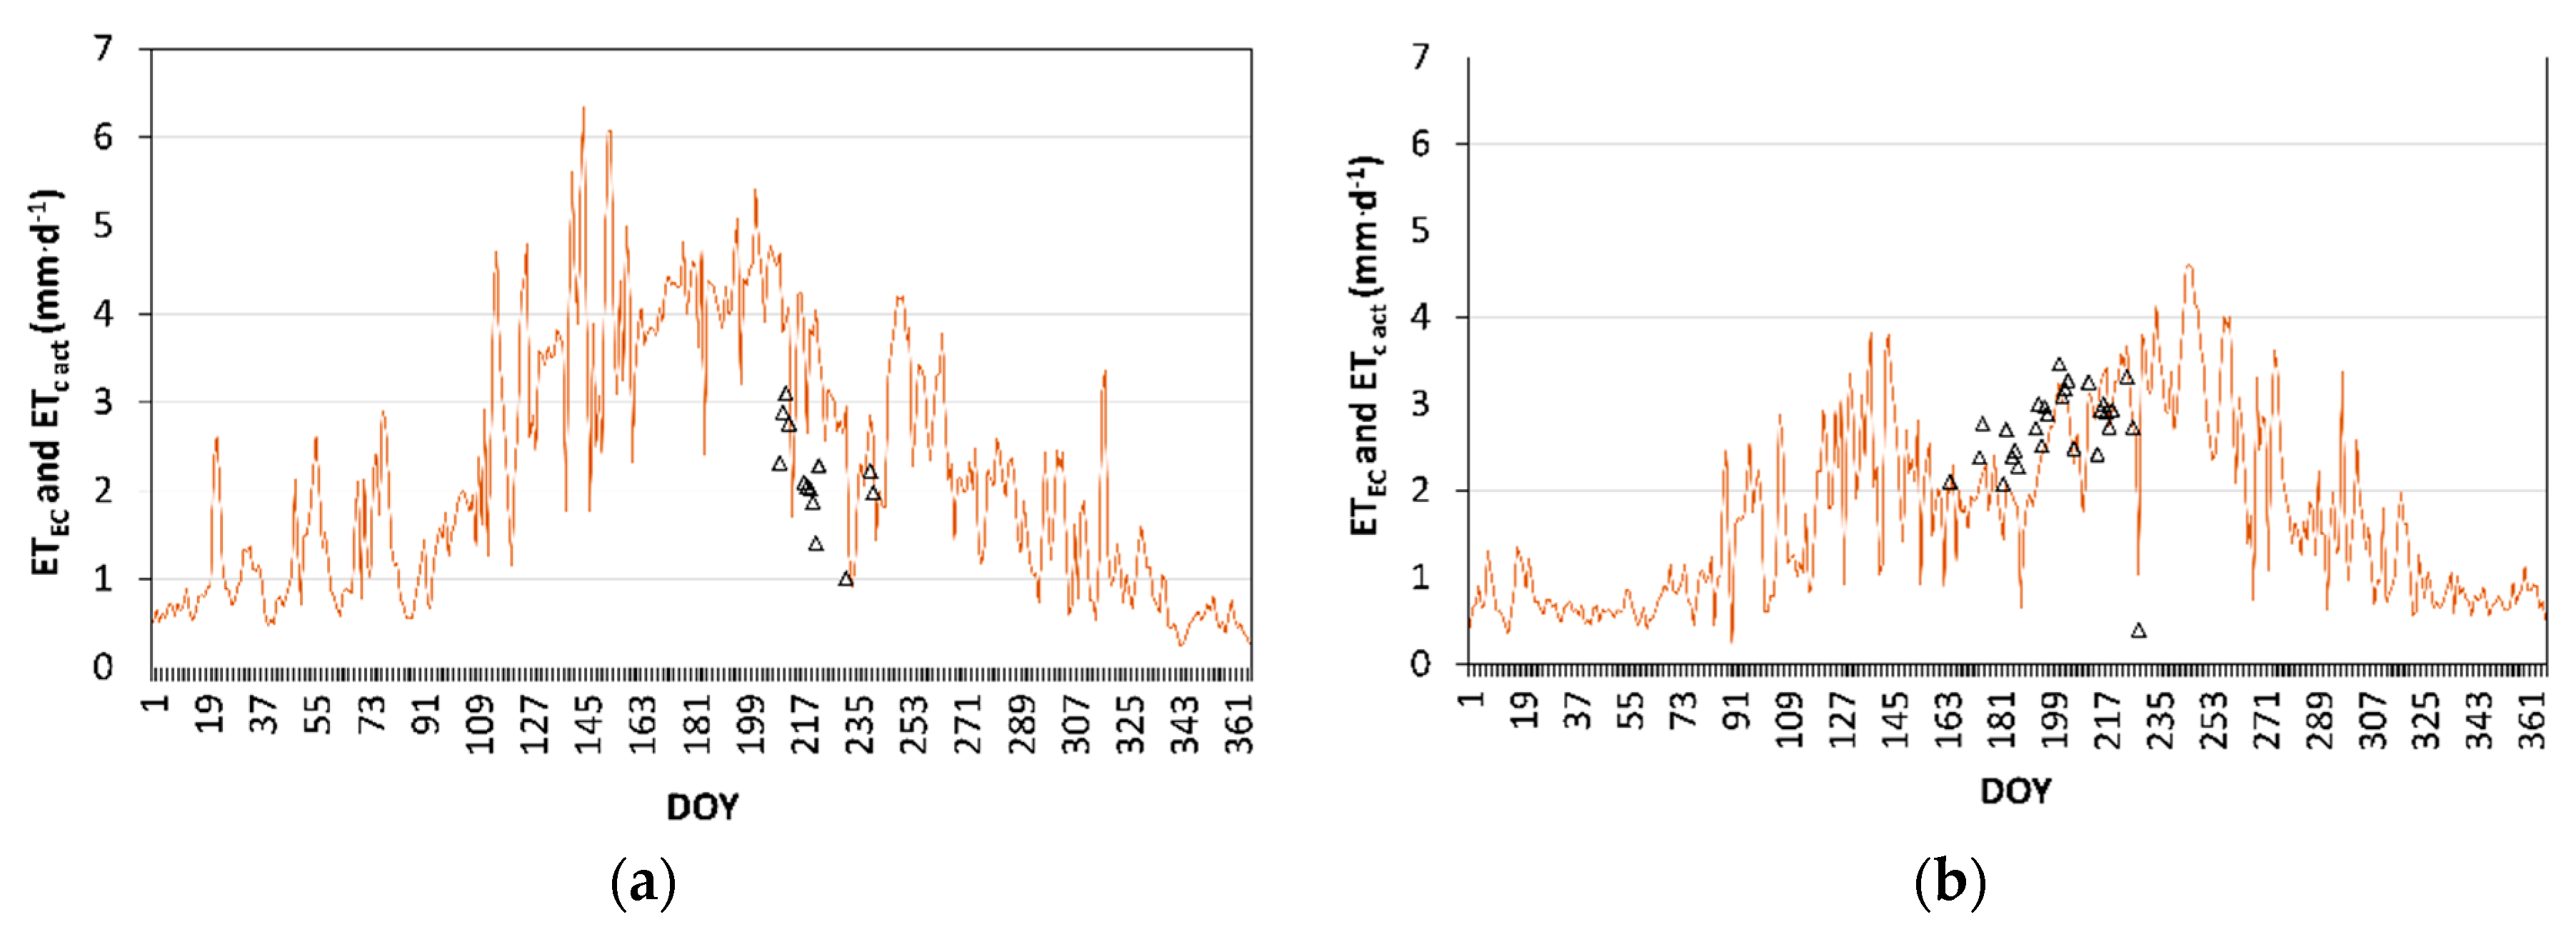
The dynamics of the actual crop evapotranspiration (ET
c act) simulated along 2011 and 2012, which was computed with the calibrated model parameters of
Table 2, is presented in
Figure 8. ET
c act are compared with evapotranspiration values observed with the eddy covariance system (ET
EC). Despite ET
EC observations were in reduced number, they could be used for further validate the model since results show that the model was able to adequately estimate the dynamics of ET
c act during the mid-season stage when ET
EC was measured. The average ET
EC value during this stage was 2.5 mm·d
−1 (±0.41, n = 28). Goodness-of-fit indicators for 2012 show a tendency for the SIMDualKc model to under-estimate ET
EC (b
0 = 0.94 and PBIAS = −6.0%), thus contrary to the tendency observed when T
c act was compared with T
SF. However, given the reduced number of EC observations, it is not possible to draw a conclusion about model trending. An acceptably high R
2 = 0.64 was obtained, which indicates that a large fraction of the variance of ET
EC observations is explained by the model. In addition, acceptable estimation errors of ET
c act were obtained with RMSE = 0.42 mm·d
−1, AAE = 0.35 mm·d
−1 and, consequently, a reasonably good EF value of 0.45 was obtained. Higher estimation errors for ET
c act, ranging from 0.54 to 0.71 mm·d
−1, were reported by Er-Raki et al. [
20].
3.2. Dual and Single Crop Coefficients
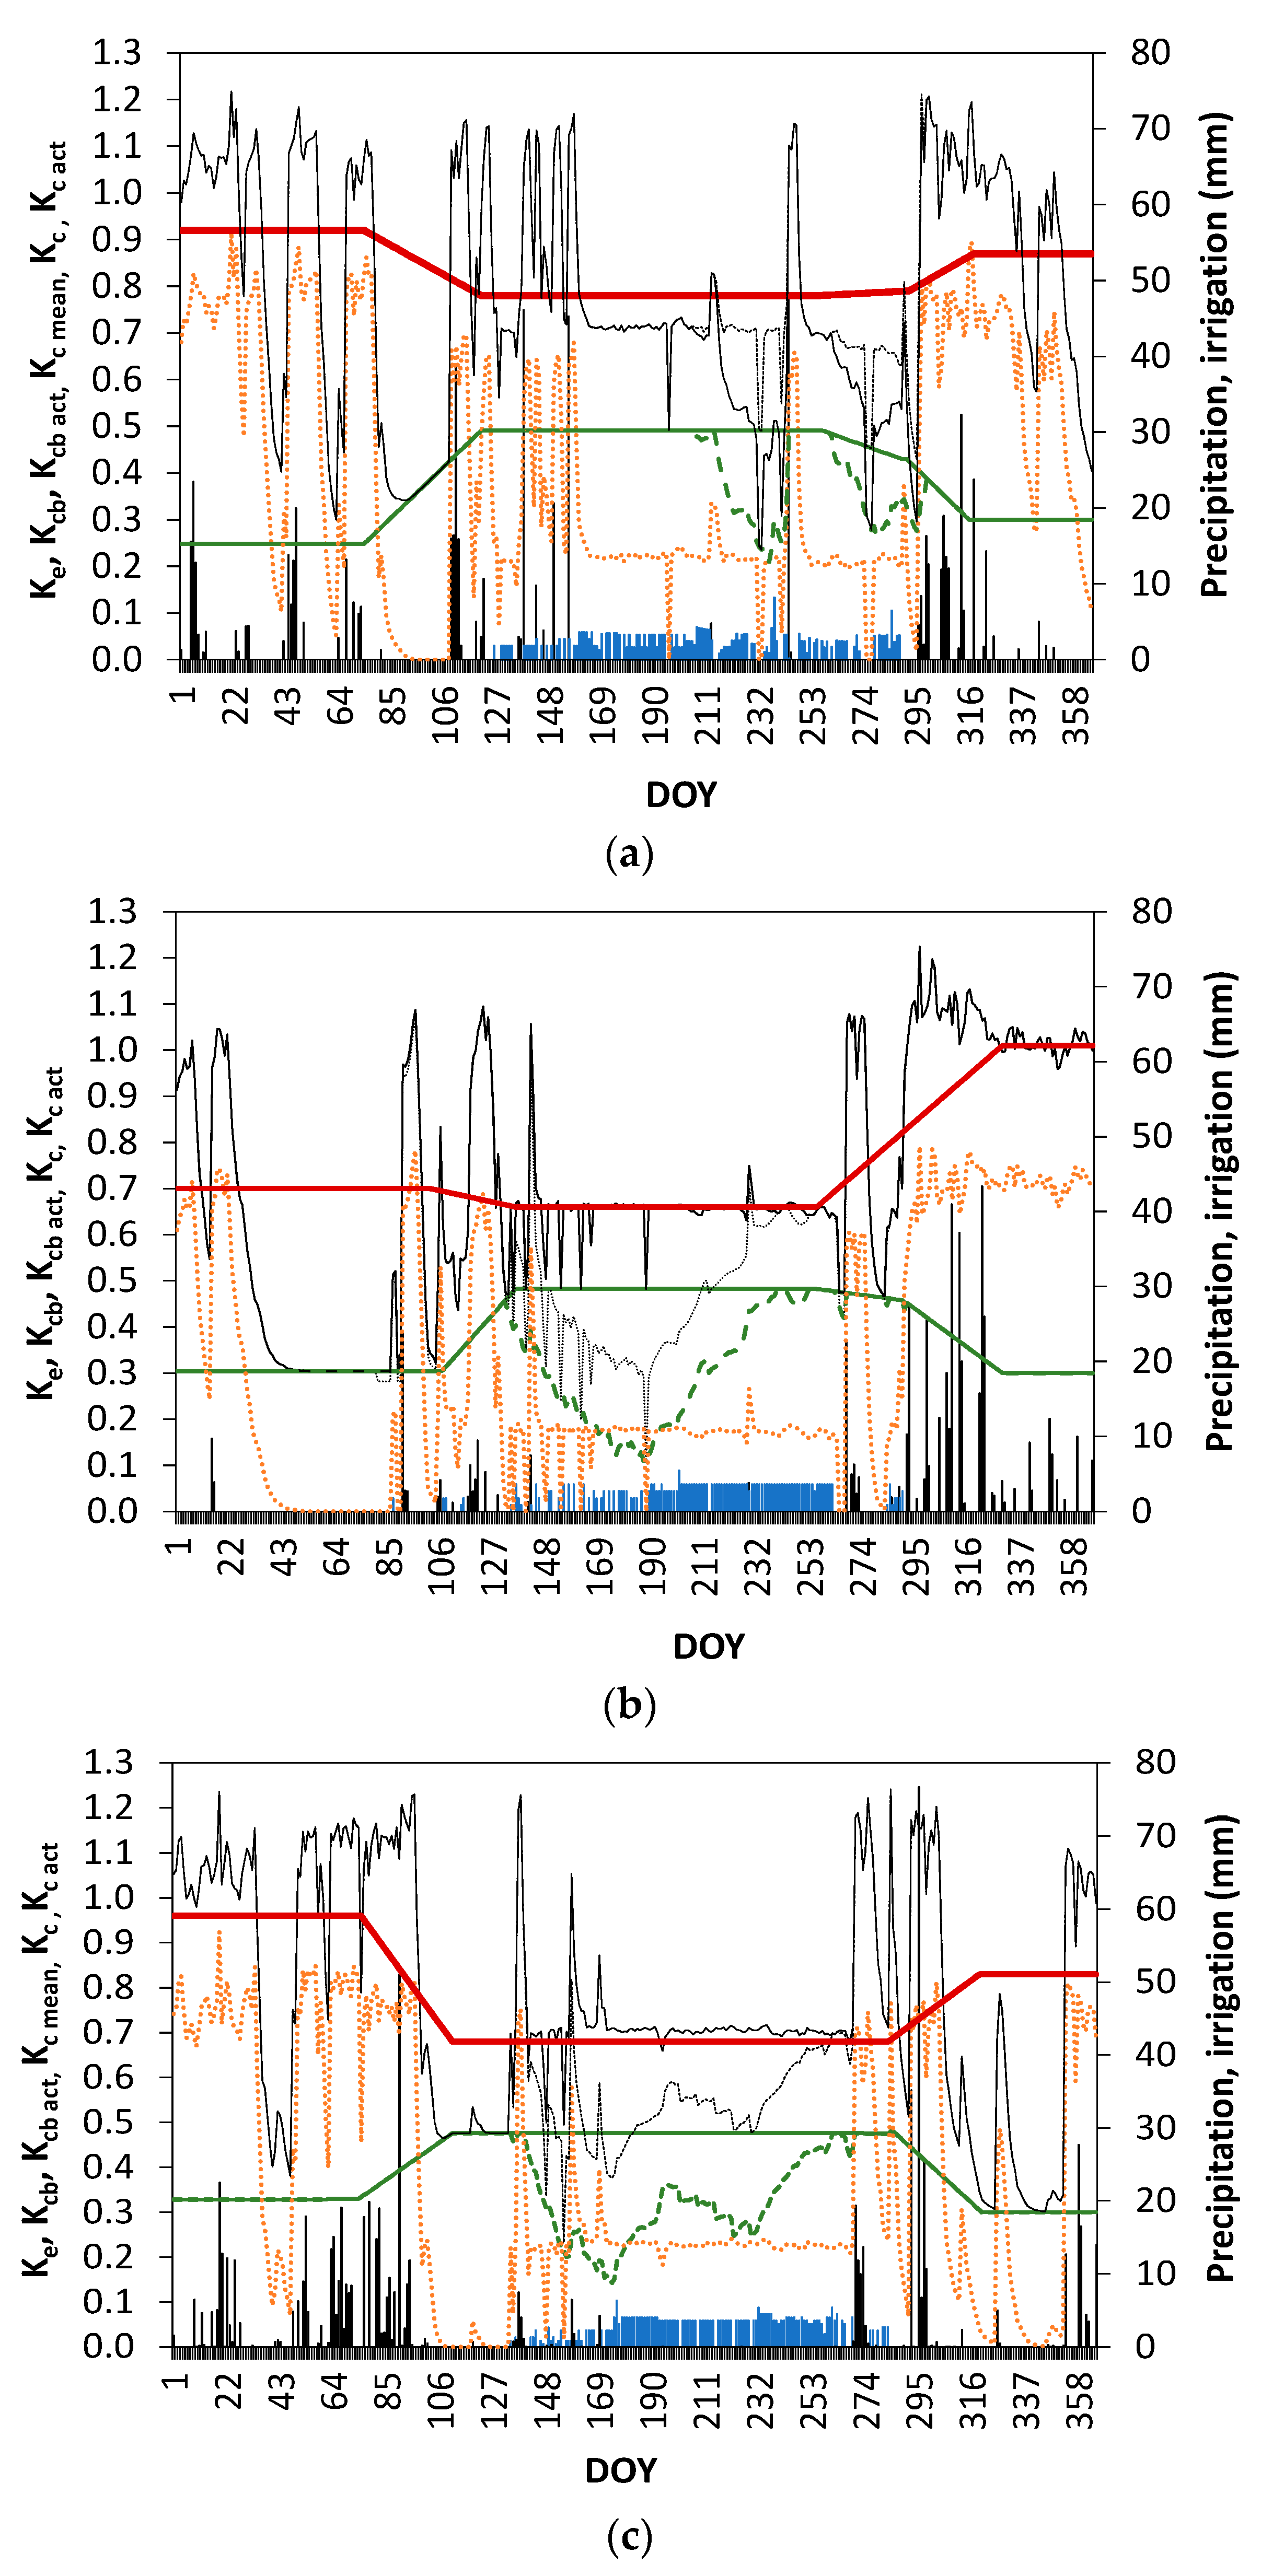
The standard and actual K
cb curves, the K
e curves and the standard and actual single K
c curves derived for the 3-year observed hedgerow olive orchard are shown in
Figure 9. Precipitation and irrigation events are also depicted to easily interpreting the behaviour of the K
e, K
cb and K
c curves. The represented K
cb values were adjusted for climate as a function of wind speed, RH
min and crop height as proposed in FAO56 [
4], so resulting slightly different from those given in
Table 2 as referred before. The time-averaged standard K
c relative to the various crop stages was computed by summing the standard K
cb of the same crop stages with the daily K
e values computed for the same periods, that is, K
c = K
cb + K
e. Differently, K
c act = K
cb act + K
e, thus varying daily.
The K
cb and K
cb act curves (
Figure 9) are coincident during winter and most of autumn and spring periods when rainfall was enough to avoid water stress, that is, when K
cb act = K
cb as discussed about Equation 1. Differently, high water stress occurred during most of the mid-season stage, particularly during 2012 and 2013, when those curves indicated K
cb act < K
cb. This water stress occurred because the orchard was under-irrigated following the common practice of deficit irrigation in olive orchards, in particular because irrigations were started too late in those years. To achieve a eustress irrigation management it would be desirable that irrigation would start earlier in both 2012 and 2013, eventually adopting larger irrigation depths applied every two or three days instead of 3 mm depths every day. However, further studies are required to better defining the best eustress management with consideration of impacts of transpiration deficits on yields.
Soil evaporation K
e curves show to react daily to the soil wetting events, mainly with various peaks occurring in response to rainfall events (
Figure 9). During the rainfall season, from early autumn to early spring, K
e is often high because the inter-row is wide and solar energy is then available at the soil surface. During mid-season soil evaporation decreases and K
e drops because soil dries and residues of the ground cover vegetation act as an organic mulch to limit evaporation. K
e peaks are much small during most of the mid-season stage because irrigation was applied along the row of trees, so under crop shadow, thus resulting in limited energy available for evaporating the irrigation water.
Differently of the time-averaged standard K
c curves, the K
c act curves show numerous peaks in response to the rainfall events (
Figure 9) since these curves represent K
c act = K
cb act + K
e as referred above. The K
c and K
c act curves are coincident in the periods without water stress, thus during the rainy season, roughly from October to May. The standard and actual K
c values during the non-growing periods and the initial stage are highly dependent upon the precipitation amounts. Differently, the K
c act curves lay bellow the K
c curve under water stress conditions during mid-season.
Figure 9 clearly shows the contrasting behaviour of standard K
c and K
cb. The above described dynamics of K
c curves, particularly the dependence of K
c values from soil evaporation, mainly due to soil wettings by precipitation, explains why the time-averaged standard K
c mid is smaller than K
c non-growing and K
c ini, that refer to the rainy season, while the higher standard K
cb values are for the mid-season, K
cb mid, thus when transpiration is higher under irrigation.
The time averaged K
c are presented in
Table 4 for all crop stages of 2011, 2012 and 2013. K
c ini values, ranging 0.70 to 0.96, are in the range of values reported for intensive olive orchards [
43,
80,
81]. The K
c mid values ranged 0.70 to 0.78, which are comparable with values reported by various authors [
18,
43,
81,
82]. K
c values for the late season (0.79 to 0.90) increased relative to the mid-season due to the occurrence of various precipitation events. High K
c end values found in the present study are comparable with those reported by Testi et al. [
80].
3.3. Kcb Predicted with the A&P Approach vs. Kcb Obtained with SIMDualKc
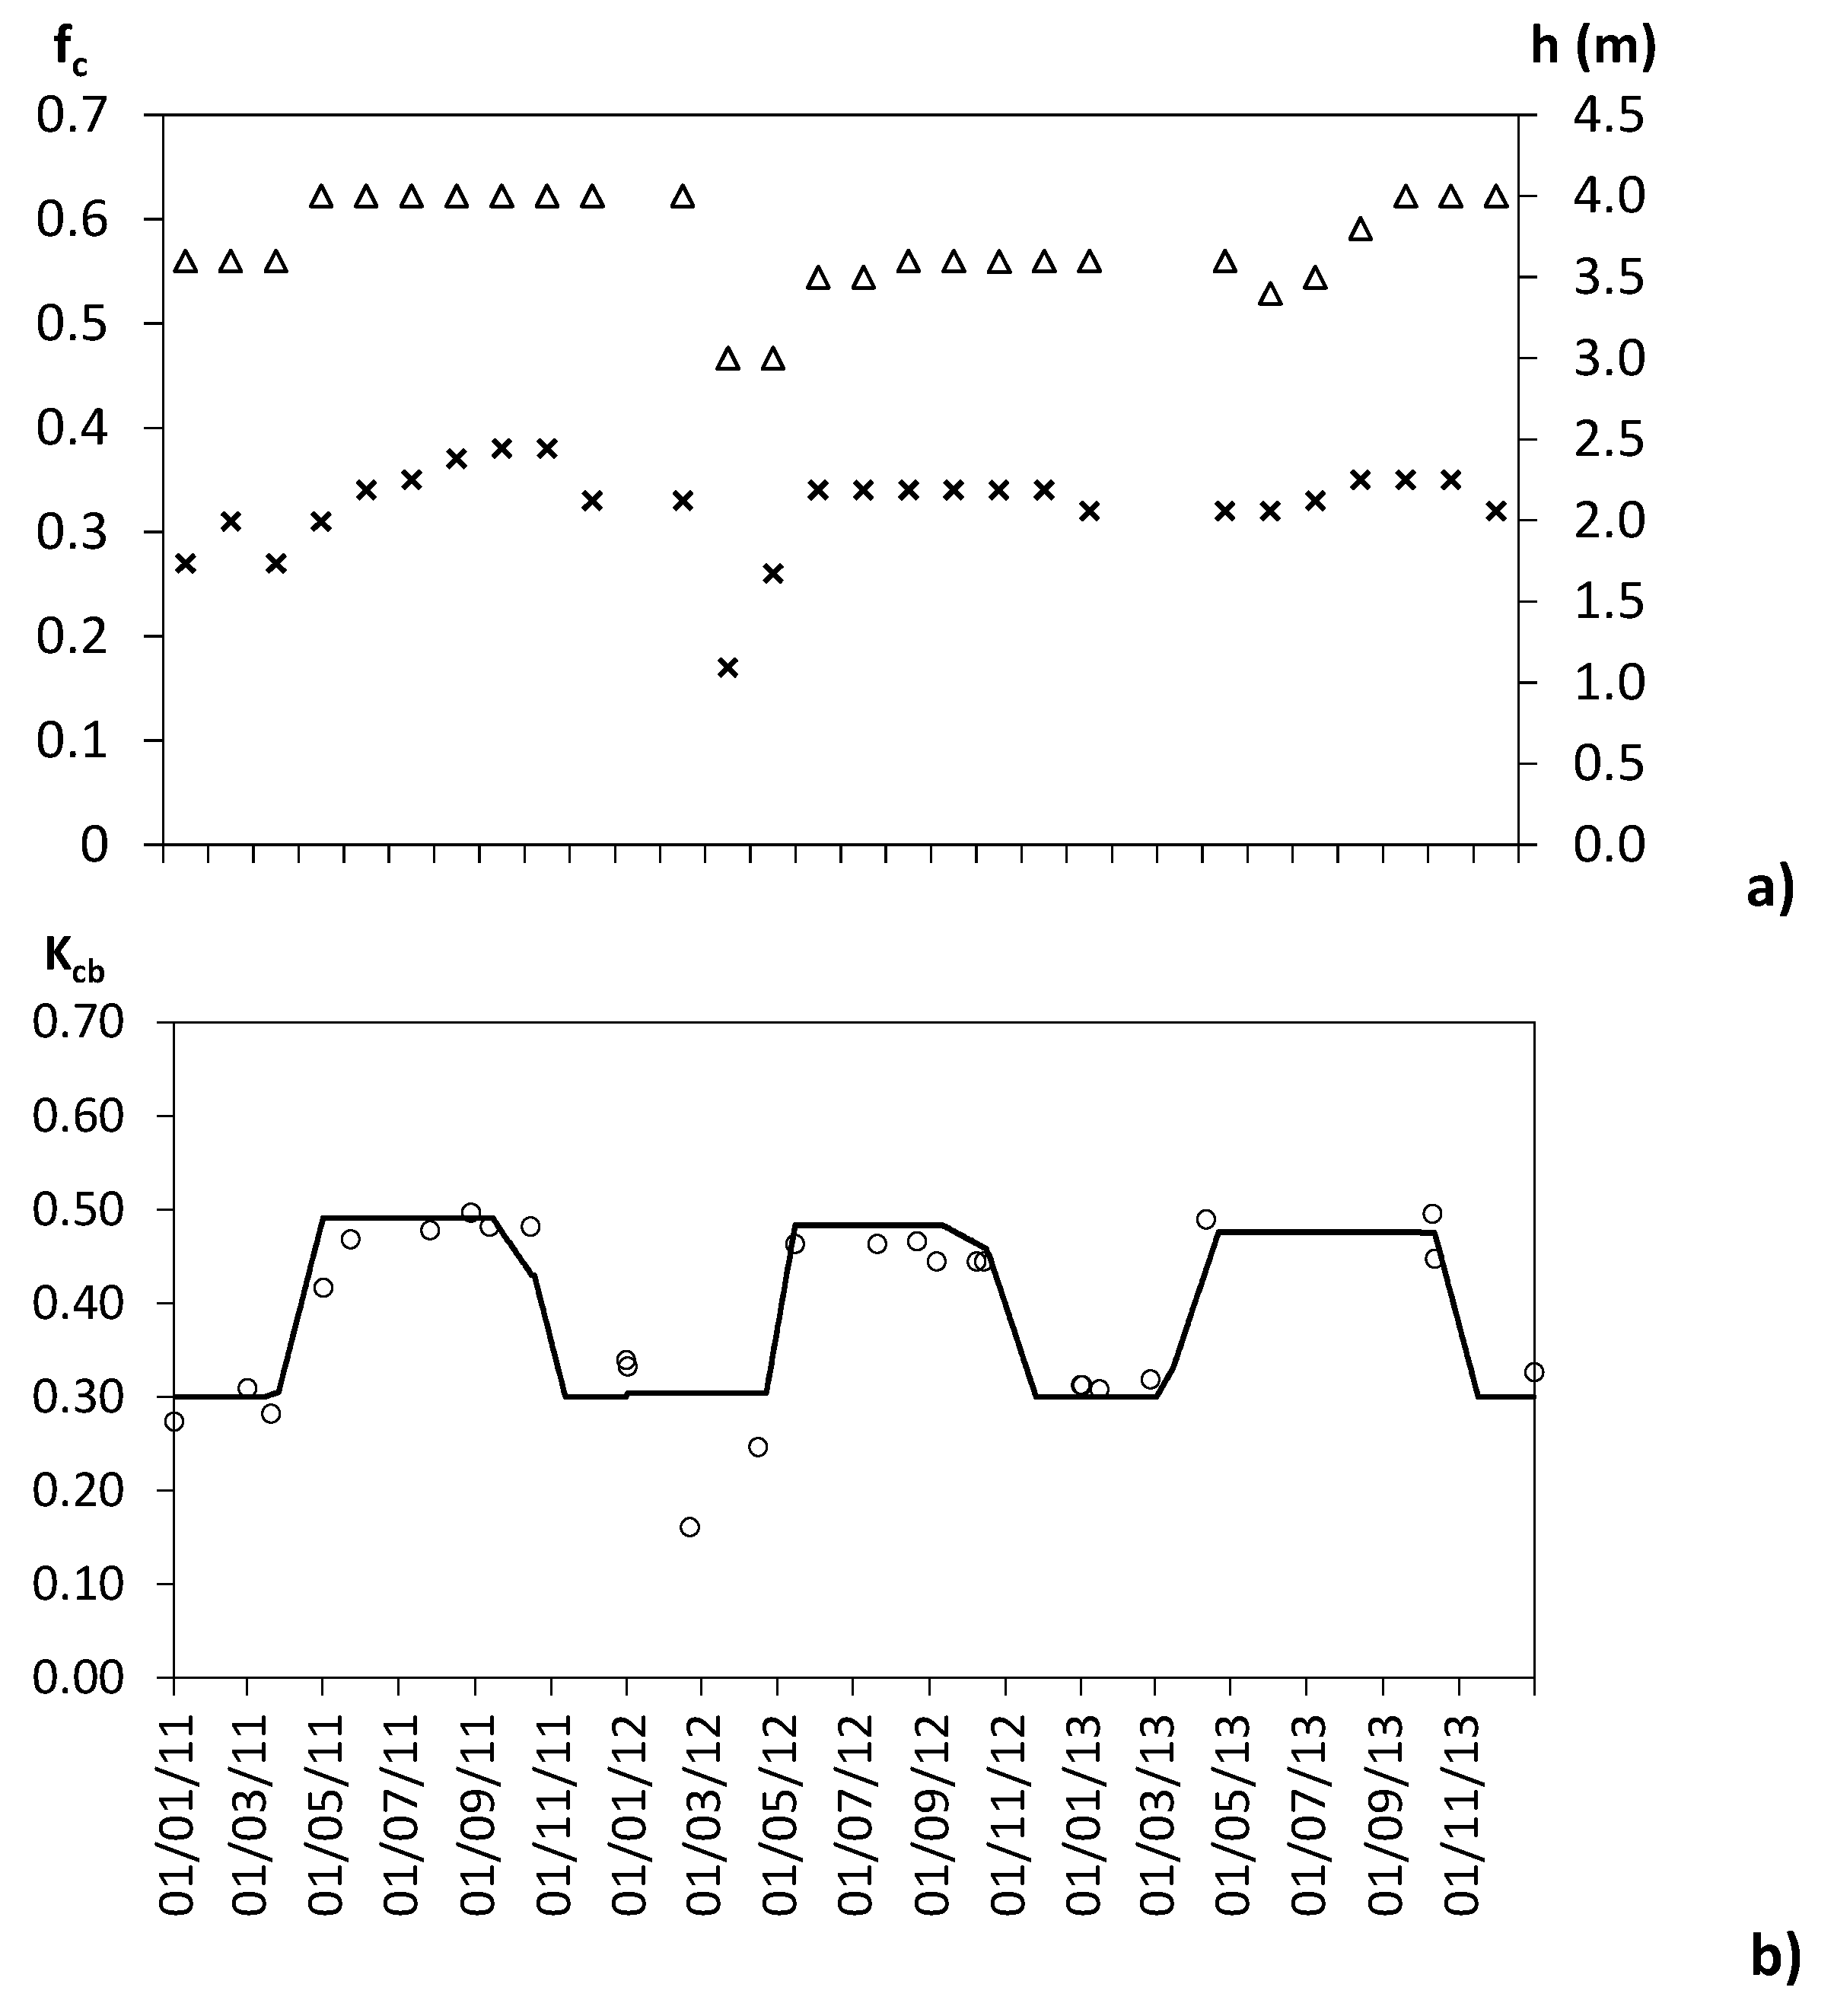
The A&P approach (
Section 2.4, Allen & Pereira [
43]) was applied with f
c and h data observed along the three seasons. The dynamics of f
c and h are presented in
Figure 10a in conjunction with the corresponding computed values for K
cb (K
cb A&P), which are compared with the standard K
cb obtained with SIMDualKc for the same days (K
cb SIMDualKc), resulting a close match (
Figure 10b) except for the cases that follow the heavy frost with great defoliation and severe pruning in the winter of 2012.
When computing the density coefficient K
d (Equation (3)) the value M
L = 1.5 proposed by Allen and Pereira [
43] was used. Nevertheless, because insufficient information on shadowing was available, it was assumed f
c = f
c eff·K
cb full (Equation (5)) was computed with observed weather data for the various crop stages and considering the observed crop height. The F
r values were obtained after applying a simple trial and error procedure against the values obtained by the model. That trial and error procedure was initiated with the value F
r = 0.48 proposed by Allen and Pereira [
43] for the entire season and olive orchards without ground cover but just with residues of old leaves. The resulting value for the non-growing and the initial stages was F
r = 0.49, thus about the same as the proposed one, while values for both the mid- and late-season were respectively 0.55 and 0.53. These slightly higher values of F
r were likely due to the fact that less stomatal control was required by Arbequina olives under irrigation. Nevertheless, the estimated F
r = 0.48 proposed by Allen and Pereira [
43] would also provide for quite good K
cb estimations.
For the period from November to April, Kcb were computed from Kd with Equation 4b relative to the case when active ground cover exists. A variable Kcb cover, from 0.004 to 0.01, was used. For May to October, the Equation 4a was used with Kc min = 0.15
Results in
Figure 10b show that K
cb computed with the A&P approach match quite well the K
cb SIMDualKc except for the cases that follow the heavy frost that occurred in the winter of 2012, which produced a great defoliation and required a severe pruning. Consequently, K
cb A&P were then smaller than the K
cb non-growing obtained with SIMDualKc. For all other cases, K
cb A&P values were close to the K
cb SIMDualKc estimates.
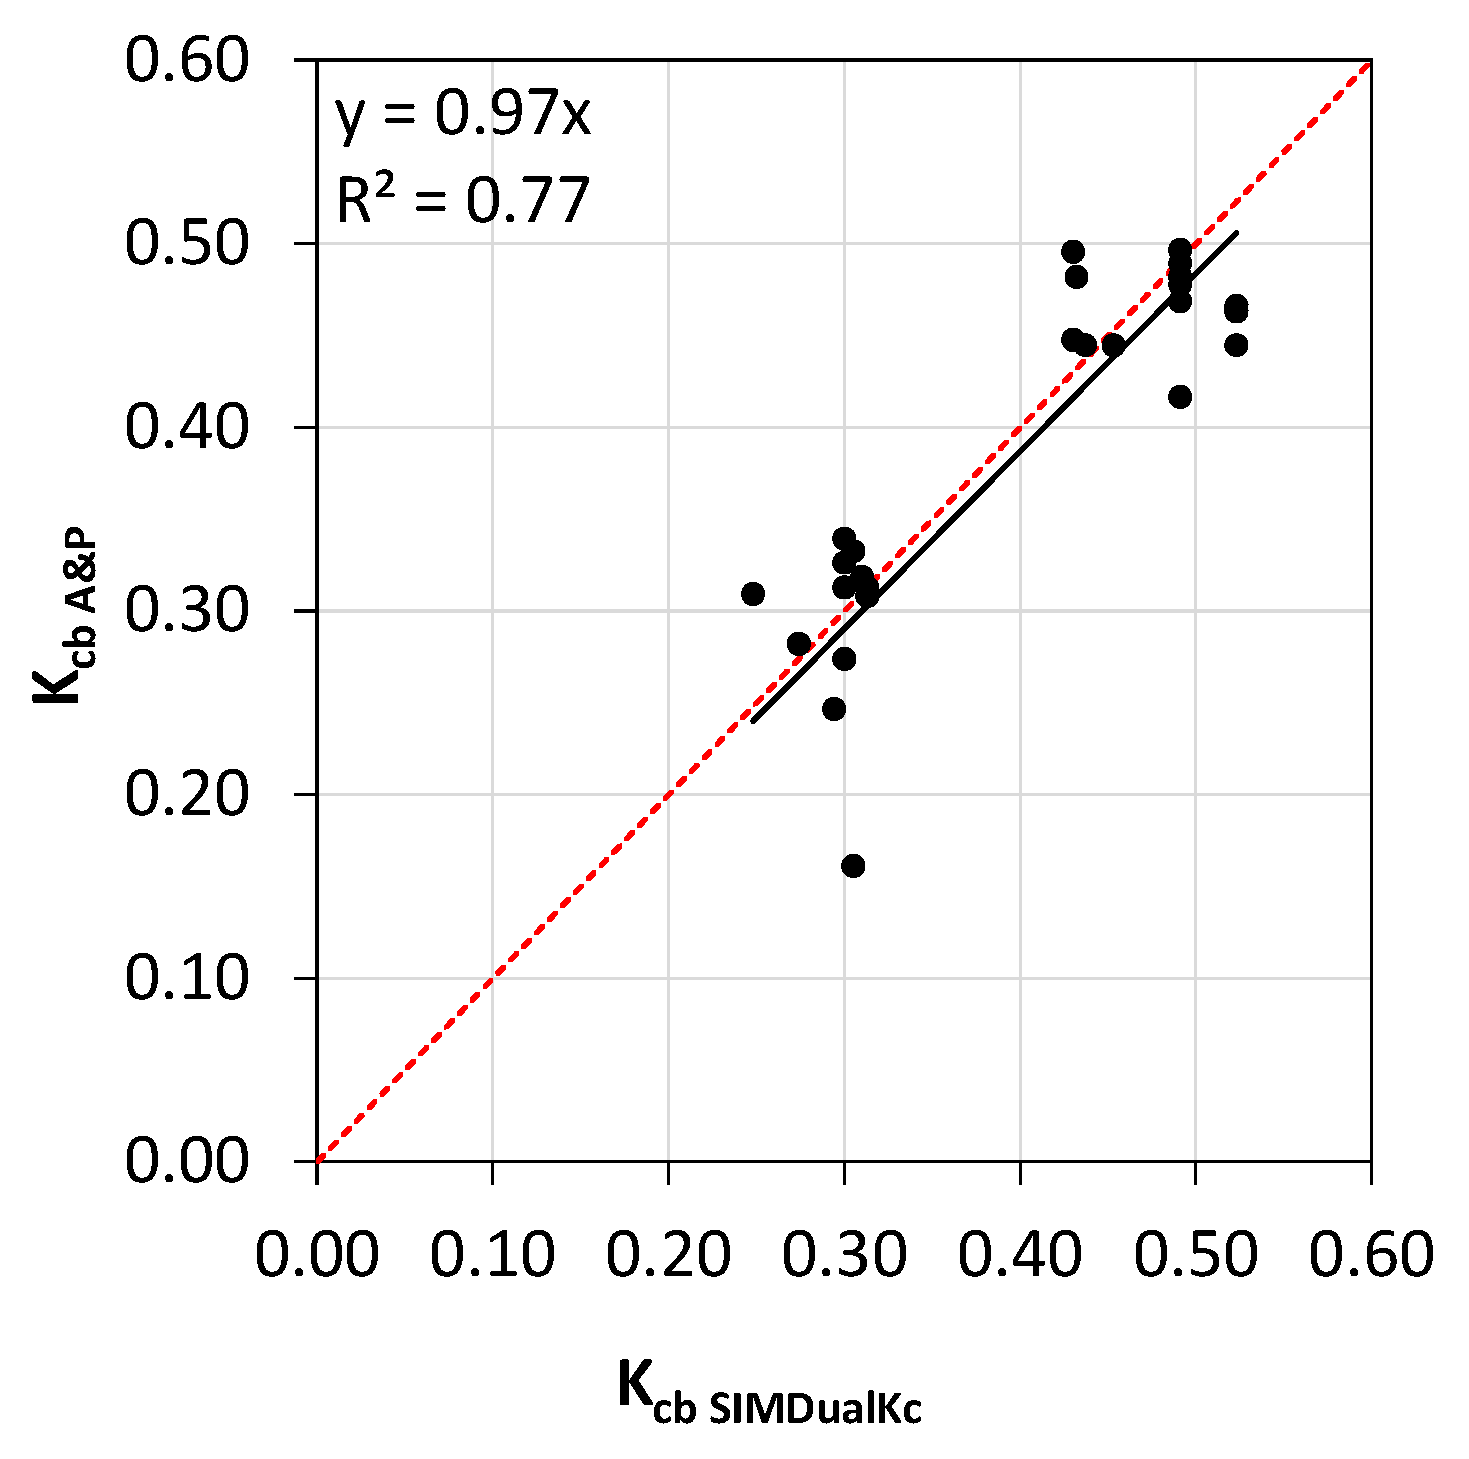
The regression coefficient relating both K
cb sets (
Figure 11) results close to the unit (b
0 = 0.97), thus indicating a good overall match, while the determination coefficient is high (R
2 = 0.77). The estimation of K
cb A&P approach has a small RMSE of 0.05 relative to the modelled K
cb SIMDualKc values. Comparing the mean square error of K
cb A&P with the variance of the K
cb SIMDualKc values it resulted a high EF of 0.76. In conclusion, results of comparing both sets of K
cb values indicate that the A&P approach is adequate for estimating K
cb values to be used when assessing crop water requirements for olives and to support irrigation management decision making.
3.4. Water Balance and Respective Components
The terms of the soil water balance computed with the SIMDualKc model are presented in
Table 5. There are appreciable differences among years which mainly steam from the differences in precipitation (P, mm). This is particularly the case of deep percolation and runoff (DP and RO, mm), which are much higher in the wet year of 2013, representing 47% of precipitation, which contrast with smaller DP and RO values in 2011 that represent 34% of the precipitation total. Those percent values indicate that most of precipitation, 53 to 66%, was used by the crop. As it could be expected, the larger amount of DP and RO occurred during the non-growing, initial, crop development and late season crop stages, that is, during the rainy season, which coincides with the period when crop water demand, evapotranspiration, is smaller as analysed relative to
Figure 7 and
Figure 9. However, the distribution of DP and RO throughout the year varied enormously as a consequence of the inter- and intra-annual variability of the precipitation, as it may be noticed in
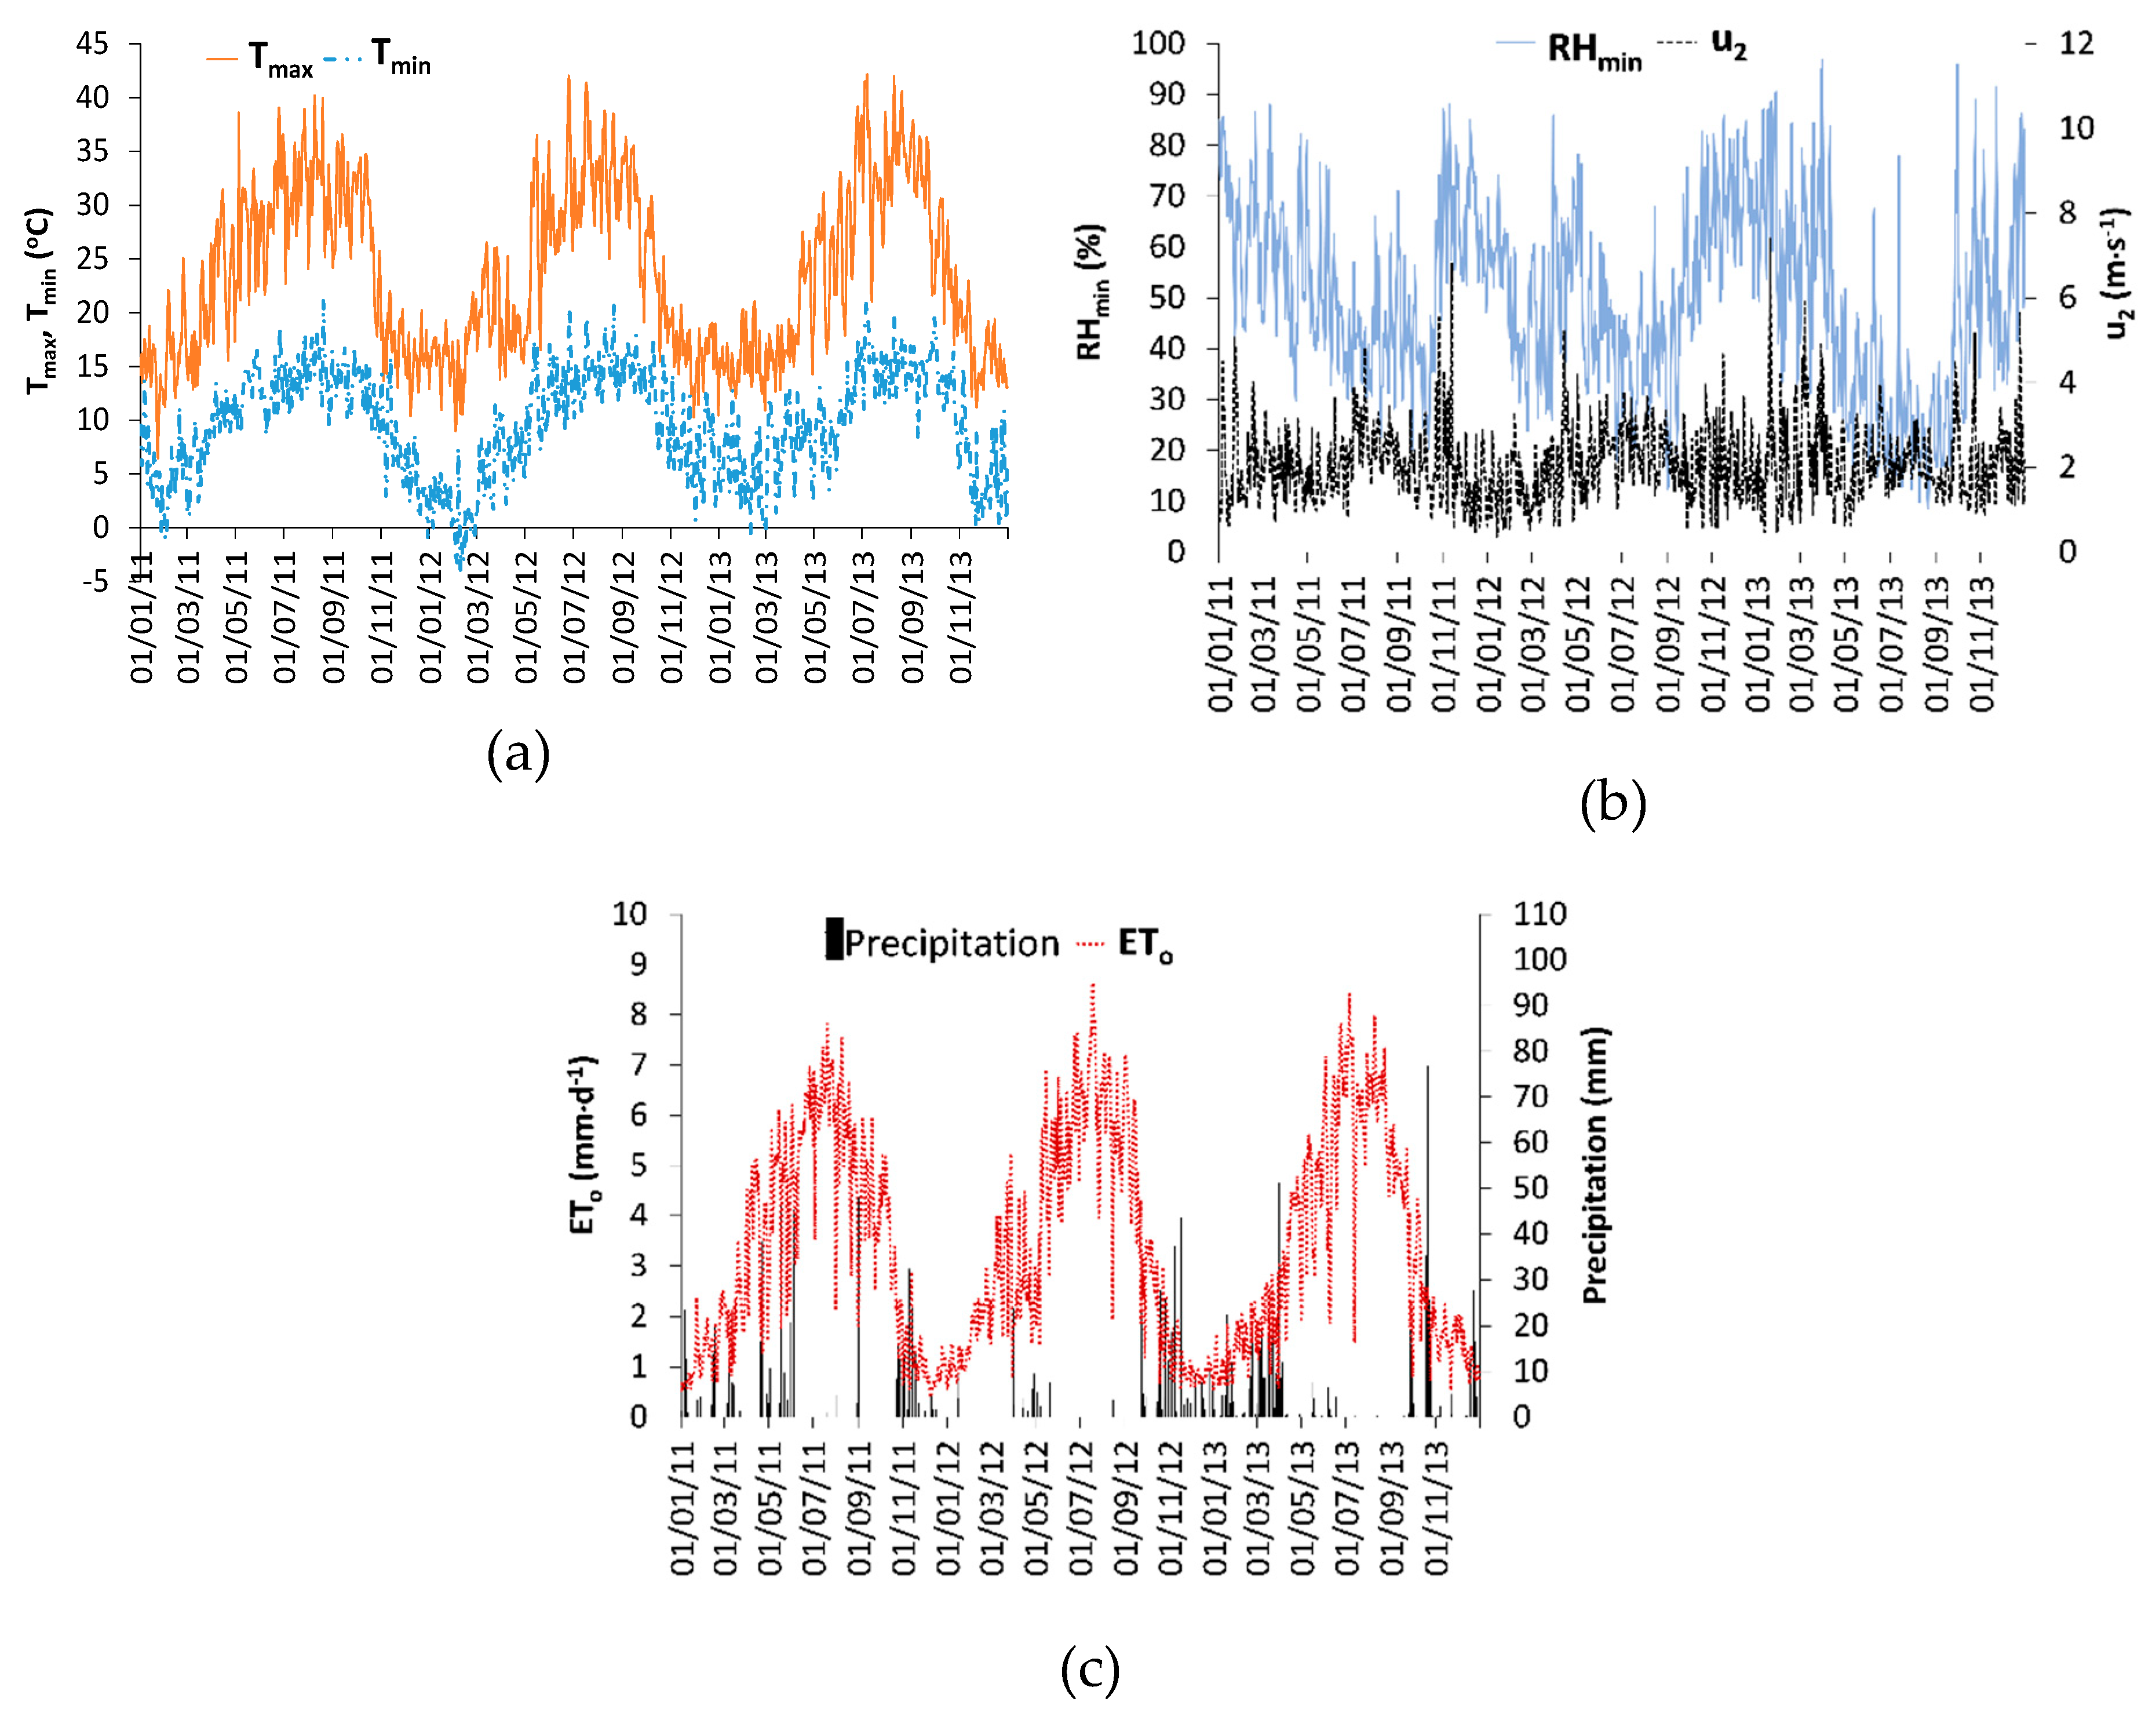
Figure 1. DP and RO were very small during the mid-season and their occurrence refers only to a few rainfall events. The use of small drip irrigation applied depths makes that DP and RO are not originated by irrigation; moreover, the deficit irrigation management adopted also, likely, did not influence DP or RO occurrences.
The soil water storage (ΔSW, mm) at end of each crop stage and of the year greatly varied inter and intra-annually, mostly due to the referred variability of precipitation and likely less influenced by irrigation management as indicated by similar ΔSW values at end of the late season. This fact agrees with the conclusion that the adopted deficit irrigation management did not contribute to operational water losses.
Because rainfall was very small during the periods of large crop water demand, irrigation represented 39%, 56% and 50% of ETc act respectively in 2011, 2012 and 2013. Overall, irrigation occurred during the mid- and late season, mainly the former. These results show the great contribution of irrigation to achieve successful olives growth and yields, particularly in case of super-intensive olives orchards. Naturally, most of evapotranspiration occurred during the mid-season and, however less important, during the late-season. Soil evaporation exceeded transpiration during the non-growing and initial crop stages because Es mostly originated from the inter-row when wetted by rainfall. The large values of Es estimated for the mid-season were mostly due to rainfall events that occurred early in that season; similarly, most of Es estimated for the late season also were due to rainfall events wetting the exposed inter-row. Es originated from irrigation was reduced because energy available under the canopy shadow was little.
The consumptive use of water is analysed in
Table 6. The ratios of E
s/ET
c act show that E
s represents 45 to 67% of ET
c act during the non-growing stage and 40 to 70% during the initial crop stage. These periods are those when more precipitation occurs, so where the soil is frequently wetted by rain and soil cover is less, particularly in the inter-row. Thus, soil evaporation is the main consumptive water use during those stages. During the crop development, mid-season and late season stages, transpiration becomes the most important, corresponding to 52 to 67% of ET
c act. The variability of the ratio E
s/ET
c act is then quite small, depending upon the occurrence of precipitation, which is the main source of soil wetting in the inter-row and of the subsequent evaporation. E
s could likely be reduce if less frequent but larger irrigation amounts would be used instead of daily irrigation events averaging 3 mm per event. E
s/ET
c act ratios smaller than those computed in this study were reported by various researchers but referring to the irrigation season only [
18,
20,
69]. Less frequent irrigations are also referred in these studies.
Results relative to the ratio ET
c act/ET
c (
Table 6) show that ET
c act was smaller by 3%, 18% and 14% relative to the potential ET
c in 2011, 2012 and 2013, respectively. During the mid-season, that ratio ET
c act/ET
c was small for the years of 2012 and 2013, when ET
c act was smaller by respectively 30% and 22% comparatively to the potential ET
c. Those decreases are likely excessive as analysed before (
Figure 9) and may have affected yields, namely that of 2012. Adopting eustress irrigation, the ratio ET
c act/ET
c should likely not decrease below 90%. However, this threshold needs to be better assessed in terms of yield and economic impacts.
