1. Introduction
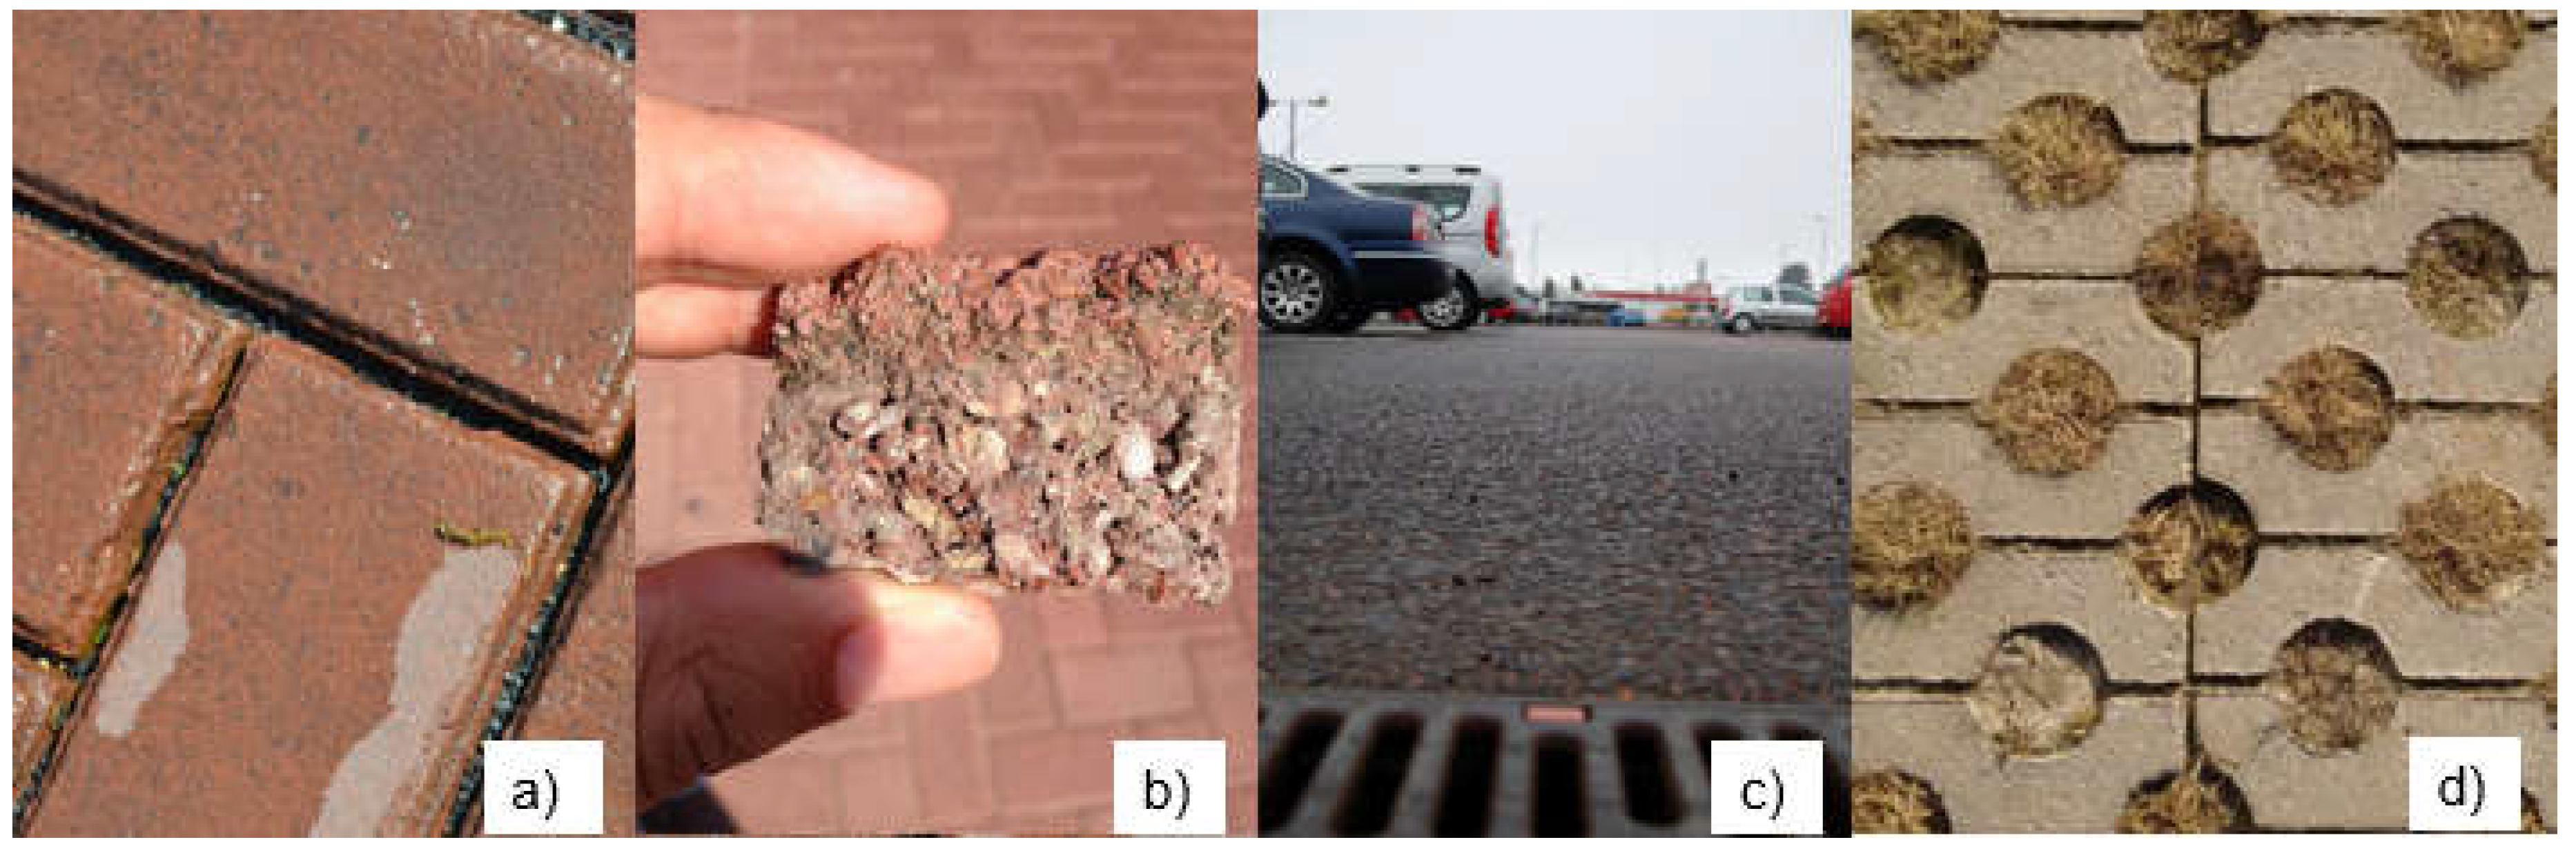
A range of different permeable (or porous) pavements are used around the world to infiltrate and treat stormwater runoff. There are several types of permeable pavements, including concrete pavers with wide joints or apertures (
Figure 1a) and porous concrete pavers, either with or without wide joints (
Figure 1b). These are usually manufactured as blocks and are generally referred to as permeable concrete interlocking pavers (PCIPs). Porous asphalt (
Figure 1c) is another type of pavement which can be used on highways and parking lots. Concrete and plastic grid pavers (CGPs and PGPs) are also often used in some parts of Europe and other countries. The design and function of CGPs and PGPs are similar to that of PCIPs. Stormwater can infiltrate through the openings and gaps in these pavers, which are usually filled with gravel or topsoil planted with grass (
Figure 1d).
Permeable pavements are specifically designed to promote the infiltration of stormwater through the paving and basecourses, where it is filtered through the various layers (
Figure 2). This can help reduce runoff volumes and discharge rates from paved surfaces and help reduce the risk of downstream flooding. Permeable pavements can also provide considerable water quality improvements by treating and trapping stormwater pollutants and preventing them from reaching downstream receiving waters.
Research has shown that urban stormwater runoff can contain significant concentrations of suspended sediments and gross pollutants [
1,
2,
3]. However, over time, this can lead to clogging of the pavement surface if it is not maintained. Clogging is a result of fine, organic matter, and traffic-caused abraded particles, blocking the gaps and surfaces of permeable pavement systems, due to physical, biological, and chemical processes. This clogging decreases the porosity/permeability of the paving surface and, hence, the infiltration rate and the effectiveness of the system.
Permeable pavements have been used in the Netherlands for approximately 25 years to treat stormwater runoff and to help recharge water tables in low-permeability soils.
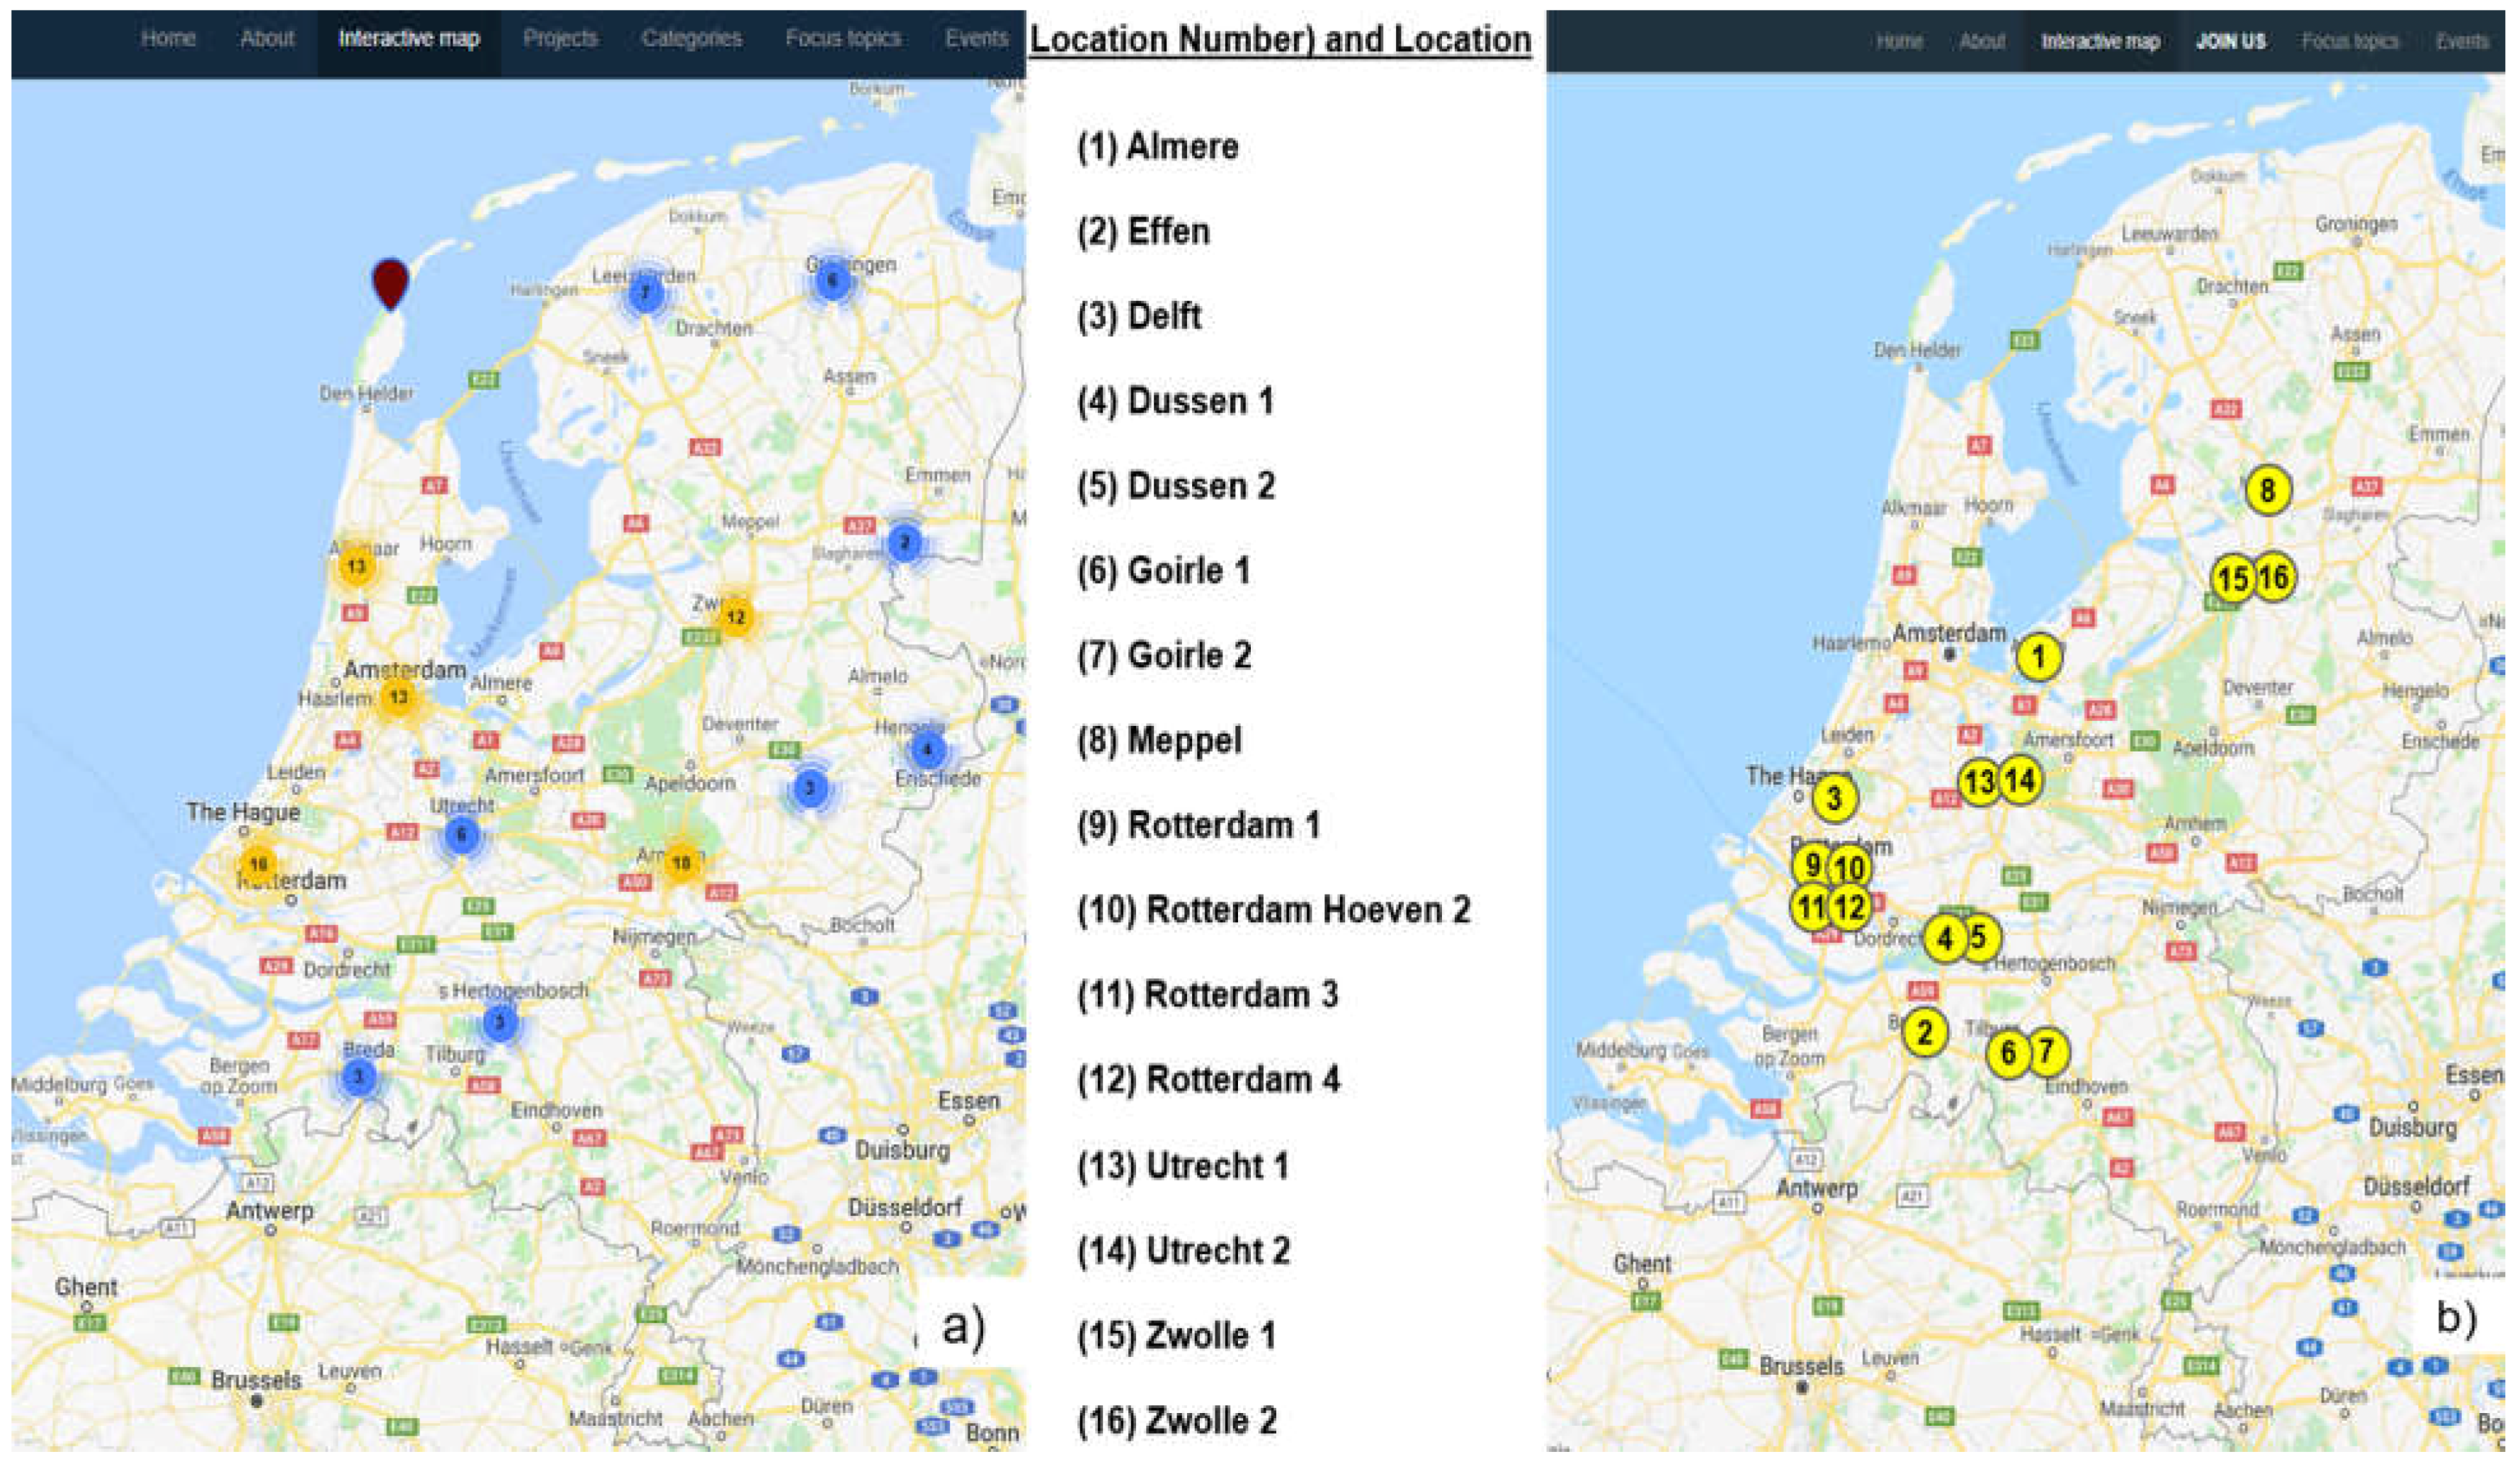
Figure 3a shows 118 locations where permeable pavement have been installed in The Netherlands [
4] and
Figure 3b shows the locations of the 16 permeable pavement installations evaluated in this study. Many of the permeable pavement installations are in the low-lying parts of the Netherlands. The Netherlands, therefore, offers a unique “worse case” situation for evaluation of permeable pavement systems with high groundwater tables and low-permeability soils.
Many of the Dutch permeable pavement installations shown in
Figure 3a were installed many years ago. This provides an opportunity to evaluate the long-term effectiveness of these systems under this “worse case” scenario. It is important for stormwater managers to know if these permeable pavement systems are still operating satisfactorily and have sufficient infiltration capacity after many years in service, or whether they may need maintenance or replacement. The 16 sites tested and the results from this study are shared on the open source website:
www.climatescan.nl [
4].
Measuring infiltration rates accurately in the field is not easy to do and a variety of infiltration test procedures have been utilised in the past. However, the results have generally been inconsistent, and have shown a large variation in the range of infiltration rates measured. Currently, there is no single standard agreed method for measuring the surface infiltration through permeable pavements.
Numerous studies have tried to successfully measure the surface infiltration rate of permeable pavement systems [
2,
5,
6]. This has generally been done by measuring the infiltration rate of water through a particular section of the pavement surface. While a variety of infiltration test procedures have been used, most are based on some type of modified single- or double-ring infiltrometer test.
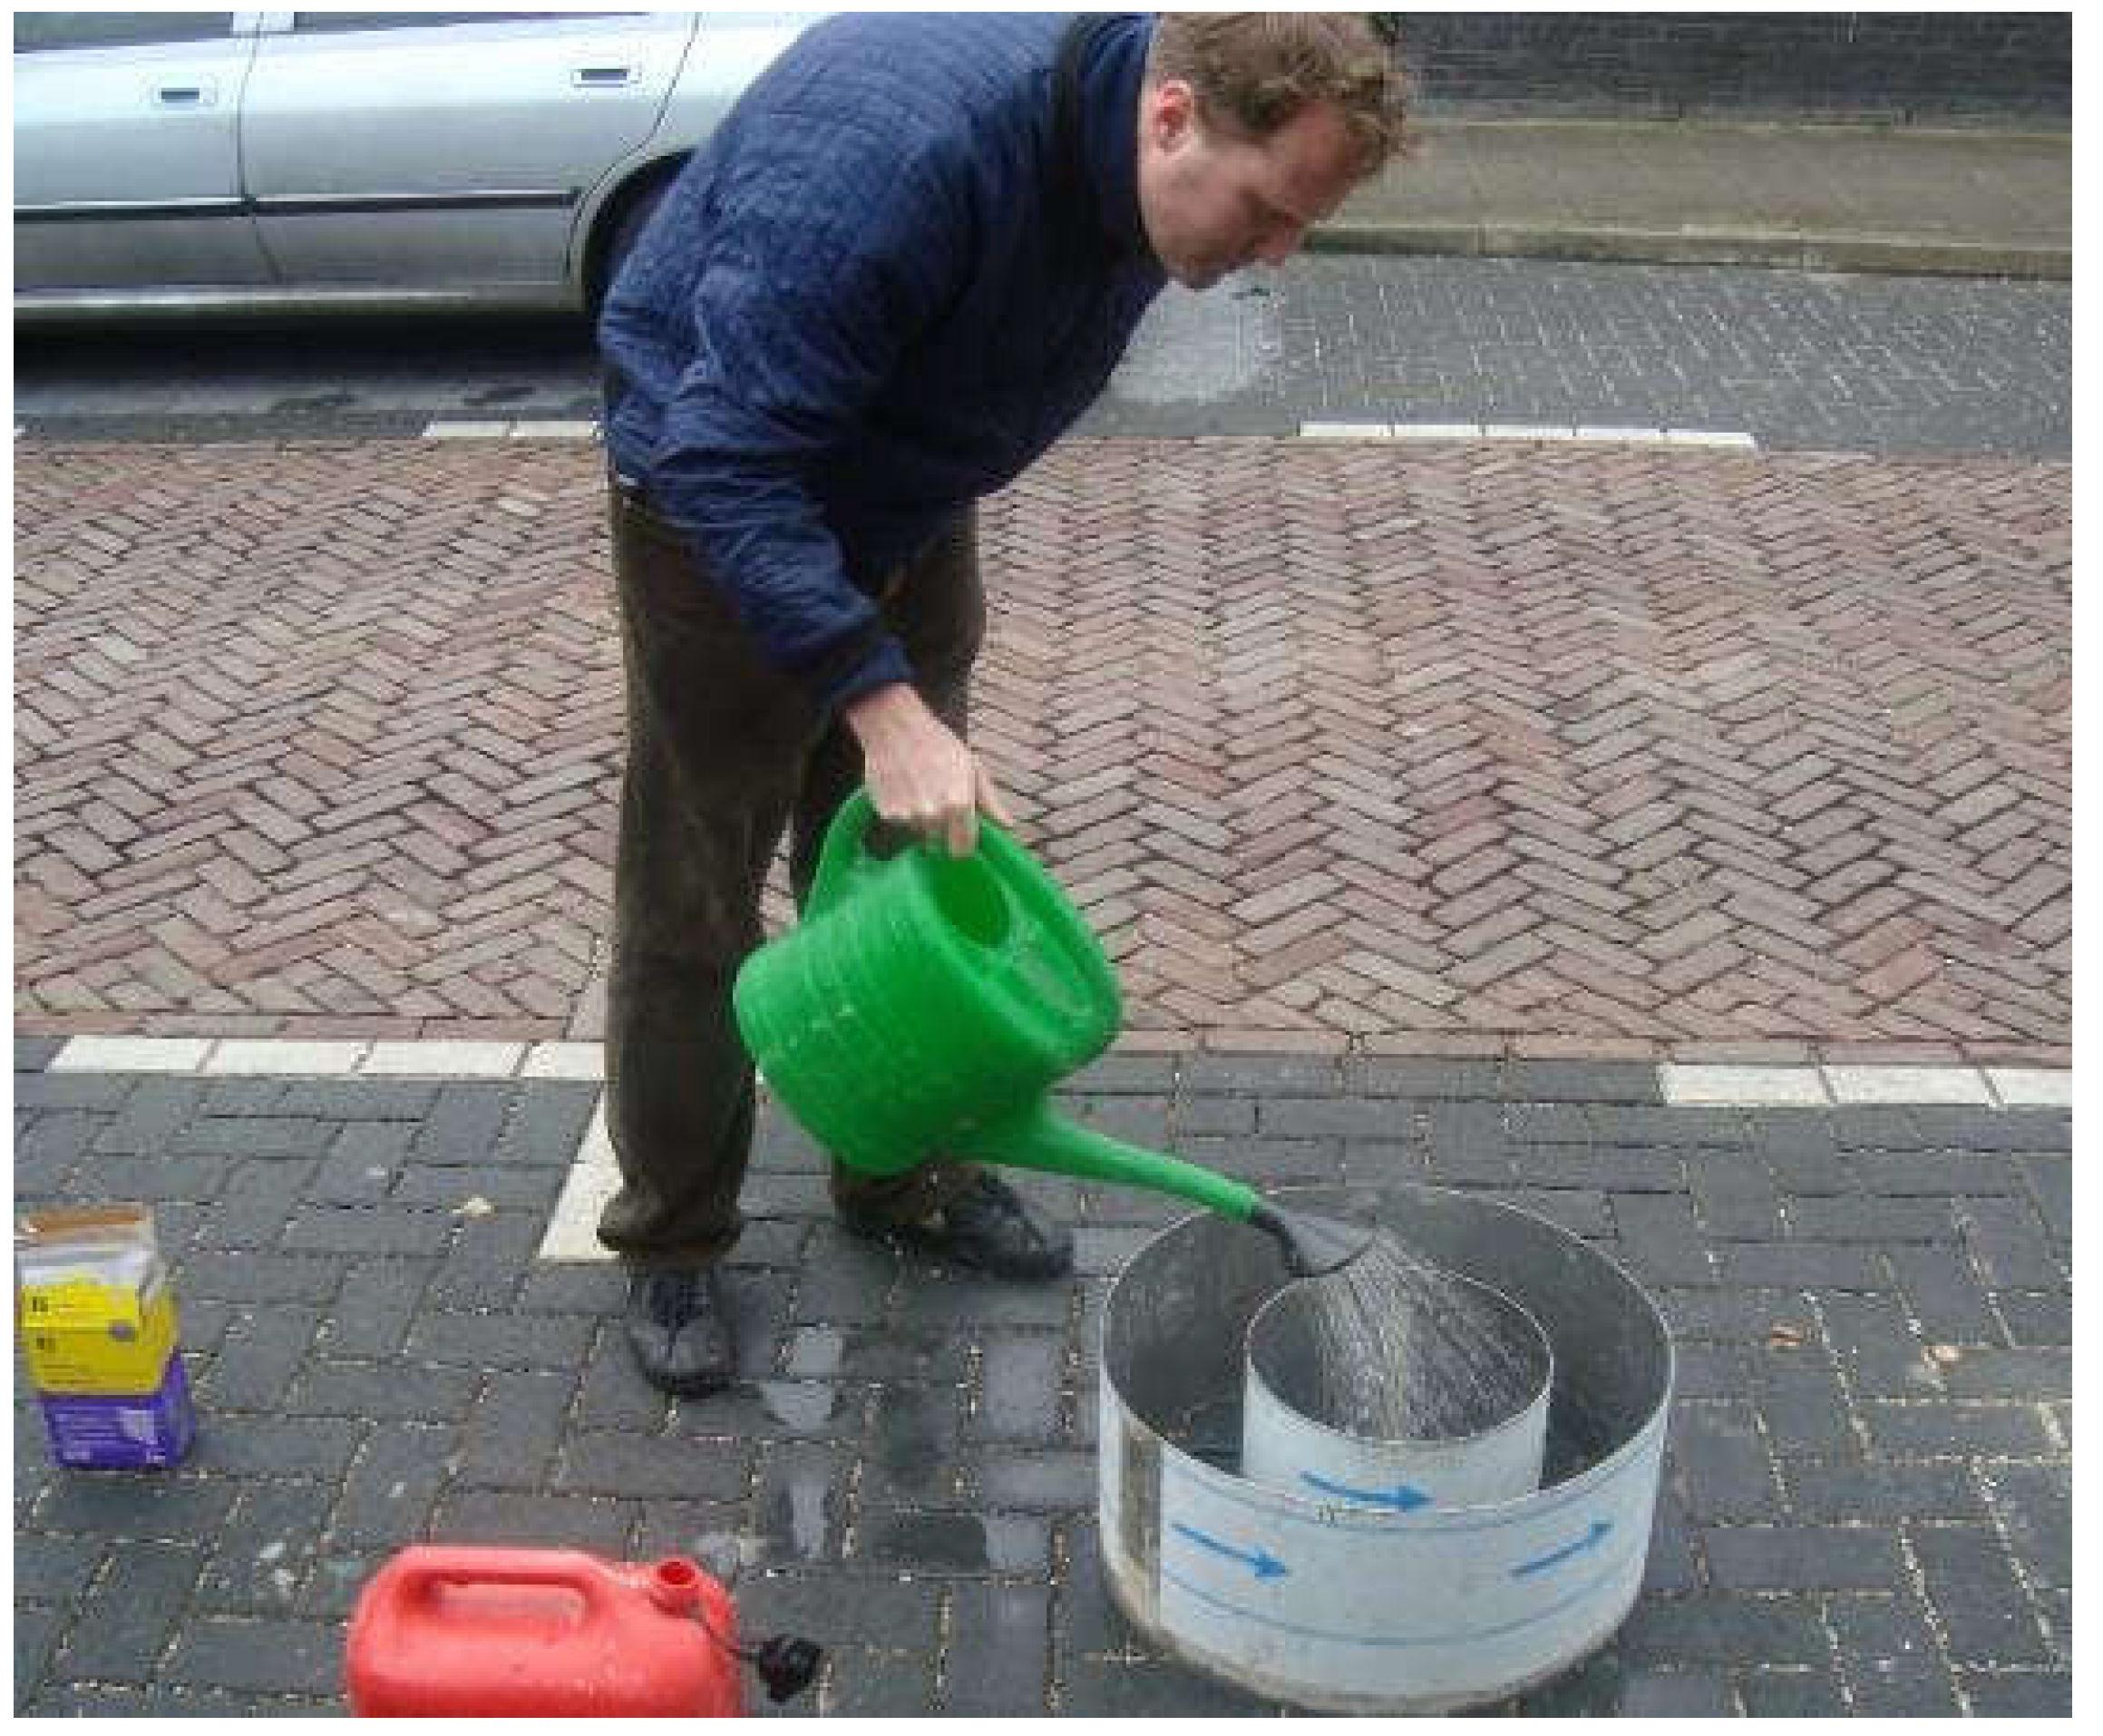
Ring infiltrometer tests [
7] were originally developed to determine the hydraulic conductivity of in-situ field soils for evaluation of their irrigation properties. Double-ring infiltrometer testing (
Figure 4) is generally now the preferred and more accurate method for measuring permeable pavement infiltration rates, as the outer ring helps reduce errors caused by potential lateral flow through the media under the pavement. However, single-ring infiltrometers are often used when the hydraulic conductivity of the media is high, as it can be difficult to keep water supplied to two rings in these conditions. The rings are usually sealed to the pavement using plumber’s putty or other sealants using ring infiltration tests. A number of previous studies have used some type of ring infiltrometer tests to estimate the infiltration capacity of permeable pavements [
2,
5,
6].
Water is generally supplied to the rings using either a constant head or a falling head method. Constant head means that the water level inside the rings is kept at a constant, predetermined level for the duration of the testing. This is done by supplying water to the rings at the same rate that the water is infiltrating into the pavement. The flowrate of the water is then divided by the cross-sectional area of the ring to calculate the infiltration rate (usually reported in mm/h).
In the falling head method, a relatively large volume of water is supplied to the rings at one time and the time taken for the water to fall between two predetermined points inside the rings is measured. The average flowrate is calculated by dividing the total volume of water contained between the two points within the ring by the time taken for the water to fall. The infiltration rate is then calculated in a similar way to the constant head method. Owing to the difficulty of supplying water at a constant flowrate in the field, the falling head method is more commonly used to estimate the infiltration rate through permeable pavement surfaces.
A number of variations to the ring infiltrometer tests described above have been developed in the USA, and these are often used to test the permeability of permeable pavements in American studies. The two main infiltration tests used on pavements in the USA are the ATSM C1781 and NCAT permeameter methods [
8]. The ATSM C1781 test method was developed under the jurisdiction of the ASTM Technical Committee and uses the constant head principle. The NCAT permeameter was developed by the National Centre for Asphalt Technology (NCAT) in the late 1990s and uses the falling head principle. Li et al. [
8] undertook a comparison of these two methods, and they found that both methods can be used effectively to measure the permeability of all pavement surface types. However, they did find that the ATSM C1781 method produced more conservative results than the NCAT method.
While previous research using ring infiltrometer tests has increased knowledge of testing methods and produced valuable results, the results were based on the infiltration rate through a very small area of the pavement that is used to represent the total pavement area infiltration [
2,
4,
6]. A number of studies have demonstrated a high degree of spatial variability between different infiltration measurements performed on the same pavement location [
2,
4,
9,
10,
11].
As the number of permeable pavement installations increases, the need for a proper tool to measure their surface infiltration functionality, especially with respect to clogging, is also increasing [
8]. This paper evaluates the performance of a newly developed, full-scale infiltration testing procedure [
12] developed to attempt to more accurately determine the surface infiltration rate of 16 existing permeable pavement installations in the Netherlands. This paper presents the initial study results from the new infiltration testing method.
2. Materials and Methods
The single- and double-ring infiltrometer tests are based on the infiltration rate through a small area of the pavement that is used to represent the infiltration rate of the total pavement area. For example, the area of the inner ring of the ATSM C1781 (2015) test is 0.0707 m
2. The minimum area recommended by Dutch guidelines is even smaller, at only 0.01 m
2 [
13]. Using such small areas for testing could potentially lead to erroneous results, as a number of studies have demonstrated a high degree of spatial variability between different infiltration measurements undertaken on the same pavement installation.
Previous research demonstrated that more accurate infiltration results may be produced by significantly increasing the area of the pavement surface being tested [
12,
14]. By inundating a much larger area of pavement during testing, it was shown that any spatial variations in infiltration capacity were effectively averaged-out, and this produced more reliable infiltration data. The full-scale infiltration testing (FSIT) method (
Figure 5) was applied in this study to determine the surface infiltration rate of 16 existing permeable pavement installations in the Netherlands [
12].
The locations and details of the pavements tested in this study are listed in
Table 1. All test pavement locations were in residential areas (30 km/h zones). No maintenance other than street sweeping had been undertaken on any of the 16 pavements tested. A visual inspection of the different permeable pavement surfaces revealed that there was a significant variation in the degree of sediment accumulation in the joints between the pavers at the different locations.
A permeable pavement area of between 40 and 60 m
2 was used for all FSIT tests undertaken in this study, which was over 700 times greater than the inner ring area used in typical infiltrometer tests [
15]. To accurately define the infiltration testing area, and to contain the water used to infiltrate the pavement, it was necessary to construct small, temporary dams (
Figure 5a) at the ends of the pavement test sections. The roadway kerb and gutter system retained the water on the sides of the pavement test sections.
The FSIT required large volumes of water to be discharged onto the test paving section in order to inundate the pavement surface. The pavement area was inundated with water from a water truck to the maximum allowable water level possible that would not cause overtopping of the roadway kerb and gutter system. Due to the different levels of the pavement surface, this meant that the depth of water in the inundated test section was dependent on the measurement location (
Figure 5b), with the lowest pavement elevation generally having the highest inundation water levels. To ensure that the total infiltration rate was recorded, measurements were taken at the lowest points on the pavement surface. The inundated water depths were generally between 50 and 90 mm for all tests.
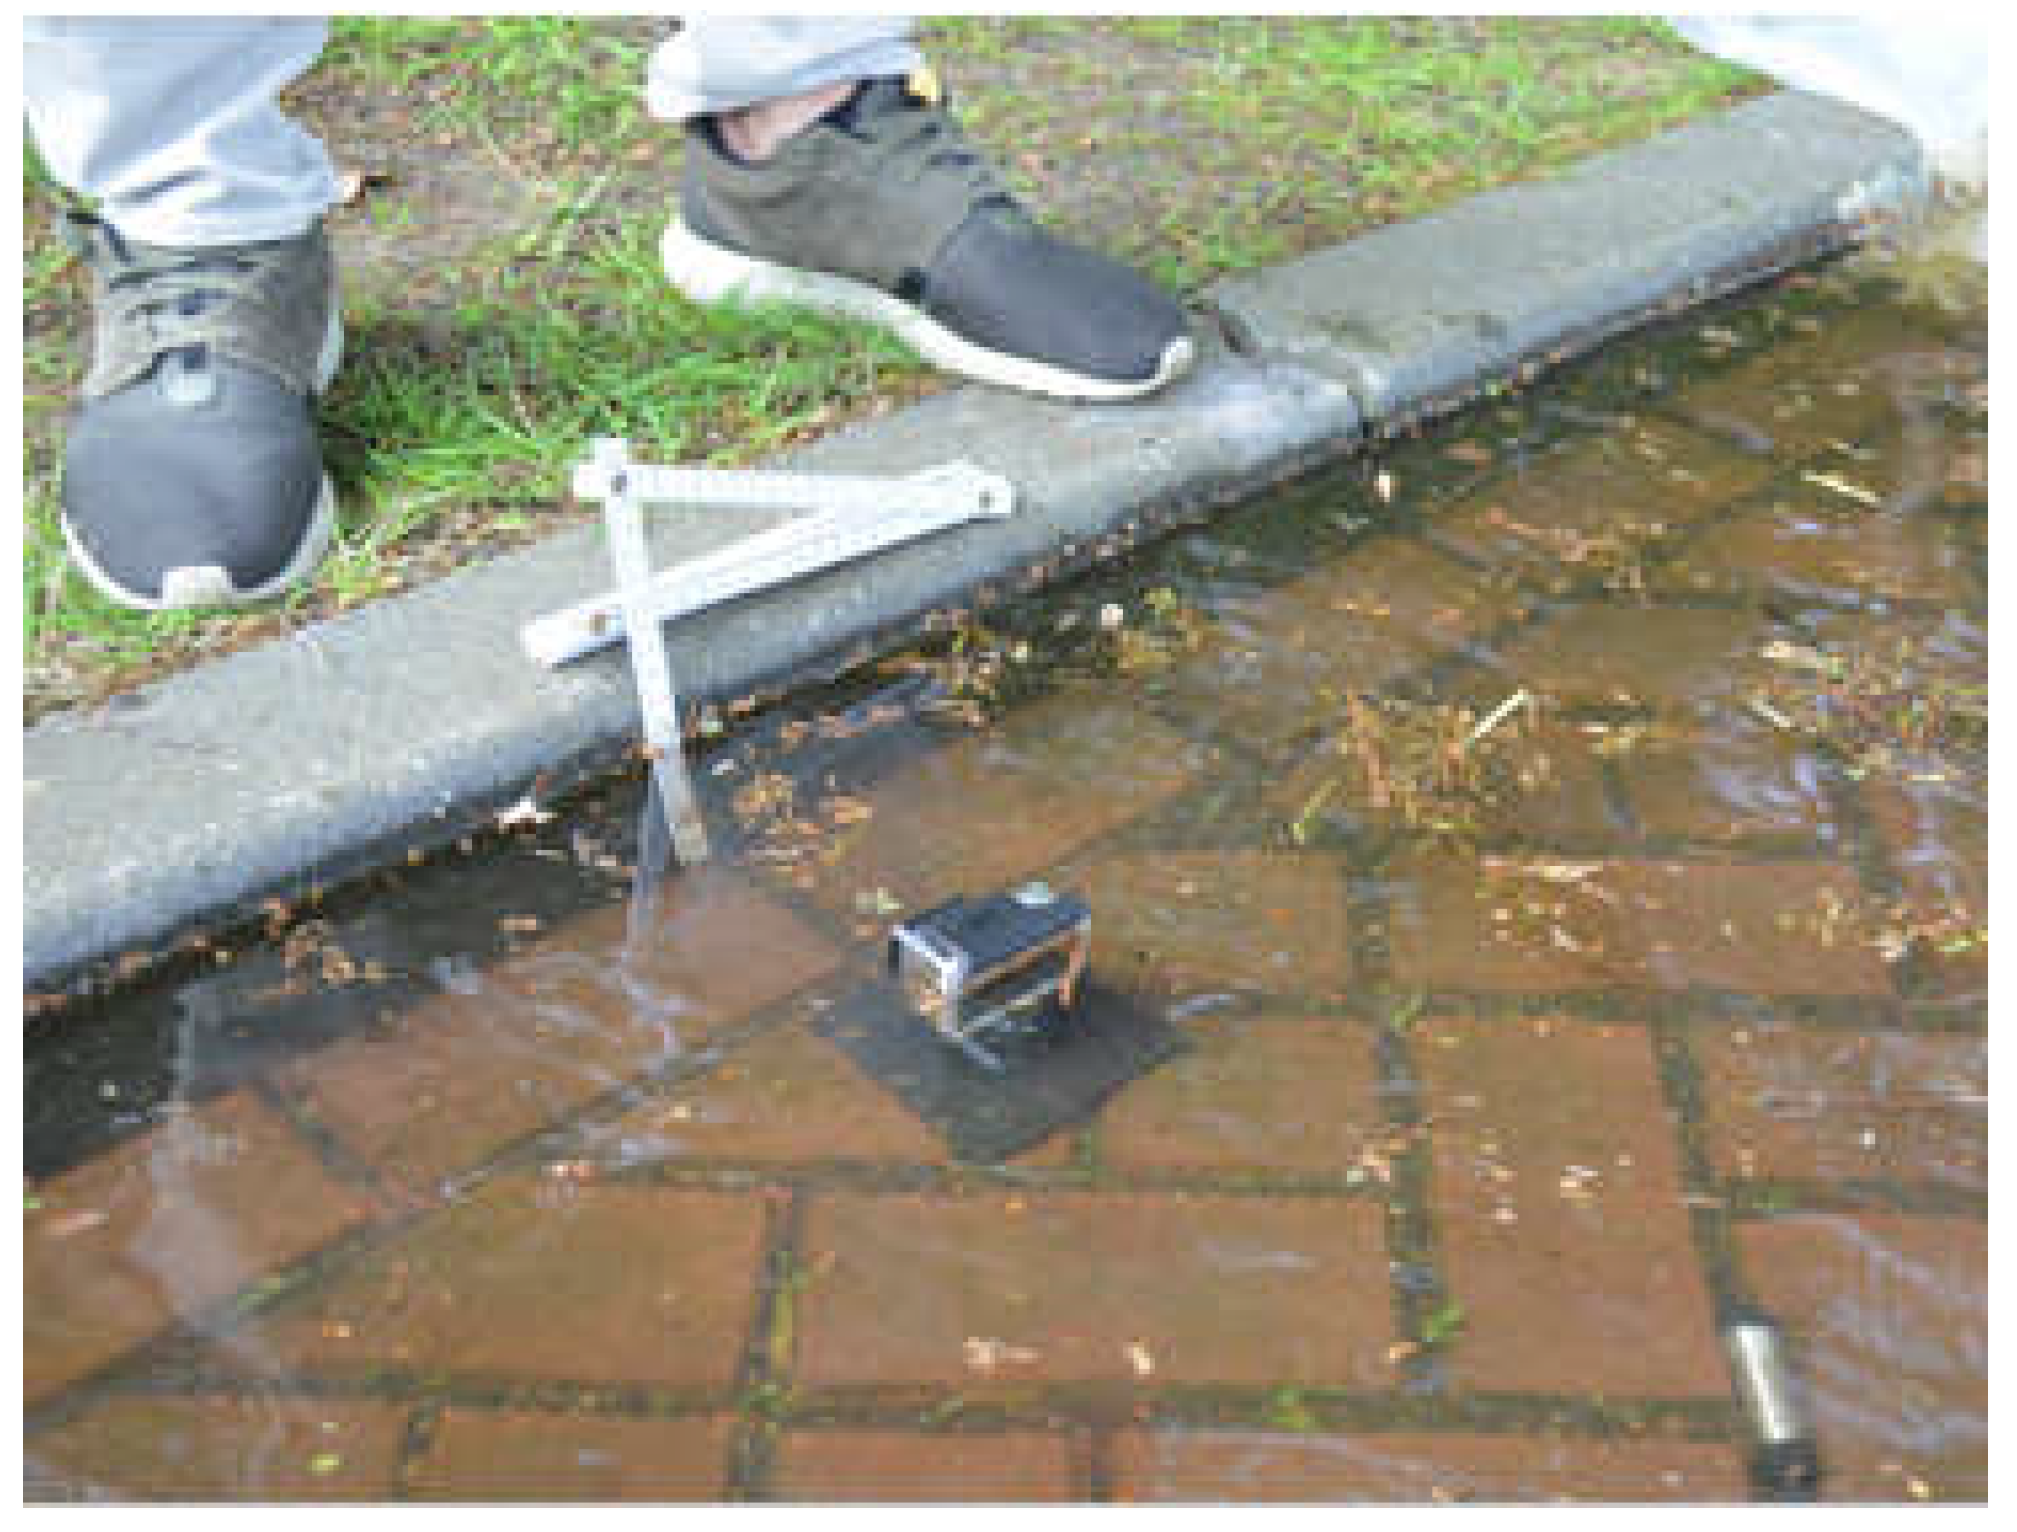
Four different measurement methods were used to determine the infiltration rates with the FSIT method. These were self-logging pressure transducers (minidiver), hand held ruler measurements (to verify the measurements of the pressure transducers), calibrated underwater cameras (
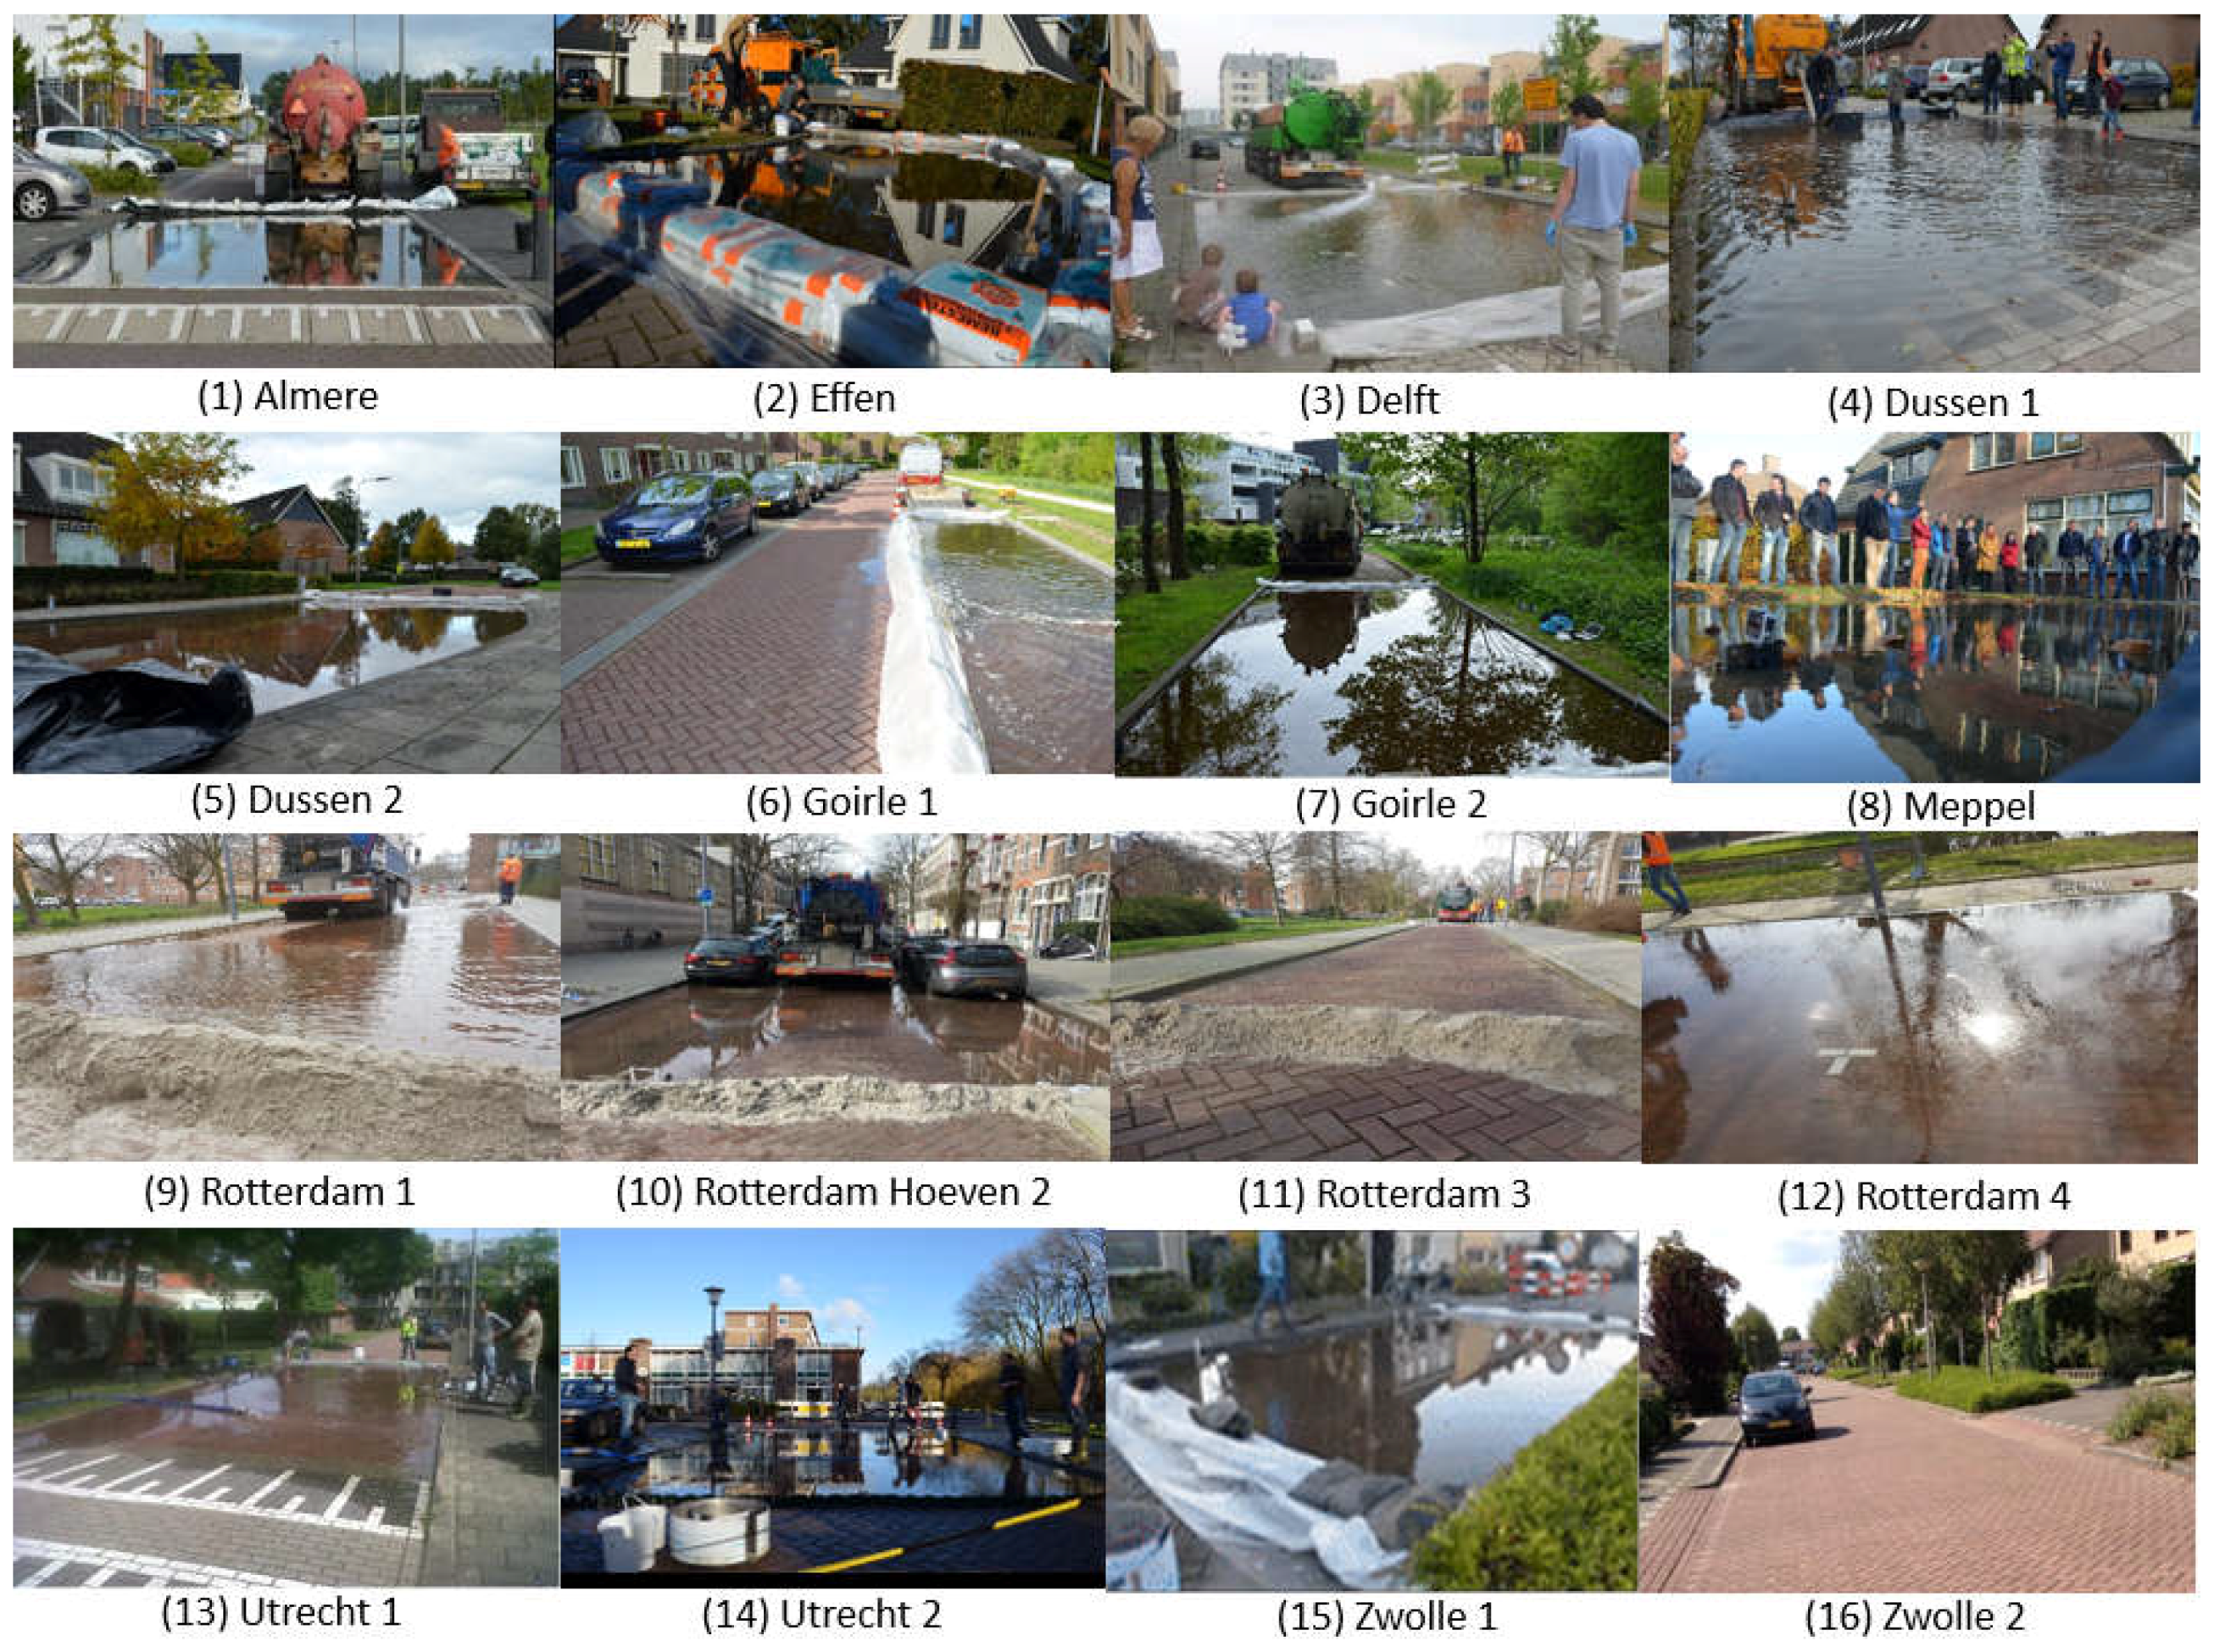
Figure 6), and time-lapse photography. Video and photographs of the test and each hand measurement were taken for documentation and verification purposes.
All 16 test pavements were sealed, inundated, and monitored (
Figure 7) as described above. At one of the test locations (Goirle 2), the pavement was tested three times to see how pre-saturation affected infiltration rates. There was a break of approximately 15 min between the three tests.
4. Discussion
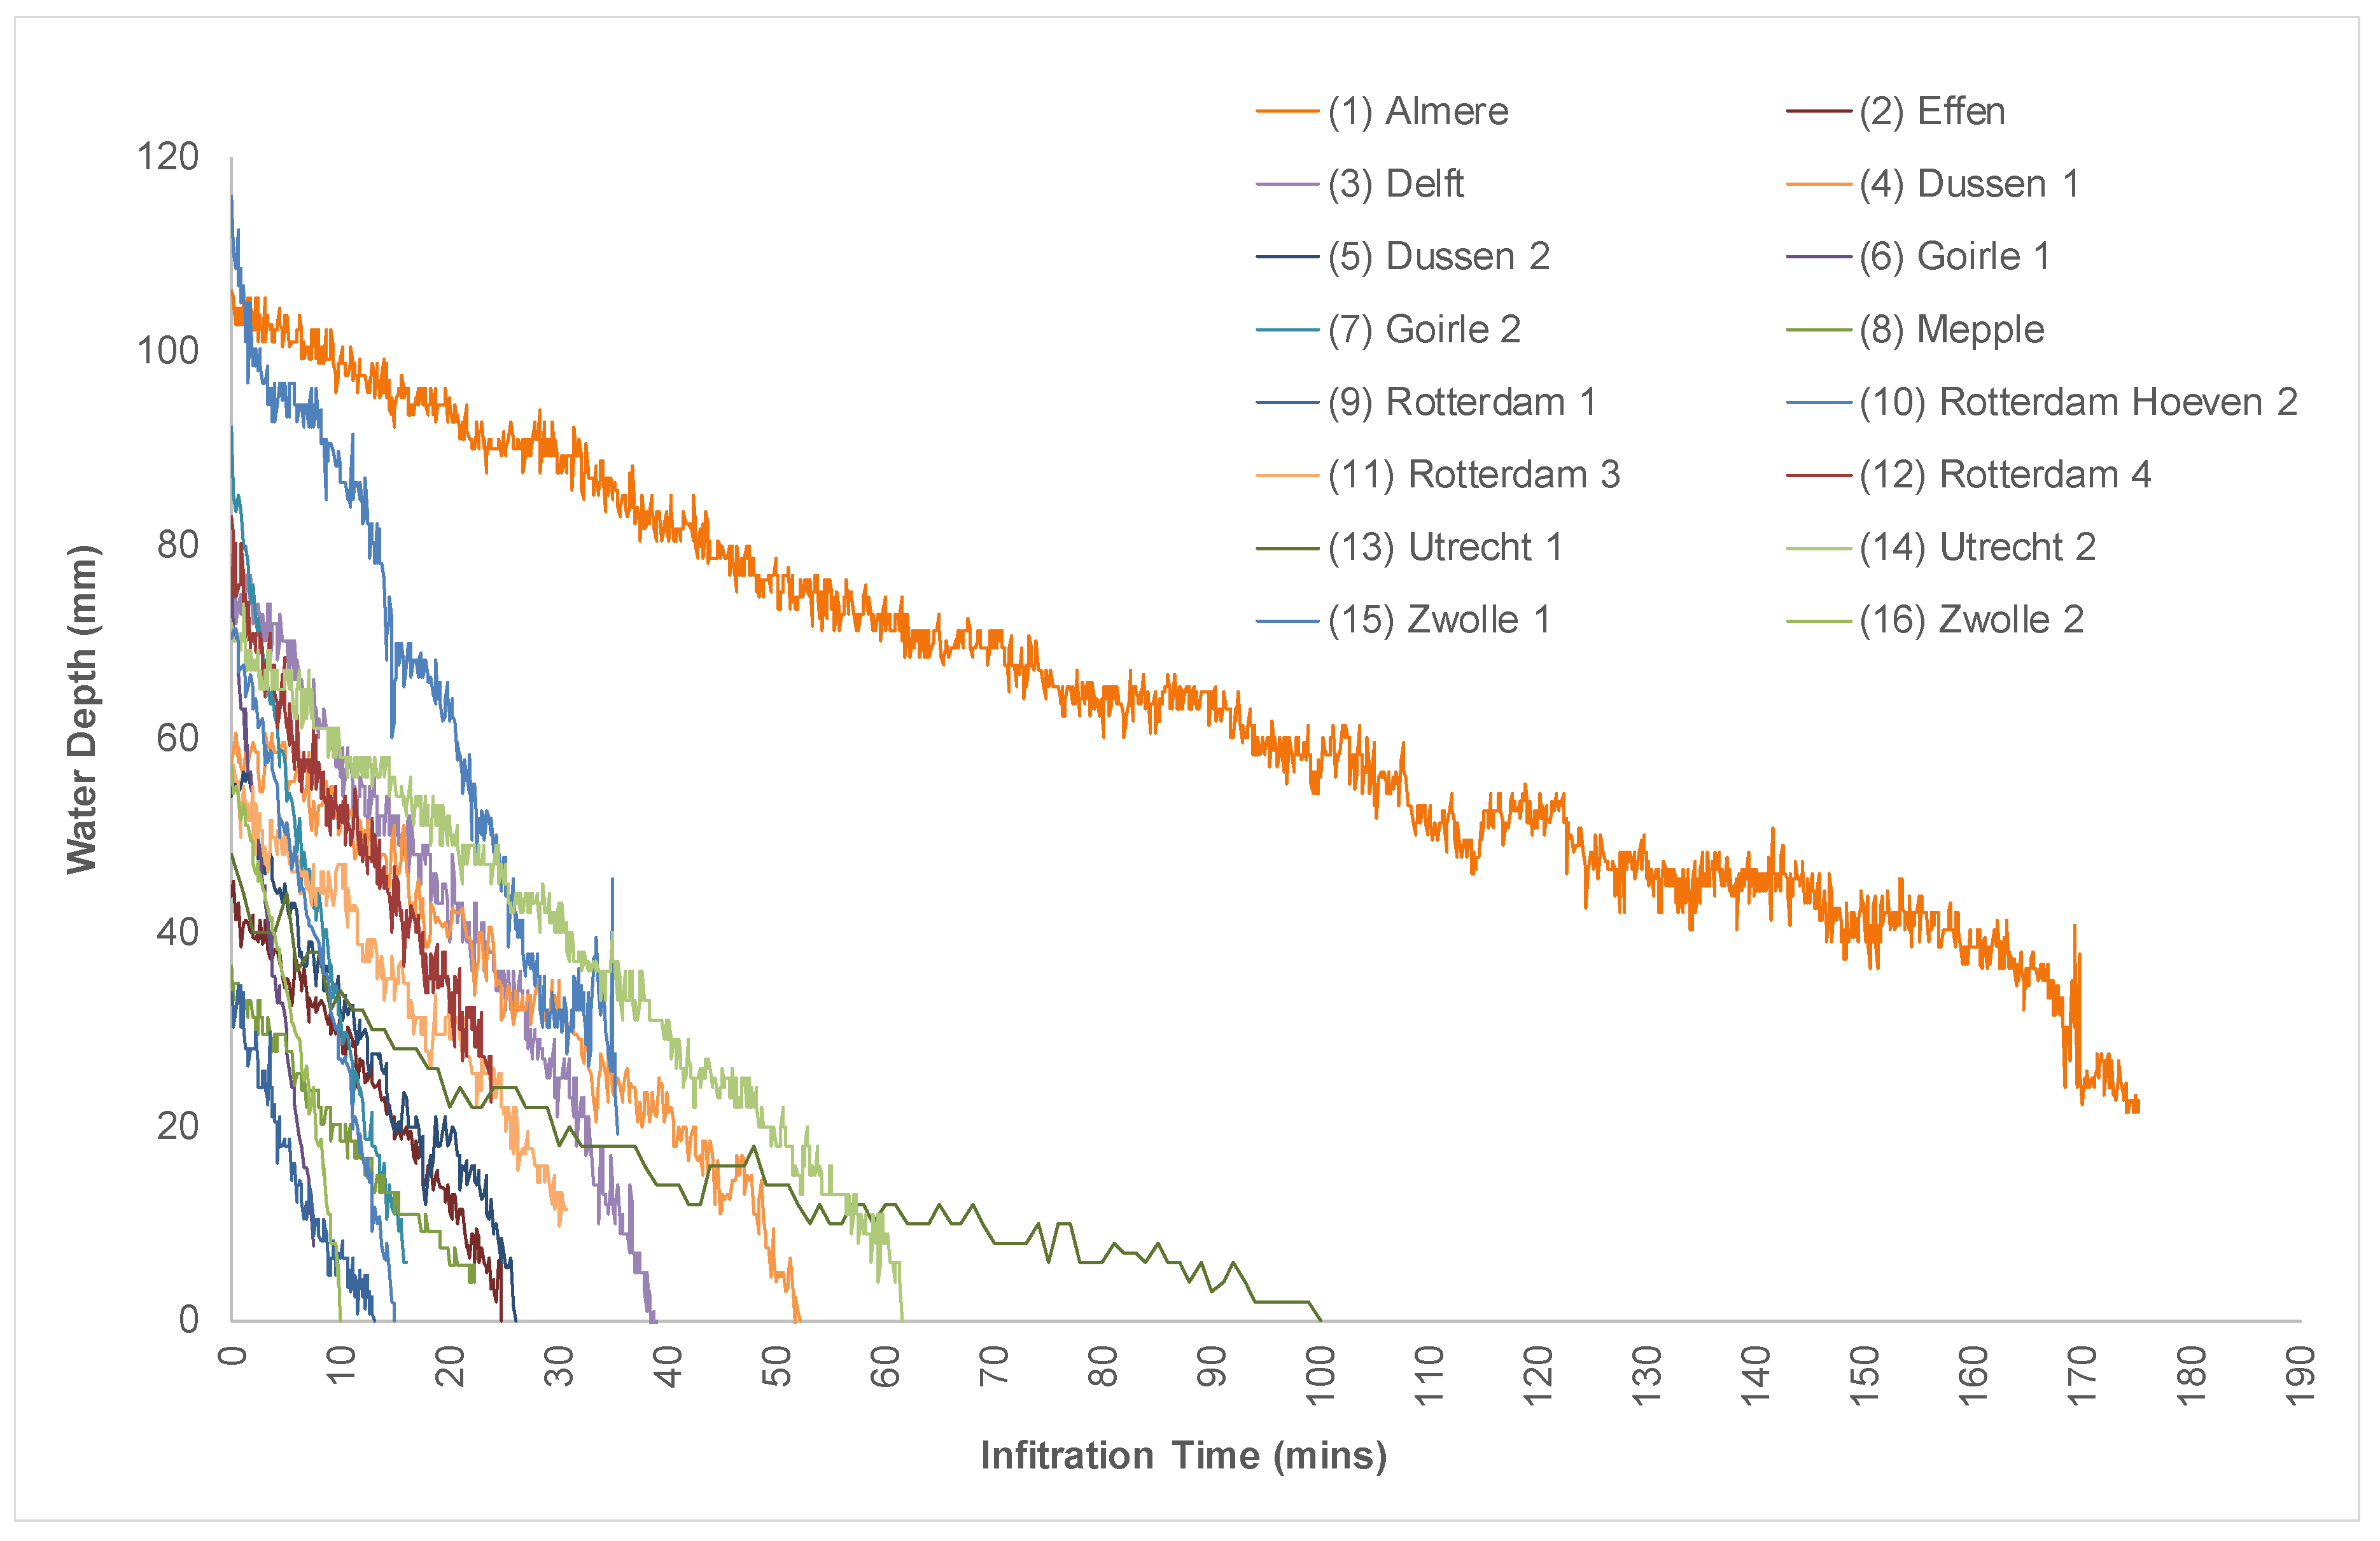
Although the 16 permeable pavements tested in this study were of a similar construction type and of similar age, the results show a large variation in the calculated infiltration rates between the 16 study pavements. The infiltration rates of the 16 test pavements differed from between 29 and 503 mm/h (
Table 2). There are a number of potential reasons for the observed variations in the surface infiltration rates between the test pavements, and these will be discussed below.
The permeable pavements tested in this study were generally of a similar construction type to that shown in
Figure 1. However, there were some small differences between the pavements including the size of the paving joints, different types of bedding aggregates, different pavement laying processes, and the use of porous concrete blocks at Locations 15 and 16. These differences may have affected infiltration rates through the paving surface. The infiltration results for Locations 15 and 16 were at the higher end of the measured infiltration rates in
Table 2, which may have been assisted by the porosity of the pavers. Previous research made an attempt to quantify these affects, but more research is still needed to validate this. Previous research found that construction mistakes in some permeable pavements may affect surface infiltration rates, and this could also be a reason for the differences [
2,
5].
Infiltration rates of permeable pavements have been shown to reduce over time due to clogging [
1,
2,
10,
11,
16,
17]. The degree that particle deposition onto pavement surfaces impacts on the performance of a system depends on the particle size distribution of the material and the pore structure or permeability of the system [
18]. Not all of the 16 pavements tested in this study were of the same age, so it would be reasonable to expect some differences in infiltration rates due to differences in the degree of clogging due to age.
There were distinct variations in the frequency of pavement maintenance (sweeping) procedures between the different municipalities. Some municipalities conducted occasional street sweeping of their permeable pavements, while others did not. However, as all street pavements were swept, this was generally not considered as targeted maintenance to improve the permeable pavement performance and to reduce clogging. It was thought that general street sweeping was unlikely to have had any effect on the study results.
Variations in ground water levels may have affected the infiltration capacity of the permeable pavements. The water table was higher at some pavement test locations (particularly in the western areas of the Netherlands), while the permeability of soils in the eastern test locations were generally higher. In areas of high table water, the permeable pavements soil subgrade may have a much higher moisture content than low water table soils. This may restrict the infiltration of runoff water into the pavement structure, thereby reducing surface infiltration rates. This may explain the slower infiltration rates of some of the test pavements in the low-lying areas of the Netherlands (
Figure 8).
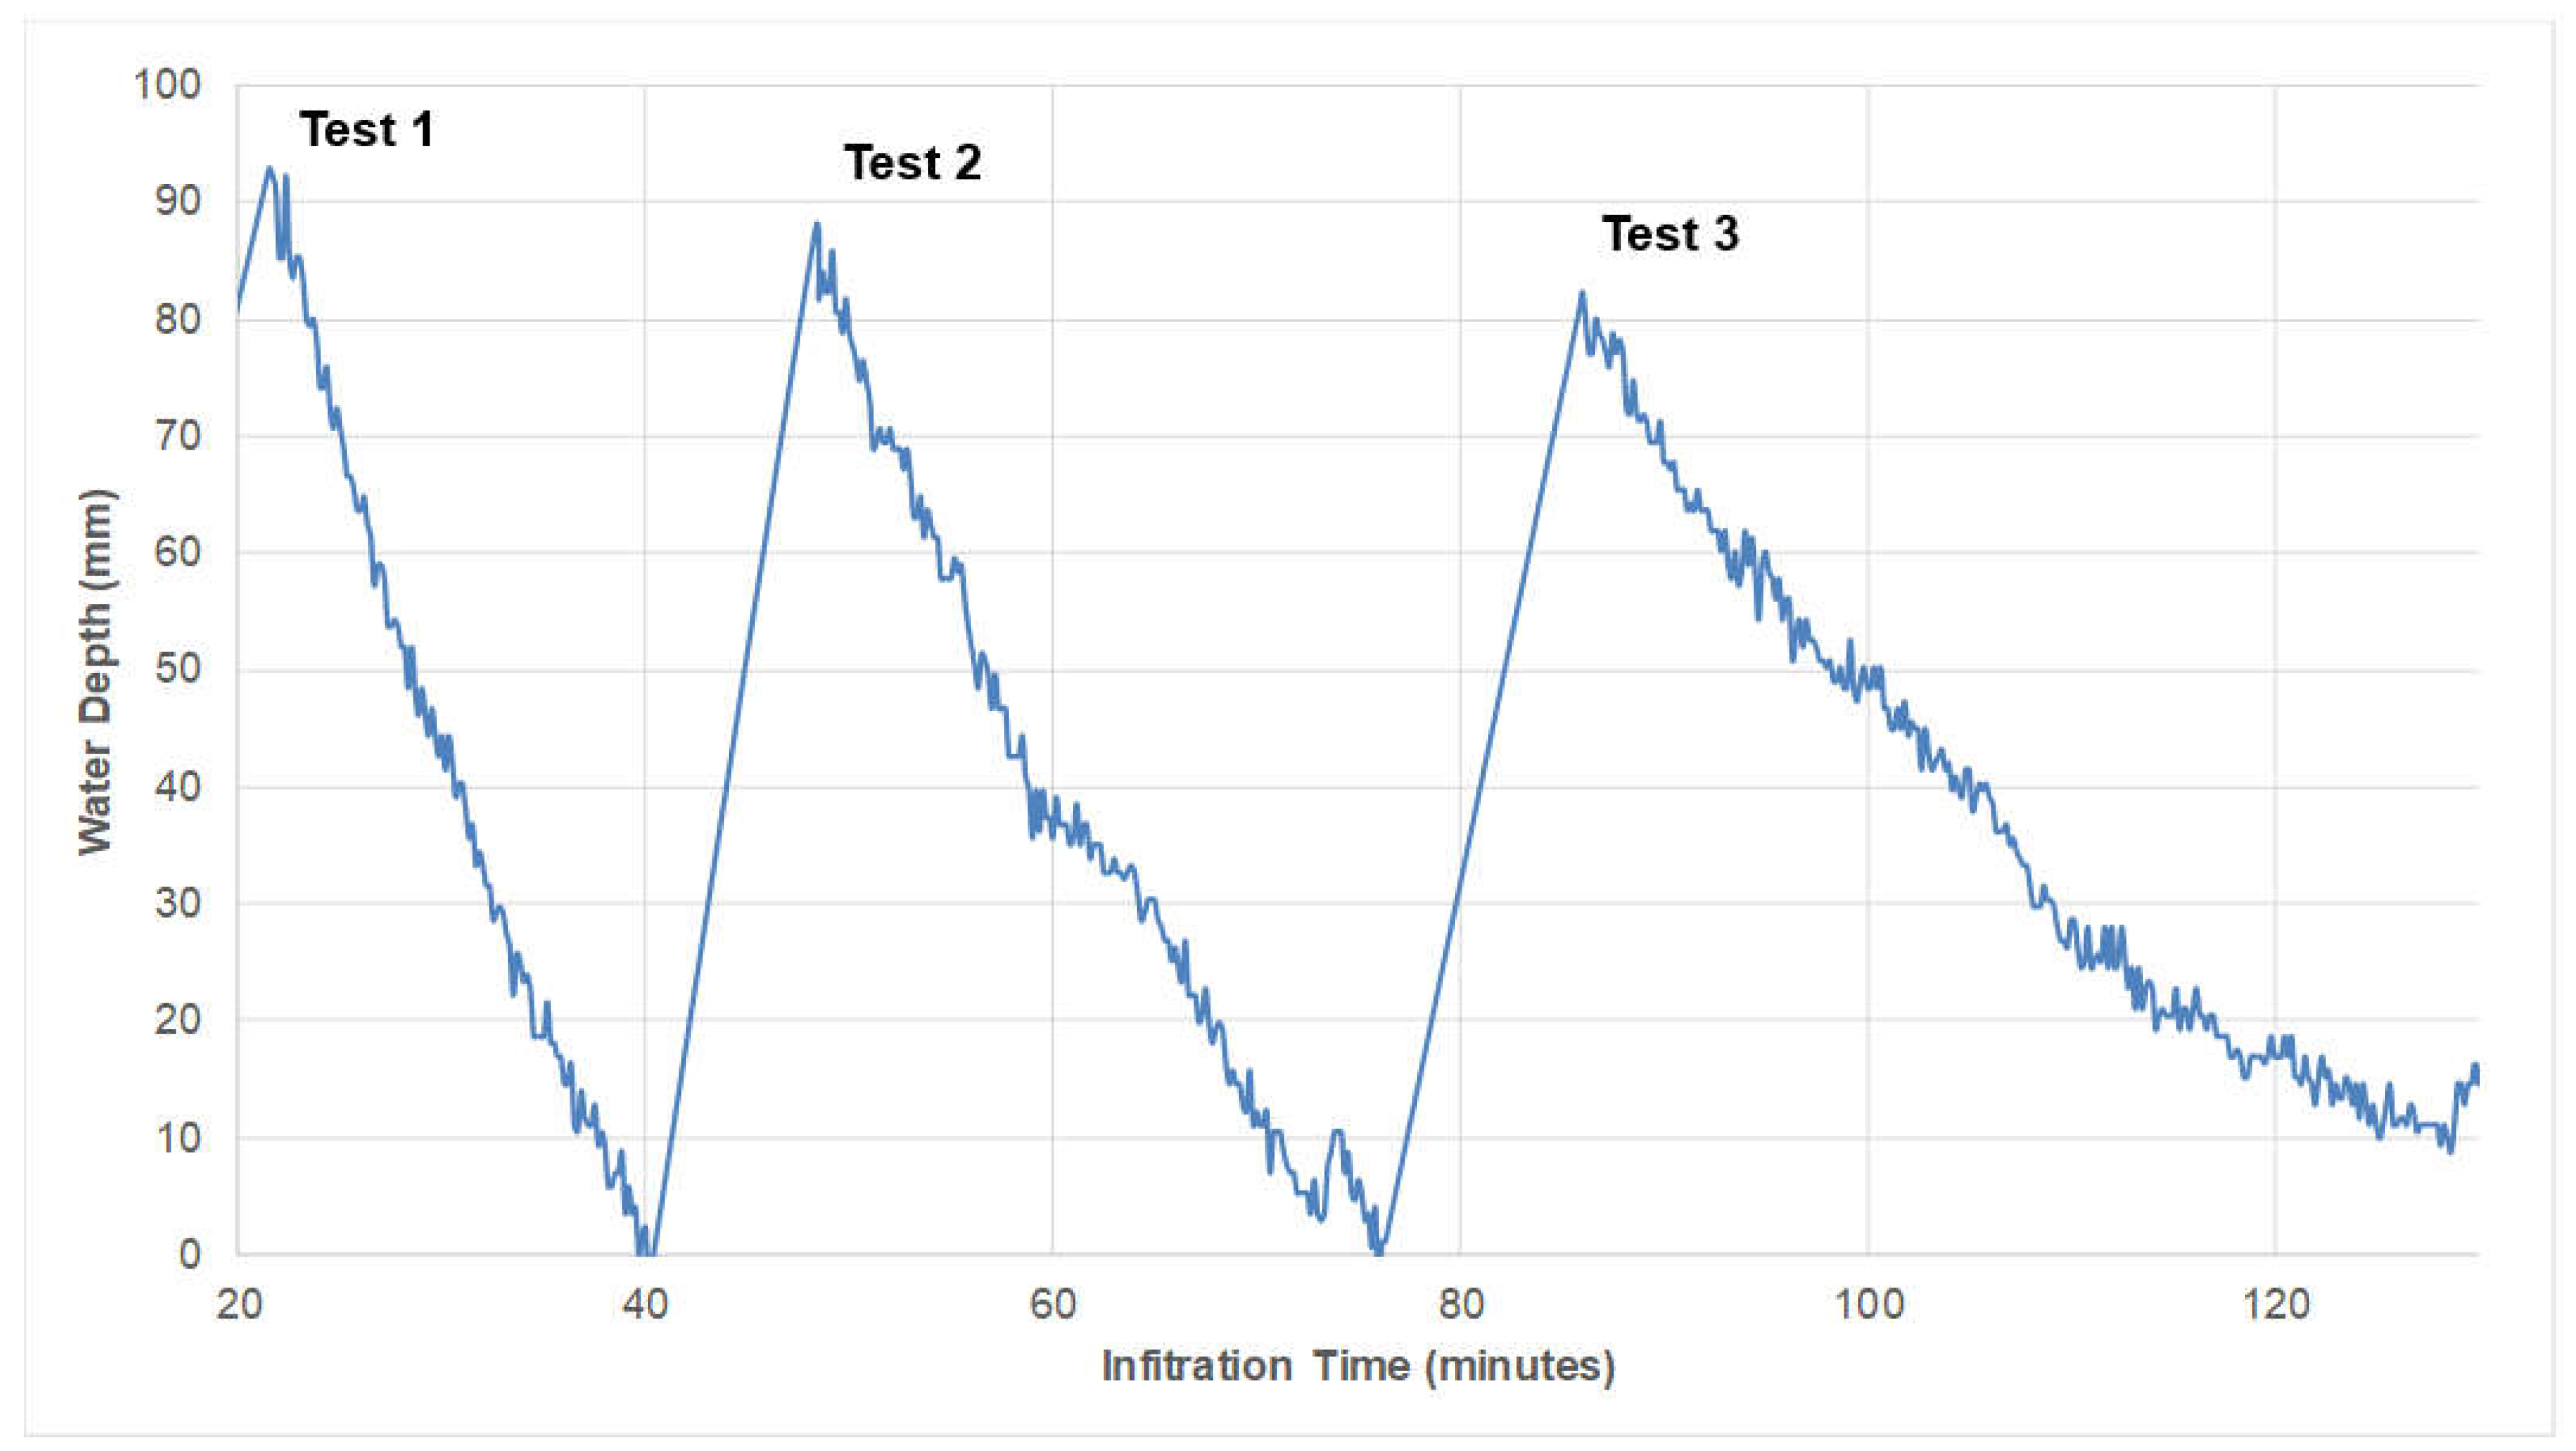
Figure 9 clearly shows that the infiltration rate of the permeable pavement installation at Goirle 2 was affected by pre-wetting. Three FSIT tests were performed on this pavement, one after the other. The time taken for the water to fully infiltrate into the pavement surface increased from approximately 18 min for the first test, to approximately 25 min for the second test, and to approximately 45 min for the final test. This resulted in a 39% reduction in infiltration capacity for the saturated pavement (Test 2) compared to the unsaturated pavement (Test 1). The second saturated test (Test 3) showed a 65% reduction in pavement infiltration between Test 2 and Test 3. These results suggest that the pavement may have been approaching its maximum infiltration rate. However, it was not possible to accurately assess the moisture content of the pavement subgrade, so it is difficult to ascertain whether the pavement may have been able to accommodate further testing. Further infiltration tests may have demonstrated a saturation point for the pavement where it could no longer infiltrate any more water. Unfortunately, further tests were not conducted at that time. However, this will be investigated in future research.
Multiple infiltration tests performed at Groningen (
Table 4) show that the reduction in infiltration rates between the unsaturated and saturated tests ranged from 27% to 48% with an average reduction rate of 37%. Most of the permeable pavements in Groningen are younger than the other study locations in
Table 1, so these were not included in this evaluation, which focused on the long-term efficiency of permeable pavements. However, the average reduction of 37% between the two tests was similar to the 39% reduction observed during the Goirle testing. This suggests that this infiltration behavior may be typical to all permeable pavements.
This is an important finding, as it shows that the infiltration rate of permeable pavements, and the associated reduction in runoff volumes, may decrease during periods of frequent rainfall. Extreme rainfall events generally do not happen in isolation; rather, they are often proceeded by a number of smaller storm events in the days beforehand. This means that designs based on measured unsaturated infiltration rates only may not be suitably accurate. This may have significant long-term implications for stormwater management in the Netherlands and elsewhere. Further research will investigate this in more detail.
Most previous research has focused on unsaturated infiltration rates of permeable pavements. However, this study demonstrated that the difference in infiltration capacity between saturated and unsaturated can differ by nearly 500%. If unsaturated infiltration capacity test results are used as design input for computer models, the infiltration capacity may be significantly overestimated. It is therefore recommended that an appropriate degree of pre-saturation is accounted for in design. This could be applied by a simple reduction in the design unsaturated infiltration rate.
Guidelines on acceptable infiltration rates for newly installed permeable concrete pavement systems in the Netherlands were developed in 2014, and local government engineers and designers often refer to these guidelines when designing new permeable pavement systems [
13]. The guidelines recommend using the ASTM D3385-09 double-ring infiltration test [
7] to determine the infiltration rate of permeable pavement surfaces. It suggests undertaking a minimum of three different tests at three locations on the pavement. All three tests need to demonstrate an average infiltration rate of equal to or greater than 194 mm/h (540 L/s/ha) to be deemed to comply.
The results in
Figure 9 clearly show that initial (unsaturated) infiltration rate observed at the Goirle 2 site would conform to the new guidelines [
13]. However, infiltration rates observed during subsequent (saturated) tests show that these rates (178 and 62 mm/h, respectively) would not meet the guidelines. This is an important finding that again suggests that if unsaturated infiltration capacity test results are used as design input, the infiltration capacity may be significantly overestimated. The results of this study therefore suggest that a minimum of three different FSIT tests are undertaken at the same pavement location, and that the results should be averaged, to ensure appropriate infiltration rates are observed, recorded, and used in design.
The overall infiltration rates calculated for 12 of the 16 pavements tested in this study (
Table 2) were below the guideline recommendation of 194 mm/h. This suggests that these 12 pavements may now be due for maintenance to restore their infiltration capacity. Previous studies have demonstrated that infiltration rates that have diminished over time due to clogging can be restored by undertaking preventative pavement maintenance, such as street sweeping and vacuum cleaning [
4,
19,
20,
21,
22,
23,
24]. This study recommends that preventative pavement maintenance is undertaken where average FSIT results demonstrate an infiltration capacity less than 194 mm/h.
The results of this study suggest that it would be beneficial to test the infiltration capacity of permeable pavements using the FSIT method directly after construction to obtain a baseline for later comparison. The pavements should then be tested at a minimum of every five years to determine whether the infiltration rate is still acceptable. Based on the results of this study, it is recommended that municipalities should plan to undertake restoration maintenance on permeable pavements after approximately 10 years of continuous use. It is also recommended that the potential effects of continual wetting of the soil surrounding permeable pavements on their surface infiltration capacity be considered in design.
5. Conclusions
Newly installed permeable pavements in the Netherlands must demonstrate a minimum infiltration capacity of 194 mm/h. This study used a full-scale infiltration testing (FSIT) method to evaluate the infiltration performance of 16 permeable pavements in five municipalities that had been in long-term service throughout the Netherlands. This study found that only 4 of the 16 tested pavements had infiltration capacities above 194 mm/h. The other 12 permeable pavements may now be due for maintenance to restore their infiltration capacity.
Most previous research has focused on the unsaturated infiltration rates of permeable pavements. However, this study demonstrated that the difference in infiltration capacity between saturated and unsaturated can differ by up to 500%. Tests at one study location showed an initial (unsaturated) surface infiltration capacity of 293 mm/h. Successive (saturated) tests showed a reduction in surface infiltration capacities of 39% (178 mm/h) and 66% (62 mm/h), respectively, compared to the unsaturated surface infiltration capacity observed in the initial test. A number of other sites were also tested multiple times with similar results. This is an important finding that again suggests that if unsaturated infiltration capacity test results are used as design input for computer models, the infiltration capacity may be significantly overestimated.
The study results demonstrated that the FSIT method is a reliable and accurate way to measure surface infiltration rates of permeable pavements. The results of the study suggest that a minimum of three different FSIT tests should be undertaken at the same pavement location, and that the results should be averaged, to ensure appropriate infiltration rates are observed, recorded, and used in design.
While the results of the study may initially appear discouraging, whether the results are considered acceptable or not depends on a number of factors. These include the location of the pavement, its intended purpose, and stakeholder expectations and perceptions. The results of this study should help stormwater managers with the designing, planning, and scheduling of maintenance requirements for permeable pavements with more confidence so that they will continue to perform satisfactorily over their intended design life.


