Abstract
Sediment basins are temporary practices commonly used to detain stormwater runoff and capture suspended sediment on construction sites. A 79.0 m3 (2790 ft3) sediment basin testing apparatus at the Auburn University—Erosion and Sediment Control Testing Facility was used to provide a series of controlled and repeatable, large-scale tests to understand the performance of sediment basins and provide improvements. This research evaluated five sediment basin configurations over the course of 27 individual tests, including: (1) a standard configuration, (2) the addition of an excavated sump upstream of a ditch check, (3) the modification of the first baffle, (4) a high-rate lamella settler in upward flow, and (5) a high-rate lamella settler in parallel flow. The primary metric for evaluating performance and the treatment effectiveness of a configuration’s ability in capturing sediment was assessed from turbidity measured across the basin surface. Multiple linear regression analysis indicated that an excavated sump provided insignificant improvement in sediment capture effectiveness. Furthermore, the modification to the first baffle was deemed ineffective in improving treatment efficiency. Lamella settler results indicated a 18.2% and 29.0% reduction in turbidity across the basin for upward and parallel flow configurations, respectively.
1. Introduction
Sediment is one of the leading causes of nonpoint source pollution in the U.S., causing biological and chemical impairments as well as decreasing conveyance capacities of stormwater systems [1,2,3]. Through the Clean Water Act, construction site operators are required to implement stormwater pollution prevention plans (SWPPPs) to minimize impacts on receiving water bodies. Erosion and sediment control practices are included in SWPPPs to manage the risk of downstream sediment-laden stormwater pollution. State highway agencies (SHAs) maintain standard details for the design, construction, and maintenance of temporary erosion and sediment control practices to ensure uniform installation of practices [4,5,6,7,8]. Sediment Basins are one of the most commonly used sediment control practices used to manage runoff emanating from large, disturbed earthen areas. Sediment basins are detention practices used to collect and treat sediment-laden stormwater prior to discharge. They are designed to provide adequate detention time, allowing for the settlement of soil particles through gravitational forces. Sediment basin efficiency can be affected by soil particle size distribution and several physical parameters such as: basin size and geometry (e.g., length to width ratio), energy dissipation, selection of a dewatering mechanism, and other design considerations [9,10,11,12]. Basin volume requirements are a function of contributing drainage area and the required detention time for soil particles to settle. Often, sediment basins require relatively large footprints to provide adequate storage and residence time for treatment [13]. With right-of-way limitations on linear roadway projects, the size and optimization of sediment basin performance is critical. The performance of sediment basins has been investigated by several researchers [13,14,15,16,17,18,19,20,21,22,23,24,25,26,27,28], however controlled experiments in a large-scale sediment basin at dimensions truly representative of field implementation, have not been widely performed. Standardized testing methods in a controlled environment allow researchers to better quantify the performance of current standard sediment basin designs, while also identifying alternative basin configurations and treatments to possibly improve efficiency of the practice. Sediment basin studies on active construction sites are difficult to perform due to the inherent dynamic nature of construction and lack of repeatability and control over variables including: rainfall, runoff, contributing drainage areas, and sediment loadings—all of which are key contributing factors in the performance of a basin.
The objective of the study was to use large-scale testing methods to evaluate factors within a sediment basin system that contribute to turbidity reduction across the various bays of the basin, with the intent of providing recommendations on improving design guidance. Specific configurations are described in detail in Section 2 and include: the addition of an excavated sump in the forebay, modification of the first baffle system, and the use of high-rate lamella plate settlers. The design of the sediment basin testing apparatus, shown in Figure 1a, at the Auburn University—Erosion and Sediment Control Testing Facility (AU-ESCTF), as well as the development of a testing methodology and testing regime were detailed through previous research efforts [11].
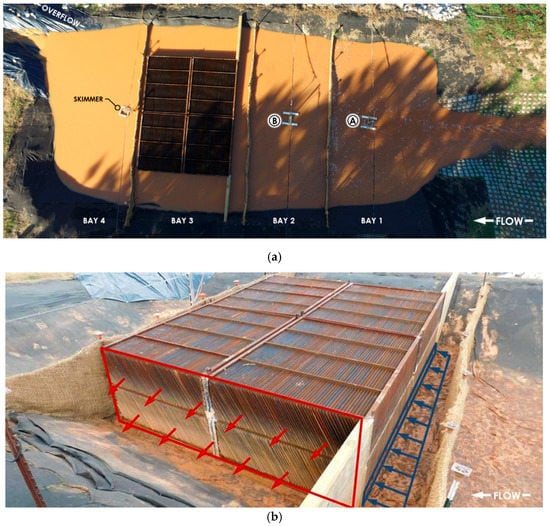
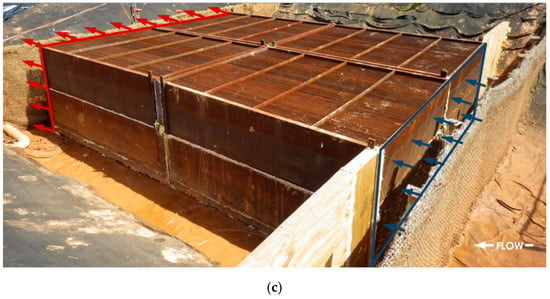
Figure 1.
(a) Sediment basin during lamella treatment testing and showing the sampling and data collection points at A (Bay 1), B (Bay 2), and skimmer, (b) Lamella settler units in upward, and (c) parallel flow configurations.
2. Evaluated Sediment Basin Treatments
To meet the research objectives of improving current basin performance understanding and design guidance, the following configurations, were evaluated: (1) a standard configuration, (2) the addition of an excavated sump upstream of a ditch check, (3) the modification of the first baffle, (4) a high-rate lamella settler in upward flow, and (5) a high-rate lamella settler in parallel flow. While the use of flocculants is common in temporary sediment basins and lamella settler applications to enhance sediment capture efficiencies, its use was not evaluated as part of this study, focusing thus on the physical processes associated with sediment removal. This section provides installation and configuration details on the evaluated configurations.
2.1. Standard Configuration
Sediment basin designs are somewhat uniform across the U.S., incorporating common design elements, with some preferential variance on key elements (i.e., maximum allowable contributing area, minimum length to width ratio, side slope geometry, etc.) [29]. For the purposes of this research, the Alabama Department of Transportation (ALDOT) standard configuration was used to design and construct the test apparatus and is described in the Methodology and Testing Regime section of this manuscript [11]. The ALDOT standard configuration for sediment basins has the following key features: (1) an excavated sump and ditch check to create a forebay, (2) three coir baffles installed perpendicular to flow to create four equal bays, (3) a surface skimmer dewatering device, and (4) an auxiliary spillway [30]. The ditch check in the channel creates an impoundment before inflow enters the sediment basin and functions as a forebay. This standard configuration was evaluated to gain a better understanding of the current efficiency of the basin to reduce turbidity of sediment-laden inflow and to provide a control for all other evaluated configurations.
2.2. Excavated Sump
A sump is an excavated portion within the inflow channel directly upstream of a ditch check (a.k.a. check dam) intended to facilitate the capture of larger, rapidly-settable particles, prior to reaching the sediment basin. This pre-treatment feature provides a dedicated collection area that is easier to access and maintain when routine dredging of collected material is warranted. Some standards include details for the use of an excavated sump upstream of the sediment basin in the inflow channel [31]. Tests were performed with the addition of an excavated sump in order to determine if its inclusion is beneficial when compared to the standard configuration without the inclusion of the sump. The sump used in this study was constructed within the inflow channel and measured approximately 3.7 m × 1.5 m × 0.61 m (12 ft × 5 ft × 2 ft), length to width to depth, respectively. The approximate storage volume was 3.4 m3 (4.4 yd3).
2.3. Modified First Baffle
Investigations performed by researchers have demonstrated that baffles have the ability to improve flow uniformity and decrease turbulence within a basin. It has also been reported that the first baffle within a sediment basin provides the most benefit from a treatment standpoint [32,33]. To optimize the first baffle, evaluations were performed to provide comparisons between the standard baffle configuration and a modified baffle with a reduced percent open area (POA). A combination of photo editing and CAD software was used to determine the POA from a scanned sample of coir baffle. Using this technique, it was determined that the POA was 43.4% per baffle layer.
The standard baffle installation was installed with two layers of coir material on each side of the baffle resulting in an effective POA of 21.7%. The first baffle was modified by doubling the coir mesh (i.e., four layers of coir material) to reduce the POA, with the goal of decreasing turbulence in downstream bays and trapping more sediment within the first bay of the basin. Using the modified baffle installation, the effective POA was reduced to 10.9%.
2.4. Lamella Settlers
Lamella settlers are comprised of a series of inclined parallel plates traditionally used in water purification and wastewater treatment to create favorable conditions for particle settling [34,35]. The settling efficiency of solids suspended in liquid is improved by increasing surface area and decreasing settling height associated with the sedimentation process. Domestic and industrial wastewater treatment facilities have used high-rate lamella settlers to provide for more efficient particle settling. However, their efficiency in providing treatment while installed within a construction site sediment basin has not been previously evaluated.
The principle of high-rate settling is to increase the available surface area associated with the process of sedimentation. Inclined plates are also used to decrease the vertical distance a particle travels before settling onto the surface of the plate. Planar surfaces, referred to as lamellas, are positioned at an angle to facilitate the sliding of particles from the plate to the bottom of the basin. Inclined settling systems are used in one of three flow directions: countercurrent (upward flow), concurrent (downward flow), and cross-flow (parallel flow). Lamella settlers function best when the mean velocity between the inclined surfaces results in a Reynolds number below 800 (i.e., laminar flow). The time required for a particle to settle the vertical distance between two plate surfaces is calculated as a function of the plate spacing (settling distance) and settling velocity [36].
The first lamella configuration was applied in the upward flow condition. Figure 1a shows an aerial view of the lamella settler installed in the third bay of the basin during an experiment. Eight individual units were fabricated using galvanized steel tubing and plates, and installed to create a system of four tanks stacked two rows in height (Figure 1). Wing walls were constructed out of lumber and installed in the upstream face to force water through the opening at the bottom of the lamella system, as indicated by blue arrows in Figure 1b. Flow was directed up the plates and out the sides of the tanks along the openings, as shown by red arrows in Figure 1b.
The second lamella configuration was performed in the parallel flow condition. The eight units were removed from the basin, cleaned, and reinstalled at a 90-degree rotation to allow flow to travel in the cross-current direction, as shown in Figure 1c. For both orientations, wing walls were fabricated and gaps between settlers were sealed using strips of sheet metal, silicone caulk, and expanding insulating foam to prevent short-circuiting. Schematic cross-section and profile views of A-A and B-B planes in Figure 1 for the lamella settler units constructed and used in this study are given in Figure 2a,b to provide basic geometry information.
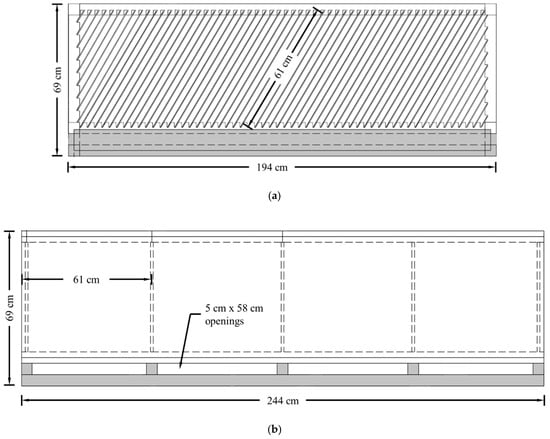
Figure 2.
(a) Cross-section and (b) profile view of lamella settler design.
3. Methodology and Testing Regime Summary
An experimental design and testing regime was developed to mimic typical conditions to be expected on linear construction sites. The apparatus consisted of two primary components: (1) a 27.4 m (90 ft) tied concrete block armored inflow channel, and (2) a 79.0 m3 (2790 ft3) geotextile lined trapezoidal sediment basin. The basin was constructed to ALDOT standard requirements [30,37] and is comparable in volume capacity of sediment basins used on construction sites. Depending on sizing guidance, the basin used in this study would be capable of treating up to 0.6 ha (1.6 ac) of contributing drainage area [11]. The inflow channel conveys sediment-laden flow into the sediment basin and includes an enhanced rip-rap ditch check intended to reduce channel velocity and shear stress, while facilitating the capture of rapidly settable solids prior to flow reaching the basin [30,38]. The sediment basin included: four individual bays separated by three rows of wire backed coir baffles, a 3.8 cm (1.5 in.) floating surface skimmer located in the fourth bay, and an auxiliary spillway to allow for conveyance of excessive inflow that exceeds the basin volume, shown in Figure 1a.
Stormwater runoff simulation was performed by introducing a constant flow of water (0.042 m3/s (1.50 ft3/s)) and soil (20.5 kg/min (45.2 lb./min)), creating a consistent concentration of sediment-laden flow. Water and sediment were mixed and introduced at the head of the channel at for a period of 30 min. Sediment introduction was achieved by metering a well-mixed loam soil consisting of 46.9% sand, 28.1% silt, and 25.0% clay through a modified grain auger. Water was pumped from a storage pond into a valve-fitted equilibrium tank that allowed for controlled metering through a rectangular weir. A mixing trough downstream of the introduction point provided adequate agitation to create sediment-laden stormwater. This introduction rate was selected to represent the most conservative sediment basin sizing approach, using 11.3 cm (4.43 in.), 2-year, 24-h design rainfall depth with a Type III Soil Conservation Service distribution for a 0.098 ha (0.242 ac) contributing drainage area. Further details on the design and construction of the flow introduction apparatus, including details on flow and sediment introduction rate determination using hydrologic and soil loss modeling techniques, are provided in Perez et al. (2016) [11].
An experimental testing regime was developed consisting of seven series of evaluations (S1 through S7) with a total of 27 tests (three replicate runs for each series: L1, L2, and L3), as shown in Figure 3a. As experimental data were analyzed following the series of tests, modifications to the regime were made to provide the most effective means of evaluating treatments. The first test within each series, L1, started with a clean and empty basin, free of sediment. Subsequent tests (i.e., L2 and L3) were conducted after the basin had completely dewatered, however sediment settled from preceding tests was not removed. Basin performance was evaluated based upon the exposure of the three tests, which mimics the installation of a new sediment basin at a construction without maintenance (i.e., sediment dredged) between subsequent storm events. Maintenance would be expected once sediment occupies 1/3 to 1/2 of the total storage volume [31].
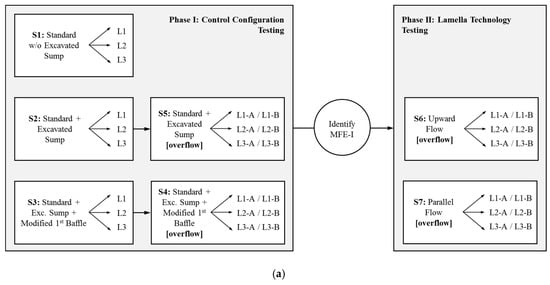
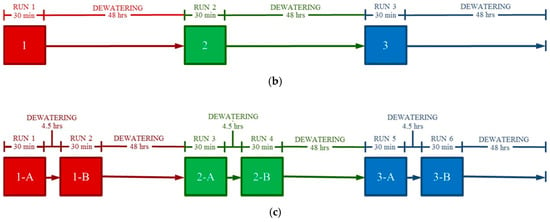
Figure 3.
(a) Sediment basin testing regime—27 total tests, (b) empty condition test sequence, and (c) overflow condition test series sequence.
Currently, the most conservative sediment basin design guidance calls for a hydrologic sizing approach using the local 2-year, 24-h event. Rainfall events contributing runoff volume exceeding the 2-year, 24-h design could create conditions of flow passing through the auxiliary spillway of the basin. Since basin dewatering through the floating surface skimmer is designed to last several days, subsequent rain events occurring while the basin is partially full could lead to spillway flow. In addition, basins are often times undersized or incorrectly installed, causing overtopping flow to occur [29]. To gain a better understanding of basin performance under the condition where capacity of the basin is exceeded, overtopping experiments were incorporated into the testing regime. These overtopping tests (i.e., S4–S7), were comprised of a set of three replicate fill, partially empty, and overtop cycles (L1-A through L3-B), totaling six test runs per evaluation. Part A of each of these evaluations filled the basin completely without overtopping. Part B began once 30% of the volume within the basin from the Part A test had dewatered, resulting in 70% of the Part B test inflow passing through the auxiliary spillway. Volumetrically, the basin was 70% full when the stage reached 0.77 m (2.55 ft), corresponding to a basin volume of 47.9 m3 (1691 ft3). Figure 3b,c provides a sequence of the two test regimes (i.e., basin empty condition and overflow condition). All tests, regardless of series type, were conducted with a 0.042 m3/s (1.50 ft3/s) flow rate and 20.5 kg/min (45.2 lb./min) sediment introduction rate for a 30 min duration.
Test series S1 and S2 were conducted to provide sediment basin performance comparisons when an excavated sump was included as a forebay in the inflow channel. The inclusion of the sump in subsequent testing (S3 through S7) was determined from performance data comparisons. Once the use of an excavated sump was assessed, the next series of tests (S3) evaluated a modified first baffle system installed between the first and second bay. Both configurations with the excavated sump and modified first baffle were further evaluated under the overtopping testing condition (S4 and S5). Between the configurations using a sump and modified first baffle, the most feasible and effective installation (MFE-I) was selected to proceed with further testing. The MFE-I was then evaluated under the overtopping test condition (S5).
The second phase of testing focused on deploying high-rate lamella settling technology within the third and fourth bays of the basin (Figure 1a). Two flow-orientation configurations of the technology were tested within the basin (i.e., upward and parallel flow configurations) and each was evaluated under an overtopping series of tests (S6 through S7). The designed testing regime allowed for direct comparisons between the MFE-I (S5) and the use of the high-rate settlers tested in both configurations (S6 and S7).
Data Collection
Data collected during testing provided a comparative means of performance between the varying basin configurations. Water quality, flow rates, basin stage levels, and sediment deposition volumes, were collected during and after tests. Three Campbell® Scientific OBS3+ turbidity sensors with logging capabilities were placed Bays 1, 2, and 4. The turbidity sensors have a reported accuracy of 2% of the reading, and were programmed to take a reading at two-minute intervals throughout the duration of the experiments and dewatering periods. Three Onset HOBO® water level pressure transducers (U20-001-04) were used during testing to accurately monitor the stage of the basin throughout the duration of the experiments. Two loggers were used within Bay 4 and the third was placed on the spillway weir during overflow experiments. Water sampling was only conducted during initial tests and was used to validate turbidity sensor results and to establish turbidity and TSS relationships. While TSS can be a more accurate representation of suspended particulates, turbidity is preferred in inspections of erosion and sediment control practices due to the ability to characterize fine sized soil particles that contribute to water quality impacts. In addition, turbidity has the advantage of allowing for field measurement without the requirement for sample collection and laboratory post-processing. Previously established TSS and turbidity relationships allow for the use of turbidity as a surrogate measure of suspended sediment concentration. Grab samples were obtained by five automated Teledyne ISCO 6712 full-size portable samplers, one per each of the four bays within the basin and an additional sampler near the bottom of Bay 2 to measure water quality differences between the top and bottom of the water column. Tubing for automated sampling, as well as the turbidity sensors were mounted to custom built floating skimmers in the center of each of the first three bays, and on the floating surface skimmer in the fourth bay. Sampling and data collection points are depicted in Figure 1a as “A” (Bay 1), “B” (Bay 2), and “Skimmer”. This approach allowed samples and readings to be taken at the surface of the sediment basin at all times, regardless of stage within the basin. Sample collection and turbidity readings were triggered once the stage in the basin reached the height of the floating skimmers.
4. Results
The sediment basin performed similarly over the course of three replicates (i.e., L1, L2, L3 in Figure 3a). Turbidity data described in this section are the average readings over replications for all configurations. Table 1 provides descriptive statistics of turbidity measured across the sediment basin for the evaluated configurations and includes a measurement of decay, or the measured decrease in turbidity at the beginning and end of the settling period (i.e., filling, rapid settling, and polishing, detailed in later in this section). Due to the relatively small sample size statistical significance was determined using t-tests at 90% confidence intervals. Table 2 provides a measure of effectiveness by comparing the average difference in turbidity between location (i.e., bay) and during the various settling stages of the experiment. Table 3 presents results of a multiple linear regression analysis conducted to determine significant differences across tested treatments. Figure 4 provides a graphical representation of turbidity ratio reductions for Bay 2/Bay 1 (Figure 4a) and Bay 4/Bay 1 (Figure 4b).

Table 1.
Descriptive Turbidity Statistics across Sediment Basin Treatments.

Table 2.
Turbidity Treatment Difference across Sediment Basin Treatments.

Table 3.
Statistical Relationship of Evaluated Treatments by Settling Period.
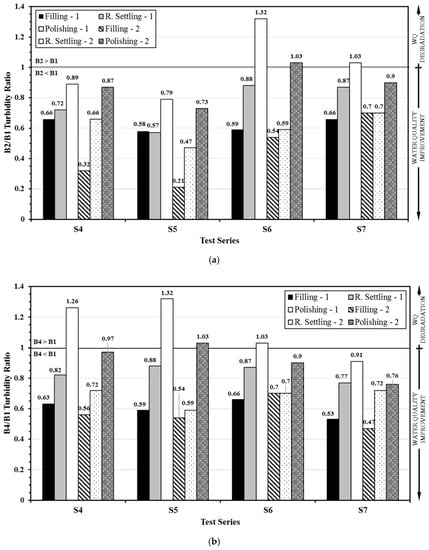
Figure 4.
Turbidity reduction ratios (a) Bay 2/Bay1, and (b) Bay 4/Bay 1. Note: S1: standard w/o sump, S2: standard w/sump, S3: mod. 1st baffle, S4: mod. 1st baffle (overflow), S5: standard w/sump (overflow), S6: lamella upward (overflow), S7: lamella parallel (overflow).
4.1. Standard Configuration
The first series of tests (S1) conducted in the sediment basin was the standard configuration without the inclusion of an excavated sump in the inflow channel. This evaluation was considered the base against all other configuration (i.e., S2–S7). The average turbidity results of the three runs were obtained from sensors used in Bays 1, 2, and 4 and are plotted on Figure 5a. From the plot, there are three evident trends visibly discernable from the slope of the plotted turbidity values. The first 30 min of the experiment, when flow and sediment were introduced into the sediment basin, can be referred to as the filling period when turbidity was high and relatively consistent with an average of 712 nephelometric turbidity unit (NTU) (standard deviation (SD) = 33 NTU) in Bay 1. Initial turbidity in Bay 2 and Bay 4 were less than those recorded in Bay 1 (averages of 676 NTU and 647 NTU, respectively), however turbidity sharply decreased to 308 and 380 NTU, respectively, at the conclusion of the 30-min filling period. After the filling period concluded, there was a sharp decrease in turbidity as water in the basin stilled, allowing for relatively large particles to quickly settle without turbulence. The rapid settling period extended from approximately 30 to 50 min, ending when the turbidity decay rate decreased greatly. During this period, average turbidity values decreased to 237, 197, and 295 NTU in Bay 1, Bay 2, and Bay 4, respectively. The sharp decrease in turbidity within Bay 1 (i.e., decay rate of 19.8 NTU/min) during the 20 min rapid settling period, indicated that turbulent inflow was the predominant factor resulting in elevated turbidity levels during the first 30 min of the test duration when sediment-laden flow was being introduced into the basin. Beyond the 50 min period, turbidity values continued to decay at a slow rate (finer sediment settles slowly), at an average of 0.16 NTU/min across all measured bays. This period is referred to as the polishing period. At the 12 h time frame, turbidity values were essentially identical within the three measured bays with an average value of 139 NTU (SD = 9.8 NTU), achieving an 84.1% reduction in initial inflow turbidity after detention.
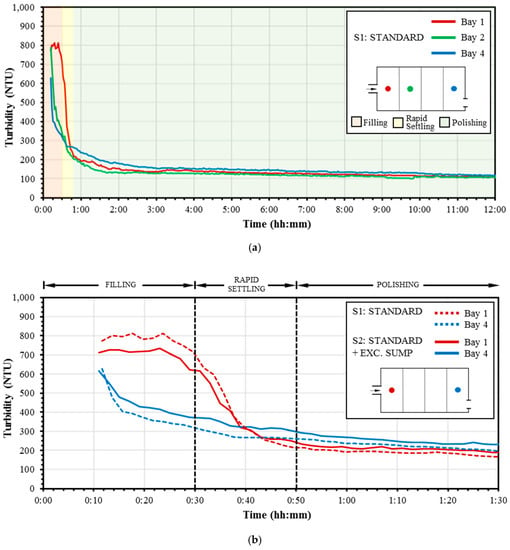
Figure 5.
(a) S1 standard configuration turbidity results and (b) comparison of S1 and S2 treatments.
4.2. Excavated Sump
The second configuration tested was the addition of an excavated sump in the inflow channel (S2). Recorded turbidity trends during the filling, rapid settling, and polishing period results were similar to that of the standard configuration (S1). The initial turbidity in Bay 1 was lower than in S1 (Figure 5b), averaging 698 NTU during the 30 min. filling period. After 12 h of settling, the average turbidity in the basin was 137 NTU across the three bays, higher than values seen in S1. The turbidity treatment efficiency across the basin was 80.3% between the initial inflow and 12 h outflow.
A comparison of measured turbidity differences within the first 90 min of testing between S1 and S2 configurations is shown in Figure 5b. From the plot, it is evident that the S2 configuration had lower turbidity in Bay 1 during the filling period, however turbidity in Bay 4 during the same period was higher than it was during the configuration without the excavated sump, S1. After the filling period, the turbidity for both configurations respond similarly. Multiple linear regression analyses were conducted to evaluate the effect of the independent variables (i.e., excavated sump, modified first baffle, lamella settler in upward or parallel flow, and overflow test condition) on the dependent variables (i.e., turbidity ratios: Bay 4/Bay 1 and Bay 2/Bay 1). Data were separated into the filling, rapid settling, and polishing period and the average turbidity ratios throughout those periods was used for the analyses. The results from the analyses are summarized in Table 3. Results indicated with 90% confidence that the addition of the excavated sump in the channel had no significant difference on turbidity reduction effectiveness between bays in neither the filling, rapid settling, nor polishing periods.
Perez et al. [11] provided preliminary results for S1 and S2 testing and included sediment deposition photographs and sediment containment by bay. By weight, the S2 excavated sump treatment, which creates a forebay in the channel upstream of the ditch check, captured approximately 1.6% more sediment than the S1 standard configuration, without the excavated sump. Furthermore, an additional 3.3% of sediment was captured within Bays 1 through 4 when the sump was present. These differences in capture effectiveness would be difficult to correlate to the addition of the sump without additional replicate tests for statistical comparison [11].
The inclusion of the excavated sump was observed to have no significant difference in the performance of the sediment basin from a water quality standpoint. It is likely that the riprap ditch check provides the primary means of sediment capture in the channel as it creates velocity reductions and impoundment, allowing rapidly settable particles to be captured upstream of the practice [38]. However, the inflow channel without the inclusion of the ditch check was not evaluated, but should be considered in future research to understand the significance of the ditch check. Due to the additional sediment storage volume and maintenance accessibility provided, the excavated sump was left in place for subsequent tests.
4.3. Modified First Baffle
The third series of testing was the configuration with the modified first baffle. The configuration was subjected to three back-to-back 30-min events. Results from the modified baffle configuration (S3) were compared to the standard baffle configuration (S2), as both configurations were performed with the excavated sump in the channel.
Visual observations during testing showed that use of the modified first baffle resulted in less turbulence in Bay 2 and Bay 3 when compared to configurations using the standard first baffle. Turbidity results obtained from sensors were compared between Bay 1 and Bay 2. The modified baffle configuration (S3) had turbidity measurements approximately 100 NTU higher in both Bay 1 and Bay 2 during the filling and rapid settling periods when compared to turbidity in the configuration with the standard baffle (S2), however this difference was not found to be statistically significant.
To further compare turbidity results, Bay 2 turbidity was divided by Bay 1 turbidity for each reading, to determine the efficiency in turbidity reduction between the two bays, as plotted in Figure 6a. Calculated ratios below 1.0 indicate a reduction in turbidity from Bay 1 to Bay 2, while ratios above 1.0 indicate an increase in turbidity. A multiple linear regression analysis indicated the modification of the first baffle significantly decreased the turbidity reduction effectiveness between Bays 1 and 2 (i.e., Bay 2/Bay 1 ratio) during the filling, rapid settling, and polishing periods, as summarized in Table 3.
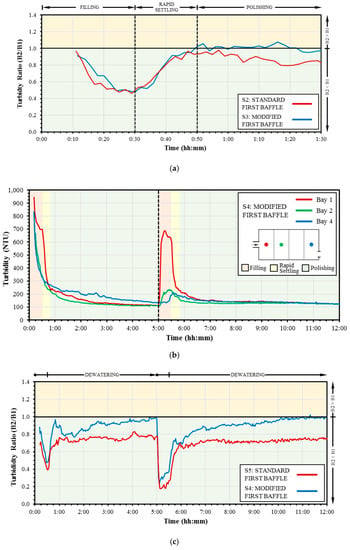
Figure 6.
Turbidity results comparison between bays for modified baffle treatment; (a) B2/B1 turbidity ratio comparison of S2 and S3 treatments, (b) modified first baffle, S4, turbidity, and (c) B2/B1 turbidity ratio comparison of S4 and S5 treatments.
4.4. Overflow Tests
Overflow tests were conducted on both the standard first baffle (S5) and modified first baffle (S4) installation configurations. The purpose of these tests was to evaluate how baffles influenced the performance of the basin during conditions that exceed the storage volume of the basin, forcing flow through the auxiliary spillway. Turbidity data for the modified first baffle configuration (S4) is shown in Figure 6b. The data statistically follow the same pattern that was observed in the single test series (S2 and S3), where turbidity values between Bay 1 and Bay 2 are unchanged for the modified first baffle configuration (S4), as shown in Figure 6a. In contrast, there is a discernable difference between turbidity in Bay 1 and Bay 4 with the standard first baffle configuration (S5). For both S5 and S4, the turbidity in Bay 1 between the polishing period and second filling cycle (i.e., 5:00 to 5:30) increased by an average of 491 NTU. However, turbidity in Bay 2 only experienced a gradual increase in turbidity (average of 49 NTU for both S5 and S4). This significant difference indicates that Bay 1 has the most influence in absorbing the turbidity influx from a subsequent runoff inflow and further illustrates how the first baffle system is the most important in confining turbidity to Bay 1. At the beginning of the overflow test, the sediment basin was 70% full, (i.e., the stage reached 0.77 m (2.55 ft) and corresponding basin volume was 47.9 m3 (1691 ft3) therefore, this ponding volume allowed inflow momentum to dissipate within the first bay (i.e., 3.4 m (11 ft) into the basin) limiting turbidity increases to this section. This finding can also infer the importance of the forebay, meaning if the forebay is deep and large enough, it can potentially dissipate flow momentum and capture sediment, but further investigation is needed.
The ratio between Bay 2 and Bay 1 turbidity was compared in Figure 6c for the two configurations, each normalized by dividing by Bay 1 turbidity. Results from the comparison show that the standard first baffle configuration (S5) outperformed the modified first baffle configuration (S4), further validating results from the single fill experiments, S2 and S3. During the filling period (i.e., 00:00 to 00:30 and 5:00 to 5:30) and the polishing periods (i.e., 00:50 to 5:00 and 5:50 to 12:00), the average performance difference between the configurations show that the standard first baffle is 26.5% and 19.5% more effective at reducing turbidity between Bay 1 and Bay 2, respectively. The multiple linear regression analysis (Table 3) indicates tests conducted with the basin partially full (i.e., overflow experiments conducted in S4 through S7) resulted in an improvement in turbidity ratios (i.e., Bay 4/Bay 1 and Bay 2/Bay 1) across the filling, rapid settling, and polishing periods. In addition, an analysis of variance (ANOVA) indicated all experiments conducted with the basin partially full provided increased reduction in turbidity across the basin (i.e., Bay 4/Bay 1 ratio) at a 90% confidence level. These results corroborate past research studies [12,39] that identified diminishing returns with decreased baffle POA.
4.5. Phase II: Lamella Technology Testing Results
Due to results from control configuration testing (Phase I), it was determined that the standard sediment basin configuration with the excavated sump in the channel was the MFE-I. This configuration was used for testing lamella settlers in the two configurations (i.e., upward flow and parallel flow). Furthermore, it was determined that data obtained from the overflow configuration tests provided more comparative data than the tests performed with the single fill condition. Overflow tests had the advantage of providing turbidity data during both empty conditions (i.e., initial fill), and during partially filled conditions, allowing researchers to compare performance during both scenarios. In addition, overflow tests allowed the researchers to track performance during conditions where the basin was partially filled, simulating realistic conditions where not-yet-discharged runoff from previous rainfall events would occupy the storage volume of a sediment basin on a construction site. Therefore, only overflow type tests were performed for Phase II evaluations. Figure 6b and Figure 7a show the turbidity plots for the two lamella configurations.
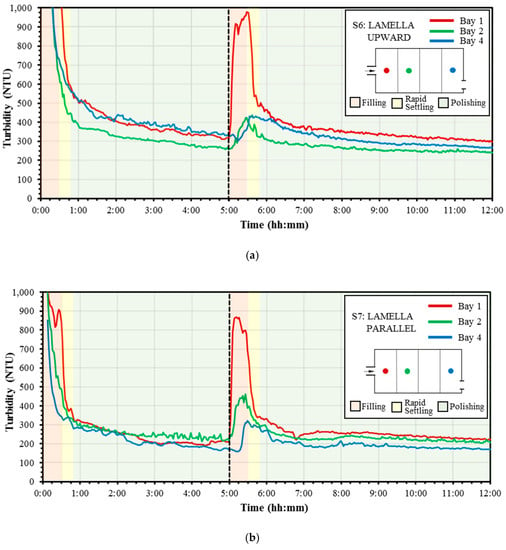
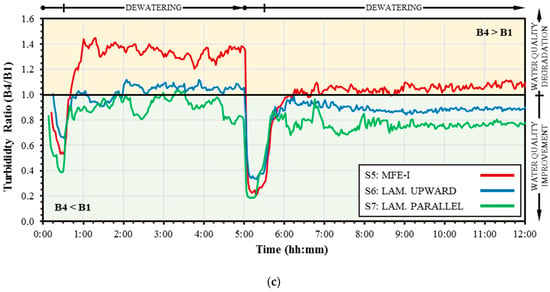
Figure 7.
(a) Turbidity results for lamella settlers in upward flow configuration, S6, (b) turbidity results for lamella settlers in parallel flow configuration, S7, and (c) B4/B1 turbidity ratio comparison of S5, S6, and S7 treatments.
The lamella system had significant effect on the water quality behavior of the sediment basin in either configuration. Interestingly, the turbidity for both configurations was significantly higher than turbidity observed in Phase I testing. This difference may be attributed to temperature influences on water viscosity and soil particle settling velocity. To evaluate the efficiency of the system in reducing turbidity across the basin, a ratio of Bay 4 turbidity to Bay 1 turbidity is plotted in Figure 7c for the MFE-I (S5) and the two lamella configurations (S6 and S7). When comparing turbidity ratios between Bay 1 and Bay 4, it is evident that the lamella parallel flow configuration outperformed the lamella upward flow configuration and the MFE-I configuration. The lamella upward flow configuration performed better than the MFE-I only during dewatering periods (i.e., 00:30 to 5:00 and 5:30 to 12:00). Turbidity in Bay 4 was higher throughout the dewatering periods for the MFE-I configuration and reduction between Bay 4 and Bay 1 was only observed during the polishing period when the lamella plates were added to the sediment basin. During the filling periods (i.e., 00:00 to 00:30 and 5:00 to 5:30), the lamella system in the upward flow configuration (S6) compared to the MFE-I (S5) had a decrease in performance of 36.6%. However, during the polishing periods (i.e., 00:50 to 05:00 and 05:50 to 12:00), the lamella system in the upward flow configuration (S6) outperformed the MFE-I (S5) by 18.2%. The average increase in performance for the lamella system in the parallel flow configuration (S7) compared to the MFE-I (S5) was 6.5% during the filling periods (i.e., 00:00 to 00:30 and 5:00 to 5:30) and 29.0% during the polishing periods (i.e., 00:50 to 05:00 and 05:50 to 12:00). A multiple linear regression analysis (Table 3) indicated the lamella settlers provided significant improvement to the Bay 4/Bay 1 turbidity treatment ratio only during the polishing period of the experiments, as the lamella settlers provides increased effective surface area and decreased settlement depth of flow passing towards the slowly discharging floating surface skimmer in Bay 4.
5. Conclusions and Discussion
This study has shown the results of seven different configurations evaluated in a 79.0 m3 (2790 ft), large-scale sediment basin apparatus conducted in an effort to improve current practices and to achieve greater in-field performance. A phased testing regime provided evaluation of: (1) the standard configuration, (2) the addition of an excavated sump upstream of a ditch check, (3) the modification of the first baffle, (4) a high-rate lamella settler in upward flow, and (5) a high-rate lamella settler in parallel flow. Under the developed regime, the basin was subjected to 27 tests in eight series to evaluate configurations under replicated events and overtopping conditions. Turbidity was the predominant factor used to evaluate the performance of various tested practices in the basin.
Table 1 presents descriptive statistics for each bay and period across all tested configurations. Results showed that the use of an excavated sump before the ditch check in the channel had no significant effect on water quality treatment in the basin. Furthermore, the use of a modified coir first baffle with 10.9% POA was shown statistically to be less effective in treating turbidity than the standard baffle configuration. The MFE-I was determined to be the standard configuration with excavated sump in the channel. The MFE-I was used for Phase II testing of the high-rate lamella settlers in the upward and parallel flow configurations. Based on turbidity measurements, both high-rate settler configurations treated stormwater more effectively than the MFE-I system without the settlers. The parallel flow configuration outperformed the upward flow and MFE-I configuration by a reduction in turbidity of 18.2 and 29.0%, respectively as the basin was dewatered. During all of the overflow tests performed, the sediment basin had a higher turbidity treatment efficiency during overtopping event then did during the empty-basin fill condition. This indicates that including dead storage in the basin, such as with wet detention ponds, is important to provide dilution to highly turbid receiving flows, dissipating kinetic energy and decreasing turbulence, reducing resuspension of settled particles at the bottom of the basin.
It is important to note that the results documented in this study are dependent on the installation of upstream supporting practices within the sediment basin system (i.e., baffles and sump upstream of lamella settlers). Results from this research can serve as a foundation for additional work to optimize the use of lamella settlers and improve the effluent quality of sediment basins. In particular, the following should be investigated:
- The reduction of the POA provided a decrease in turbidity reduction effectiveness, further studies are needed to investigate the relationship between various baffle POA and corresponding turbidity reductions to optimize baffle design recommendations.
- Results from the high-rate lamella settler configurations show that improvements can be made to the physical capture of sediment within basins. Research evaluations considering coarser grained soils and the use of flocculants (i.e., polyacrylamide) should be investigated as enhanced sediment capture effectiveness of the lamella configurations can be expected.
- Future research is needed to further optimize the design and treatment efficiency of the settlers. In addition, constructability of the settlers needs to be evaluated, considering a design to account for installation ease, and for sediment removal from the settler units and the basin itself. The lamella settlers used in the study were fabricated in a cost-efficient manner, with galvanized steel being used due to the ease and cost of construction. If this technology were to be adopted for use with sediment basins, alternative construction materials could be more economical when the settlers are mass produced or intended for longer periods of usage (i.e., PVC, HDPE, stainless steel, aluminum, etc.). The potential contribution of additional pollutants (i.e., leaching of zinc from metal settlers) should also be considered.
- Furthermore, temperature influence on sediment basin performance should be evaluated, as results from this study indicated settling rates may have been affected by temperature variations and water viscosity. The effect of temperature could influence detention time considerations or the addition of flocculants to increase sedimentation efficiency.
While further research would provide guidance for the optimization of sediment basins, the results from this study should lead to improved design standards that practitioners can refer to when incorporating sediment basins as an element of the stormwater pollution prevention plan for construction sites.
Author Contributions
conceptualization, J.G.V., X.F., and W.C.Z.; methodology, M.A.P., W.C.Z., J.G.V., and X.F.; software, M.A.P.; validation, J.G.V. and X.F.; formal analysis, M.A.P.; investigation, M.A.P.; resources, W.C.Z.; data curation, M.A.P.; writing—original draft preparation, M.A.P.; writing—review and editing, W.C.Z., X.F., and J.G.V.; visualization, M.A.P.; supervision, W.C.Z.; project administration, J.G.V.; funding acquisition, J.G.V.
Funding
This research was funded by the Auburn University Highway Research Center and the Alabama Department of Transportation.
Conflicts of Interest
The authors declare no conflict of interest. The funders had no role in the design of the study; in the collection, analyses, or interpretation of data; in the writing of the manuscript, or in the decision to publish the results.
References
- Perez, M.A.; Zech, W.C.; Donald, W.N.; Fang, X. Methodology for Evaluating Inlet Protection Practices Using Large-Scale Testing Techniques. ASCE J. Hydrol. Eng. 2014, 20, 04014049. [Google Scholar] [CrossRef]
- Zech, W.; McDonald, J.; Clement, T. Field Evaluation of Silt Fence Tieback Systems at a Highway Construction Site. Pract. Period. Struct. Des. Constr. 2009, 14, 105–112. [Google Scholar] [CrossRef]
- Zech, W.; Halverson, J.; Clement, T. Intermediate-Scale Experiments to Evaluate Silt Fence Designs to Control Sediment Discharge from Highway Construction Sites. J. Hydrol. Eng. 2008, 13, 497–504. [Google Scholar] [CrossRef]
- Methodology for Analysis of Detention Basins for Control of Urban Runoff Quality; United States Environmental Protection Agency: Washington, DC, USA, 1986.
- Alabama Department of Transportation. Standard Specifications for Highway Construction. 2018. Available online: https://www.dot.state.al.us/conweb/pdf/Specifications/2018StandardSpecificationsCompleteBook.pdf (accessed on 6 February 2018).
- North Carolina Department of Environmental Quality. North Carolina Erosion and Sediment Control Planning and Design Manual. 2013. Available online: https://deq.nc.gov/about/divisions/energy-mineral-land-resources/energy-mineral-land-permit-guidance/erosion-sediment-control-planning-design-manual (accessed on 6 February 2018).
- Erosion Control Technician Reference Manual; Iowa Department of Transportation: Ames, IA, USA, 2017.
- State of Florida Erosion and Sediment. Control—Designer and Reviewer Manual; Florida Department of Environmental Protection, Florida Department of Transportation: Tallahassee, FL, USA, 2007.
- McLaughlin, R.A.; Hayes, S.A.; Clinton, D.L.; McCaleb, M.M.; Jennings, G.D. Water Quality Improvements using Modified Sediment Control Systems on Construction Sites. Trans. ASABE 2009, 52, 1859–1867. [Google Scholar] [CrossRef]
- Evaluating Sediment Capture Rates for Different Sediment. Basin Designs; North Carolina Department of Transportation: Raleigh, NC, USA, 2007.
- Perez, M.A.; Zech, W.C.; Fang, X.; Vasconcelos, J.G. Methodology and Development of a Large-Scale Sediment Basin for Performance Testing. ASCE J. Hydrol. Eng. 2016, 142, 04016042. [Google Scholar] [CrossRef]
- Christopher, S.T.; Helena, M.; Lubos, M.; Rich, M. Simulations of Distributed Watershed Erosion, Deposition, and Terrain Evolution Using a Path Sampling Monte Carlo Method; American Society of Agricultural and Biological Engineers: St. Joseph, MI, USA, 2004. [Google Scholar]
- Barrett, V.T.; Albert, J.R. Experimental Evaluation of Alternative Configurations for Floating Riser Sedimentation Basin Dewatering Devices. In Proceedings of the ASAE International Meeting, Sacramento, CA, USA, 29 July–1 August 2001. [Google Scholar]
- Barrett, V.T.; Albert, J.R. Experimental Evaluation of Novel Floating Risers for Sedimentation Basin Dewatering. In Proceedings of the ASAE International Meeting, Sacramento, CA, USA, 29 July–1 August 2001. [Google Scholar]
- McLaughlin, R.A.; Rajbhandari, N.; Hunt, W.F.; Line, D.E.; Sheffield, R.E.; White, N.M. The Sediment and Erosion Control Research and Education Facility at North Carolina State University; American Society of Agricultural and Biological Engineers: St. Joseph, MI, USA, 2001. [Google Scholar]
- Millen, J.A.; Jarrett, A.R.; Faircloth, J.W. Experimental Evaluation of Sedimentation Basin Performance for Alternative Dewatering Systems. Am. Soc. Agric. Eng. 1997, 40, 1087–1095. [Google Scholar] [CrossRef]
- Przepiora, A.; Hesterberg, D.; Parsons, J.E.; Gilliam, J.W.; Cassel, D.K.; Faircloth, W. Calcium Sulfate as a Flocculant to Reduce Sedimentation Basin Water Turbidity. J. Environ. Qual. 1997, 26, 1605–1611. [Google Scholar] [CrossRef]
- Przepiora, A.; Hesterberg, D.; Parsons, J.E.; Gilliam, J.W.; Cassel, D.K.; Faircloth, W. Field Evaluation of Calcium Sulfate as a Chemical Flocculant for Sedimentation Basins. J. Environ. Qual. 1998, 27, 669–678. [Google Scholar] [CrossRef]
- Rauhofer, J.; Jarrett, A.R.; Shannon, R.D. Effectiveness of Sedimentation Basins That Do Not Totally Impound A Runoff Event. Trans. Am. Soc. Agric. Eng. 2001, 44, 813–818. [Google Scholar] [CrossRef]
- Thaxton, C.S.; McLaughlin, R.A. Hydrodynamic and Sediment Capture Assessment of Various Baffles in a Sediment Retention Pond; American Society of Agricultural and Biological Engineers: St. Joseph, MI, USA, 2004. [Google Scholar]
- Bhardwaj, A.K.; McLaughlin, R.A. Simple Polyacrylamide Dosing Systems for Turbidity Reduction in Stilling Basins. Trans. ASABE 2008, 51, 1653–1662. [Google Scholar] [CrossRef]
- Bidelspach, D.A.; Jarrett, A.R. Electro-Mechanical Outlet Flow Control Device Delays Sediment Basin Dewatering. Appl. Eng. Agric. 2004, 20, 759–763. [Google Scholar] [CrossRef]
- Ehrhart, B.J.; Shannon, R.D.; Jarrett, A.R. Effects of Construction Site Sedimentation Basins on Receiving Stream Ecosystems. Trans. Am. Soc. Agric. Eng. 2002, 45, 675–680. [Google Scholar] [CrossRef]
- Engle, B.W.; Jarrett, A.R. Sediment Retention Efficiencies of Sedimentation Basin Filtered Outlets. Trans. ASAE 1995, 38, 435–439. [Google Scholar] [CrossRef]
- Fang, X.; Zech, W.C.; Logan, C.P. Stormwater Field Evaluation and its Challenges of a Sediment Basin with Skimmer and Baffles at a Highway Construction Site. Water 2015, 7, 3407–3430. [Google Scholar] [CrossRef]
- Fennessey, L.A.J.; Jarrett, A.R. Influence of Principal Spillway Geometry and Permanent Pool Depth on Sediment Retention of Sedimentation Basins. Trans. Am. Soc. Agric. Eng. 1997, 40, 53–59. [Google Scholar] [CrossRef]
- Griffin, M.L.; Barfield, B.J.; Warner, R.C. Laboratory Studies of Dead Storage in Sediment Ponds. Trans. Am. Soc. Agric. Eng. 1985, 28, 799–804. [Google Scholar] [CrossRef]
- Kang, J.; King, S.E.; McLaughlin, R.A. Impacts of Flocculation on Sediment Basin Performance and Design. Trans. ASABE 2014, 57, 1099–1107. [Google Scholar]
- Perez, M.A.; Zech, W.C.; Donald, W.N.; Fang, X. SEDspread: A Sediment Basin Design Tool for Construction Sites. ASCE J. Irrig. Drain. Eng. 2016, 142, 04016064. [Google Scholar] [CrossRef]
- Standard Best Management Practices; Alabama Department of Transportation: Montgomery, AL, USA, 2015.
- Zech, W.C.; Logan, C.; Fang, X. State of the Practice: Evaluation of Sediment Basin Design, Construction, Maintenance, and Inspection Procedures. Pract. Period. Struct. Des. Constr. 2014, 19, 04014006. [Google Scholar] [CrossRef]
- Thaxton, C.S.; Calantoni, J.; McLaughlin, R.A. Hydrodynamic Assessment of Various Types of Baffles in a Sediment Retention Pond. Trans. Am. Soc. Agric. Eng. 2004, 47, 741–749. [Google Scholar] [CrossRef]
- Thaxton, C.S.; McLaughlin, R.A. Sediment Capture Effectiveness of Various Baffle Types in a Sediment Retention Pond. Trans. Am. Soc. Agric. Eng. 2005, 48, 1795–1802. [Google Scholar] [CrossRef]
- Montgomery, J.M. Water Treatment Principles and Design; John Wiley & Sons Inc.: New York, NY, USA, 1985. [Google Scholar]
- Crittenden, J.C.; Trussell, R.R.; Hand, D.W.; Howe, K.J.; Tchobanoglous, G. MWH’s Water Treatment: Principles and Design; John Wiley & Sons, Inc.: New York, NY, USA, 2005. [Google Scholar]
- American Water Works Association. Water Quality and Treatment; McGraw-Hill: New York, NY, USA, 1999. [Google Scholar]
- Sedimentation Basin Recommendations; Alabama Department of Transportation: Montgomery, AL, USA, 2010.
- Donald, W.N.; Zech, W.C.; Fang, X.; Perez, M.A. A Hydraulic Method to Evaluate the Performance of Ditch Check Practices and Products. ASCE J. Hydrol. Eng. 2016, 21, 04016042. [Google Scholar] [CrossRef]
- Thaxton, C.S.; Calantoni, J.; McLaughlin, R.A. Hydrodynamic Assessment of Various Types of Baffles in a Sediment Detention Pond. In Proceedings of the Total Maximum Daily Load (TMDL) Environmental Regulations–II Conference, Albuquerque, NM, USA, 8–12 November 2003; p. 557. [Google Scholar] [CrossRef]
© 2019 by the authors. Licensee MDPI, Basel, Switzerland. This article is an open access article distributed under the terms and conditions of the Creative Commons Attribution (CC BY) license (http://creativecommons.org/licenses/by/4.0/).