Article

Hydro-Morphological Characteristics Using Flow Duration Curve, Historical Data and Remote Sensing: Effects of Land Use and Climate

1
School of Environmental and Rural Science, University New England, Armidale, NSW 2351, Australia
2
Central Queensland University, School of Health, Medical and Applied Sciences, Bundaberg Campus, University Drive, Bundaberg, QLD 4670, Australia
*
Author to whom correspondence should be addressed.
Water 2019, 11(2), 309; https://doi.org/10.3390/w11020309
Submission received: 8 January 2019 / Revised: 29 January 2019 / Accepted: 10 February 2019 / Published: 12 February 2019
(This article belongs to the Special Issue Environmental Flows, Climate Change and River Hydromorphology)

Abstract

:
Ecohydrological changes in large rivers of the world result from a long history of human dimensions and climate. The increasing human population, intensified land use, and climate change have led to a decline in the most critical aspect of achieving sustainable development, namely, that of water resources. This study assessed recent hydromorphological characteristics of the tropical Tana River in Kenya using flow duration curve, and geospatial techniques to gain a better understanding of human impacts over the last two decades and their consequences for new development projects. The results show that all extremal peak, low, and mean discharges exhibited significant increasing trends over a period of 17 years. Dam construction represents a 13% reduction of the maximum discharge and a 30% decrease in low flows, while post-regulation hydrological changes indicated an increase of 56 and 40% of high flows and low flows respectively. Dominant flow was observed to be higher for the current decade than the previous decade, representing a rise of the dominant streamflow by 33%. The assessment of four morphologically active sites at the downstream reach showed channel adjustments which support the changes in the flow regimes observed. The channel width increased by 8.7 and 1.9% at two sites but decreased by 31.5 and 16.2% for the other two sites under study during the time period. The results underscore the contribution of other main human modifications, apart from regulation, such as increased water abstraction and inter basin transfer, up-stream land use and anthropogenic climate change to assess the ecohydrological status in this river basin. Such streamflow regime dynamics may have implications on water resource management, riverine environments, and development of new water projects.

1. Introduction

For the past several decades, various water demand needs and socio-economic development in many countries have depended on rivers. However, in recent years, the impact of the human dimension on the natural streamflow regime and channel dynamics has become a major concern especially to downstream communities. The significant disruption of natural river discharge patterns and geomorphological processes induced by anthropogenic activities [1] and climatic forces may cause substantial changes in river systems [2,3] and the patterns of change and time-related response vary considerably from one river to another [4,5]. A change in a river’s ecohydrological processes may have consequences for riparian communities [6] including farmers and pastoralists, whose livelihoods are derived from the hydrosystem (river and riparian environment). These hydro-morphological processes have important implications on water resources availability, risk of floods, vegetation condition, and bio-geochemistry within the basin [7,8]. The streamflow at a river basin is the result of a complex combination of hydrometeorological and catchment characteristics and processes which vary with time because of anthropogenic interventions and natural propensity [9,10]. Understanding the ecohydrological processes is always not easy due to the random and stochastic nature of hydrological fluxes associated with the streamflow.
A flow-duration curve (FDC), typically constructed from historical field records, provides a convenient, simple, and powerful tool for studying the flow regime characteristics in a river basin under climate and land use change [8]. The FDC analysis is a method that involves the magnitude and frequency of historical flow data over a specified period and, therefore, provides a synoptic view of ecohydrological processes in a basin. Its application in water resources engineering, planning, and management is widely recognized [11]. The effects of land use change and variations in meteorological conditions on hydrologic conditions of a river for two non-overlapping time periods is often difficult to understand simply by studying long term streamflow hydrograph. However, FDC analysis can provide a useful method for detecting the change in the magnitude and frequency of streamflow values under these conditions. Rainfall-run off models have been widely used by many researchers worldwide to understand the effects of land use and climate on streamflow trends and subsequently plan water resources and land-use management practices. These models have their limitations and often reveal non-significant changes in streamflows, peak flows, and low flows under altered watershed characteristics and climate change, leading to the conclusion that they may not be reliable enough [12,13,14]. FDC’s long history and use of observation records in water-resource engineering still remains a robust method of solving problems related to the water-supply for irrigation in large irrigation schemes, hydropower generation, environmental flow requirements for habitat management and impacts of land use and climate changes [15,16,17]. It uses non-parametric quantile-estimation procedures as an alternative for estimating the magnitude and frequency of the complete continuum of a daily streamflow [18]. Other methods used in ecohydrological studies include statistical approaches and the evolving remote sensing and geospatial techniques which have lately found its place in hydromorphology [10,19,20,21,22]. Freely available satellite data are important in the understanding of the hydrological processes and channel margin forms along a river reach. Channel form changes are indicators of changing flow regimes and sediment transport in rivers [23].
In recent years there has been an increasing need for sustainable hydrological regimes in river basins without compromising the health and diversity of ecosystems while reducing the effects of floods and droughts. Multiple and conflicting water demands, uncertainties of fresh water supplies and demands due to changes in climate and watershed land use present a challenge in the water resources development and management decisions, especially in developing countries. Changes in flow regimes driven by the pursuit of these goals lead to devastating effects in downstream areas in the basin. The Tana River Basin (TRB) in Kenya is an example of basins where water conflicts, a reduction in riverine habitat diversity, and disruption of agricultural production systems associated with ecohydrological alteration characteristics have been reported [24,25,26]. In this basin, the construction of hydro-electric dams in the 1980s is the only variable assumed to have modified the flow regime of the river [27,28]. However, post-regulation hydro-morphological changes are largely unknown for this river basin.
The aim of this study is to understand recent changes in ecohydrological parameters, associated with upstream land use and climate change of the Tana River using FDC, historical data, statistical methods, and remote sensing techniques. The study contributes to the understanding of the anthropogenic climate change and land use impacts, and also provides a simple, rapid, and powerful methodological approach for assisting water stakeholders in identifying the flow regime components and formulating mitigation and management strategies. The specific objectives are to: (1) Study how anthropogenic alterations and human induced climate change have influenced the Tana River hydrological characteristics in recent years, (2) understand the dynamic ephemeral character of the river channel at a lower reach related to flow regime variabilities using satellite data and geospatial techniques, and (3) finally provide a discussion on the implications of these changes on water resources and new water projects. The information gathered may be useful in the development of new sustainable projects and river basin management systems.

2. Study Area and Methods
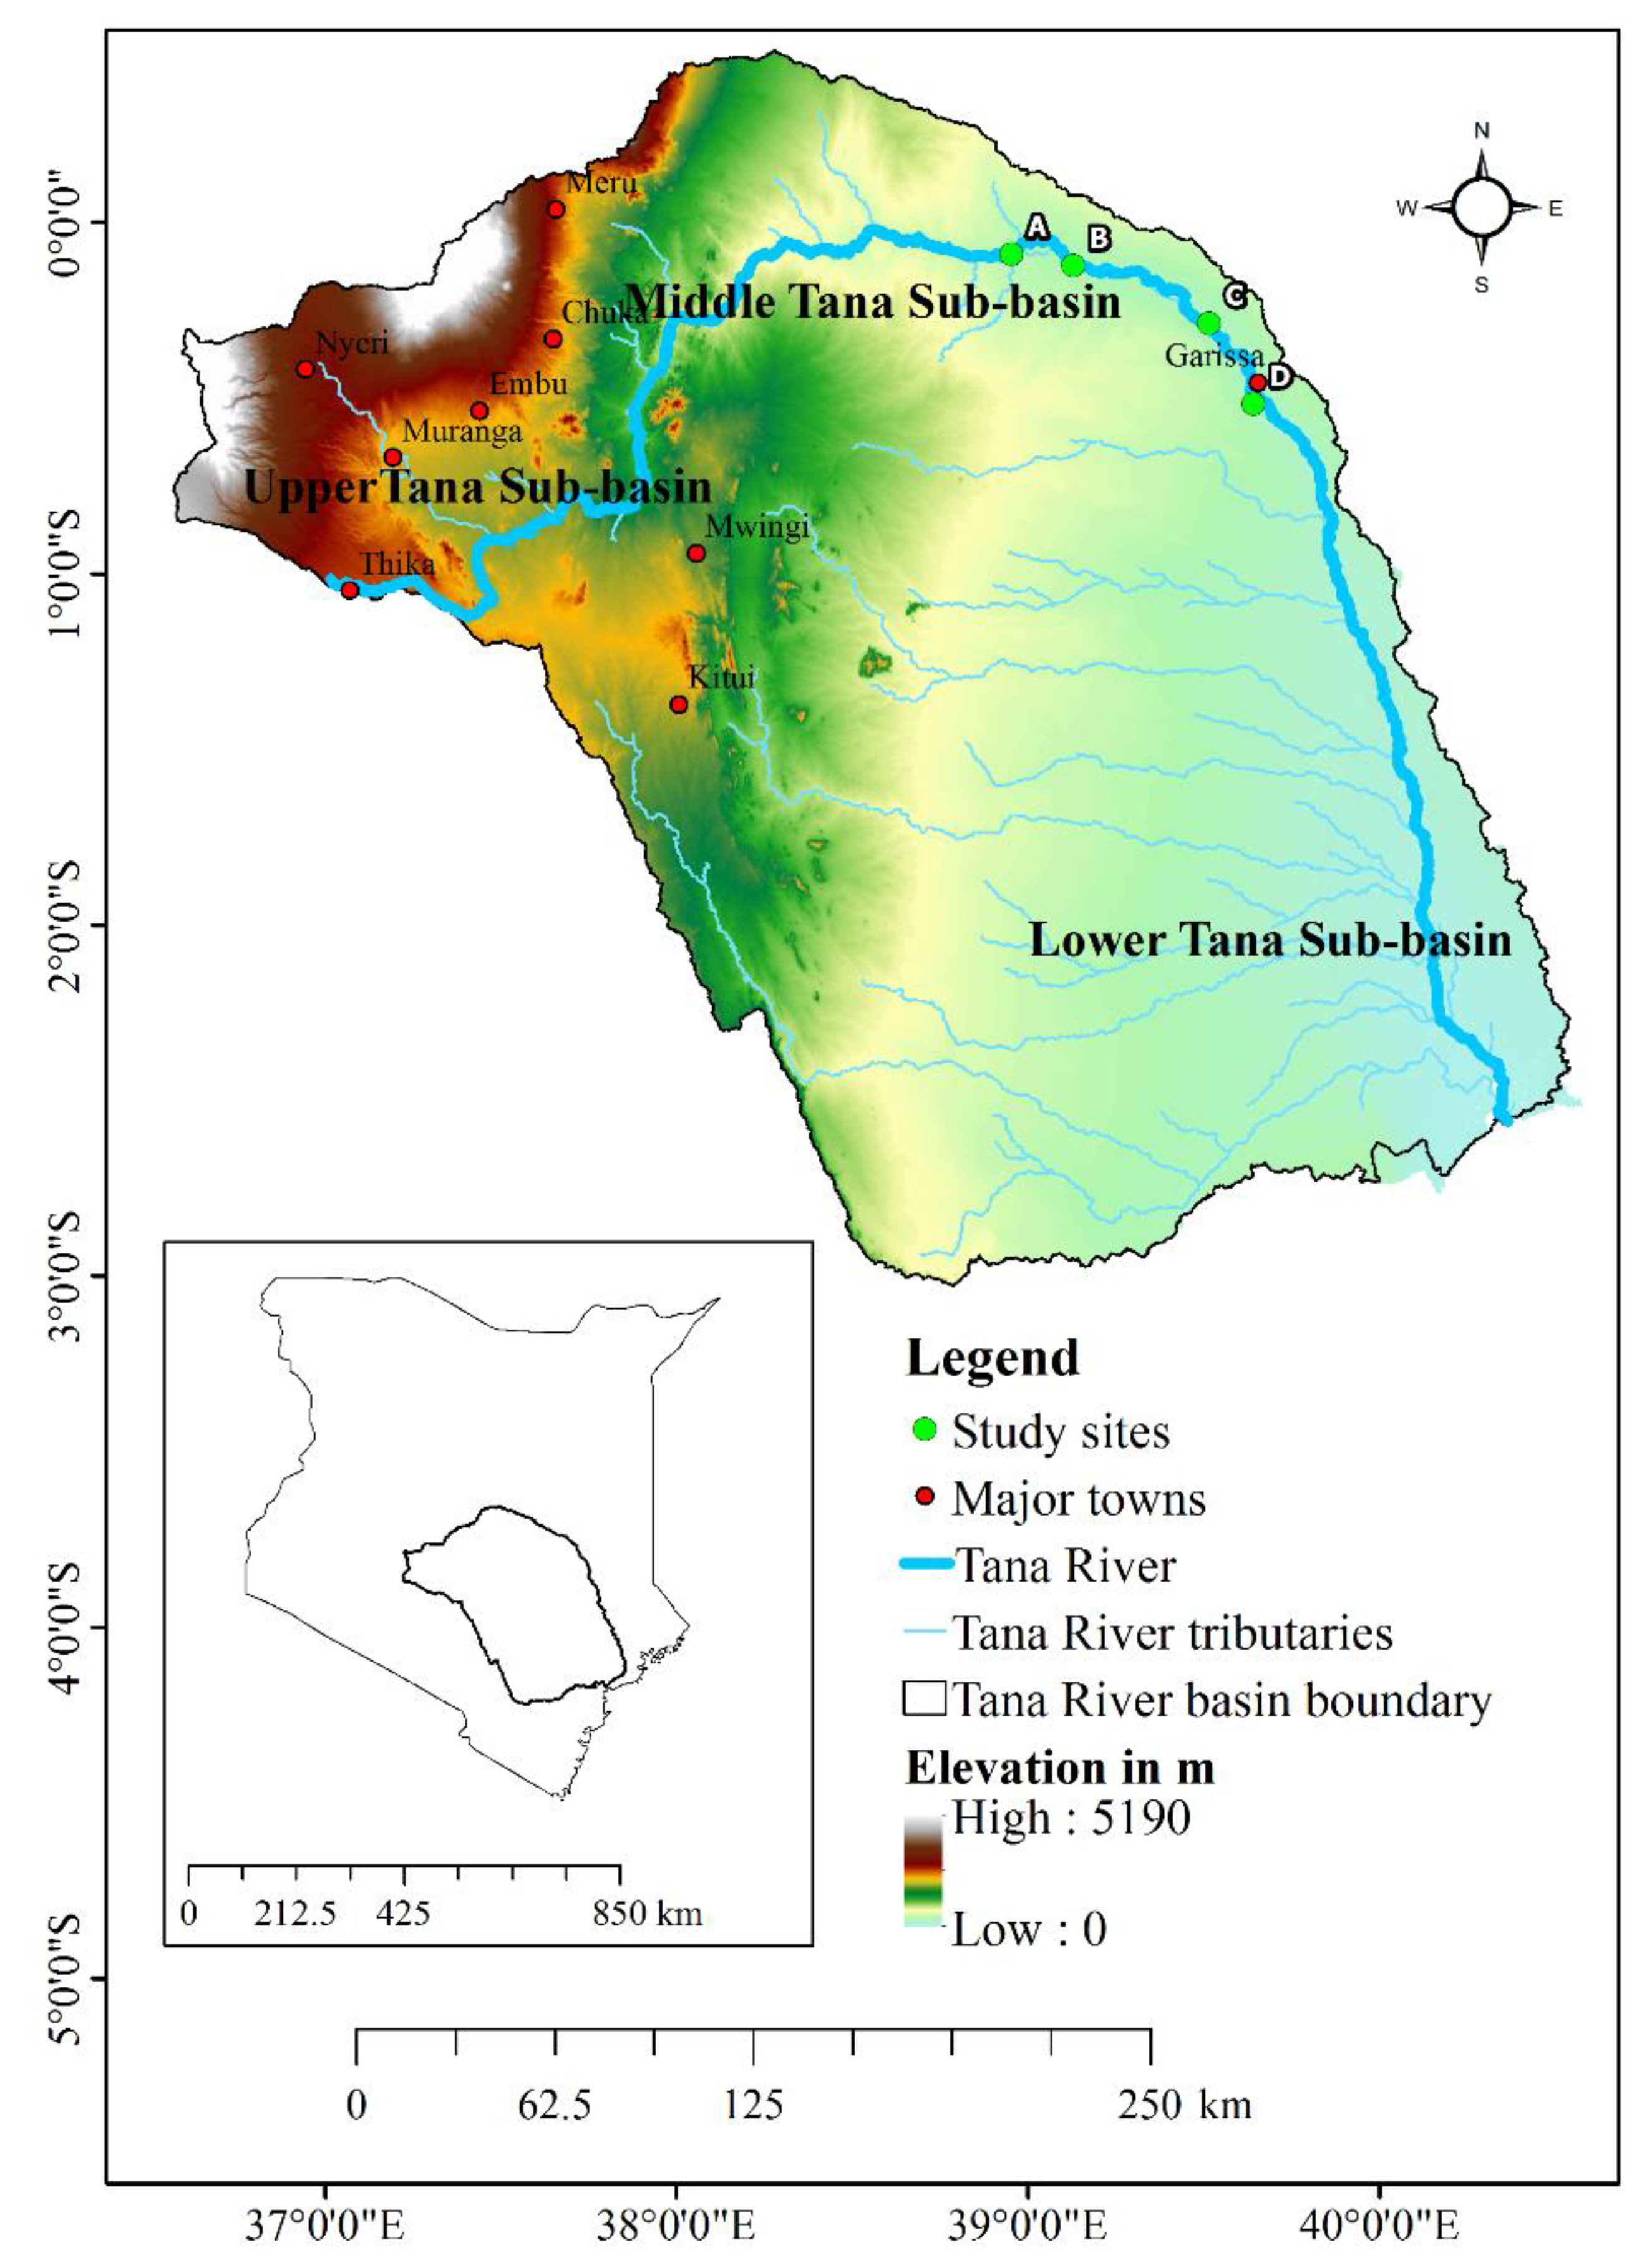
2.1. Study Area

The present study is about a tropical river, the Tana River, which is also the longest river in Kenya (Figure 1). The Tana River basin lies approximately between latitude 0°0′53″ and 2°0′41″ S, and longitude 38°25′43″ and 40°15′00″ E, and covers a catchment area of about 126,000 km2. The river traverses across various physiographical and climatic conditions in the basin, which is roughly divided into Upper, Middle and Lower Tana sub-basins. The Upper, Middle and Lower Tana sub-basins cover an area of 15,000, 15,700 and 95,300 km2, respectively, and corresponding elevations of 1000 m, 300–1000 m and below 300 m [29]. The Tana River Basin is characterised by different landscapes including forests, mountain vegetation, agro-systems, arid and semiarid lands, freshwaters and wetlands, marine, and coastal areas that are highly susceptible to inter-annual variability in river flow and climate change [30,31].
At the upper sub-basin, the soil is mainly volcanic, and the annual rainfall is high, making it suitable for rain-fed agriculture. This is an area where water resources are mainly used for agricultural irrigation, industrial (mainly through inter-basin water transfer) and hydropower. The Seven Forks hydropower schemes which provide about 567 MW [29] were built between 1968 and 1988 along the Tana River and form a cascade of five dams from upstream to downstream namely: Masinga, Kamburu, Gitaru, Kindaruma, and Kiambere dams within the sub-basin. Out of these, only Masinga and Kiambere, built in 1981 and 1988 respectively, represent significantly large reservoirs that can alter the Tana River hydrological regime, sediment transport and the magnitude and incidence of floods in the Middle and Lower Tana [28]. The other three are small reservoirs that cannot essentially regulate the Tana River [32].
The middle Tana sub-basin has humid to semi-arid conditions and its altitude rapidly decreases from 1000 m to 200 m above sea level. The soil is mainly composed of cambisols and alkaline rocks that can support dryland farming and the growing of crops such as cotton, tobacco, and beans [33,34]. Being a semi-arid to arid area, water resources are limited, but it is host to Meru National Park, Kora National Park and Rahole National Reserve, all located along this Tana River reach. The lower Tana River sub-basin stretches downstream from the Nyambene Hills along the Tana River which flows southeastward for approximately 700 km after descending from an elevation of 450 to 200 m from the Grand Falls to the Kora Rapids, a span of about 100 km, and thereafter gradually changing direction towards the south through the mangrove forests at the Tana Delta and finally emptying into the Indian Ocean [35]. This sub basin is mainly a semi-arid or arid low-lying floodplain. This catchment is dominantly open fields to wooded savannah grassland, with some riparian forests along the river. This floodplain is commonly partially flooded during high streamflows and continually receives fresh influxes of fertile soil. The area is arid with shrubs and scarcely vegetated but supports pastoralists and subsistence agriculture whose livelihoods are derived from the Tana’s floods.
Downstream of Kora, the Tana becomes a freely meandering alluvial river controlled by morphological processes [36] that have created an extensive floodplain. The Lower Tana sub-basin covers a large catchment and has intermittent streams flowing into the Tana River after Garissa Town with the main seasonal streams being Laga Tula, Laga Galole and Laga Tiva. These discharge in short pulsates only during the wet months. The Kenya government is planning new massive infrastructure projects and irrigation schemes (292,100 ha) to be implemented by the year 2030 along the reach of the river [37]. This floodplain is a major biodiversity hotspot which has been designated a Ramsar Site and which provides many livelihood opportunities to downstream communities and supports several endemic and endangered plant and animal species, including the red colobus and mangabey [38].

2.2. Methods

2.2.1. River Flow Regime Analysis

In this study, rainfall records for ten rainfall stations located upstream of the Garissa gauging station were obtained from Kenya’s Department of Meteorology (KMD). The rainfall records had varied lengths of observations from 1967 to 2016; the longest and shortest time of observation being 49 and 28 years, respectively. During this period, data recorded at ten gauges that were uniformly distributed throughout the upper basin were taken as simple arithmetic average of the gauge values. Historical daily discharge measurements (period 1941–2016) for the Tana River based on daily stage height recordings at Garissa gauging station were provided by Kenya’s Water Resources Management Authority (WRMA). This dataset represents the best and longest series of flow data with the Tana River and can be used to obtain actual floods for historic storms.
Characteristic discharges were calculated for the gauging station to identify and evaluate changes in the flow regime dynamics based on a flood frequency analysis for extreme flows and volumes. The mean annual discharge, annual peak flow, and dominant discharge parameters were extracted from the daily records for computation and evaluation. These three hydrologic parameters were selected as they represent hydrologically and geomorphologically significant dynamics. Minimum stream flows were also considered because they are significant for fine sediment transport and deposition and maintenance of in-stream and riparian ecosystem.
To examine hydrological patterns due to these human activities, a flow duration curve (FDC) was applied to firstly analyze high and low flow flood frequencies before and after the development of the two larger reservoirs and secondly, recent flow regime changes associated with other human modifications such as land use changes, urbanization and operation of upstream water storage and management facilities (Seven Forks dams), and water withdrawals for irrigation. FDC is constructed in such a way that two separate periods for the same catchment can exhibit different shapes because of variations in meteorological conditions (climatic factors) and changes in the basins land use (geophysical characteristics). For example, a catchment where intensified agriculture has occurred over time with an associated diminution of forest and grassland, both high and low flow can increase, leading to an overall increase in water yield in the river. For the effects of dams, we partitioned study years to represent pre-dam (before 1981 and post-dam—after 1988) periods when major reservoirs were constructed.
The rainfall and river discharge analysis was undertaken in RStudio (2014 version, Rstudio, Boston, MA, USA) [39]; an integrated development environment [40] for the R programming language [41]. The hydroTSM [42] package in Rstudio was applied to extract and visualize extreme data values from the river’s daily discharges and monthly rainfall, due to its powerful tools in the management, analysis, and visualization of time series of hydrological flows [43]. We also used the bootstrap method to compute confidence intervals on quantiles of the fitted distribution from the marginal non-parametric values to help understand the potential structural correlation between parameters and characterize uncertainty in distribution parameters. We used the whole bootstrap sample because of their importance in the risk assessment field.

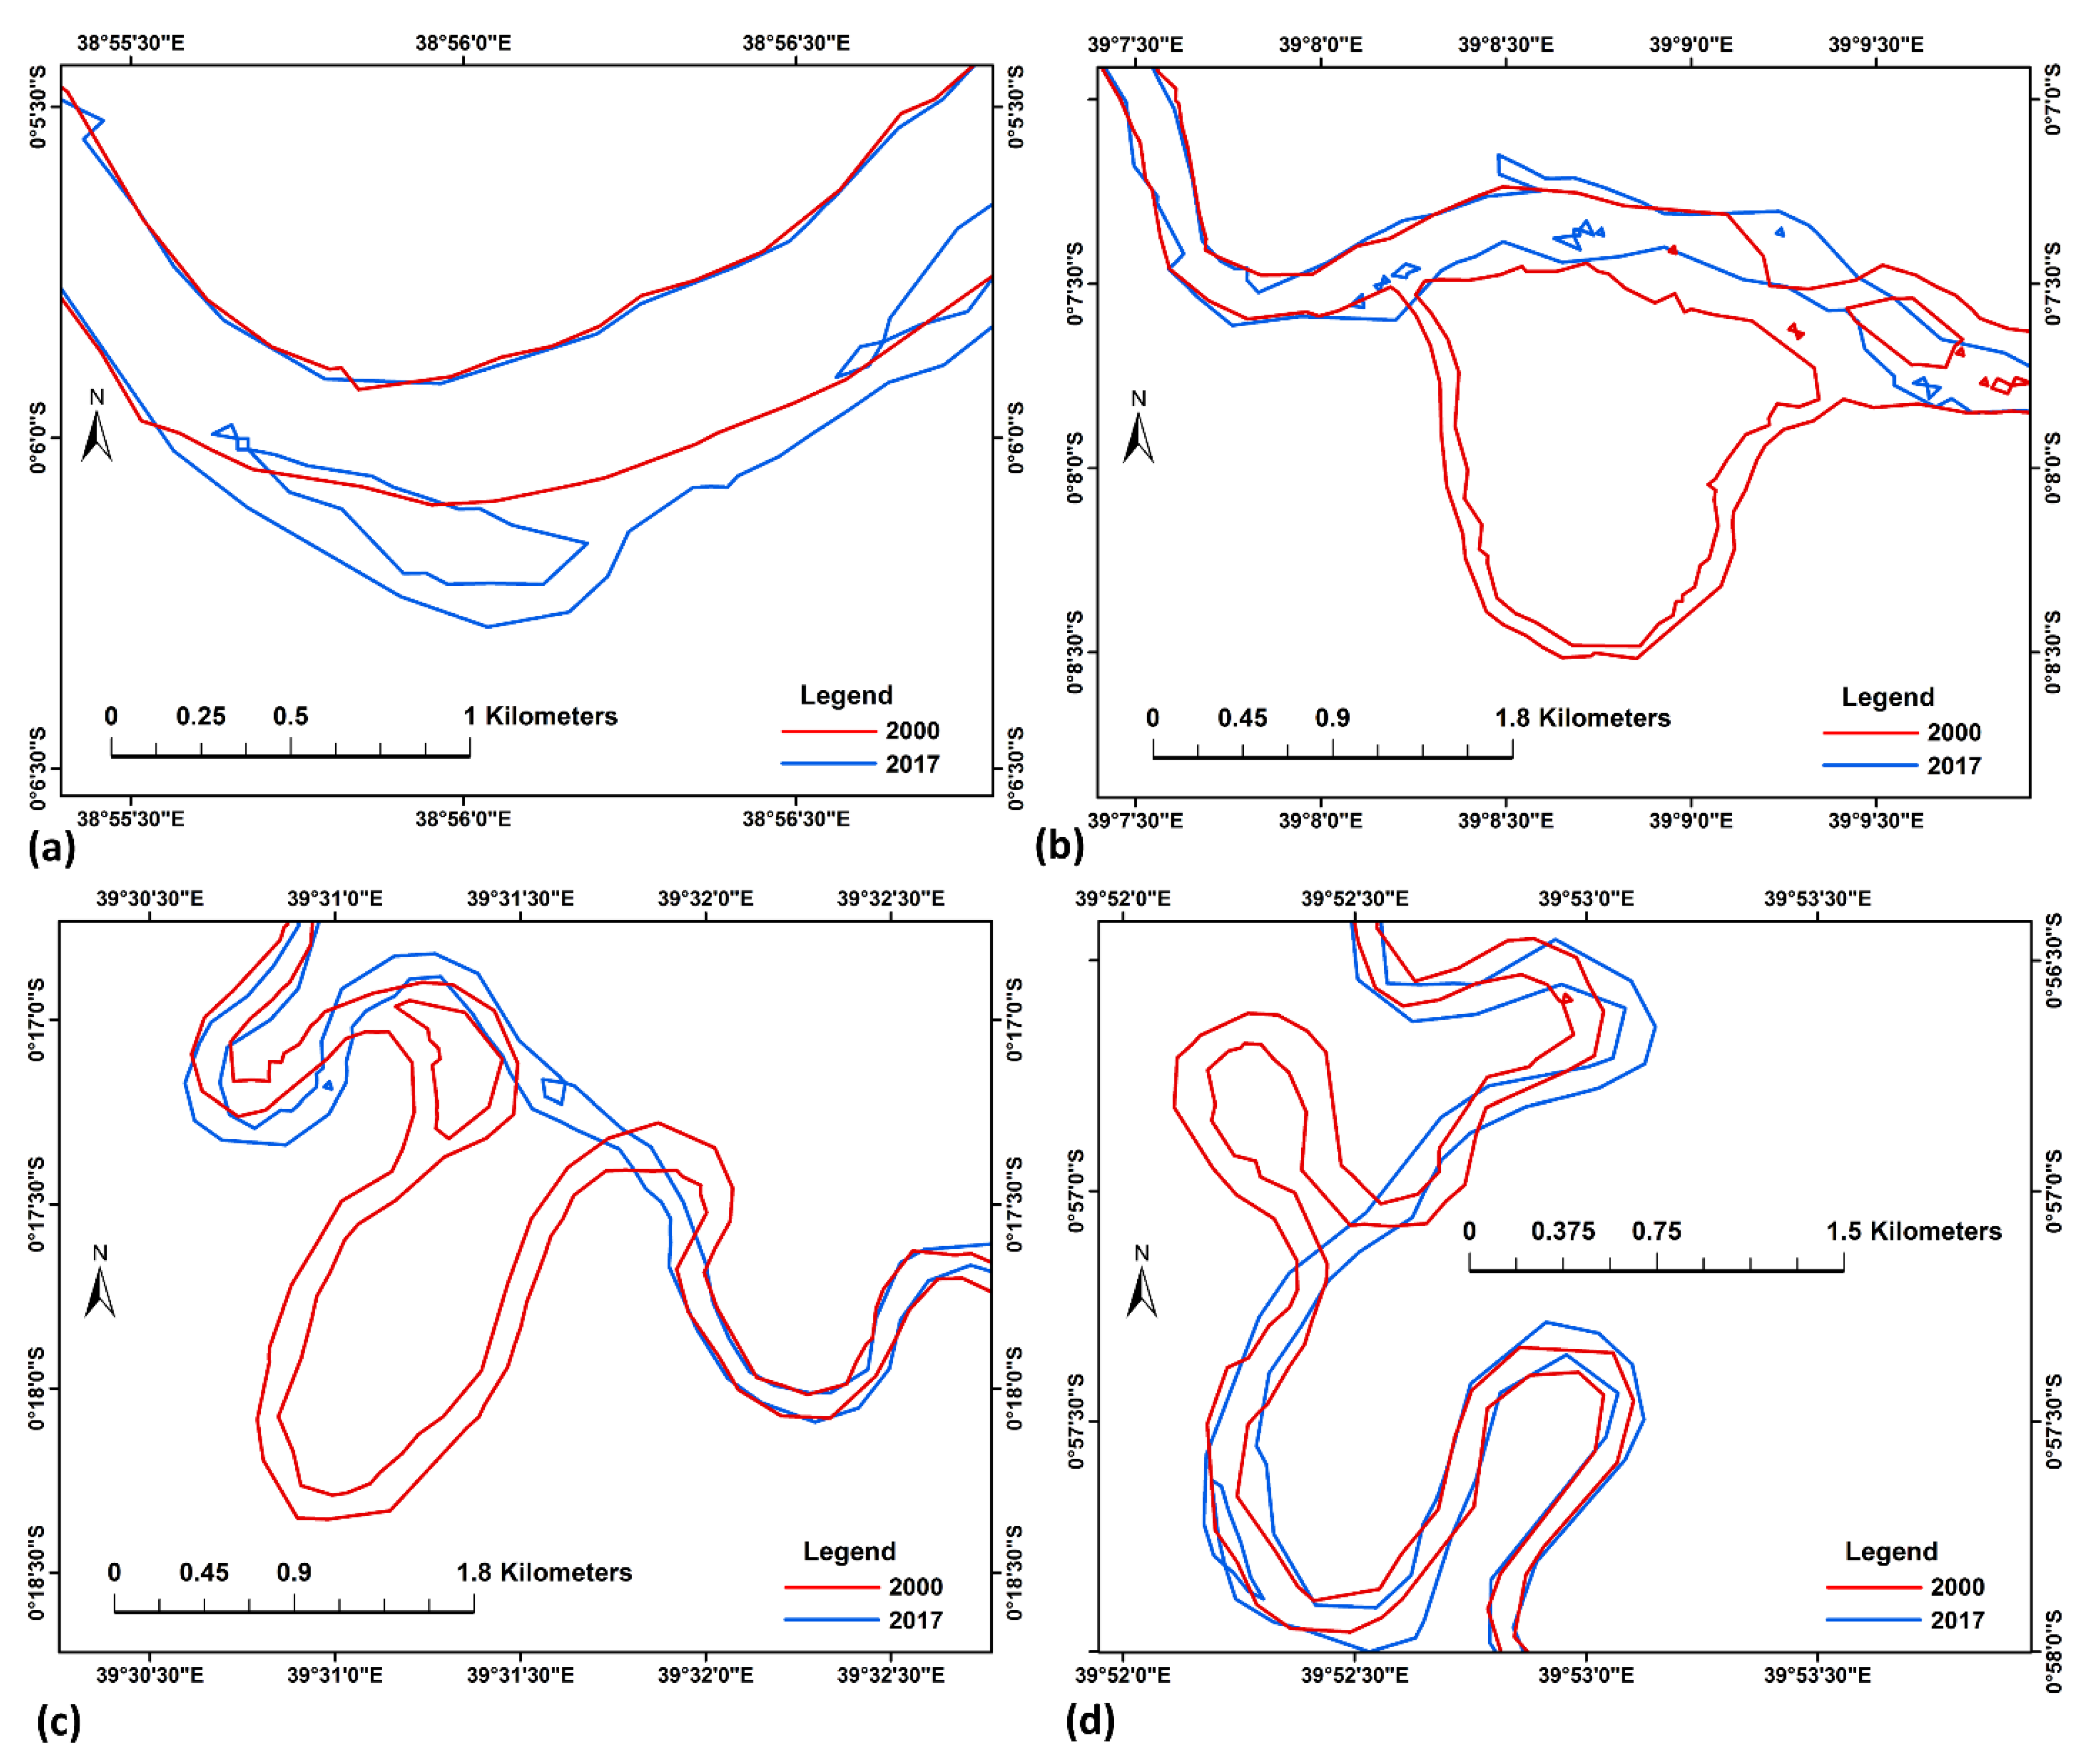
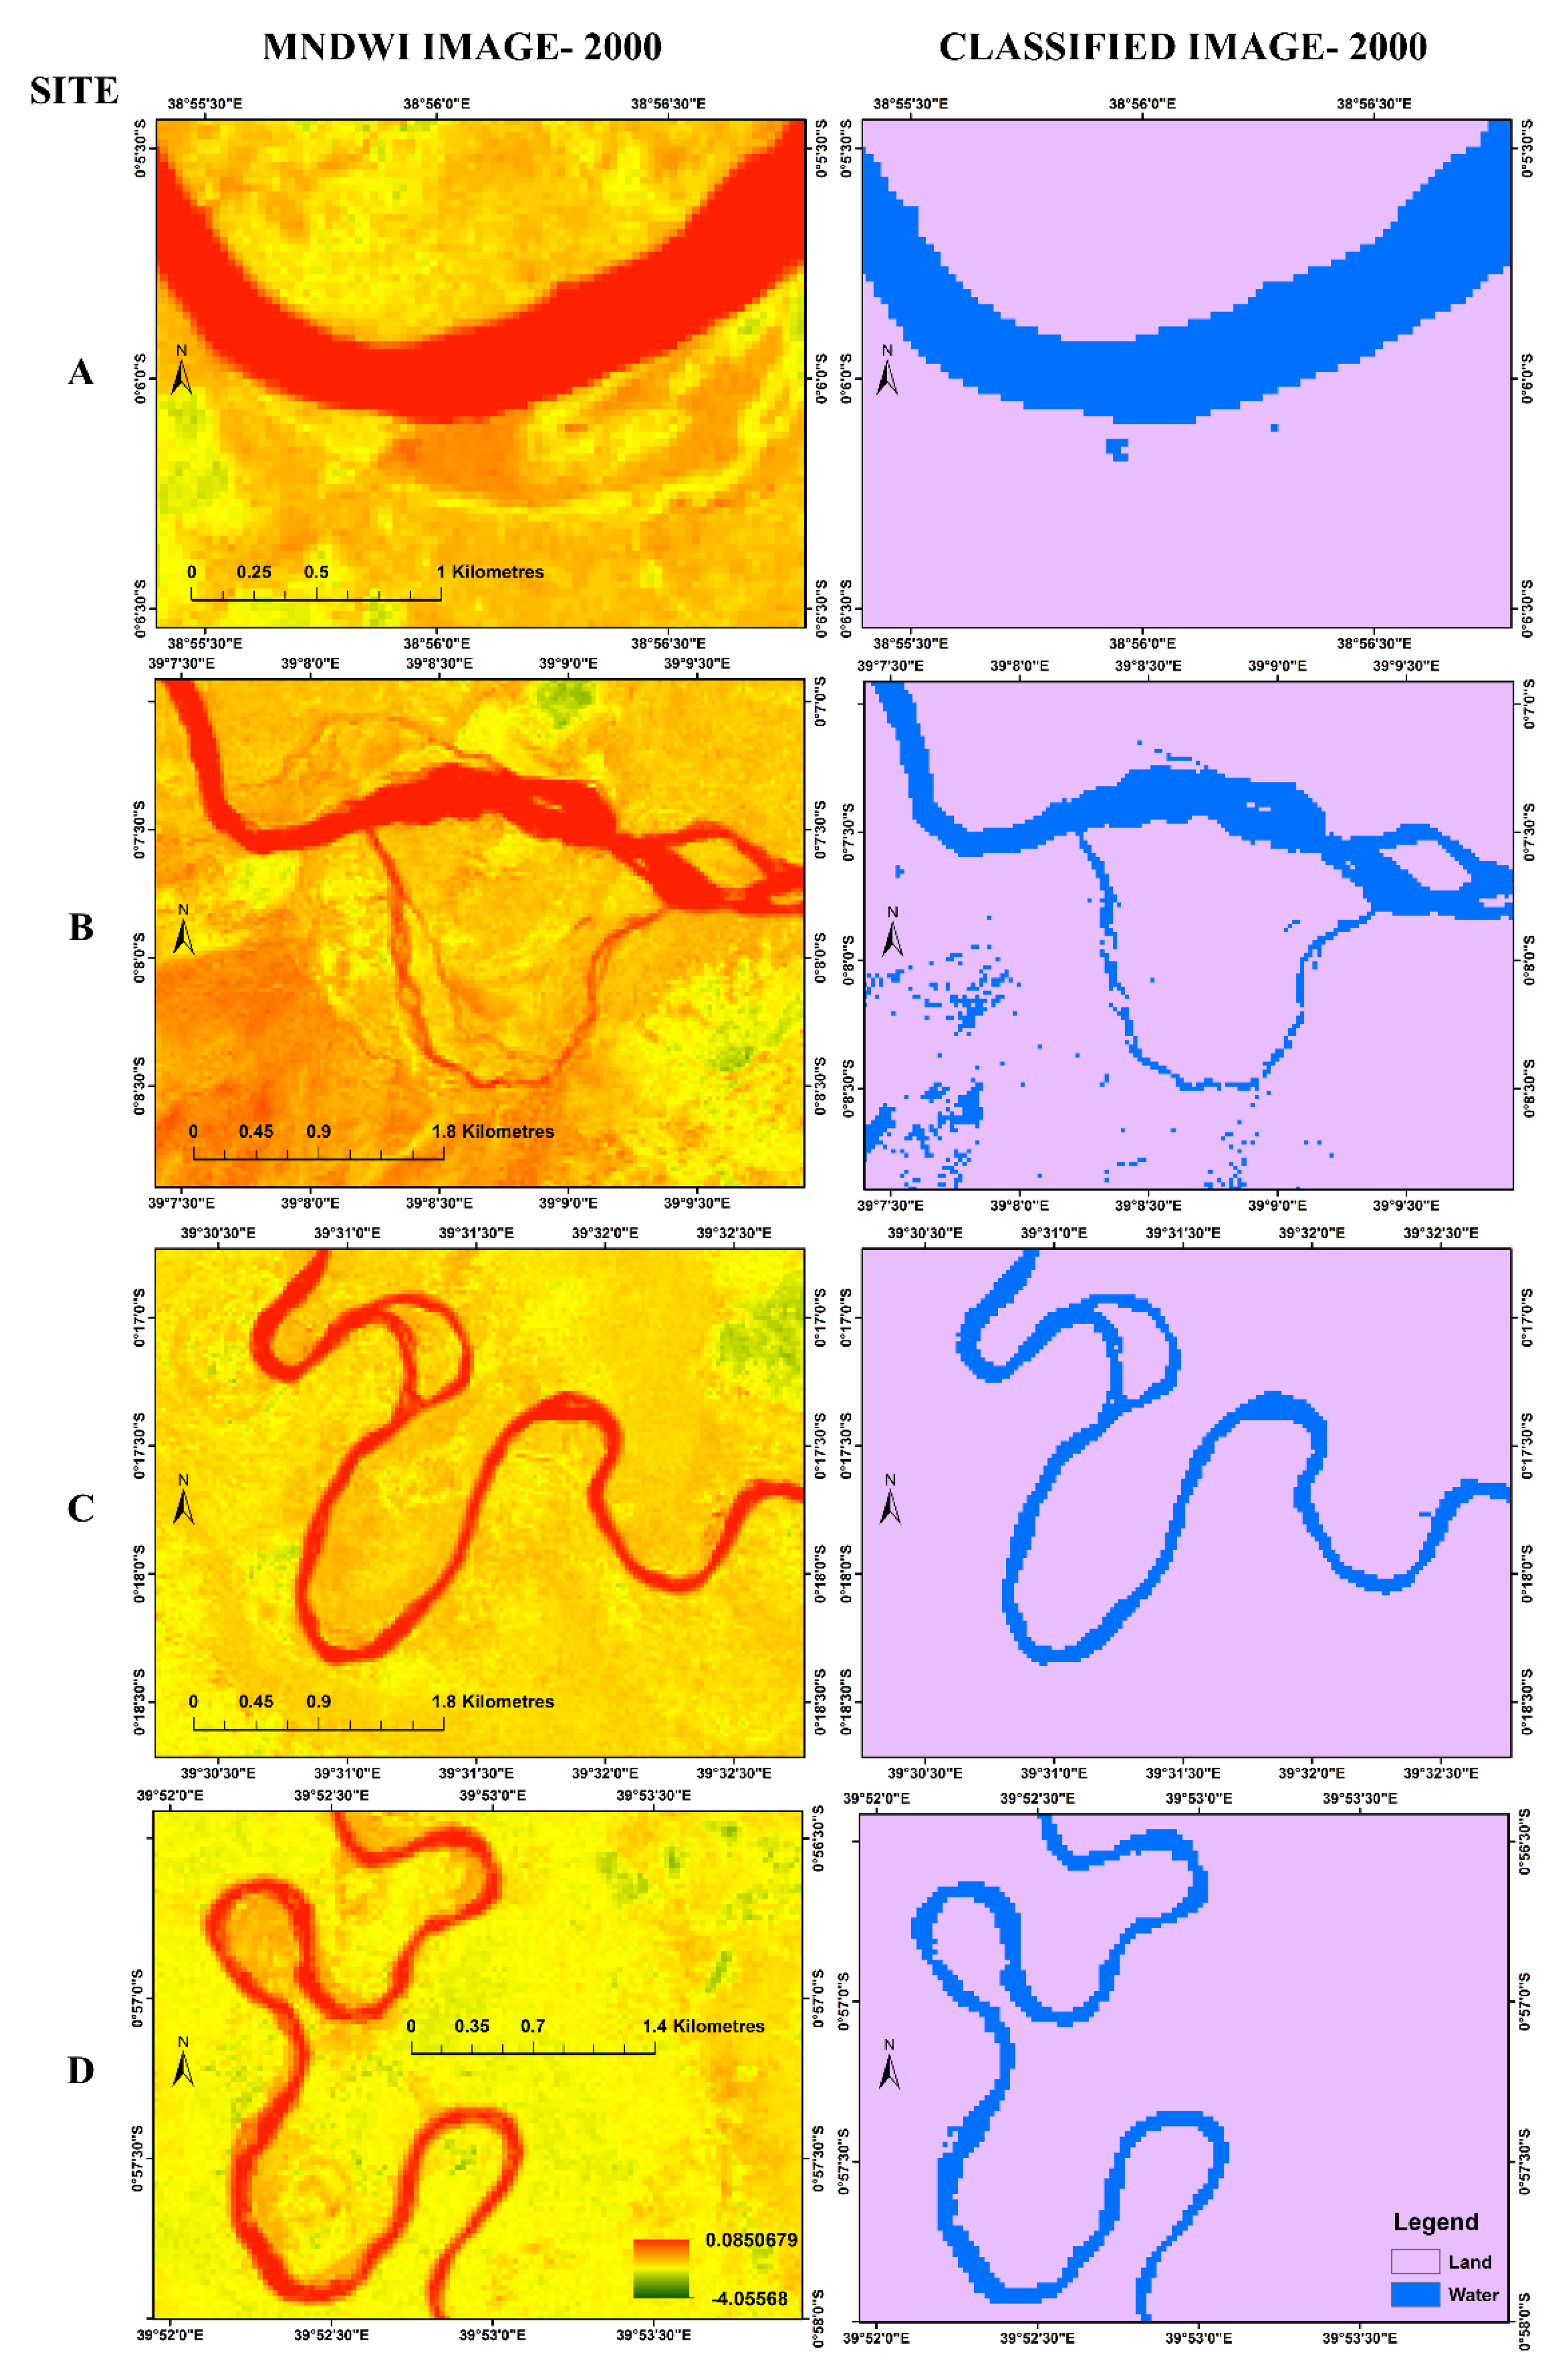
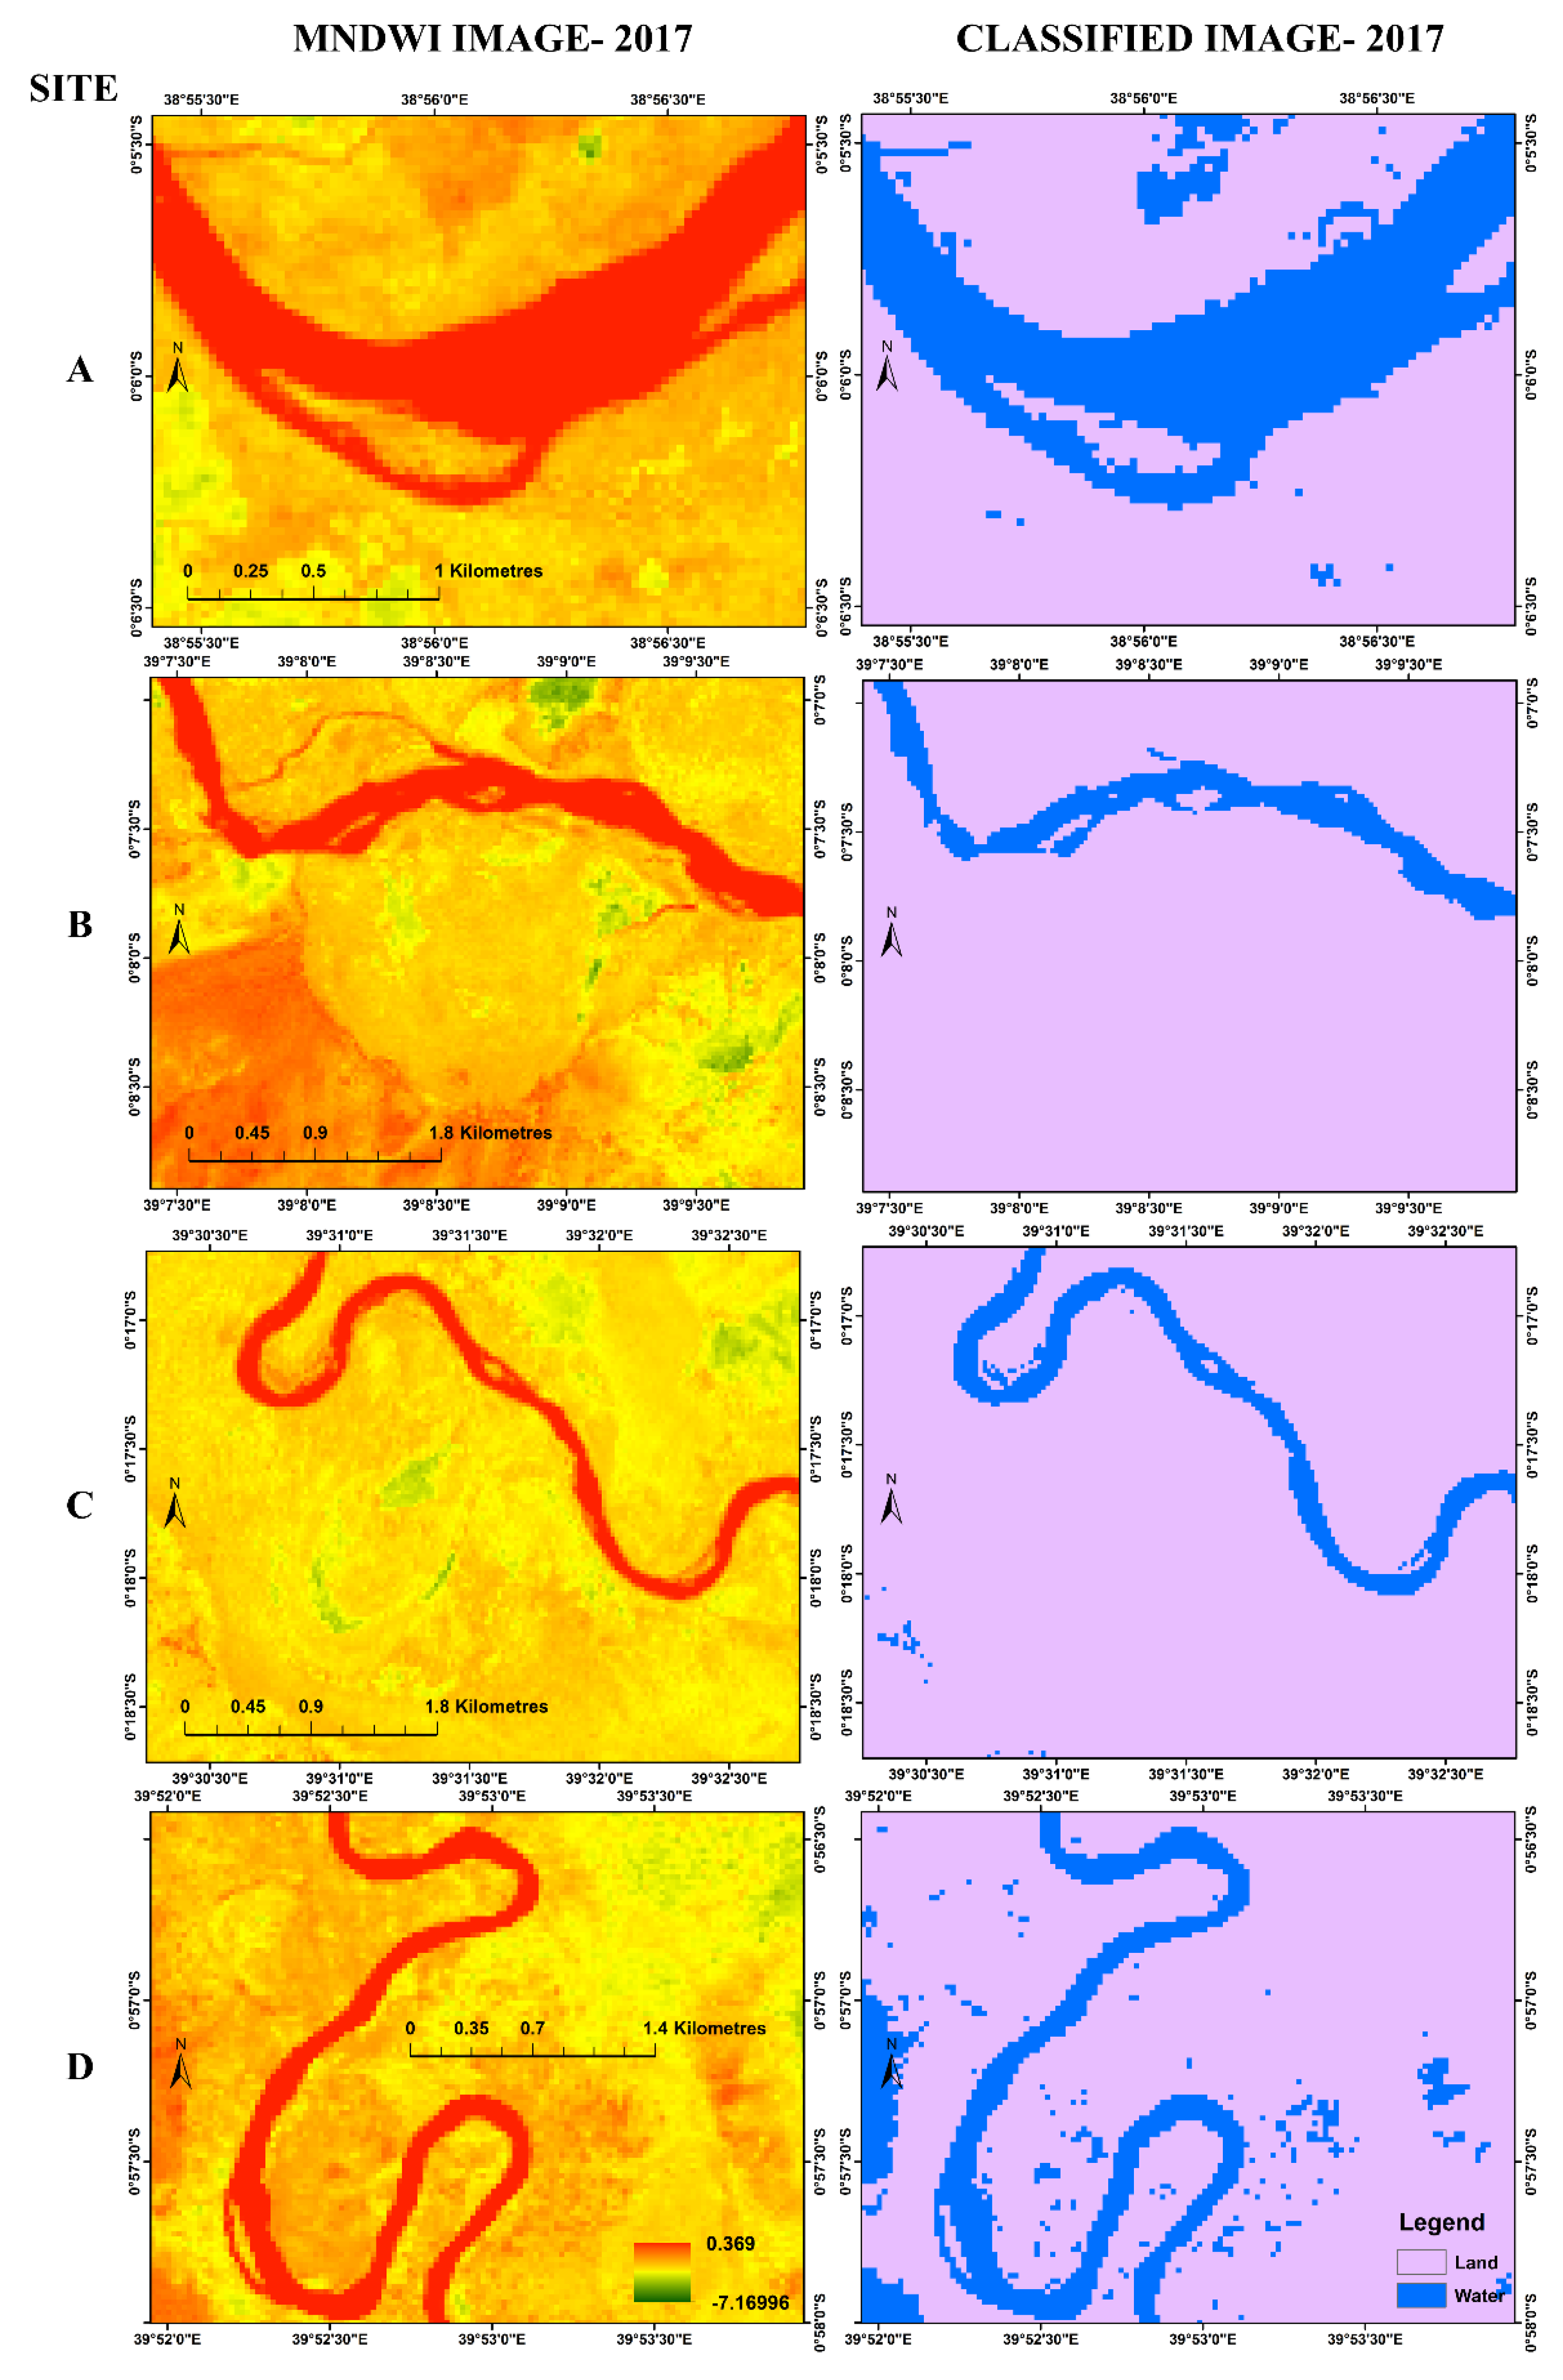
2.2.2. River Channel Form Changes

Changing streamflow regimes and sediment loads are manifested in channel form features along meandering rivers. The satellite images, taken from the Landsat Enhanced Thematic Mapper (ETM) which contains spectral bands of the visible, near infrared, short-wave infrared, and thermal infrared portions of the electromagnetic spectrum [44]. The images were pre-processed in accordance with well known remote sensing Landsat data procedures [45] that included radiometric and atmospheric corrections, mosaicking, co-registration, and resampling. The dark-object subtraction technique was employed to remove the atmospheric interference as part of radiometric corrections. The images’ header files were then useful for the radiometric rectification using the sun azimuth and sun elevation data. All the images were then transferred to top-of-atmosphere reflectance from digital numbers for ease of comparison as suggested by Chander and Markham [46]. The relative radiometric normalization [22,47,48] was also carried out to normalize the differences arising from the solar illumination and atmospheric environments. Geo-rectification of all the images were undertaken using 43 ground control points (GCPs). This process resulted in a root mean square error (RMSE) of 0.002338 pixels. The GCPs used were an intersection of roads, noticeable geomorphologic features, and river waterways points. The study site is covered by three frames described by Paths/Rows 166/61-62, and 167/60 of Landsat satellite images, therefore, all of the individual images were mosaicked to get the entire study site. All images were acquired between February and March for both years (2000 and 2017) as this period is a dry season and the river bank can clearly be identified because the streamflow levels are low.
To quantify river channel adjustments, two different approaches were applied: (1) A water index algorithm was used to discriminate the land and water interface so as to identify the river bank line and (2) river bank line digitization for mapping the river reach and identifying the shifting of the river bank along the Tana River reach. The Modified Normalized Difference Water Index (MNDWI) algorithm that has been widely used for land-water interface discrimination [49,50,51,52] was adopted in this study to identify the shifting of the river bank. The wavelength of 0.52–0.6 μm, commonly referred to as the green (GREEN) band in Landsat ETM, is useful for discerning wide-ranging classes of vegetation because of its sensitivity to variances of turbid water and sediment and pollution spirals. The mid-infrared (MIR) of 1.60–1.70 μm wavelength strongly contrasts land and water features because of its properties of water absorption and its high reflectance in flora and natural features in the wavelength array. Therefore, the MNDWI algorithm, which combines Green and MIR bands, is the ideal method for separating the interface of land and water classes. The MNDWI approach was used for estimation as: (Green − MIR)/(Green + MIR). The MNDWI algorithm was used for the ETM images of 2000 and 2017. Thereafter, a reclassification approach was applied on the MNDWI created images to generate land and water classes. On-screen digitization of the river reach was performed to extract the river bank layers, Afterwards, layers of the river bank were overlaid to observe the river bank line position at each date. River bank layer positions were accentuated to show the erosion/accretion portions along the river reach, and the river bank line shifting were calculated. To examine the river bank shifting over the study period, the width of the measurement along fixed points of the cross-sections at each study reach was undertaken to identify the amount of lateral erosion and accretion along the banks (Table 1. All the processing and analysis of the images were done using ENVI (5.3, Esri, Colorado, CO, USA) and ArcGIS (10.4, Esri, Colorado, CO, USA) software.

3. Results

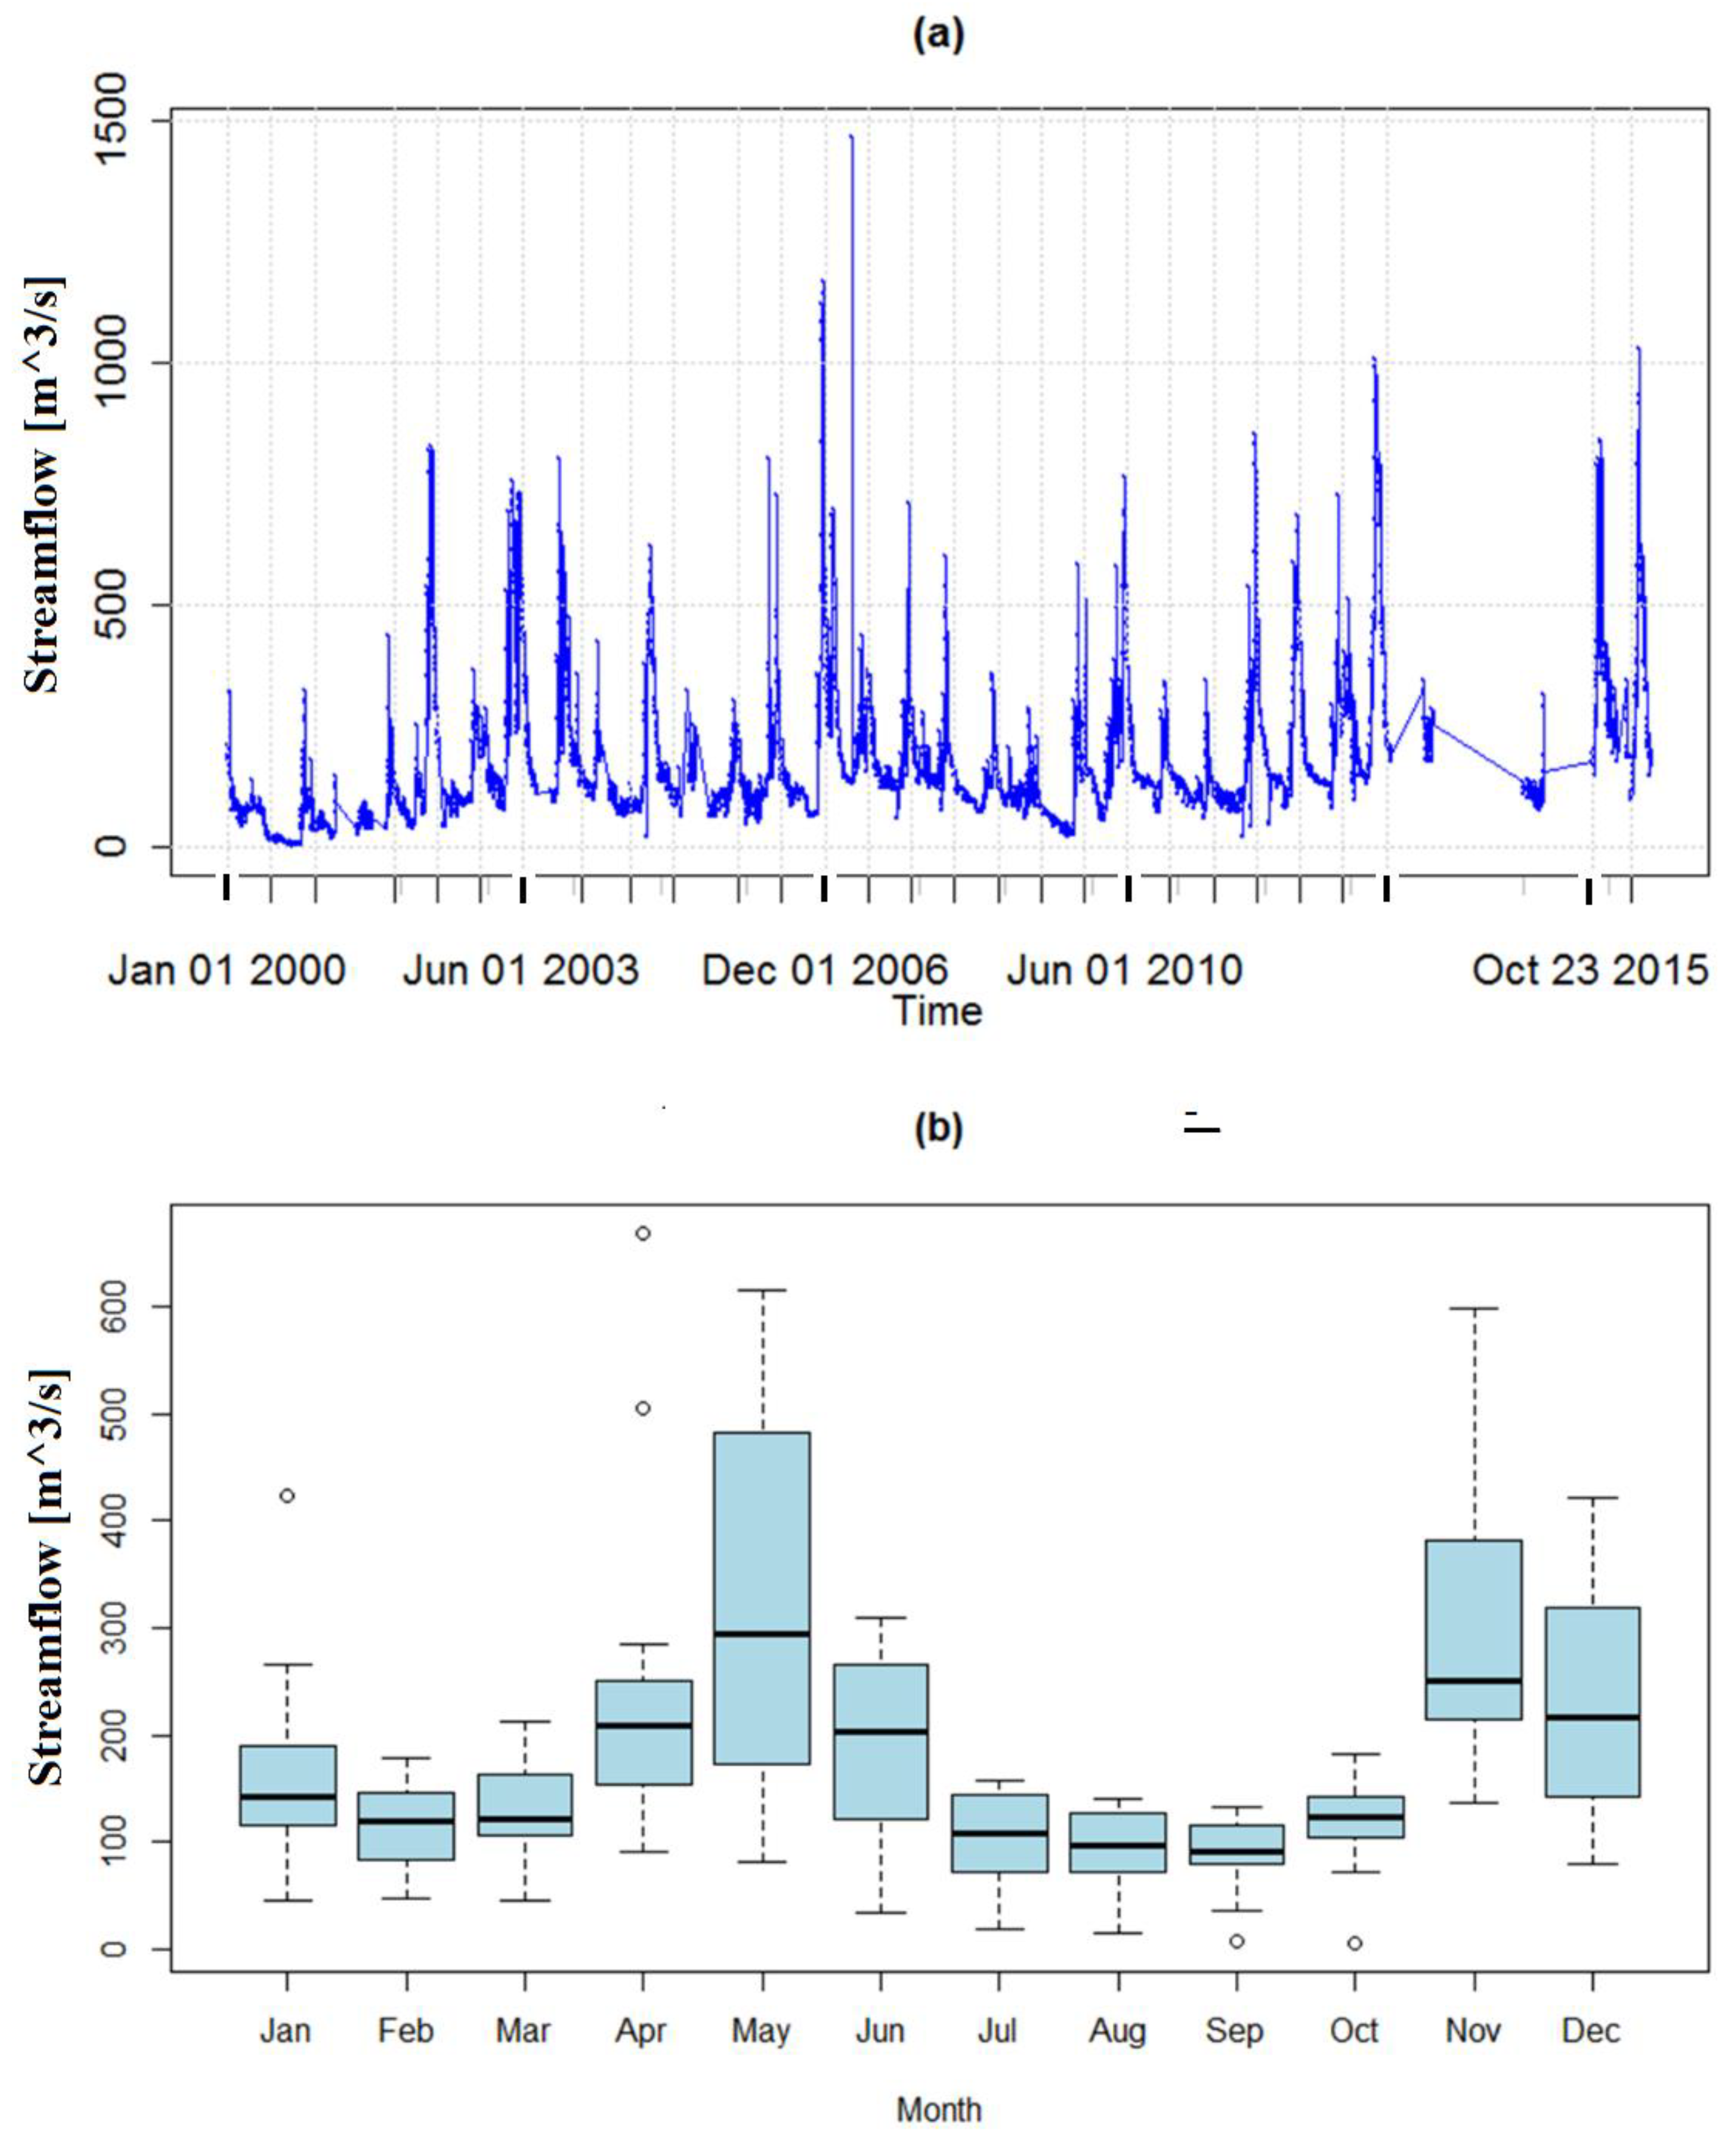
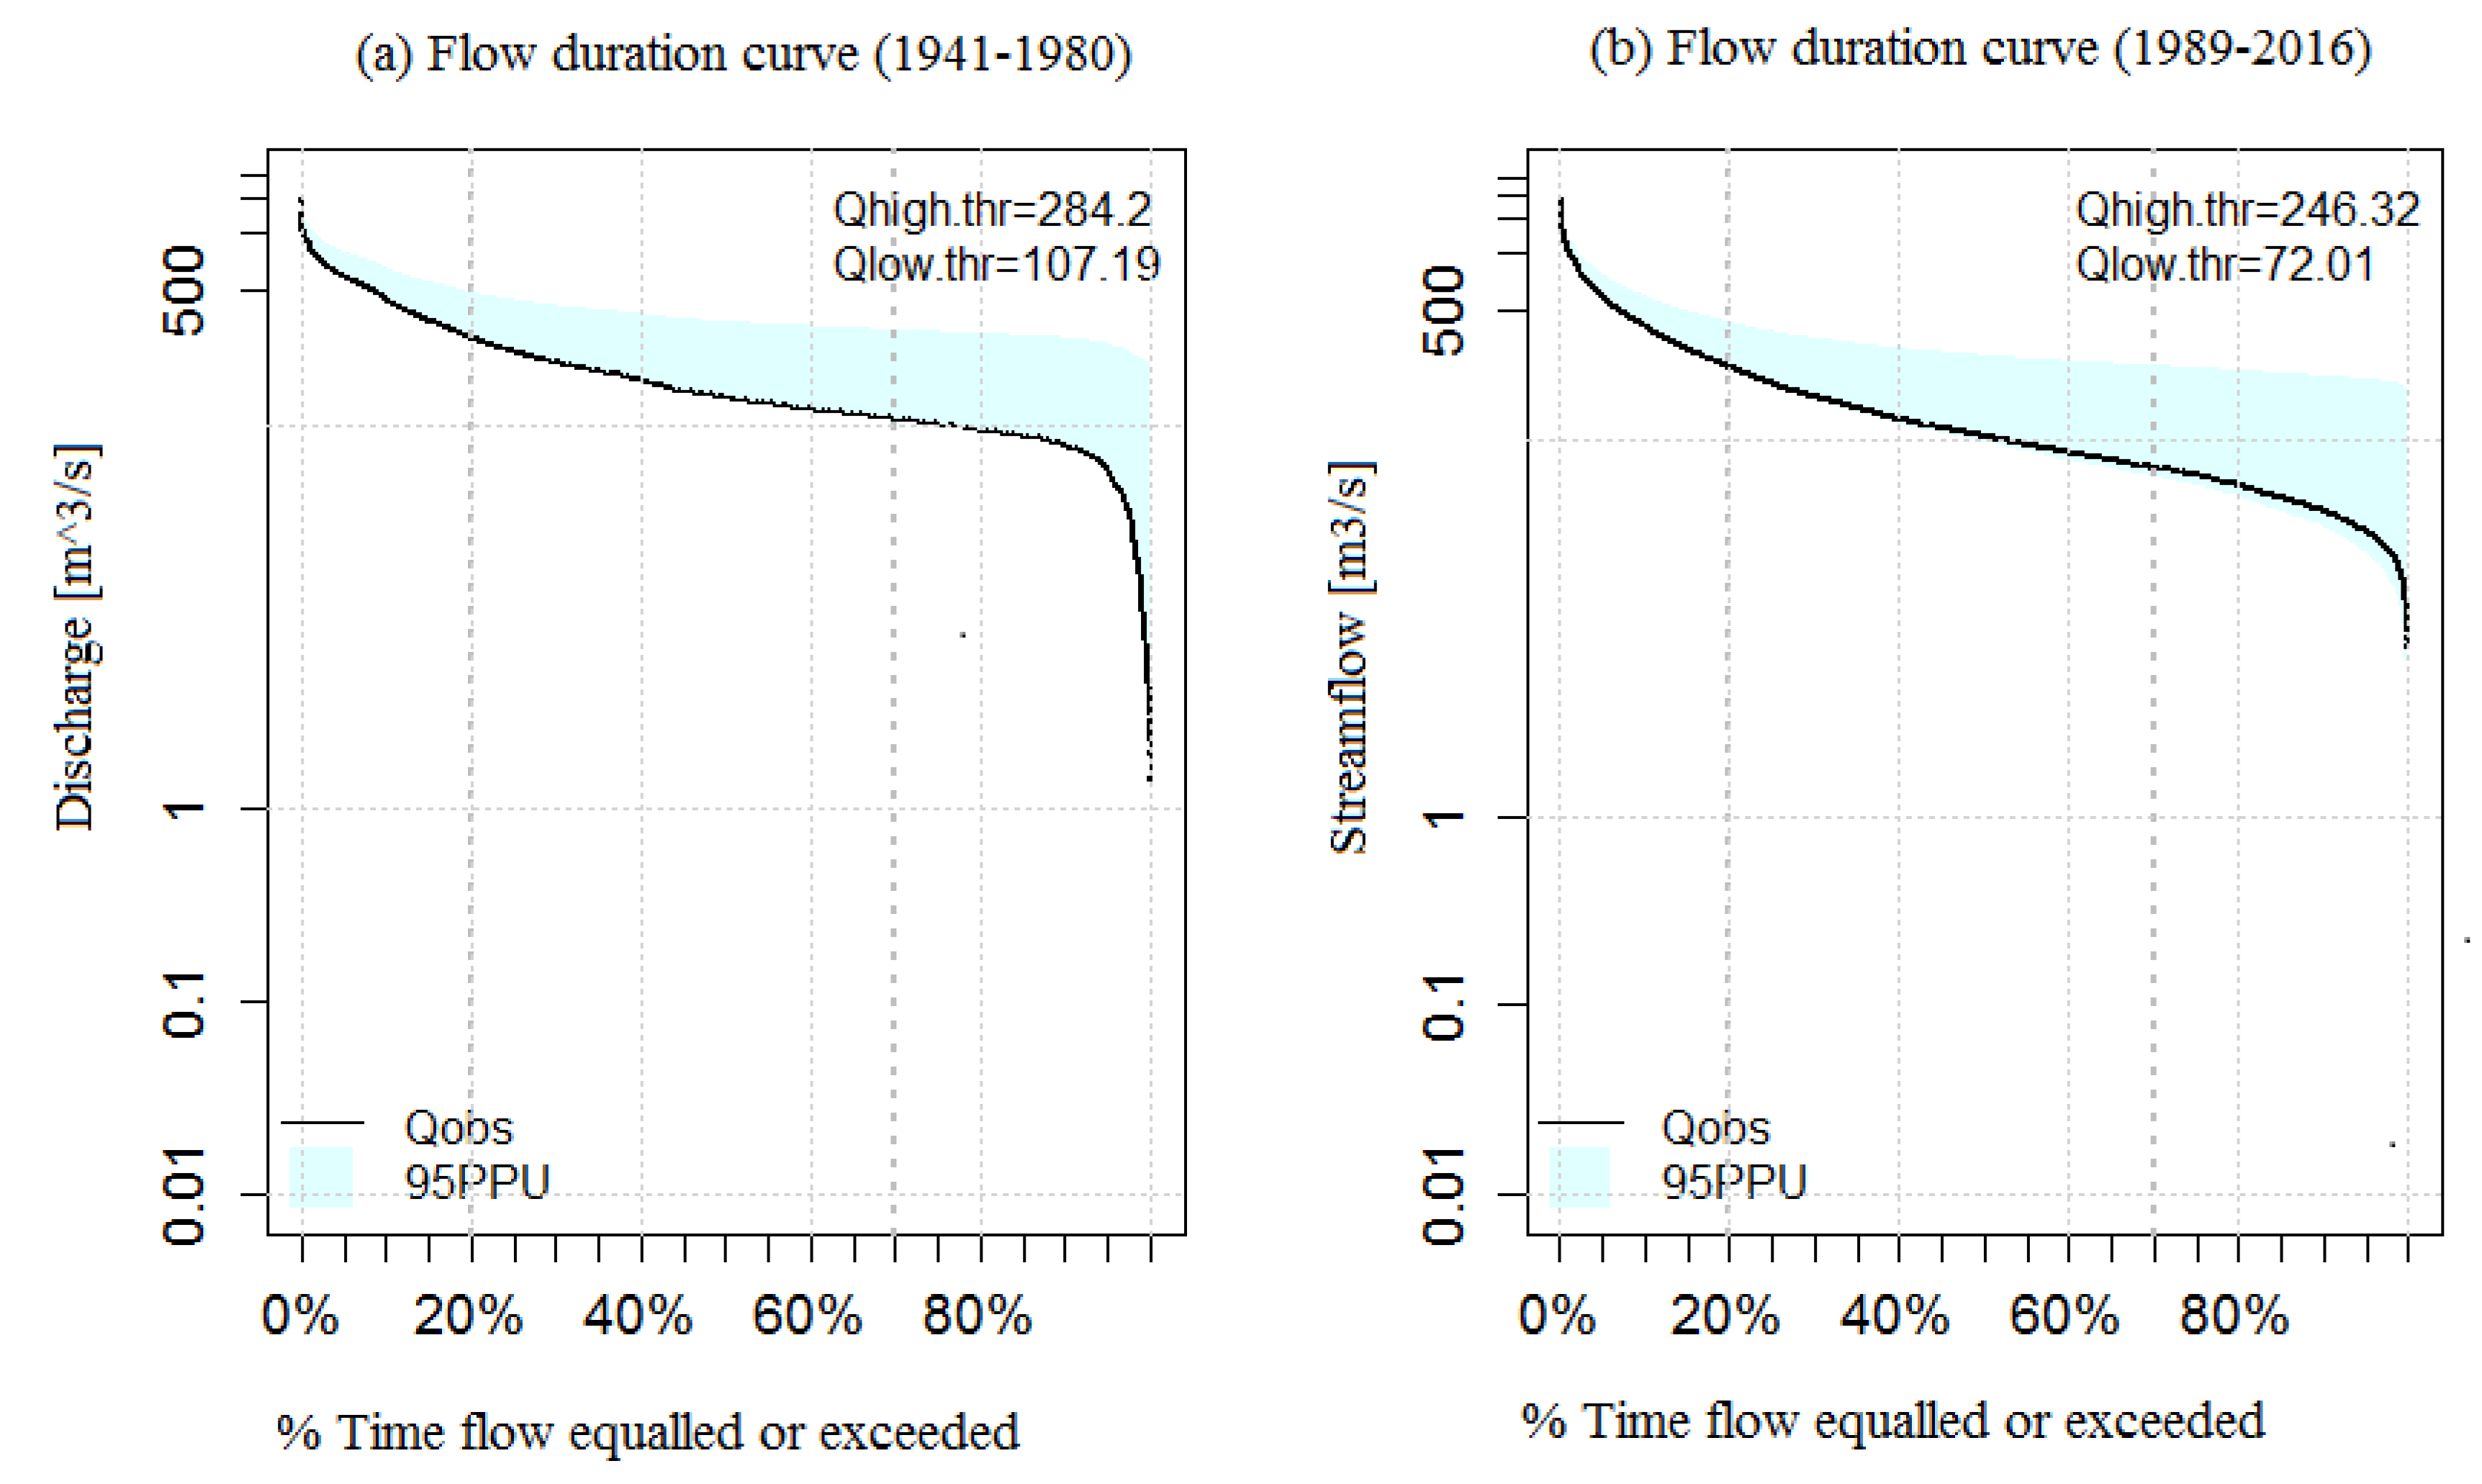
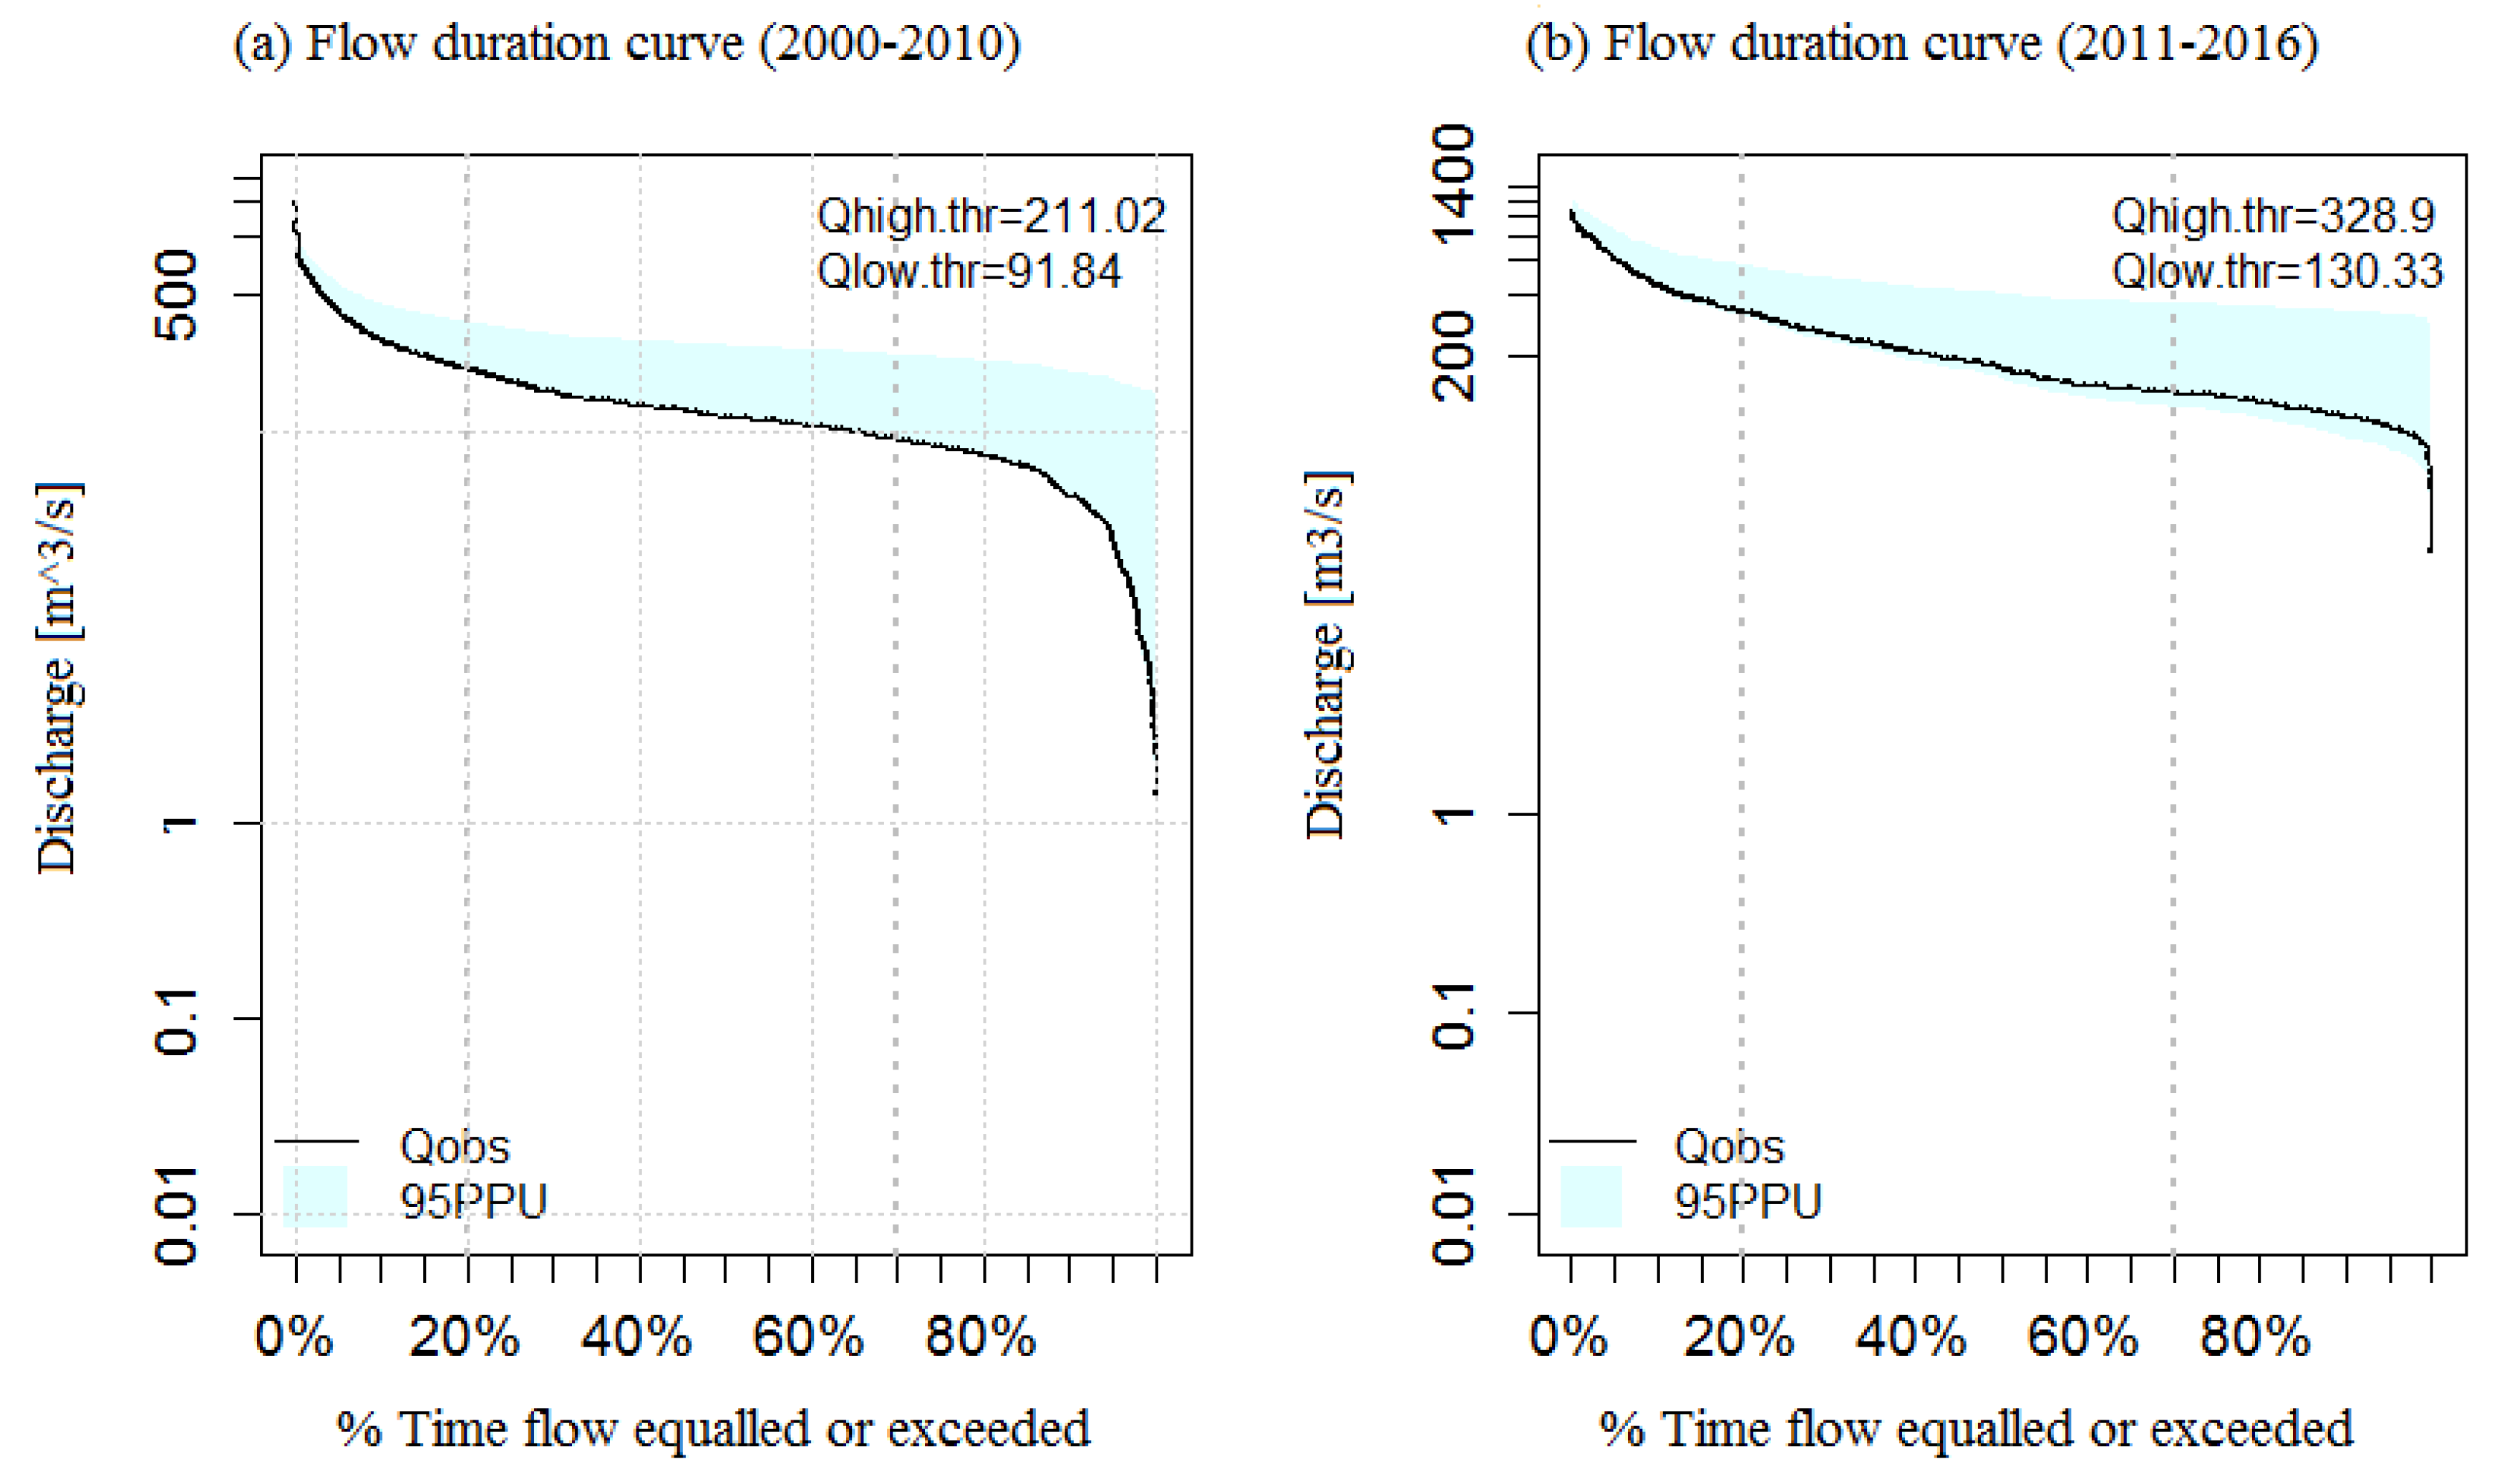
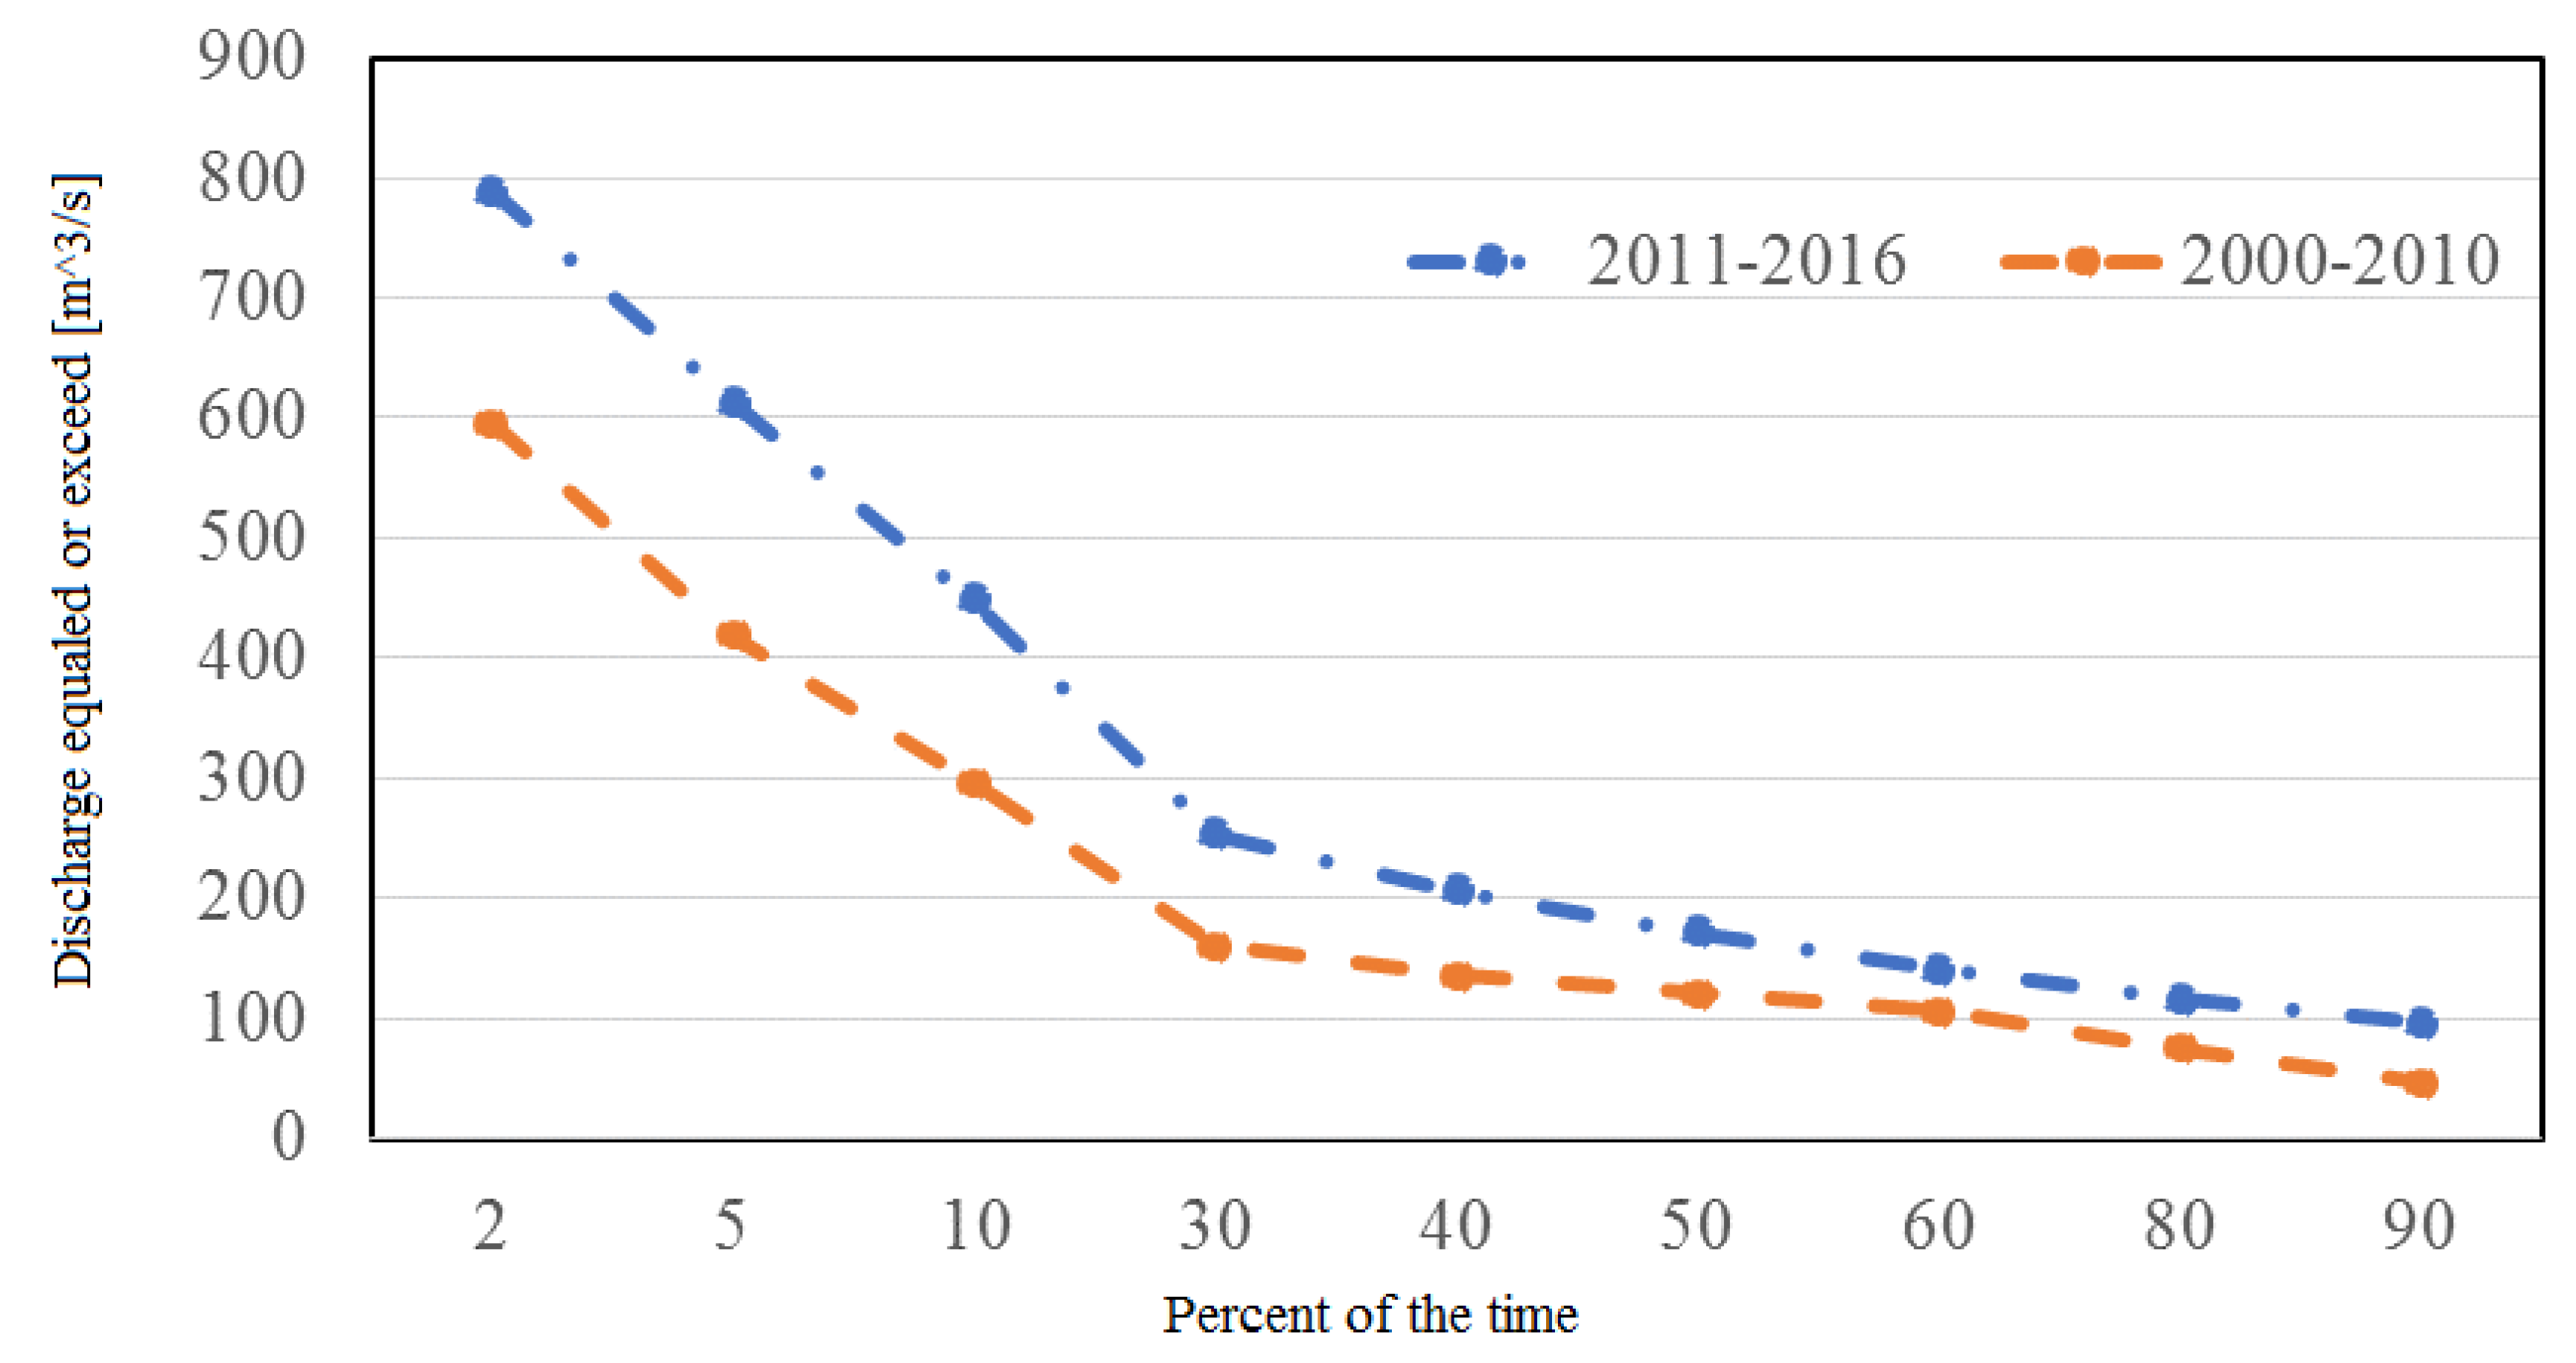
3.1. Statiscal Analyses of Annual Flow Volumes and FDC

The rainfall dataset was examined for significant extremal flood flow regimes within the Upper Tana Basin that might have had an impact on hydrological and morphological channel dynamics. Mean annual rainfall in the upper basin upstream of Garissa River Gauging station was evaluated to identify existence of significant changes. The analysis shows high year-on-year variations of rainfall over the period and a steady increasing trend (Figure 2) with a high annual rainfall of 162.5 mm in 1968 and 138 mm in 2013, and a drought year in 2000. From the year 2000 to 2017, rainfall has been on the rise (by more than 100%) but was not regular in the Tana Basin, indicating that a flood risk is also increasing.
Figure 3 illustrates the daily discharge time series (Figure 3a) and monthly streamflow distribution (Figure 3b) for the Tana River records at Garissa gauging station. Peak flows occur during long rainfall (April–June) and short rainfall (November–December) periods. In the 17-year period, a statistical analysis of the streamflow datasets indicated statistically significant trend and seasonal variability. The rainfall in the basin exhibits two precipitation cycles which result in two peak discharges and potential flooding frequencies. A high long discharge happens between April and June, which coincides with the long rainy season, and a short high streamflow period happens during the short wet season between the months of November and December as shown in Figure 3b. Flood flows generally range between 200–700 m3 s−1 while mean flow is 178.5 m3 s−1. Infrequently, extreme flood events with streamflows over 1000 m3 s−1 can be seen. Figure 4 gives the extremal annual values of low streamflows, mean or moderate streamflows, and maximum streamflows (peak flows) over the period. Peak river flood flows of about 1500 m3 s−1 and above were recorded in 2007 (Figure 4c). A trend analysis by non-parametric Mann–Kendall test [53] shows tau = 0.36, 2-sided p-value = 0.0583 for peak flows, tau = 0.483, 2-sided p-value = 0.010 for mean stream discharges and tau = 0.471, 2-sided p-value = 0.013 for low streamflow over the period at 95% significance level. Over the period, all the extremal flow data exhibited significant increasing trend.
FDC is formulated as F = (R/(n + 1)) (100) where F is frequency of occurrence expressed as % of time a particular streamflow value is equaled or exceeded (exceedance probability), R is the rank corresponding to streamflow QR and n is equal to total number of days. In this study, the annual extremal discharges are calculated for each year to analyze the changes in the flow regime. To characterize the information in the FDC, it was partitioned into different segments (Figure 5). The first part representing high flows (0–10% exceedance probabilities of flow) characterizing watershed water yield from high rainfall events, the second partition gives wet conditions (10–40%) described by flows from medium size rainfall events and the third part being mid-range flows (40–60%) illustrated by flows from moderate rainfall events. The other segments were dry period conditions (60–90%) related to the intermediate base flow relaxation response of the watershed water yield, and the low flows (90–100%) related sustainability of streamflow in the long-term. We compared the pre-dam period, being the base period (1941–1980), and post-regulation years (1989–2016) flow patterns as shown in Figure 5. Overall, both high flow discharge and low flow decreased by 13% and 30% respectively. The curve in Figure 5 indicates a 20% exceedance of 253 m3 s−1 for the period 2011–2016 and that of 2000–2010 is 160 m3 s−1. The daily mean flows during the 2011–2016 period of 448 m3 s−1 is equaled or exceeded 10% of the time while that of 2000–2010 equaled or exceeded 10% of the time is 296 m3 s−1. At the low flow zone, 2011–2016 period shows 96 m3 s−1 is equaled or exceeded 90% of the time while that of pre-dam equaled or exceeded 90% of the time is 47 m3 s−1. From Figure 6, the median flow (Q50) being streamflow which is equaled or exceeded 50% of the time represents state of low-flows. The low-flow discharge for current and previous decades are 171 and 121 m3 s−1 respectively representing an increase of 40%. This low flow condition is often interpreted as base flow and represents the tail end of FDC. Present decade dry conditions range is 141–96 m3 s−1 and that of previous decade is 105–47 m3 s−1. These flow characteristics are illustrated in Figure 7 constructed from the FDCs. The dominant flow, assumed to be 2% probability of exceedance is an effective discharge responsible for significant geomorphological dynamics [54], and often related to bankfull discharge that is exceeded for most of the time in rivers within large drainage basins [4] like Tana River Basin. The dominant flow was observed to be higher for the current decade (800 m3/s) than the previous one (600), representing a rise of the dominant streamflow by 33% (Figure 7).

3.2. River Channel Changes

River channel features, such as style, width, cut-offs and shifting were identified using geospatial techniques during the study period (2000 to 2017) for four sites A, B, C and D (Figure 1) as shown in Figure 8 and Figure 9. The location of these reaches was selected based on visual analysis of temporal satellite images and large morphological alterations in the river, particularly where big changes in the river bank could be observed within the study reach. From Figure 8, site A portrays a plan-view feature of a single channel river at this stretch in 2000, but by 2017 (Figure 9) some form of braiding can be observed. The MNDWI and classified 2000 images at sites B and C show an anabranching river form which seems to have disappeared in 2017 (Figure 9). The floodplain of the meandering river shows a truncated meander scar, a wholly filled abandoned channel or oxbow lake recording at site C (see MNDWI image in Figure 9), meaning that the river abandoned the two-channel character it had in 2000 to perform a cutoff in 2017. The largest morphological changes have been found for sites B and C over the 17-year period. The images at site D show meandering sinous style in 2000 which seem to have been maintained in 2017 with some form of braiding.
The superimposed channel configuration maps for the two periods, 2000 and 2017, of the Tana River reach can be found in Figure 10, which shows that the river at this reach experienced adjustments to its channel form. During the study period, the Tana River experienced channel widening and swiff-offs through erosion and accretion processes. The channel width increased by 8.7 and 1.9% at reach A and D respectively but reduced by 31.5 and 16.2% for reaches B and C respectively by the year 2017 (Table 1).

4. Discussion

4.1. Effects of Land Use and Climate

The river streamflow from the upper Tana sub-basin constitutes 95% of the total inflow into the lower Tana River reach [27] and delivers sediment stocks to this floodplain by annual overbank flooding [55]. The streamflow’s decrease after regulation observed in this investigation is in agreement with earlier research which suggested that the hydroelectric dams have had an impact on the flow regime downstream [27,28]. Maingi and Marsh [28] used flood frequency analysis and computation of various indicators of hydrologic alteration (IHA) while Leauthaud, Belaud [27] used a water balance model and satellite data. In this study, the impact, attributable to the existing Seven Forks flood control, represents only 13% reduction of the maximum discharge and 30% decrease in low flows. Water reservoirs constructed, globally, on rivers have caused significant geomorphic, hydrologic and ecological changes at both reach and watershed scales [56]. Our post-dam period analysis indicates an overall increase in both peak and low flow regimes which seem to offset earlier effects by river regulation. As can be seen in Figure 6, there were increased high flows and low flows by 56 and 41% respectively from 2000–2010 to 2011–2016 periods. This observation is attributable to a complex mixture of factors.
Firstly, land use in the upstream catchment, as indicated by post-dam FDCs, may have significantly changed. In a catchment where agriculture has been intensified over time with associated depletion of forest and grassland, both high and low flow can increase, leading towards overall increase in total volume of water (yield) in the river. Secondly, anthropogenic climate change can substantially impact hydrological flows and environment [57]. In this study, increasing rainfall trends and variability upstream and subsequent up-trends and temporal variability of streamflow extremal values characterized the last two decades. Similar observation on the trends in this river basin was made by Langat, Kumar [58]. The variations in the meteorological conditions usually occur over a fairly long time, the amount of rainfall increased during this period under study and may have contributed to the FDC’s shape. River form adjustments is a function of many factors, such as flow changes and related climate regime [23,59]. Higher flows are responsible for channel widening due to avulsion and sediment deposits. The recent changes in channel bank movement, width adjustment, and abandonment report support the increasing and variable streamflow in the basin. From Figure 7 we find that dominant discharge which is responsible for channel form adjustment has been on the rise. As observed in this study, the volumetric flow of Tana River has increased in the present decade as shown by comparing FDC periods 2000–2010 and 2011–2016. Thirdly, an increase in low flow is an anomaly associated with other human dimensions that may include dam operations and water abstractions and climatic changes. The objective of this study was to provide a generalized description of recent ecohydrological characteristics and not to isolate the contribution of each of these factors. This would normally be of immense importance in detailed studies for specific management purposes [60,61].
We have applied a flood frequency curve to estimate recent changes in hydrological characteristics due to land use and climate and the results suggest a much bigger picture on the effects of these factors. Since it is difficult to separate the impacts due to land use from that of climate change, both must be considered. Many researchers have used various models and simulation approaches to study the effects of land use and anthropogenic climate changes, however, our approach provides a simple method with limited modelling uncertainties. Increases in the frequency and/or intensity of ecosystem disturbances because of hydrological regime changes including droughts in the Tana River Basin require regular monitoring. Droughts, floods, and rainfall variability associated with the El Nino Southern Oscillation (ENSO) have become common in Kenya just like it has been observed in other parts of the world and this, in some instances, is attributed to changes in climate [62]. The FDC non-parametric framework analysis can be helpful in understanding the change in the magnitude of streamflow values under altered land use and climate conditions within a watershed.

4.2. Implications on Water Resources and New Water Projects

Floods can either be beneficial or destructive, depending on their predictability and regulation, timing and severity. Extreme floods destroy infrastructure and livelihoods while moderate floods sustain ecosystem services, agriculture, and pastoralism. Low floods are associated with hydrological drought and water scarcity and are disastrous to productive systems in river basins. The existing hydropower dams in the Tana play a role in the nation’s energy portfolio and a new large reservoir to complete the Seven Forks project will no doubt help augment the power needs while regulating floods and supplying water to irrigate the new large schemes. Water needed for healthy in-stream ecosystems and water quality issues must also be taken care of. The environment and natural resources are already under pressure within this basin. The development of large multi-purpose dams for energy and food security, especially in developing countries, must undergo a comprehensive impact assessment to ensure sustainability of the new projects, environmental flows, and livelihoods of communities who rely on the dynamic river flow regime and autogenic channel changes [63]. Climate change impacts are being felt but estimates of future warming and its effect on the hydrologic cycle cover a broad range and are still uncertain. Therefore, the planning and management of Tana River water resources must be cognizant of the changing climate and be done in such a way that avoids common consequences such as hindering channel development, reducing wetlands, decreasing floodplain productivity, affecting delta dynamism and riparian communities [64,65].

4.3. Limitations and Future Work

The multi-temporal Landsat Enhanced Thematic Mapper (ETM) images analyzed in this study were obtained during the dry season (January to March) when streamflow level in Tana River is considered to be relatively stable. This, therefore, reduced errors when comparing the land and river banks using satellite images of two different dates. The images were also limited to 30 m spatial resolution and this can introduce mixed land and water pixels at land-water interface leading to minor errors in calculation of land cover maps and river bank locations. Furthermore, streamflow phenomena are often described by great variability, randomness, and uncertainty from the analytical methods applied, and therefore the information derived from the statistical analysis of hydrological data may not always represent the absolute situation. Although hydrological analysis generally follows well-defined and established principles of hydrodynamics, thermodynamics and statistics, non-homogeneous and sparsely sampled natural environment may affect the application of such principles. The hydrological river flow regime variability is triggered by various interactions between human interventions and natural variables [66]. Unusual rainfall and river discharge flow in a drainage basin are important factors that govern the magnitude of a river flow and related potential channel dynamics [67]. Generally, a river flow analysis requires suitable and extensive hydro-meteorological series with the best possible quality. Therefore, an analysis on the quality, consistency, and length of the data is essential. Such data is sometimes rare in most developing countries because they are usually obtained from different public organizations and are often with different formats of time intervals and locations. With these limitations in mind, hydrological characteristics and morphological examination of the Tana River with application of FDC in a nonparametric framework and use of hydrological and satellite data was carried out over the period of study and the results may help, generally, to shed some light on the Tana River downstream floods and related morphodynamics and their implications on the water resources and environment. In addition, being cognizant of significant limitation in distribution density of rain gauges necessary for rainfall and flood analysis, it is recommended that further work considers an analysis of land use change in the study area and use of radar rainfall data which provides a potentially important source of data, particularly for a large catchment with good spatial and temporal resolutions. On the recent river channel dynamics, we used only four sites that were assumed to be morphologically active. For a comprehensive view on how morphodynamics has changed in the study area, readers are referred to Langat, Kumar [68]. Climate change impacts are being felt but estimates of future warming and its effect on the hydrologic cycle cover a broad range and are still uncertain. Therefore, we also recommend that future work should include understanding of the river migration patterns and spatiotemporal vegetation changes within the channel corridor. This will help inform policy makers, irrigators, and water resource managers of the potential effects of these influences and develop risk management strategies for new and existing projects.

5. Conclusions

The present study uses hydrological and satellite data, FDC nonparametric frameworks and geospatial techniques to assess quantitative changes in flow regimes and examine river channel dynamics of four reaches of the Tana River over 17 years. It is concluded that:
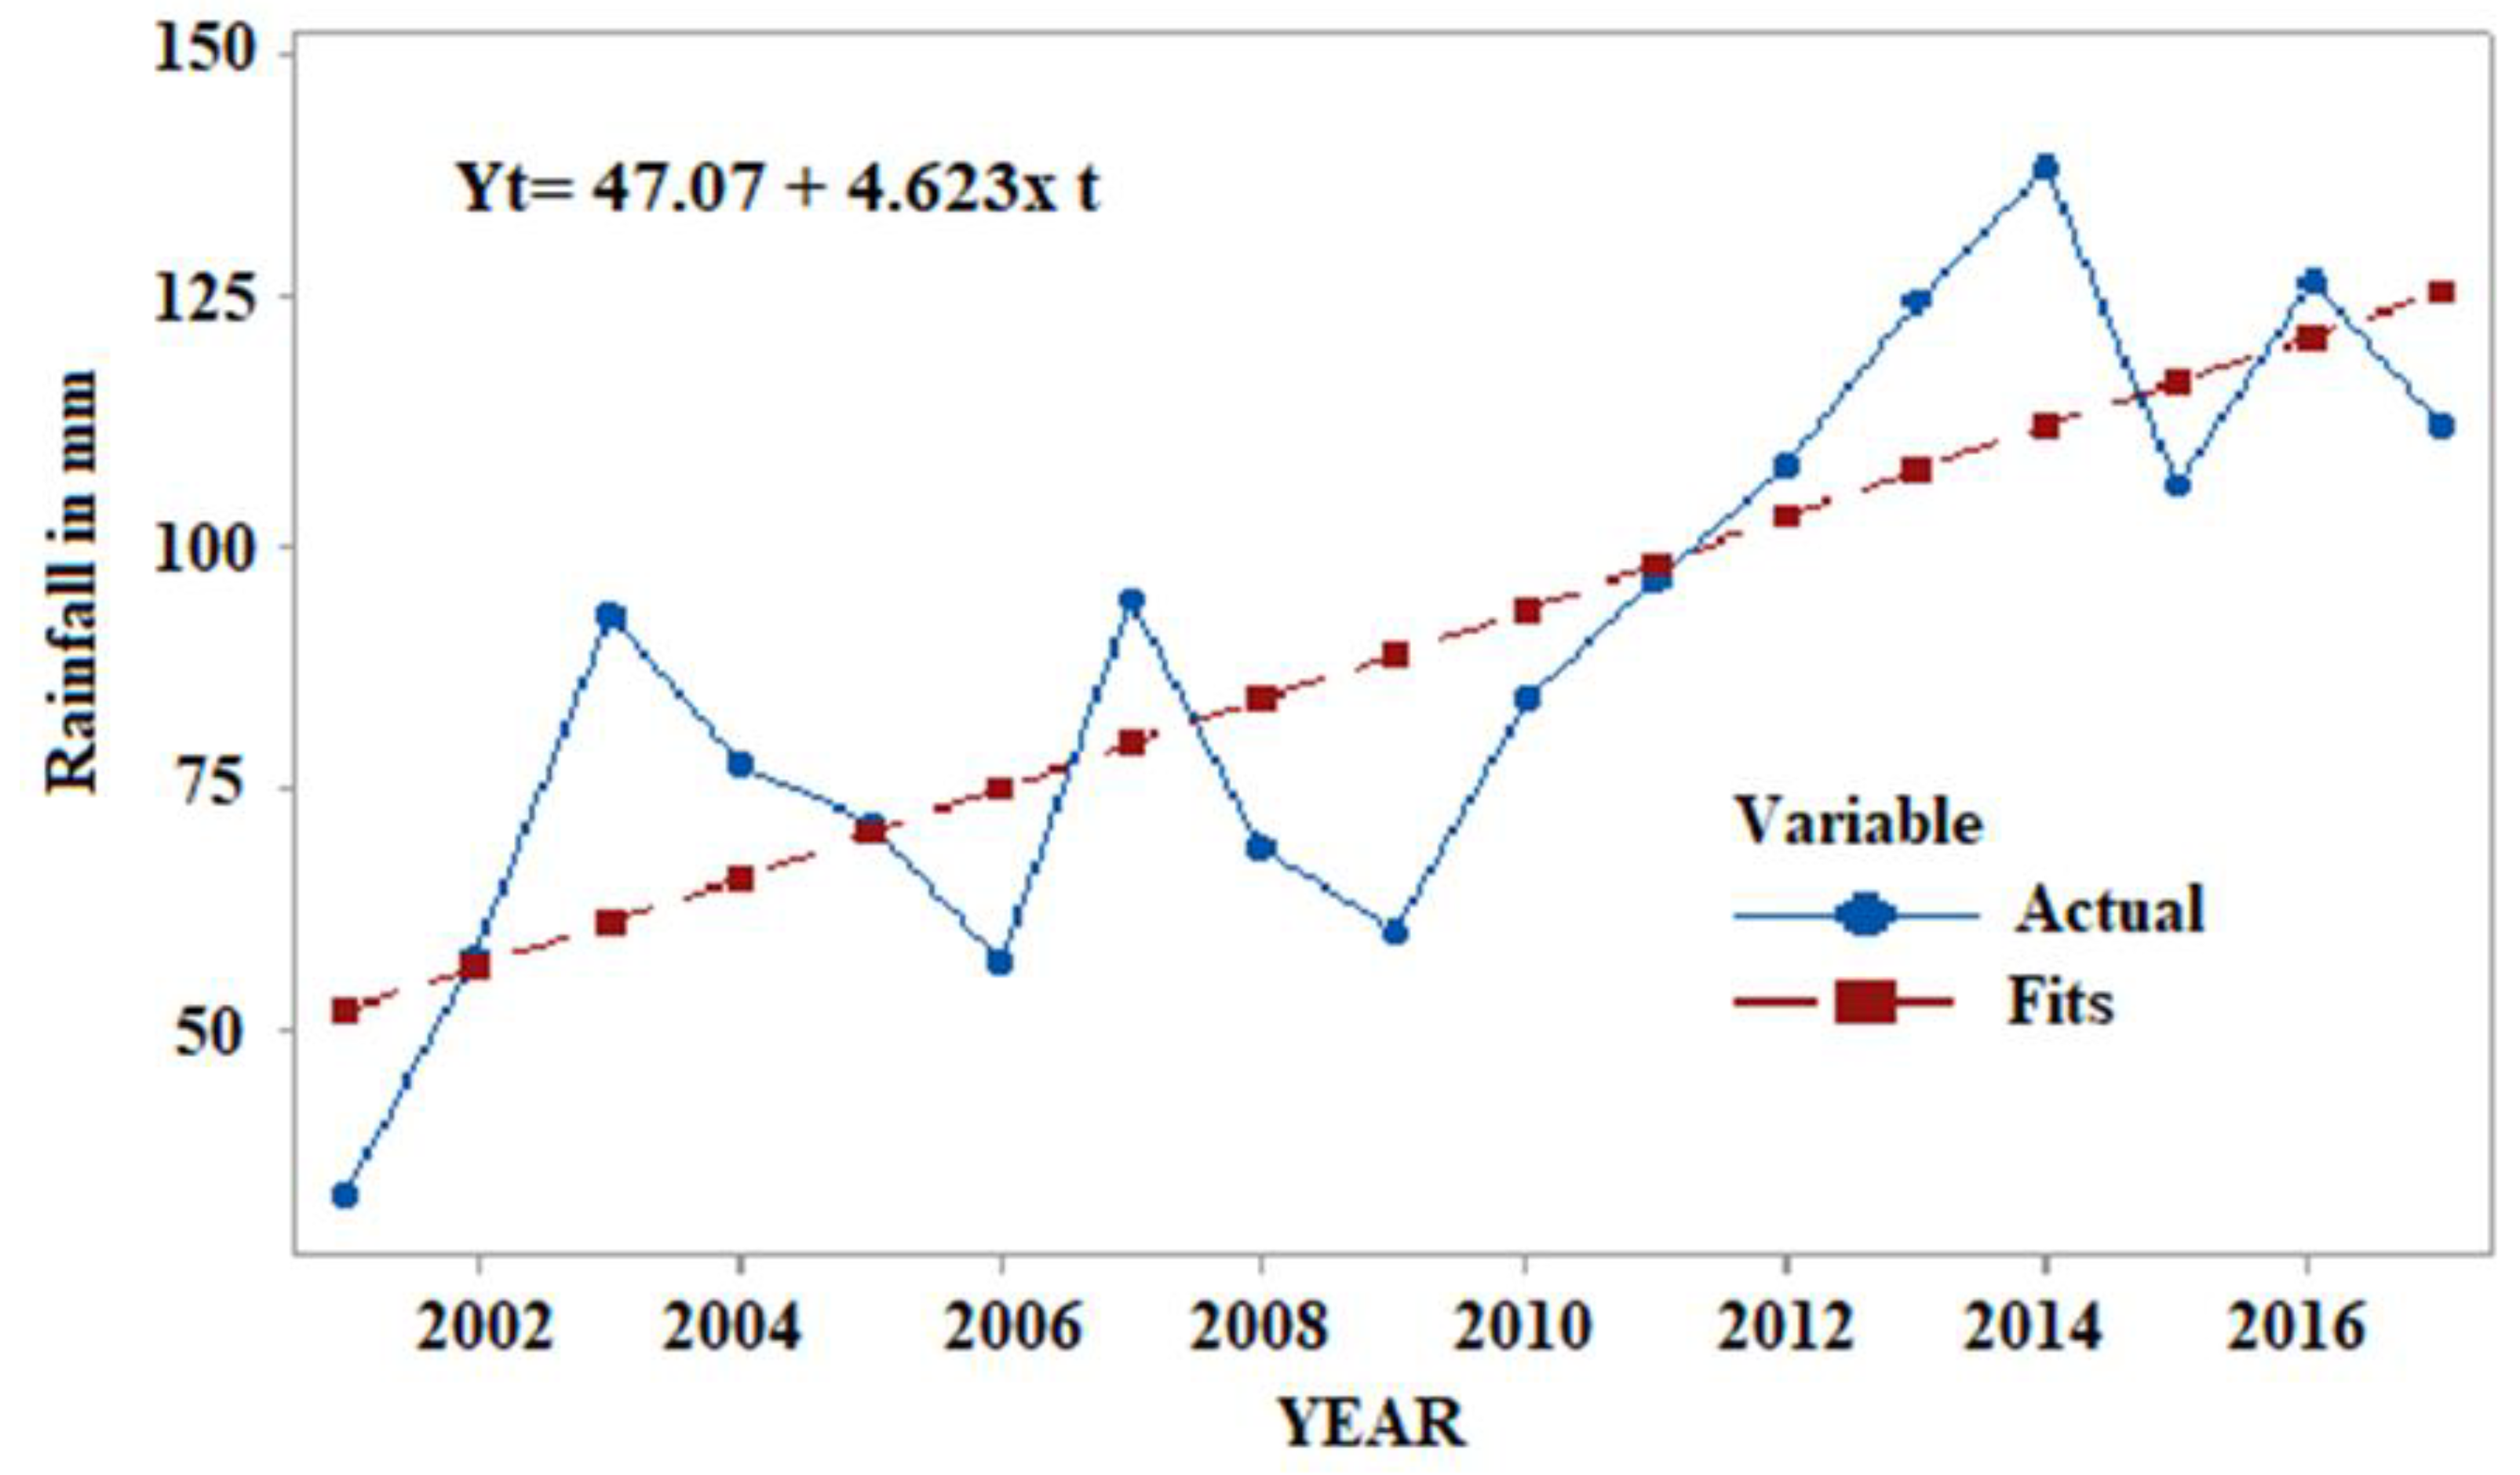
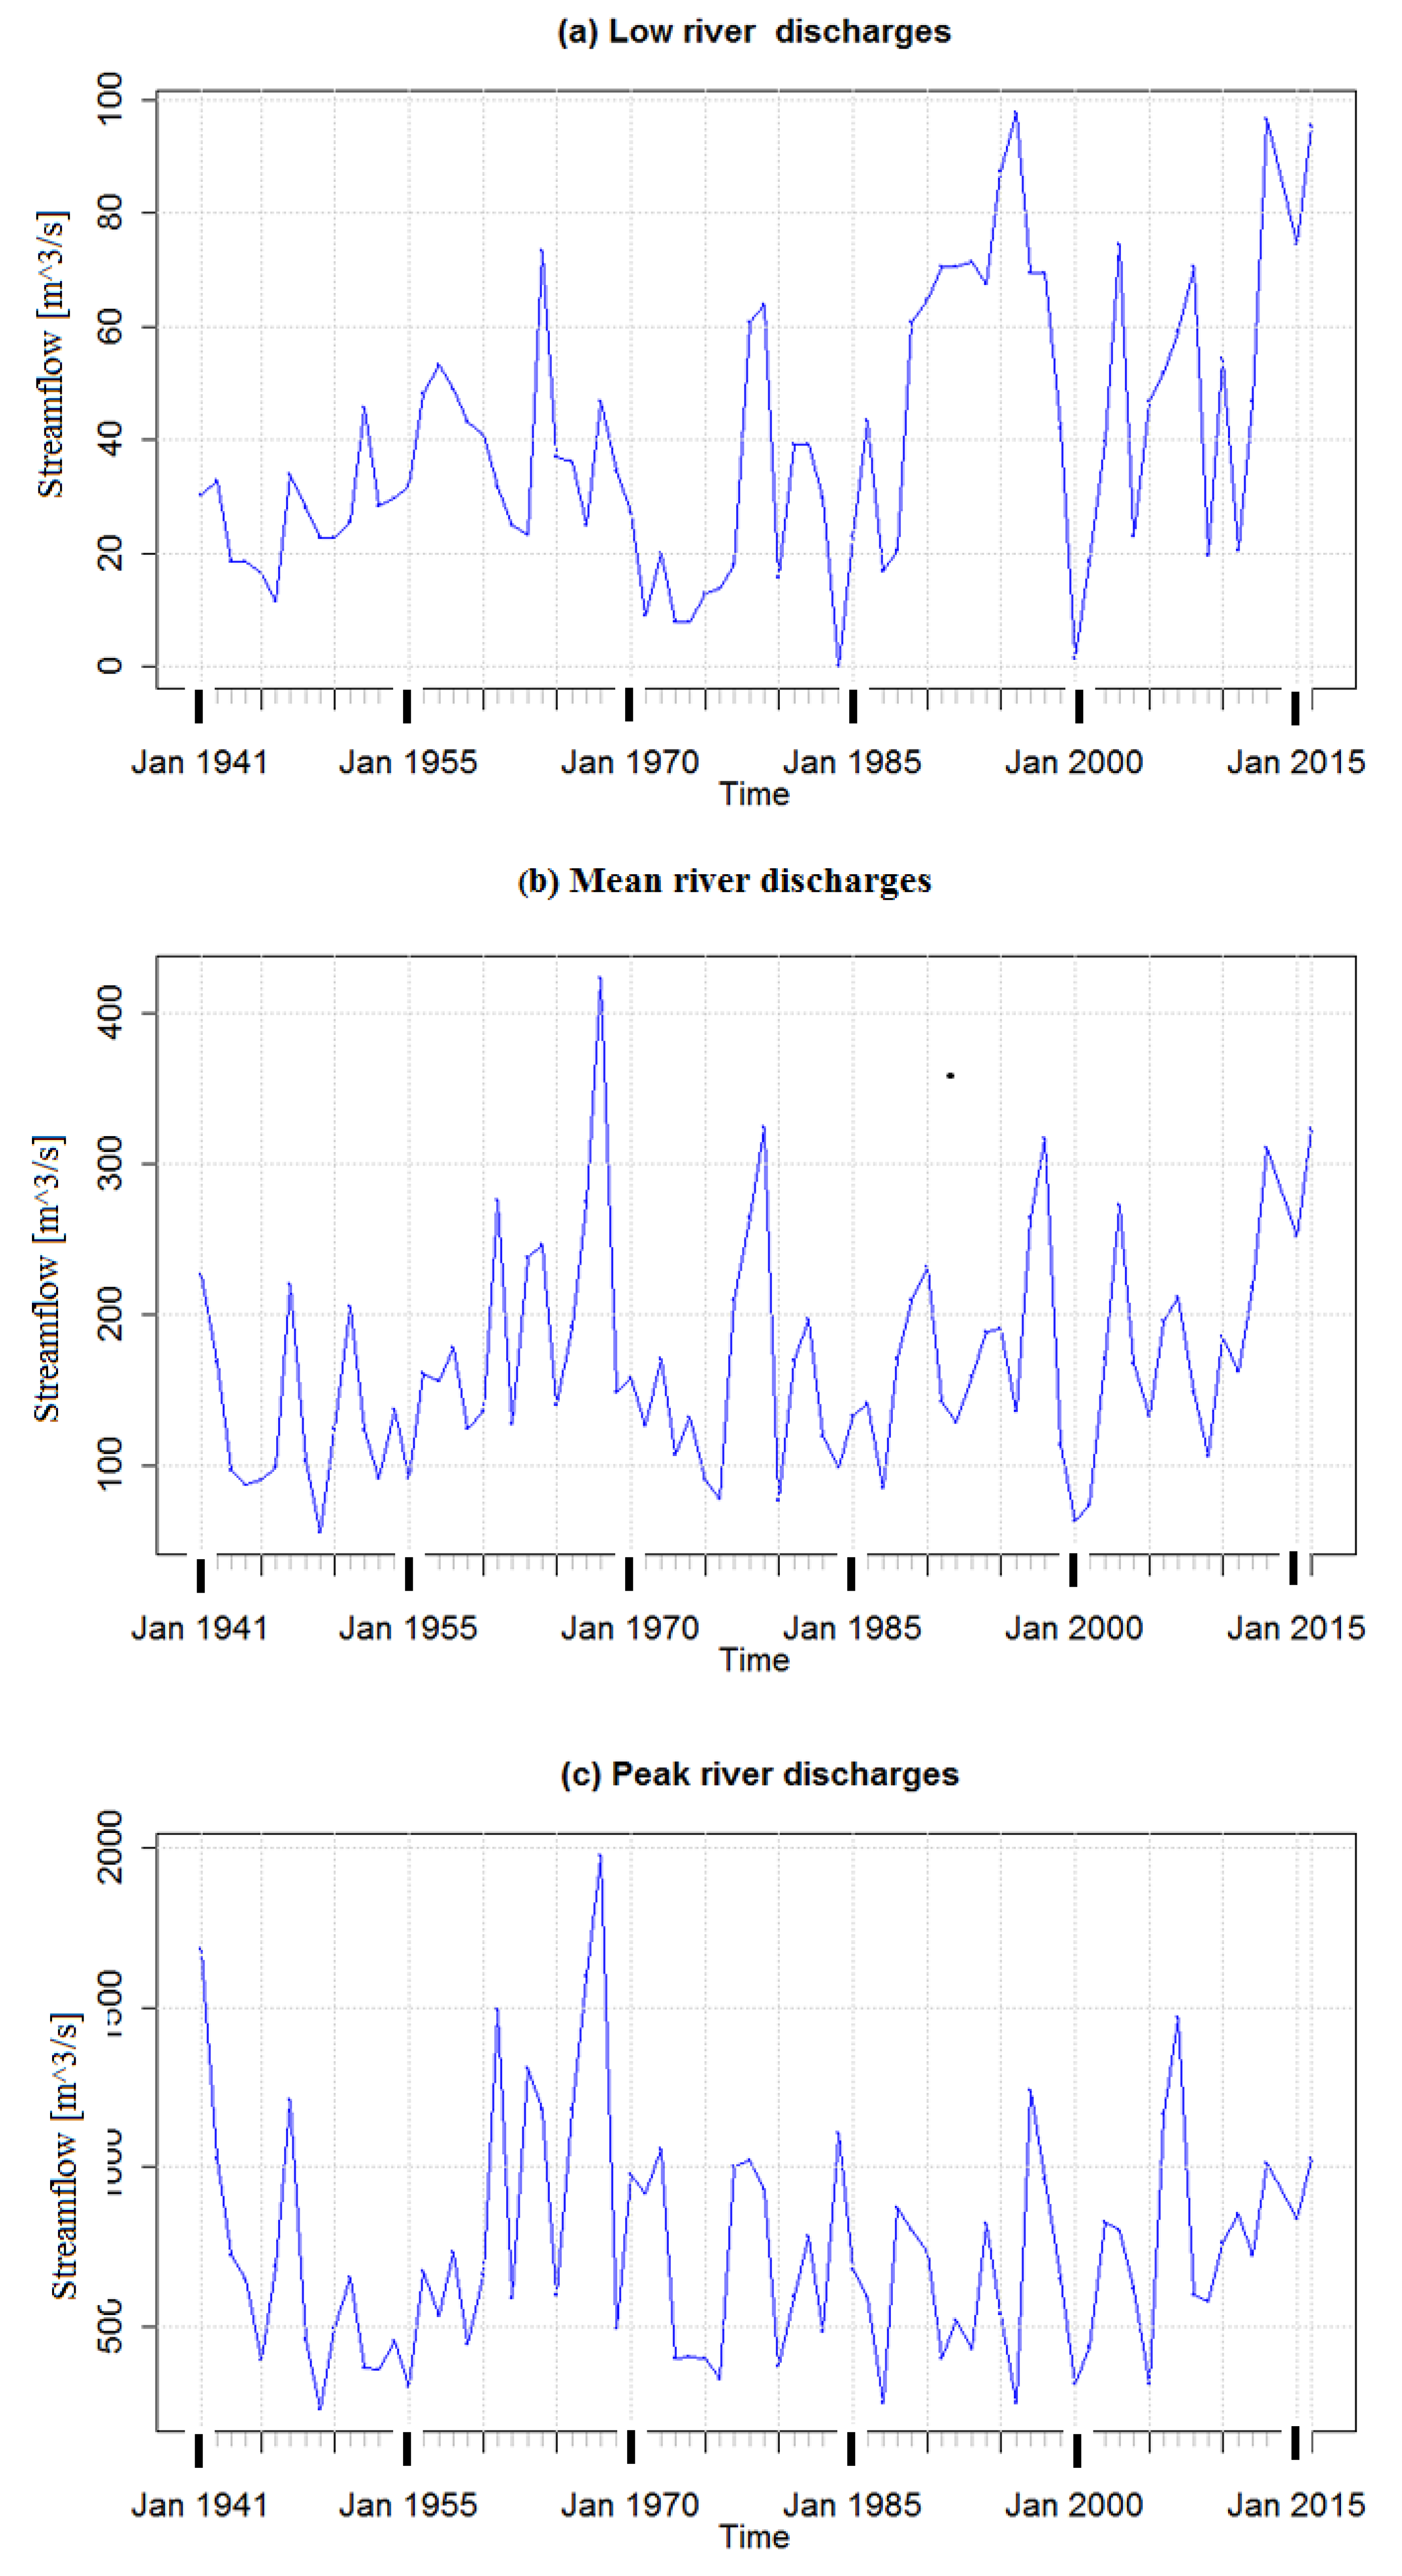
  • River mean, maximum, and minimum streamflow increased, and this is in agreement with rainfall upstream of Tana River basin indicating higher and more variable discharges at Garissa during the recent period.
  • The low-flow and maximum discharge increased by 40 and 56% respectively in the current decade from previous years. This is attributable to changes in land use and climatic factors within the watershed.
  • From the shape of the FDCs (Figure 5 and Figure 6), land use and anthropogenic induced climate are significantly changing for the Tana River Basin.
  • The streamflow decreased after regulation and this supports the assertion that the hydroelectric dams may have had an impact on the Tana River flow regime downstream.
  • During the study period, the Tana River reach under study experienced channel bank movement, width adjustment, and abandonment.
The flow regime analysis in this study are based on the interpretation of streamflow-duration curves and provide a generalized frequency analysis and potential impacts. The use of FDCs in river hydrodynamics has a long history and have found their usefulness in hydropower, water-supply and irrigation planning. This quantitative assessment of the changes in the Tana River flow regimes therefore, provides a guideline for decision-makers and major stakeholders regarding new water projects and the management of water resources. Future work should explore other estimators of parameters of the probability distribution of extremal flood discharge and hydrological drought events and prediction of the human modification and climate change consequences of hydrological regime of the river and channel dynamics. Such information is needed for sustainability of the new projects and livelihoods of communities who rely on the dynamic flow regime and autogenic channel changes of the Tana River.

Author Contributions

The conceptualization of this research article was done by P.K.L. and L.K.; The methodology design and analysis were contributed by P.K.L. under supervision of L.K. and R.K.; P.K.L. and M.K.G. prepared Landsat visualization images; The writing of the original draft was done by P.K.L. and reviewed & Edited by L.K. and R.K.

Funding

This research did not receive any specific grant from funding agencies in the public, commercial, or not-for-profit sectors.

Acknowledgments

We acknowledge the Kenya Department of Meteorology (KMD) and Water Resources Management Authority (WRMA) for the provision of rainfall data and discharge measurements, respectively, used in this study.

Conflicts of Interest

The authors declare no conflict of interest.

References

  1. Saleh, F.; Ducharne, A.; Flipo, N.; Oudin, L.; Ledoux, E. Impact of river bed morphology on discharge and water levels simulated by a 1D Saint–Venant hydraulic model at regional scale. J. Hydrol. 2013, 476, 169–177. [Google Scholar] [CrossRef]
  2. Fuller, I.C.; Large, A.R.; Milan, D.J. Quantifying channel development and sediment transfer following chute cutoff in a wandering gravel-bed river. Geomorphology 2003, 54, 307–323. [Google Scholar] [CrossRef]
  3. Yang, S.; Zhao, Q.; Belkin, I.M. Temporal variation in the sediment load of the Yangtze River and the influences of human activities. J. Hydrol. 2002, 263, 56–71. [Google Scholar] [CrossRef]
  4. Surian, N. Channel changes due to river regulation: The case of the Piave River, Italy. Earth Surf. Processes Landforms 1999, 24, 1135–1151. [Google Scholar] [CrossRef]
  5. Petit, F.; Poinsart, D.; Bravard, J.-P. Channel incision, gravel mining and bedload transport in the Rhône river upstream of Lyon, France (“canal de Miribel”). Catena 1996, 26, 209–226. [Google Scholar] [CrossRef]
  6. Kohler, T.J.; Stanish, L.F.; Steven, C.; Joshua, K.; Daniel, L.; Baeseman, B.J.; McKnight, D.M. Life in the main channel: Long-term hydrologic control of microbial mat abundance in McMurdo Dry Valley streams, Antarctica. Ecosystems 2015, 18, 310–327. [Google Scholar] [CrossRef]
  7. Milly, P.C.D.; Wetherald, R.T.; Dunne, K.A.; Delworth, T.L. Increasing risk of great floods in a changing climate. Nature 2002, 415, 514. [Google Scholar] [CrossRef] [PubMed]
  8. Pumo, D.; Noto, L.V.; Viola, F. Ecohydrological modelling of flow duration curve in Mediterranean river basins. Adv. Water Resour. 2013, 52, 314–327. [Google Scholar] [CrossRef]
  9. Piégay, H.; Kondolf, G.M.; Minear, J.T.; Vaudor, L. Trends in publications in fluvial geomorphology over two decades: A truly new era in the discipline owing to recent technological revolution? Geomorphology 2015, 248, 489–500. [Google Scholar] [CrossRef]
  10. Lane, S.N.; Widdison, P.E.; Thomas, R.E.; Ashworth, P.J.; Best, J.L.; Lunt, I.A.; Sambrook Smith, G.H.; Simpson, C.J. Quantification of braided river channel change using archival digital image analysis. Earth Surf. Processes Landforms 2010, 35, 971–985. [Google Scholar] [CrossRef]
  11. Vogel, R.M.; Fennessey, N.M. Flow duration curves II: A review of applications in water resources planning. J Am. Water Resour. Assoc. 1995, 31, 1029–1039. [Google Scholar] [CrossRef]
  12. Guzha, A.C.; Rufino, M.C.; Okoth, S.; Jacobs, S.; Nóbrega, R.L.B. Impacts of land use and land cover change on surface runoff, discharge and low flows: Evidence from East Africa. J. Hydrol. Reg. Stud. 2018, 15, 49–67. [Google Scholar] [CrossRef]
  13. O’Connell, P.E.; Ewen, J.; O’Donnell, G.; Quinn, P. Is there a link between agricultural land-use management and flooding? Hydrol. Earth Syst. Sci. 2007, 11, 96–107. [Google Scholar] [CrossRef]
  14. Ewen, J.; O’Donnell, G.; Burton, A.; O’Connell, E. Errors and uncertainty in physically-based rainfall-runoff modelling of catchment change effects. J. Hydrol. 2006, 330, 641–650. [Google Scholar] [CrossRef]
  15. Gordon, N.D.; McMahon, T.A.; Finlayson, B.L. Stream Hydrology: An introduction for Ecologists; John Wiley & Sons: Chichester, UK, 1993. [Google Scholar]
  16. Smakhtin, V.U. Low flow hydrology: A review. J. Hydrol. 2001, 240, 147–186. [Google Scholar] [CrossRef]
  17. Zhao, F.; Xu, Z.; Zhang, L. Changes in streamflow regime following vegetation changes from paired catchments. Hydrol. Processes 2012, 26, 1561–1573. [Google Scholar] [CrossRef]
  18. Vogel, R.M.; Fennessey, N.M. Flow-duration curves. I: New interpretation and confidence intervals. J. Water Resour. Plann. Manag. 1994, 120, 485–504. [Google Scholar] [CrossRef]
  19. Gurnell, A.; Downward, S.; Jones, R. Channel planform change on the River Dee meanders, 1876–1992. River Res. Appl. 1994, 9, 187–204. [Google Scholar] [CrossRef]
  20. Bristow, C.S. Brahmaputra River: Channel migration and deposition. SEPM 1987, 63–74. [Google Scholar] [CrossRef]
  21. Mertes, L.A. Remote sensing of riverine landscapes. Freshw. Biol. 2002, 47, 799–816. [Google Scholar] [CrossRef]
  22. Ghosh, M.K.; Kumar, L.; Roy, C. Monitoring the coastline change of Hatiya Island in Bangladesh using remote sensing techniques. ISPRS J. Photogramm. Remote Sens. 2015, 101, 137–144. [Google Scholar] [CrossRef]
  23. Taylor, C. Recognising Channel and Floodplain Forms; Water and Rivers Commission: East Perth, Western Australia, 2002.
  24. Saenyi, W.; Chemelil, M. Modelling of suspended sediment discharge for Masinga catchment reservoir in Kenya. J. Civ. Eng. JKUAT 2003, 8, 89–98. [Google Scholar] [CrossRef]
  25. Temper, L. Let Them Eat Sugar: Life and Livelihood in Kenya’s Tana Delta. 2012. Available online: http://www.ceecec.net/case-studies/let-them-eat-sugar-life-and-livelihood-in-kenyas-tana-delta/ (accessed on 20 November 2018).
  26. Hamerlynck, O.; Nyunja, J.; Luke, Q.; Nyingi, D.; Lebrun, D.; Duvail, S. The communal forest, wetland, rangeland and agricultural landscape mosaics of the Lower Tana, Kenya: A socio-ecological entity in peril. Sustain. Use Biol. Di-Versity Socio-Ecol. Prod. Landsc. 2010, 52, 54. [Google Scholar]
  27. Leauthaud, C.; Belaud, G.; Duvail, S.; Moussa, R.; Grunberger, O.; Albergel, J. Characterizing floods in the poorly gauged wetlands of the Tana River Delta, Kenya, using a water balance model and satellite data. Hydrol. Earth Syst. Sci. 2013, 17, 3059–3075. [Google Scholar] [CrossRef]
  28. Maingi, J.K.; Marsh, S.E. Quantifying hydrologic impacts following dam construction along the Tana River, Kenya. J. Arid Environ. 2002, 50, 53–79. [Google Scholar] [CrossRef]
  29. Koei, N. The Project on the Development of the National Water Master Plan 2030; Final Report; Volume V Sectoral Report (E)—Agriculture and Irrigation; The Republic of Kenya, Water Resources Management Authority: Nairobi, Kenya, 2013. [Google Scholar]
  30. Conway, D.; Persechino, A.; Ardoin-Bardin, S.; Hamandawana, H.; Dieulin, C.; Mahé, G. Rainfall and water resources variability in sub-Saharan Africa during the twentieth century. J. Hydrometeorol. 2009, 10, 41–59. [Google Scholar] [CrossRef]
  31. McClain, M.E. Balancing water resources development and environmental sustainability in Africa: A review of recent research findings and applications. Ambio 2013, 42, 549–565. [Google Scholar] [CrossRef] [PubMed]
  32. Hughes, F.M.R. The Tana River Floodplain Forest, Kenya: Ecology and the Impact of Development. Ph.D. Thesis, University of Cambridge, Cambridge, UK, 1985. [Google Scholar]
  33. Knoop, L.; Sambalino, F.; Steenbergen, F.V. Securing Water and Land in the Tana Basin: A Resource Book for Water Managers and Practitioners; UNEP/3R Water Secretariat: Wageningen, The Netherlands, 2012. [Google Scholar]
  34. Agwata, J.F. Water resources utilization, conflicts and interventions in the Tana basin of Kenya. FWU Water Resour. Publ. 2005, 3, 13–23. [Google Scholar]
  35. Kenya, R.O. High Grand Falls Multipurpose Development Project on River Tana—Feasibility Study; Ministry of Regional Development Authorities: Nairobi, Kenya, 2011. [Google Scholar]
  36. DHV. Tana River Morphology Studies; Delft Hydraulics Laboratory: Delft, The Netherlands, 1986. [Google Scholar]
  37. van Beukering, P.J.H.; de Moel, H.; Botzen, W.J.W.; Eiselin, M.; Kamau, P.; Lange, K.; van Maanen, E.; Mogol, S.; Mulwa, R.; Otieno, P.; et al. The Economics of Ecosystem Services of the Tana River Basin; Institute for Environmental Studies: Amsterdam, The Netherlands, 2015. [Google Scholar]
  38. Baker, T.; Kiptala, J.; Olaka, L.; Oates, N.; Hussain, A.; McCartney, M. Baseline Review and Ecosystem Services Assessment of the Tana River Basin, Kenya; International Water Management Institute (IWMI): Colombo, Sri Lanka, 2015. [Google Scholar]
  39. Team, R. RStudio: Integrated Development for R; RStudio, Inc.: Boston, MA, USA, 2015. [Google Scholar]
  40. Dewan, A.; Corner, R.; Saleem, A.; Rahman, M.M.; Haider, M.R.; Rahman, M.M.; Sarker, M.H. Assessing channel changes of the Ganges-Padma River system in Bangladesh using Landsat and hydrological data. Geomorphology 2017, 276, 257–279. [Google Scholar] [CrossRef]
  41. Ihaka, R.; Gentleman, R. R: A language for data analysis and graphics. J. Comput. Graph. Stat. 1996, 5, 299–314. [Google Scholar]
  42. Zambrano-Bigiarini, M. Package Hydrotsm: Time Series Management, Analyis and Interpolation for Hydrological Modelling. Available online: https://cran.r-project.org/package=hydroTSM (accessed on 25 October 2017).
  43. Cisty, M.; Celar, L. Using R in Water Resources Education. Int. J. Innov. Educ. Res. 2015, 3, 223. [Google Scholar]
  44. NASA. Landsat 7 Science Data Users Handbook; N.A.A.S. Administration: Naas, Ireland, 2011.
  45. Unger Holtz, T.S. Introductory Digital Image Processing: A Remote Sensing Perspective; Association of Environmental & Engineering Geologists: Portland, OR, USA, 2007. [Google Scholar]
  46. Chander, G.; Markham, B. Revised Landsat-5 TM radiometric calibration procedures and postcalibration dynamic ranges. IEEE Trans. Geosci. Remote Sens. 2003, 41, 2674–2677. [Google Scholar] [CrossRef]
  47. Mas, J.-F. Monitoring land-cover changes: A comparison of change detection techniques. Int. J. Remote Sens. 1999, 20, 139–152. [Google Scholar] [CrossRef]
  48. Coppin, P.; Jonckheere, I.; Nackaerts, K.; Muys, B.; Lambin, E. Review ArticleDigital change detection methods in ecosystem monitoring: A review. Int. J. Remote Sens. 2004, 25, 1565–1596. [Google Scholar] [CrossRef]
  49. Xu, H. Modification of normalised difference water index (NDWI) to enhance open water features in remotely sensed imagery. Int. J. Remote Sens. 2006, 27, 3025–3033. [Google Scholar] [CrossRef]
  50. Sunder, S.; Ramsankaran, R.; Ramakrishnan, B. Inter-comparison of remote sensing sensing-based shoreline mapping techniques at different coastal stretches of India. Environ. Monit. Assess. 2017, 189, 290. [Google Scholar] [CrossRef] [PubMed]
  51. Rokni, K.; Ahmad, A.; Selamat, A.; Hazini, S. Water feature extraction and change detection using multitemporal Landsat imagery. Remote Sens. 2014, 6, 4173–4189. [Google Scholar] [CrossRef]
  52. Ma, M.; Wang, X.; Veroustraete, F.; Dong, L. Change in area of Ebinur Lake during the 1998–2005 period. Int. J. Remote Sens. 2007, 28, 5523–5533. [Google Scholar] [CrossRef]
  53. Mann, H.B. Nonparametric tests against trend. Econ. J. Econ. Soc. 1945, 51, 245–259. [Google Scholar] [CrossRef]
  54. Andrews, E.; Nankervis, J.M. Effective discharge and the design of channel maintenance flows for gravel-bed rivers. Nat. Anthropog. Influ. Fluvial Geomorphol. 1995, 89, 151–164. [Google Scholar]
  55. Geeraert, N.; Omengo, F.O.; Tamooh, F.; Paron, P.; Bouillon, S.; Govers, G. Sediment yield of the lower Tana River, Kenya, is insensitive to dam construction: Sediment mobilization processes in a semi-arid tropical river system. Earth Surf. Process. Landf. 2015, 40, 1827–1838. [Google Scholar] [CrossRef]
  56. Magilligan, F.J.; Haynie, H.J.; Nislow, K.H. Channel adjustments to dams in the Connecticut River basin: Implications for forested mesic watersheds. Ann. Assoc. Am. Geogr. 2008, 98, 267–284. [Google Scholar] [CrossRef]
  57. Piao, S.; Ciais, P.; Huang, Y.; Shen, Z.; Peng, S.; Li, J.; Zhou, L.; Liu, H.; Ma, Y.; Ding, Y.; et al. The impacts of climate change on water resources and agriculture in China. Nature 2010, 467, 43. [Google Scholar] [CrossRef] [PubMed]
  58. Langat, P.K.; Kumar, L.; Koech, R. Temporal Variability and Trends of Rainfall and Streamflow in Tana River Basin, Kenya. Sustainability 2017, 9, 1963. [Google Scholar] [CrossRef]
  59. Ioana-Toroimac, G.; Zaharia, L.; Minea, G.; Moroșanu, G.A. Using a multi-criteria analysis to identify rivers with hydromorphological restoration priority: Braided rivers in the south-eastern Subcarpathians (Romania). Sci. Total Environ. 2017, 599, 700–709. [Google Scholar] [CrossRef] [PubMed]
  60. Gao, B.; Li, J.; Wang, X. Analyzing Changes in the Flow Regime of the Yangtze River Using the Eco-Flow Metrics and IHA Metrics. Water 2018, 10, 1552. [Google Scholar] [CrossRef]
  61. Vogel, R.M.; Sieber, J.; Archfield, S.A.; Smith, M.P.; Apse, C.D.; Huber-Lee, A. Relations among storage, yield, and instream flow. Water Resour. Res. 2007, 43, 5226. [Google Scholar] [CrossRef]
  62. Pachauri, R.; Meyer, L. IPCC 2014: Climate Change 2014: Synthesis Report. Contribution of Working Groups I. II and III to the Fifth Assessment Report of the Intergovernmental Panel on Climate Change; IPCC: Geneva, Switzerland, 2014. [Google Scholar]
  63. Keskinen, M.; Kummu, M.; Käkönen, M.; Varis, O. Mekong at the crossroads: Next steps for impact assessment of large dams. Ambio 2012, 41, 319–324. [Google Scholar] [CrossRef]
  64. Lemly, A.D.; Kingsford, R.T.; Thompson, J.R. Irrigated agriculture and wildlife conservation: Conflict on a global scale. Environ. Manag. 2000, 25, 485–512. [Google Scholar] [CrossRef]
  65. Prowse, T.D.; Peters, D.; Beltaos, S.; Pietroniro, A.; Romolo, L.; Töyrä, J.; Leconte, R. Restoring ice-jam floodwater to a drying delta ecosystem. Water Int. 2002, 27, 58–69. [Google Scholar] [CrossRef]
  66. Min, S.-K.; Zhang, X.; Zwiers, F.W.; Hegerl, G.C. Human contribution to more-intense precipitation extremes. Nature 2011, 470, 378. [Google Scholar] [CrossRef] [PubMed]
  67. Pender, G.; Faulkner, H. Flood Risk Science and Management; John Wiley & Sons: Hoboken, NJ, USA, 2010. [Google Scholar]
  68. Langat, P.K.; Kumar, L.; Koech, R. Monitoring river channel dynamics using remote sensing and GIS techniques. Geomorphology 2019, 325, 92–102. [Google Scholar] [CrossRef]
Figure 1. Satellite image showing the Tana River reach under study and the Digital Elevation Model of the basin. The Kenya and Tana River Basin boundaries are shown in the side map and selected sites for detailed study on river channel changes are labelled as sites A, B, C, and D, as shown in the map.
Water 11 00309 g001
Figure 2. Trend of mean annual rainfall in the upper Tana Basin upstream of Garissa river gauging station between 2000 and 2016.
Water 11 00309 g002
Figure 3. (a) Historical daily discharge measurements and (b) distribution of median monthly Tana River streamflows (period 2000–2016) based on daily readings at Garissa gauging station. Outliers are denoted by “°”.
Water 11 00309 g003
Figure 4. Extremal values of Tana River from Garissa stage gauge records (2000–2016).
Water 11 00309 g004
Figure 5. Flow Duration Curve of Tana River, comparing 1941–1980 and 1989–2016 periods showing observed streamflows (Qobs) for two uncertainty bounds (95PPU being upper bound at 95% confidence level).
Water 11 00309 g005
Figure 6. Flow Duration Curve of Tana River, comparing period 2000–2010 and period 2011–2016 showing observed streamflows (Qobs) for two uncertainty bounds (95PPU being upper bound at 95% confidence level).
Water 11 00309 g006
Figure 7. Flow characteristics for the Garissa gauging station showing discharge equaled or exceeded and the proportion of the time (%) for the periods 2000–2010 and 2011–2016.
Water 11 00309 g007
Figure 8. Modified Normalized Difference Water Index (MNDWI) and classified (land and water) images of study Tana River reach in 2000.
Water 11 00309 g008
Figure 9. Modified Normalized Difference Water Index (MNDWI) and classified (land and water) images of the study Tana River reach in 2017.
Water 11 00309 g009
Figure 10. Spatio-temporal river channel dynamics map of Tana River at the study reach based on image analysis from 2000 to 2017. (ad) refer to sites A, B, C, and D respectively in Figure 8.
Water 11 00309 g010
Table 1. Average temporal river width along each reach.
ReachWidth in m% Change
20002017
A383.5420.258.74
B361.5274.83−31.53
C187.67161.5−16.2
D141.8144.61.94

