Article

Calculation of Joint Return Period for Connected Edge Data


1
College of Engineering, Ocean University of China, Qingdao 266100, China
2
College of Engineering, University of California Berkeley, Berkeley, CA 94720, USA
3
School of Management, Xi’an University of Architecture and Technology, Xi’an 710055, China
4
School of Mathematical Sciences, Ocean University of China, Qingdao 266100, China
5
Molecular and Computational Biology, University of Southern California, Los Angeles, CA 90089, USA
*
Author to whom correspondence should be addressed.
Water 2019, 11(2), 300; https://doi.org/10.3390/w11020300
Submission received: 11 December 2018 / Revised: 31 January 2019 / Accepted: 1 February 2019 / Published: 11 February 2019
(This article belongs to the Section Hydraulics and Hydrodynamics)

Abstract

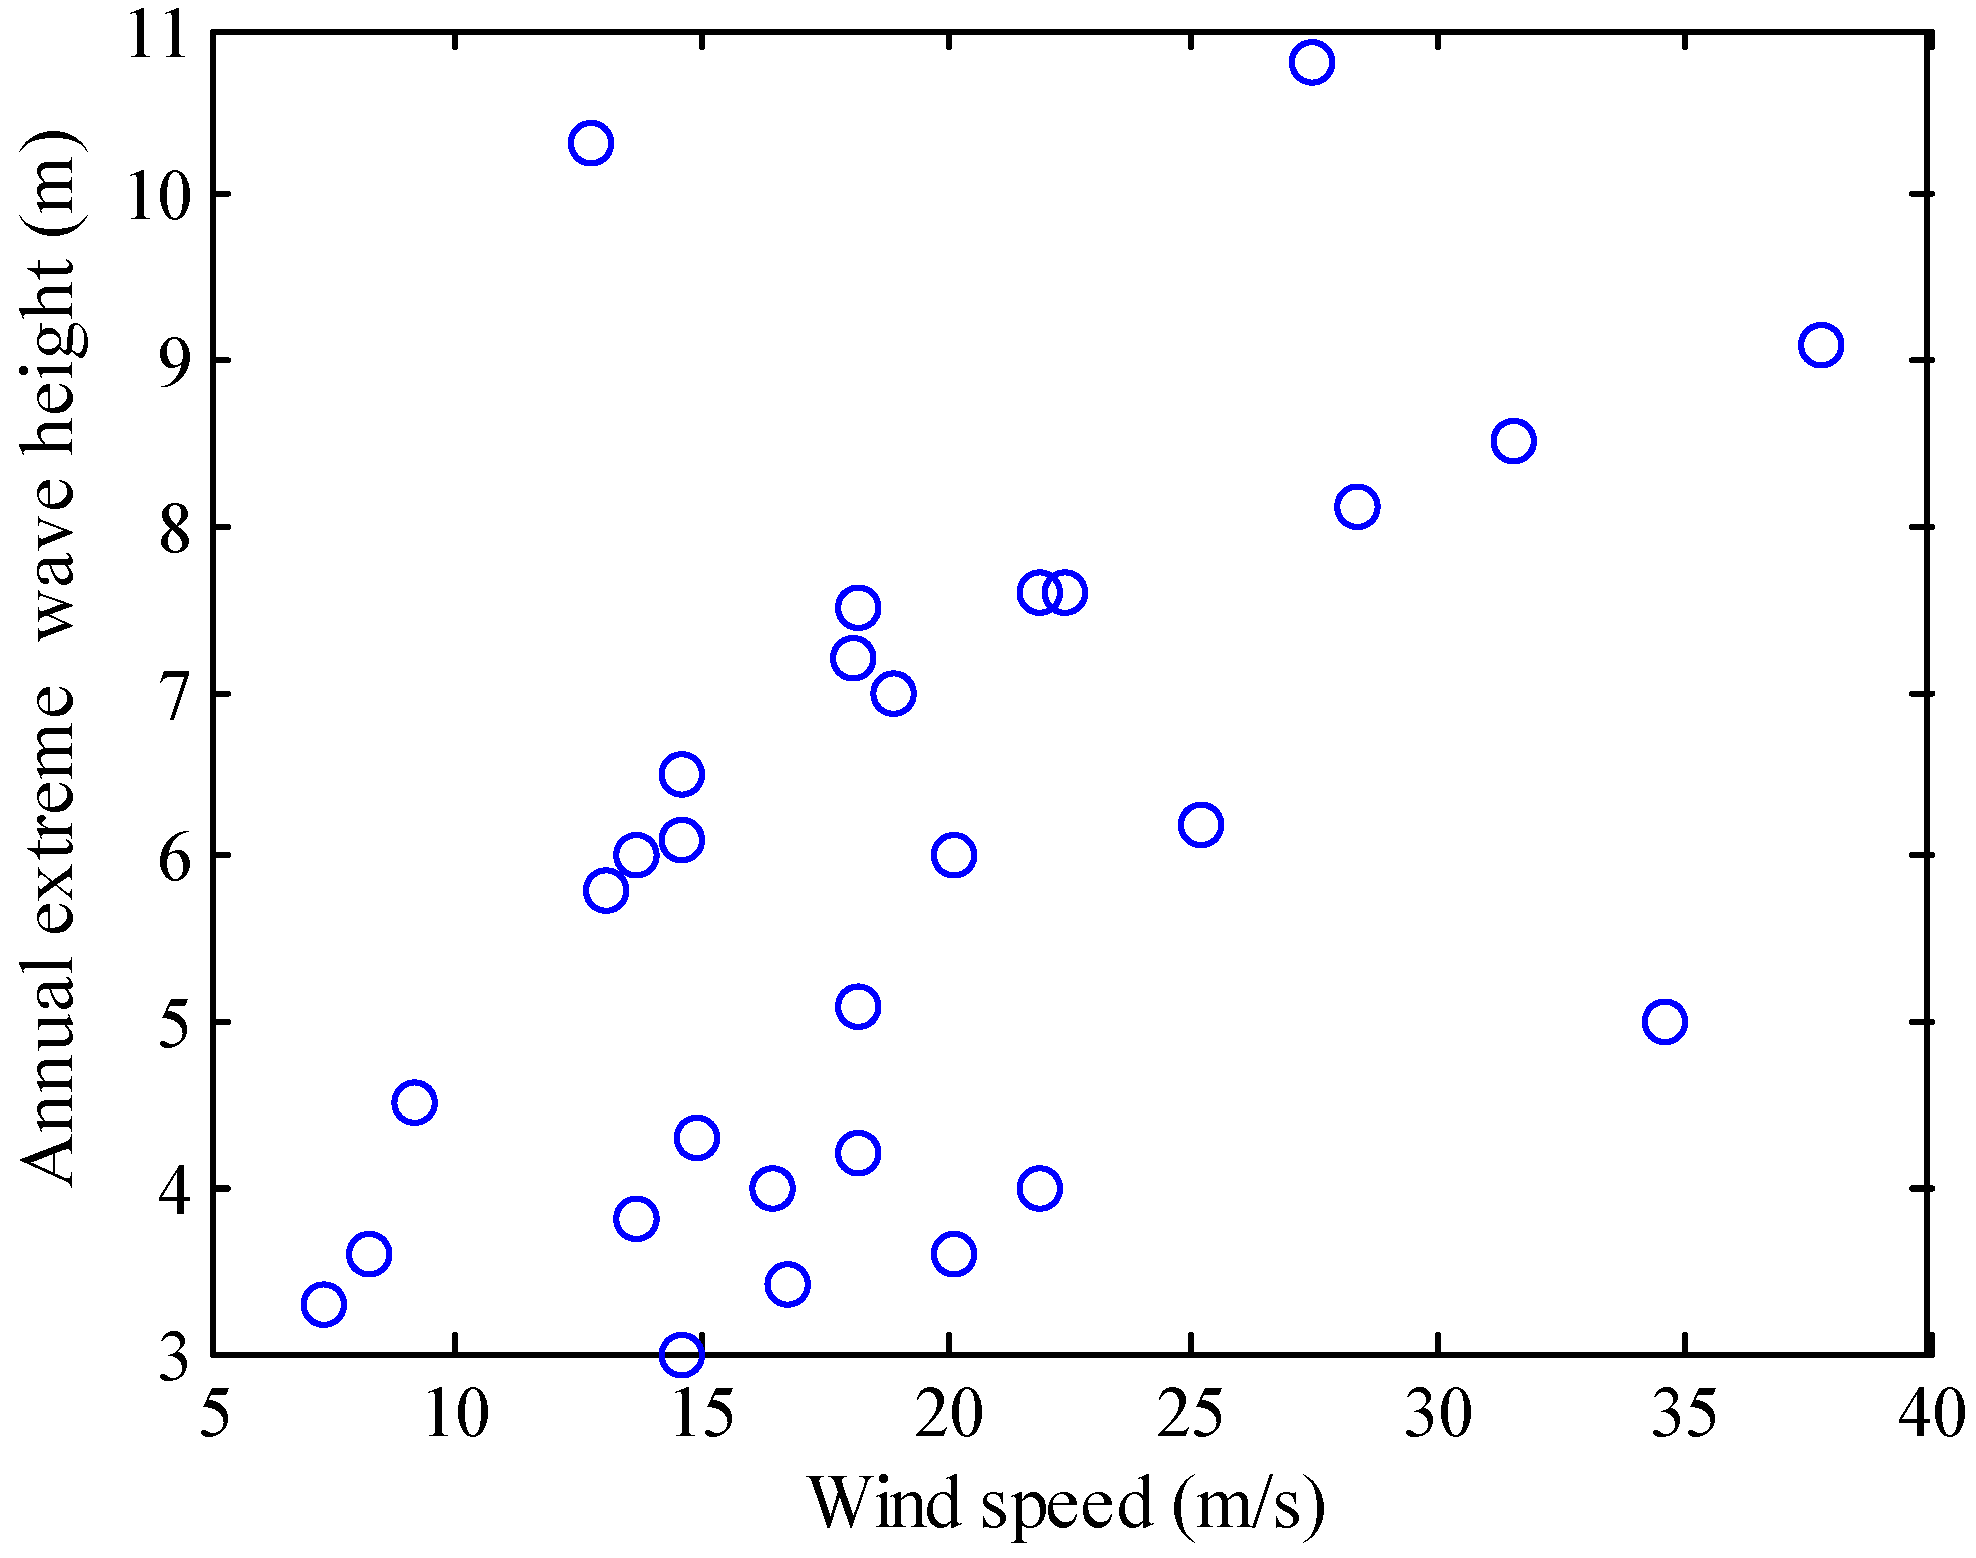
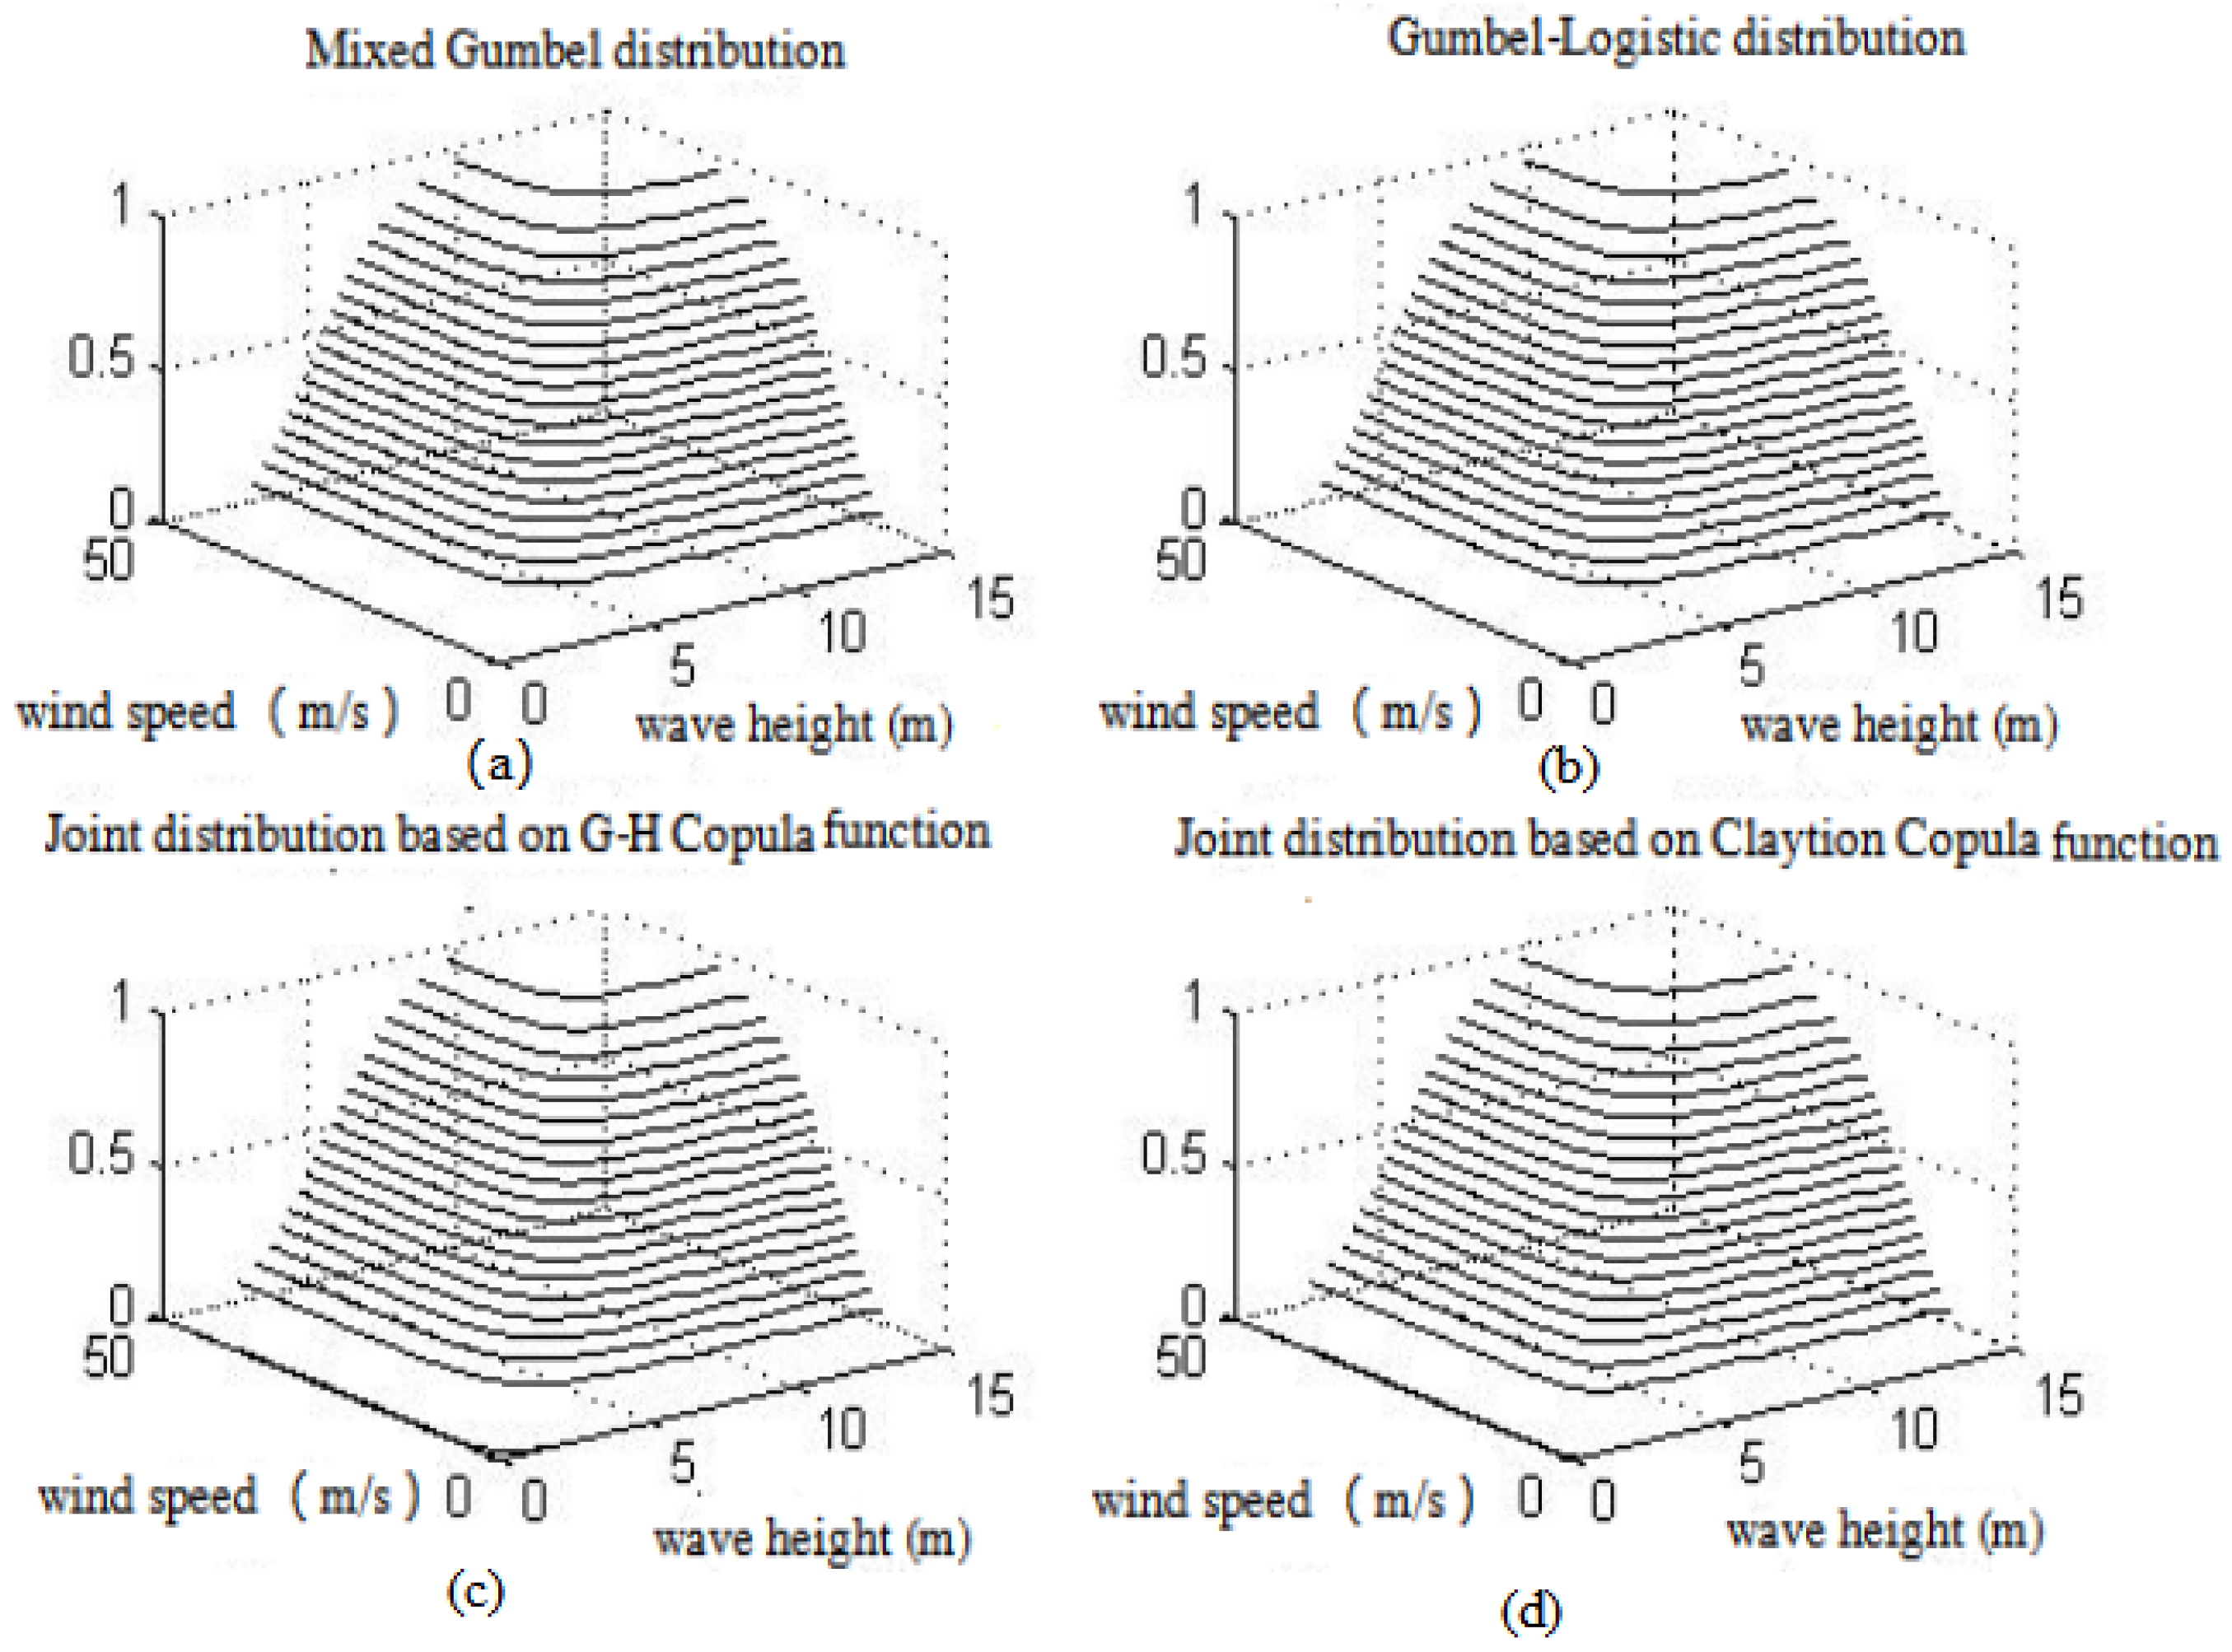
For better displaying the statistical properties of measured data, it is particularly important to select a suitable multivariate joint distribution model in ocean engineering. According to the characteristics and properties of Copula functions and the correlation analysis of measured data, the nonlinear relationship between random variables can be captured. Additionally, the models based on the Copula theory have more general applicability. A series of correlation measure index, derived from Copula functions, can expand the correlation measure range among variables. In this paper, by means of the correlation analysis between the annual extreme wave height and the corresponding wind speed, their joint distribution models were studied. The newly established two-dimensional joint distribution functions of the extreme wave height and the corresponding wind speed were compared with the existing two-dimensional joint distributions.
Keywords: Copula functions; mixed Gumbel distribution; Gumbel-logistic distribution; the joint return period Copula functions; mixed Gumbel distribution; Gumbel-logistic distribution; the joint return period