Article

North German Lowland Lakes Miss Ecological Water Quality Standards—A Lake Type Specific Analysis

1
Department of Freshwater Conservation, Brandenburg University of Technology Cottbus—Senftenberg, Bad Saarow, Seestraße 45, D-15526 Bad Saarow, Germany
2
Department W14, State Office of Environment (LfU), Seeburger Chaussee 2, D-14476 Potsdam, OT Groß Glienicke, Germany
3
Berlin-Brandenburg State Laboratory (LLBB), Department IV-2, Rudower Chaussee 39, 12489 Berlin, Germany
*
Author to whom correspondence should be addressed.
Water 2019, 11(12), 2547; https://doi.org/10.3390/w11122547
Submission received: 2 October 2019 / Revised: 16 November 2019 / Accepted: 19 November 2019 / Published: 2 December 2019
(This article belongs to the Special Issue Water Quality of Freshwater Ecosystems in a Temperate Climate)

Abstract

:
Despite great efforts in point source reductions due to improved wastewater treatment since 1990, more than 70% of the lakes in Germany have not yet achieved the “good ecological status” according to the European Water Framework Directive (WFD). To elicit lake type-specific causes of this failure, we firstly analyzed the ecological status of 183 lakes in NE Germany (Federal State of Brandenburg), as reported to the European Commission in 2015. Secondly, long-term data of two typical lakes (a very shallow polymictic lake with a large and a deep stratified lake with a small catchment area in relation to lake volume) and nutrient load from the common catchment were investigated. About 64%–83% of stratified and even 96% of polymictic shallow lakes in Brandenburg currently fail the WFD aims. Excessive nutrient emissions from agriculture were identified as the main cause of this failure. While stratified deep lakes with small catchments have the best chances of recovery, the deficits in catchment management are amplified downstream in lake chains, so that especially shallow lakes in a large catchment are unlikely to reach good ecological conditions. If the objectives of the WFD are not questioned, agricultural practices and approaches in land use have to be fundamentally improved.

Graphical Abstract

1. Introduction

The pollution and shortage of freshwater resources are worldwide problems. The European Water Framework Directive takes account of the high value of water and the need to protect this precious resource when it starts with the following words: “Water is not a commercial product like any other but, rather, a heritage, which must be protected, defended and treated as such.” [1]. The WFD was established by the European Commission (EC) in 2000 to ensure sustainable water management based on River Basin Management Plans (RBMP) and programs of measures. It provides a legislative framework, which commits the member states of the European Union to preventing deterioration of the aquatic environment and achieving good status of all water bodies (groundwater, rivers, lakes, transitional waters, and coastal waters). This includes the biological, hydromorphological, physicochemical, and chemical quality of water bodies. The aim of the WFD is to achieve a “good ecological status” for natural waters. Initially set for 2015 (by the end of the First RBMP), this target is now to be achieved by 2027, but there is growing concern that this is a long way from being achieved in many countries. Continued efforts are, therefore, needed to integrate water policy into other policy areas such as agriculture, urban planning, energy, and climate [2]. Eutrophication is still one of the major environmental problems across Europe. Agricultural or diffuse losses (agriculture plus background) account for more than 60% of the total nitrogen (N) load. For phosphorus (P), point sources tend to be the most significant source in European countries. However, as point source discharges have been reduced markedly during the last 15 years, agriculture has sometimes become the main P source [3]. In contrast to point sources, the quantification of nutrient losses from diffuse sources is a challenging task and several nutrient models have been developed worldwide in an attempt to describe and quantify nutrient transfers from fields to the aquatic environment [4].
For the assessment of lake water quality, the WFD requests the inclusion of different groups of organisms (biological quality elements). Therefore, national assessment methods have been developed during the implementation of the WFD [5], which have been intercalibrated subsequently in geographical intercalibration groups (GIGs) [6,7]. Water quality assessment requires the comparison of the present state of a water body to a lake type-specific reference state, which is defined as a slight deviation from natural conditions due to anthropogenic impact.
In Germany, the typification system by the Federal State Working Group Water (LAWA) [8] is used. Most of the WFD-relevant lakes ≥50 ha (which represents less than 10% of the total number of lakes) are located in the ecoregion of the German lowlands or in the Lowland Central/Baltic (L-CB) according to the intercalibration [7]. Phytoplankton is the biological quality element most widely used for the assessment of lakes. The assessment system for this biological quality element in German lakes (Phyto-See-Index, PSI) considers total biomass, algal classes, and indicator species of phytoplankton. A manual [9] and a Microsoft Access-based tool for calculations [10] are available. The sampling instruction for standing waters was also standardized to ensure better comparability of data [11]. Furthermore, assessment systems were developed for submerged macrophytes and microphytobenthos (PHYLIB) [12] and for elements of the aquatic fauna, such as macrozoobenthos [13] and fish [14].
By the end of the first RBMP in 2015, most German lakes (74%) did not achieve the “good ecological status” [15], which is below the European average [16]. Therefore, the first aim of this study is to identify the causes of missed targets. For this purpose, data of about 200 natural lakes ≥ 50 ha in the Federal State of Brandenburg (North German lowlands), a region rich in surface waters were analyzed. About 3000 lakes and 33,000 km of river course cover 2% of the state area. Intact landscapes and ecosystems, including lakes and their water quality are of significant economic importance for tourism and recreation, but also for transportation, agriculture, and fisheries. In the past century, eutrophication through the excessive input of nutrients from intensive agriculture and insufficient treated municipal wastewater caused a massive deterioration of water quality in most lakes of the area studied. However, the German reunification in 1990 marked a change characterized by the beginning of substantial restoration measures in the catchment areas, especially by improved treatment of wastewater.
The second aim of the study is to analyze the influence of morphometry, land use, catchment size, and hydrology (water residence time) on water quality. To that end, long-term water quality data (1994–2018) of two lakes were analyzed to study their response after load reduction. Both lakes are situated in the same catchment (Scharmützelsee region, Brandenburg). Nutrient emissions from the catchment and resulting loads to the surface waters were estimated by an adapted nutrient export coefficient approach and verified by empirical models. These lakes represent two of the most frequent lake types occurring in North German lowlands: The very shallow polymictic lake with a large catchment area and the deep stratified lake with a small catchment in relation to lake volume. Both lakes are part of a chain of lakes, which is a typical element of this landscape.
Specifically, we want to answer the following scientific questions: How do deep and shallow lakes respond to a reduction in nitrogen and phosphorus loads and in-lake concentrations as limiting nutrients? Do the ecological quality elements macrophytes and phytoplankton respond in a similar manner on the nutrient reduction? How efficient is nutrient recycling in shallow lakes to oppose nutrient loading reductions [17]? Finally, statistical analyses and case studies in combination allow to derive fundamental lake type-specific causes for missing the WFD water quality objectives and commenting of the requirements for the achievement and adequacy of these objectives.

2. Materials and Methods
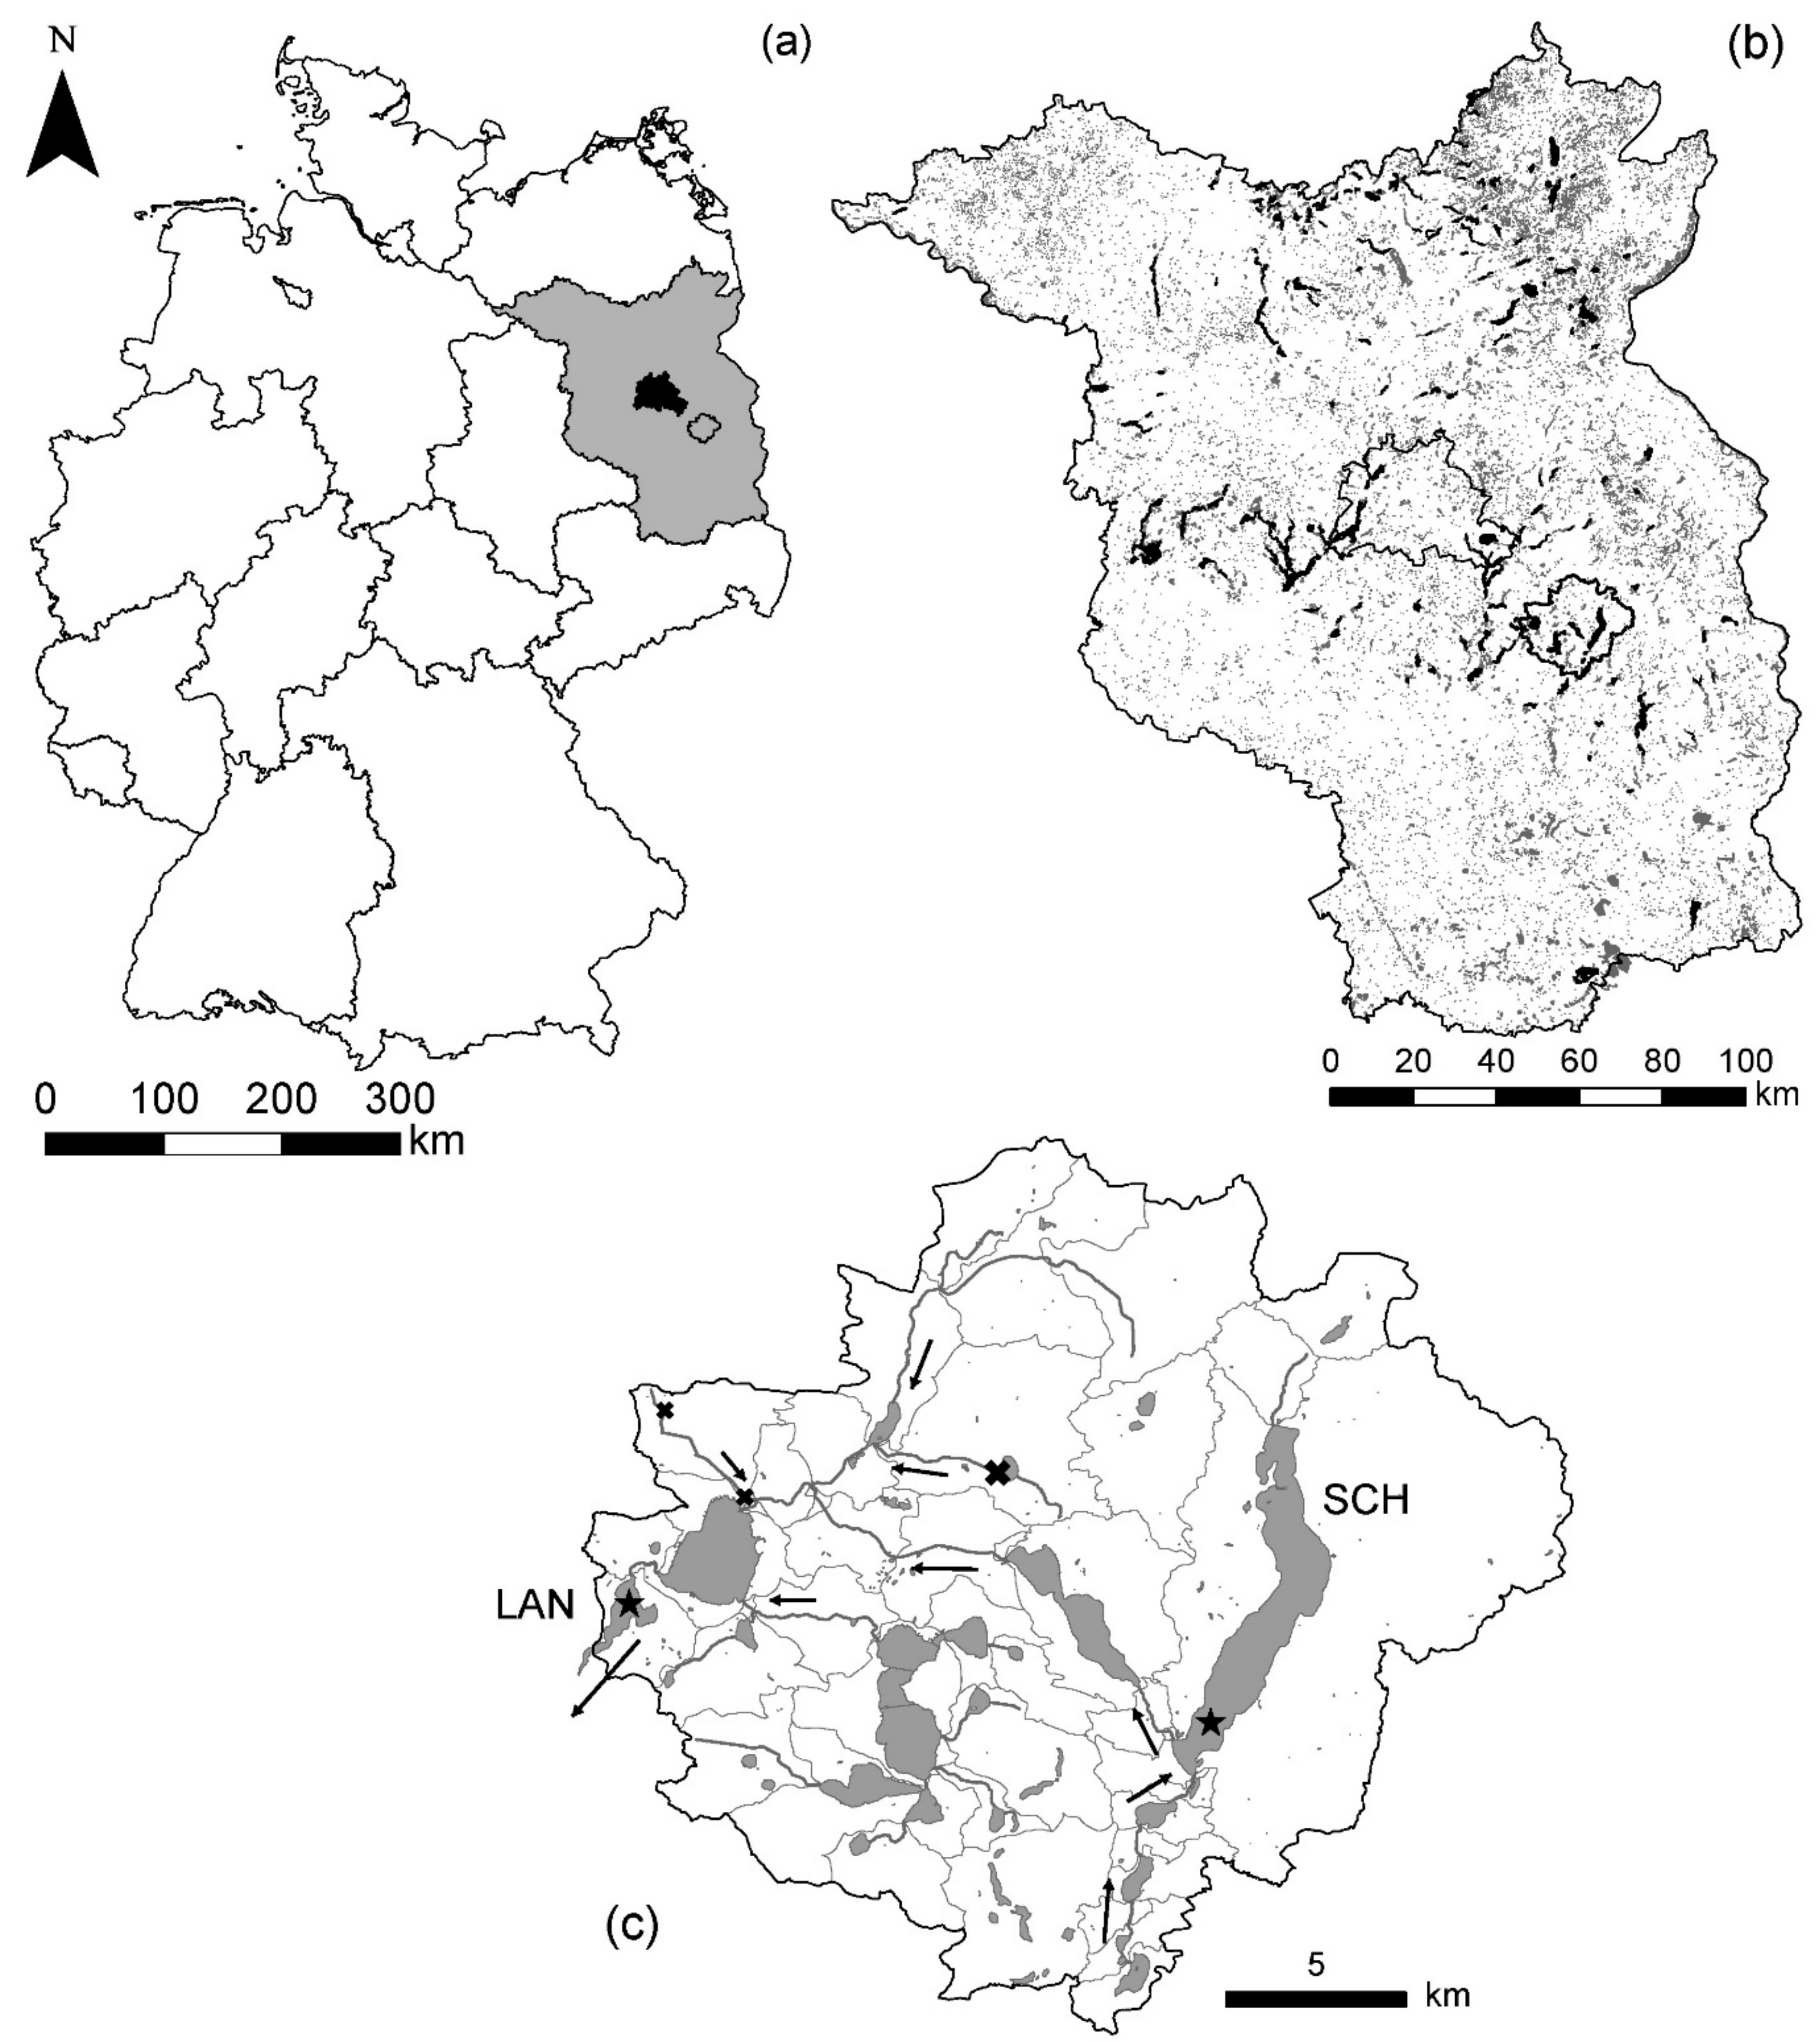
2.1. Study Sites

2.1.1. Brandenburg Lakes

Brandenburg is a Federal State in the northeastern part of Germany (Figure 1a) with an area of 29,654 km² and two and a half million inhabitants. Berlin, the capital of Germany, and Brandenburg constitute the common capital region of Berlin-Brandenburg containing six million inhabitants, with 4.4 million in the affluent suburbs.
Brandenburg is naturally rich in running and standing waters: A network of waterways consisting of 33,000 km of river course and 3000 lakes mainly belonging to the catchment areas of the rivers Elbe and Oder. Surface waters cover 1000 km², i.e., 2% of the state area. The distribution of lakes in Brandenburg is shown in Figure 1b. There has been a change in land use and transport demands for construction materials, fuel, and agricultural products over the last few centuries. Small rivers were made navigable for ships and were linked still further by canals from the 17th century onwards. Large-scale agricultural land modifications led to the irrigation or drainage of large areas [18]. The natural wealth of lakes has been further increased by the formation of mining lakes in southeast Brandenburg following large-scale opencast lignite mining. Some of the lakes developed are bigger and deeper than the largest natural lakes.
The supply of water in Brandenburg is limited due to the influence of the continental climate. The annual rainfall (576 mm, long-term mean 1981–2010, Meteorological Observatory of DWD in Lindenberg, 10 km apart from Scharmützelsee region [19]) is the lowest in Germany. Most of the lakes are discharge regulated to prevent water level dropdown at times of low rainfall. Climate scenarios calculated for Brandenburg predict an increase in the average temperature, whereas mean annual precipitation remains unchanged. Due to an increase in evaporation and decreased discharge, this change in the regional climate will be reflected in the water balance [18]. The management of Brandenburg’s water through extraction, discharge, and storage can have an even bigger influence on the water balance than climate change.

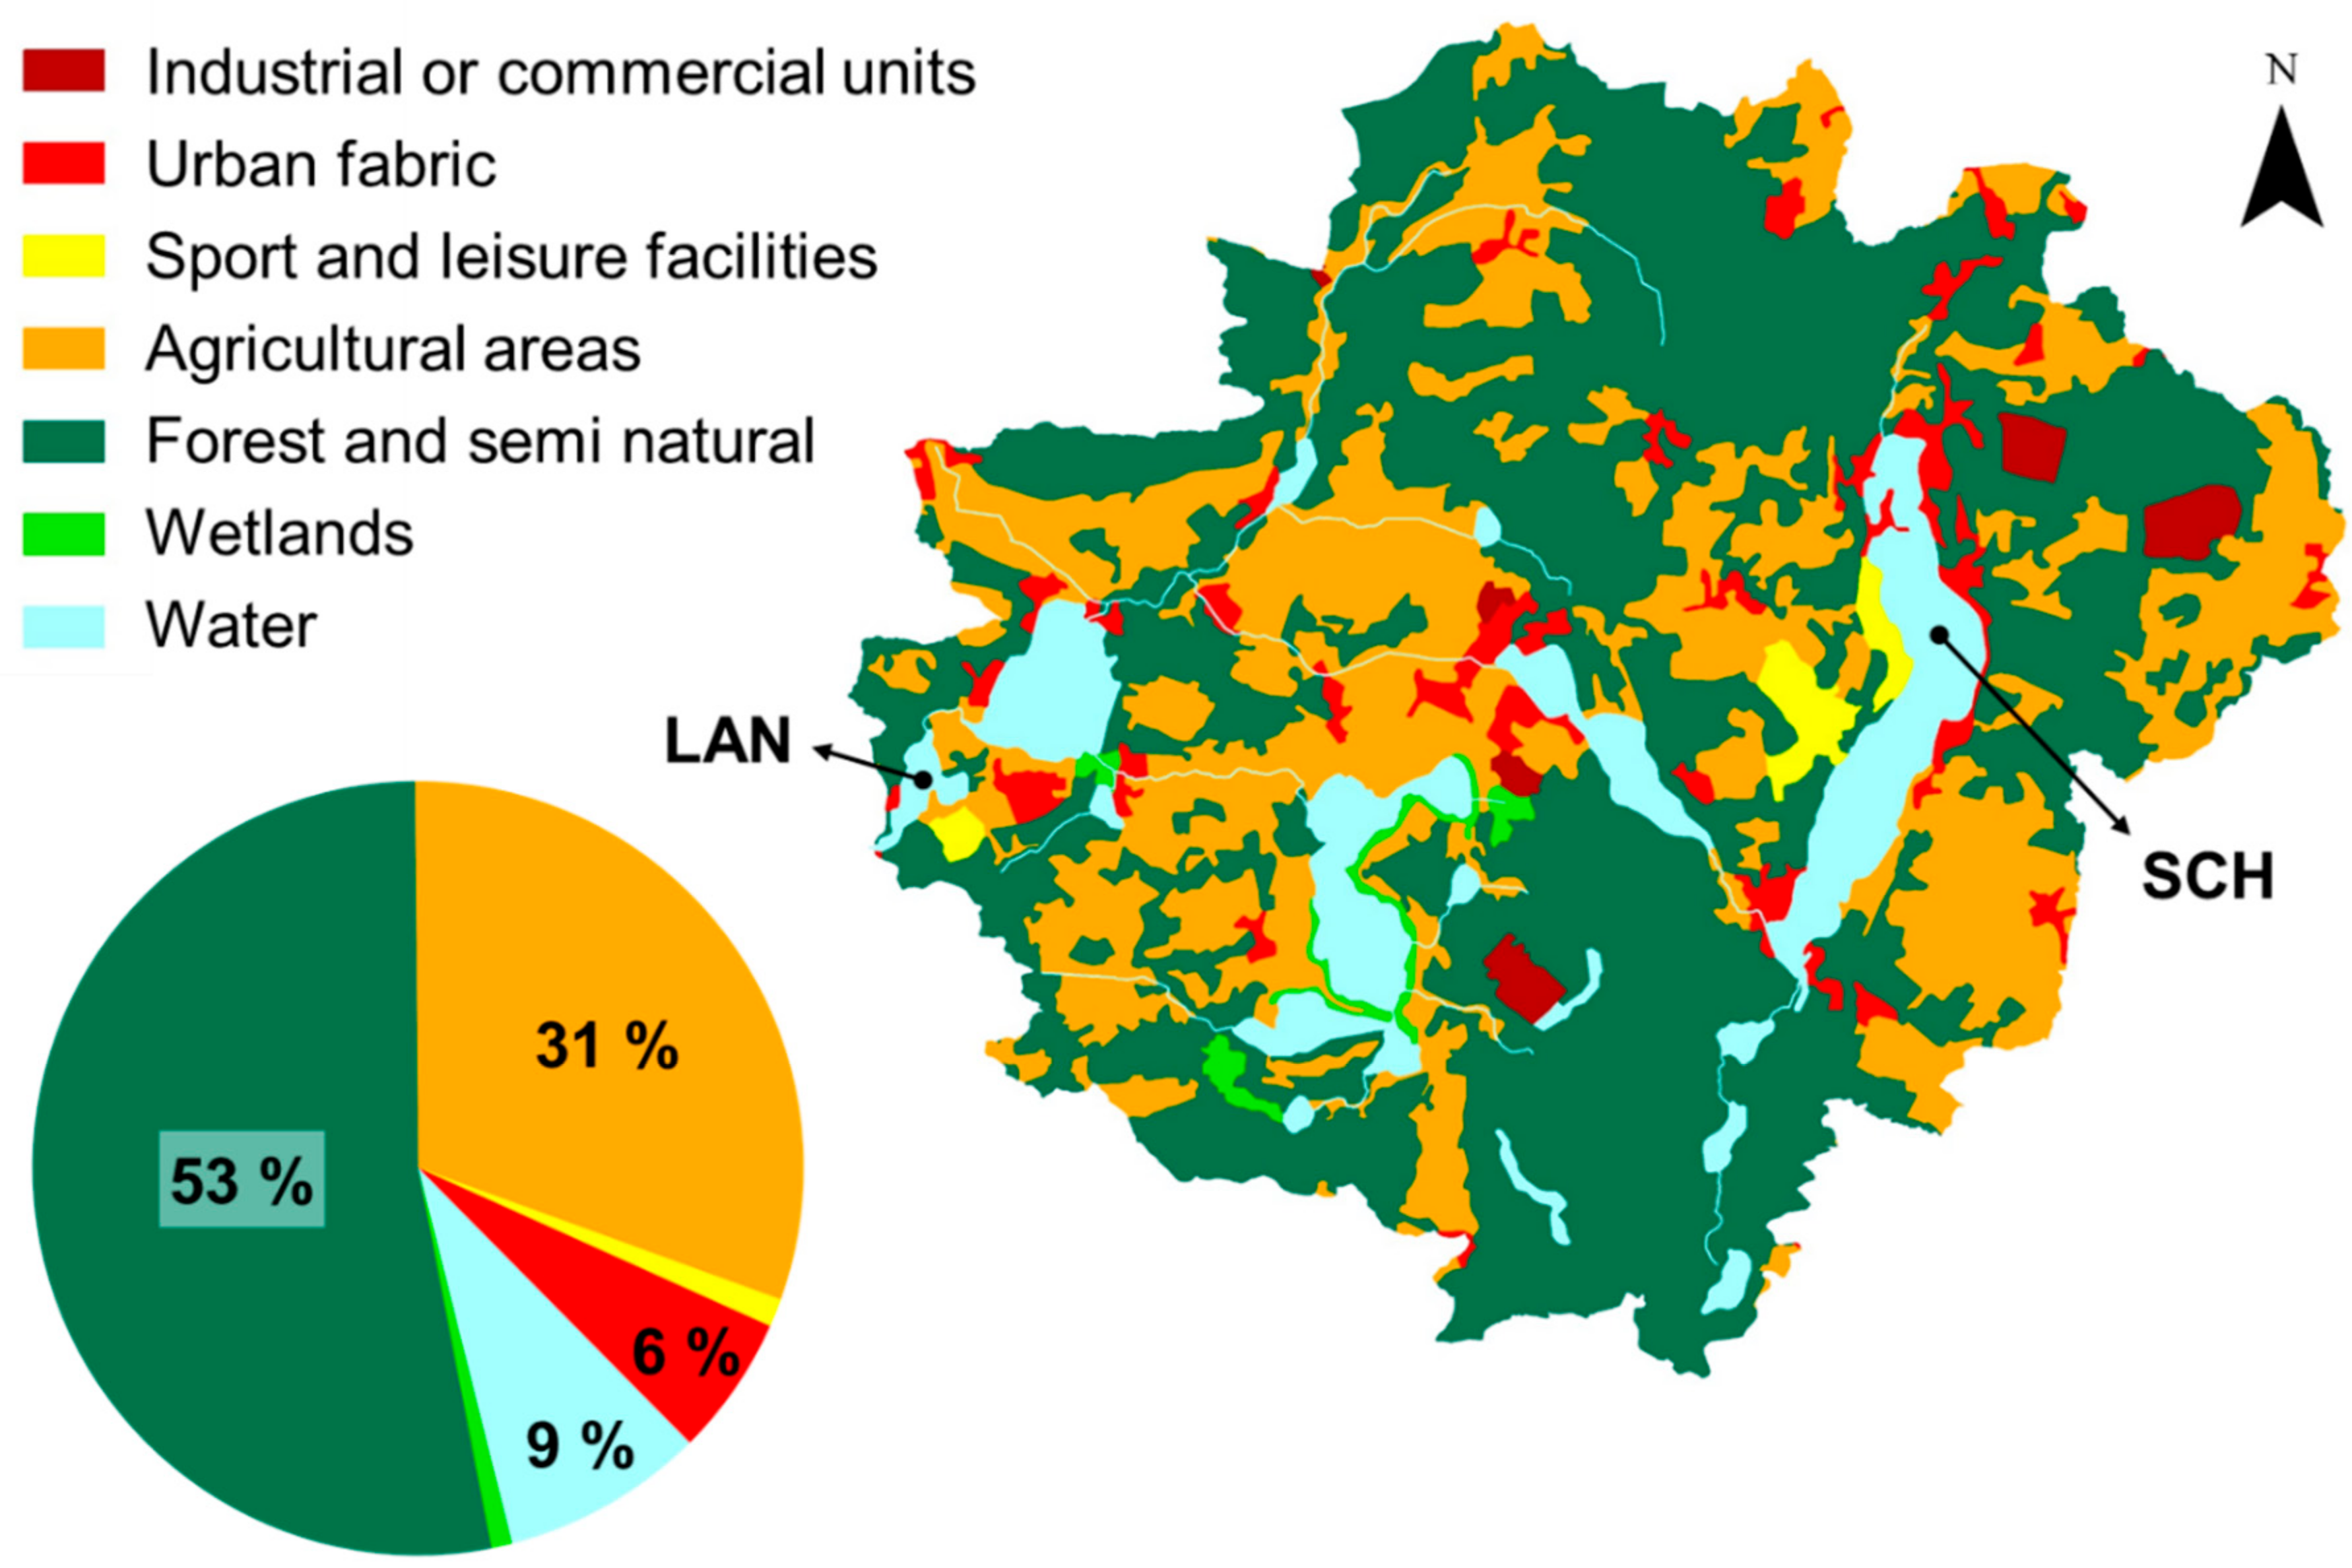
2.1.2. Catchment Characteristics of the Scharmützelsee Region

The lakes for the long-term study are situated in the Scharmützelsee region in the central part of Brandenburg, about 60 km southeast of Berlin (Figure 1, Table 1 for coordinates). They originate from the Weichsel glaciation during the last stage of the Pleistocene, about 12,000 years ago, and are located at the border of the southern plateau of the Berlin glacial valley. Carbonate-rich glacial till and nutrient-poor sands characterize the surface geology. The lakes were formed by a combination of ice and meltwater erosion. Small rivers and navigable channels connect most of the lakes in the region, which is named after the largest lake, Scharmützelsee. The water level is regulated, and four water gates enable boating to the river Dahme, a tributary entering the river Spree in Berlin. Consequently, the quality of water discharged from the Scharmützelsee region influences downstream lakes and rivers in the catchment areas of the River Spree, Havel, and Elbe flowing to the North Sea. The total size of the catchment studied is 392 km².
Land use characteristics are given in Figure 2. The mapping is based on satellite data of the years 2000 and 2006 (CORINE Land Cover data (CLC2006) [20]. Half of the catchment area is covered by forest (53%), and one third is used for agriculture (31%). The portion of surface waters is relatively high (9%), but the area-specific discharge is low (2.5 L km−2 s−1). Urban and industrial areas cover 6% of the catchment. The population density, with 58 inhabitants per km2, is relatively low. The main use of water in the catchment is related to tourism and fisheries. With small regional differences, 94%–100% of the inhabitants are connected to the sewers [21]. The wastewater of 24,319 population equivalents [22] is treated in one large and two small wastewater treatment plants (WWTP). They emit about 3536 m³ day−1 of treated wastewater. Mean concentrations in the effluent of the large WWTP are 0.3 mg TP L−1 and 3.5 mg TN L−1 (means 2011–2018, based on data of the WWTP operating companies). Drinking water is extracted mainly from groundwater.

2.1.3. Lakes in the Catchment: Deep Lake Scharmützelsee and Shallow Lake Langer See

Lake Scharmützelsee is one of the largest natural lakes in Brandenburg, based on its area (Table 1). The elongated lake is 10 km long and about 1 km wide. The depth of the lake increases from 7 m maximum depth in the polymictic northern basin over a temporarily thermally stratified middle basin with up to 11 m depth to a maximum depth of 29.5 m in the dimictic southern basin (A bathymetric map is given in [28]). The total lake is considered for the assessment of water quality according to the WFD. It belongs to lake type 13, based on the German classification system for WFD: Calcareous, stratified lakes with a small catchment (in relation to lake volume) in the German lowlands ([8], Table 2). Water inflow is predominantly (88%) from groundwater sources [28], although surface water from a chain of four smaller lakes enters the larger lake at its southernmost point (Figure 1c). The lake outflow has been regulated by a weir and an outlet lock since the 18th century. The hydraulic residence time is about ten years (Table 1).
Lake Langer See is a polymictic shallow lake with a maximum depth of 3.8 m and is much smaller than Lake Scharmützelsee (Table 1). A bathymetric map is given in [29]. However, being at the end of the lake chain, it receives the complete load from the Scharmützelsee catchment. The discharge is high in relation to the lake volume, resulting in a mean hydraulic residence time of only 34 (23–47) days (long-term annual mean 1994–2018). With values around 30 days, the lake is at the transition between lake type 11.2 (very shallow, hard water lake with large catchment) and type 12 (riverine lake), according to the German assessment system for phytoplankton ([9], Table 2). Nevertheless, due to a low discharge in the vegetation period (used for assessment), the hydraulic residence time is usually above 30 days (30.5–104.1 days, average 55.1 days, long-term annual mean 1994–2018) and this lake was classified as type 11.2.
Grüneberg and co-authors [28] give details of the nutrient loading history of Lake Scharmützelsee. There was an early limnological survey of this region in the 1930s. In the paper evolving from this study, Wundsch [30] described Lake Scharmützelsee as relatively clear with an oxygen-poor, but not oxygen-free, hypolimnion without the formation of hydrogen sulfide (H2S) [31]. Thus, a pristine mesotrophic status can be assumed. This situation had changed when Müller [32] studied the lake in 1949 and 1950, as H2S in the hypolimnion in August and September up to a depth of 12 m was found. The summer Secchi depth decreased from about 3 m in the 1930s [30] to 2.3–1.1 m at the beginning of the 1950s [32]. Thus, Lake Scharmützelsee changed from mesotrophic to eutrophic conditions [28,33,34].
There are no reports on the water quality in Lake Langer See from early times. A natural eutrophic status can be assumed due to its shallowness and the high hydraulic and nutrient load. Almost complete coverage of the lake bottom by submerged macrophyte plants is likely, but not reported. However, the trophic development of all lakes in the region, especially Lake Scharmützelsee and the downstream lakes, must be similar: Eutrophication has increased since the 1960s. Excessive sewage discharge, especially between the 1950s and the 1980s, and the introduction of phosphate-containing detergents in the 1960s resulted in a deterioration of water quality. Another source of nutrient input into lakes was fish food. Lake Storkower See, situated upstream of Lake Langer See, was used for fish farming for over a decade before 1990. This latter year marks political changes in eastern Germany and the beginning of substantial restoration measures in the catchment. The most important element of these management measures was the reduction of point discharge, for example, by the construction of a modern wastewater treatment plant and a central sewage system. The portion of inhabitants connected to the sewers increased from about 25% at the end of the 1980s to almost 100% nowadays. The Department of Freshwater Conservation has studied the response of the lakes to the nutrient load reduction due to restoration measures in the catchment since 1993.

2.2. Methods and Database

2.2.1. Monitoring Program of the Brandenburg Water Authority 2006–2014

About 200 lakes in Brandenburg of a size ≥50 ha are monitored every three to seven years to meet the demands of the WFD. The State Office of the Environment (Landesamt für Umwelt (LfU), formerly the Landesamt für Umwelt, Gesundheit und Verbraucherschutz (LUGV)) of the Ministry of Rural Development, Environment and Agriculture of the Federal State of Brandenburg provided raw data, derived water quality indices and reports of lake monitoring programs for the years 2006 to 2014, as well as management plans and programs of measures for the Elbe and Oder river basins for the period 2015–2021 [35,36].
The assessment of phytoplankton was carried out using the PSI tool [9]. Submerged macrophytes and microphytobenthos were assessed separately or in combination with the PHYLIB tool [12]. The macrophyte assessment was supplemented by the MIB tool (Makrophytenindex Brandenburg [37]), a method developed and adapted to Brandenburg lakes and suitable for lakes smaller than 50 ha. The Ecological Quality Class (EQC) is a combination of the different indices, whereas its value is determined by the worst single index. Vegetation means of total phosphorus (TP) and total nitrogen (TN) concentrations were calculated from monthly means for the vegetation period from April to October. Depending on the measuring cycle, the data for individual lakes were raised between 2006 and 2014.
A total of 183 natural lakes were selected for this study. They include lake types 10 to 14 (hard water lakes in the ecoregion North German lowlands, following [8]. These are the following subtypes based on the phytoplankton assessment method: Deep stratified lakes with stable summer stratification with small (type 13), large (type 10.1) or very large (type 10.2) catchments compared to lake volume. Shallow, polymictic lakes are classified based on their mean depth (zm) as subtype 11.1 (zm ≥ 3 m) or very shallow lakes (subtype 11.2 zm < 3 m). Riverine lakes (type 12) are lakes with short hydraulic residence time (<30 d) and relatively large catchments. Type 14 includes shallow lakes (zm ≥ 3 m) with a small catchment (Table 2). All stratified lakes represent lake type L-CB1 of the Central/Baltic Geographic Intercalibration Group. Among polymictic lakes, only type 11.2 overlaps with the Central/Baltic GIG type L-CB2 (Table 2). Lakes types 11.1 and 12 were not included in the European lake types due to hydraulic retention time <1 year, and type 14 due to hydraulic retention time >1 year [38].

2.2.2. Estimation of Nutrient Input from the Catchment in the Scharmützelsee Region

The quantification of nutrient inputs into surface waters and the localization of hotspots of nutrient emissions is the basis for the development of management plans for surface waters in Brandenburg. Consequently, the State Office of the Environment has adapted the export coefficient approach (e.g., [39,40]) to requirements in catchments in the Federal State of Brandenburg [41]. Based on extensive geographical data (e.g., soil types, land use, crop, drainage, and groundwater) and data from the literature (e.g., retention coefficients, emission rates), the annual inputs of phosphorus and nitrogen into surface waters are estimated. These calculations contain runoff as surface runoff or measured discharges, emission rates from point sources (WWTP and urban areas) and emissions from diffuse sources from agricultural or urban areas via groundwater and surface runoff, atmospheric deposition, and a natural groundwater background. In the first step, the nutrient emissions from the sub-catchments are estimated based on land use information. Net nutrient emissions are calculated considering nutrient retention processes in the soil and in the groundwater. In the second step, loads from sub-catchments are summarized along the sections of running waters following the natural flow direction of the water taking the nutrient retention in surface waters into account. The calculations presented are based on land use information and WWTP discharges for the year 2011.

2.2.3. Long-Term Study of Water Quality in Lake Scharmützelsee and Lake Langer See 1993–2018

Lake Scharmützelsee and Lake Langer See have been sampled monthly to biweekly at their deepest point since July 1993 (Figure 1c). Water transparency was measured with a white Secchi disk of 20 cm diameter. Water samples were taken at half-meter intervals with a 2.3 L LIMNOS® sampler and mixed in a vat. Mixed water samples were prepared over the whole water column for polymictic Lake Langer See. For Lake Scharmützelsee, mixed samples were prepared volume-weighted either for the whole water column during periods of complete mixing (usually November to April) or separately for the upper mixed part (epilimnion) during thermal stratification periods (usually May to October). Aliquots of the mixed samples were analyzed to determine the concentrations of TP, TN, and chlorophyll a according to German standard methods [42]. Phytoplankton composition and biovolume were estimated using an aliquot fixed with Lugol’s solution studied under an inverse microscope, according to [43,44]. Biovolume was converted to biomass assuming a specific density of 1 mg mm−3.
The German Trophic Index, according to LAWA, was calculated by using the Microsoft Access tool [45]. This index summarizes trophic parameters (vegetation means of chlorophyll a, Secchi depth and TP, and TP during spring overturn) to seven classes ranging from oligotrophic to hypertrophic. The assessment of water quality was carried out with the PSI tool for phytoplankton [10] and with the PHYLIB tool for submerged macrophytes [12]. Macrophyte mapping was carried out once in 2011 by Lanaplan, Nettetal [46], based on the PHYLIB method.
Different empirical models were applied to analyze lake-catchment interactions, which describe the relationship between in-lake nutrient concentration, nutrient input, and hydraulic conditions. The mean annual inflow concentrations of TP and TN were calculated from the in-lake nutrient concentrations and the mean hydraulic residence time. For Lake Scharmützelsee, the models of Vollenweider (1976) [47], OECD (1982, combined data set) [48], Nürnberg (1984) [49] and Sas (1989) [50], the latter with the empirical net sedimentation coefficient according to Brett and Benjamin (2008) [51] were applied. Details on the models are given in [28]. The TP load for Lake Langer See was estimated with the models of Vollenweider [47] as well as the combined data model and the shallow lakes model of OECD [48]. The TN load calculations were carried out with the OECD [48] model for the combined dataset. Mean hydraulic residence time was calculated from daily discharge data measured at the outlet lock of Lake Scharmützelsee, kindly supplied by the Water and Shipping Authority, Berlin. The resulting area-specific discharge of this sampling station and a second station in the catchment measured by LfU were used to estimate the discharge for Lake Langer See. Critical loads of TP and TN were calculated, as described above, using the lake type-specific target values as input data, i.e., TP and TN concentrations at which lakes achieved the “good ecological status” according to the PSI derived by Dolman et al. (2016) [52]. The TP-target value for type 13 was multiplied by 1.5 to consider the mean difference between annual values (used by the empirical models) and vegetation mean (used by [52]) for Lake Scharmützelsee. The relation between annual and vegetation mean for TN in Lake Scharmützelsee, and TP and TN in Lake Langer See, was about 1.

3. Results

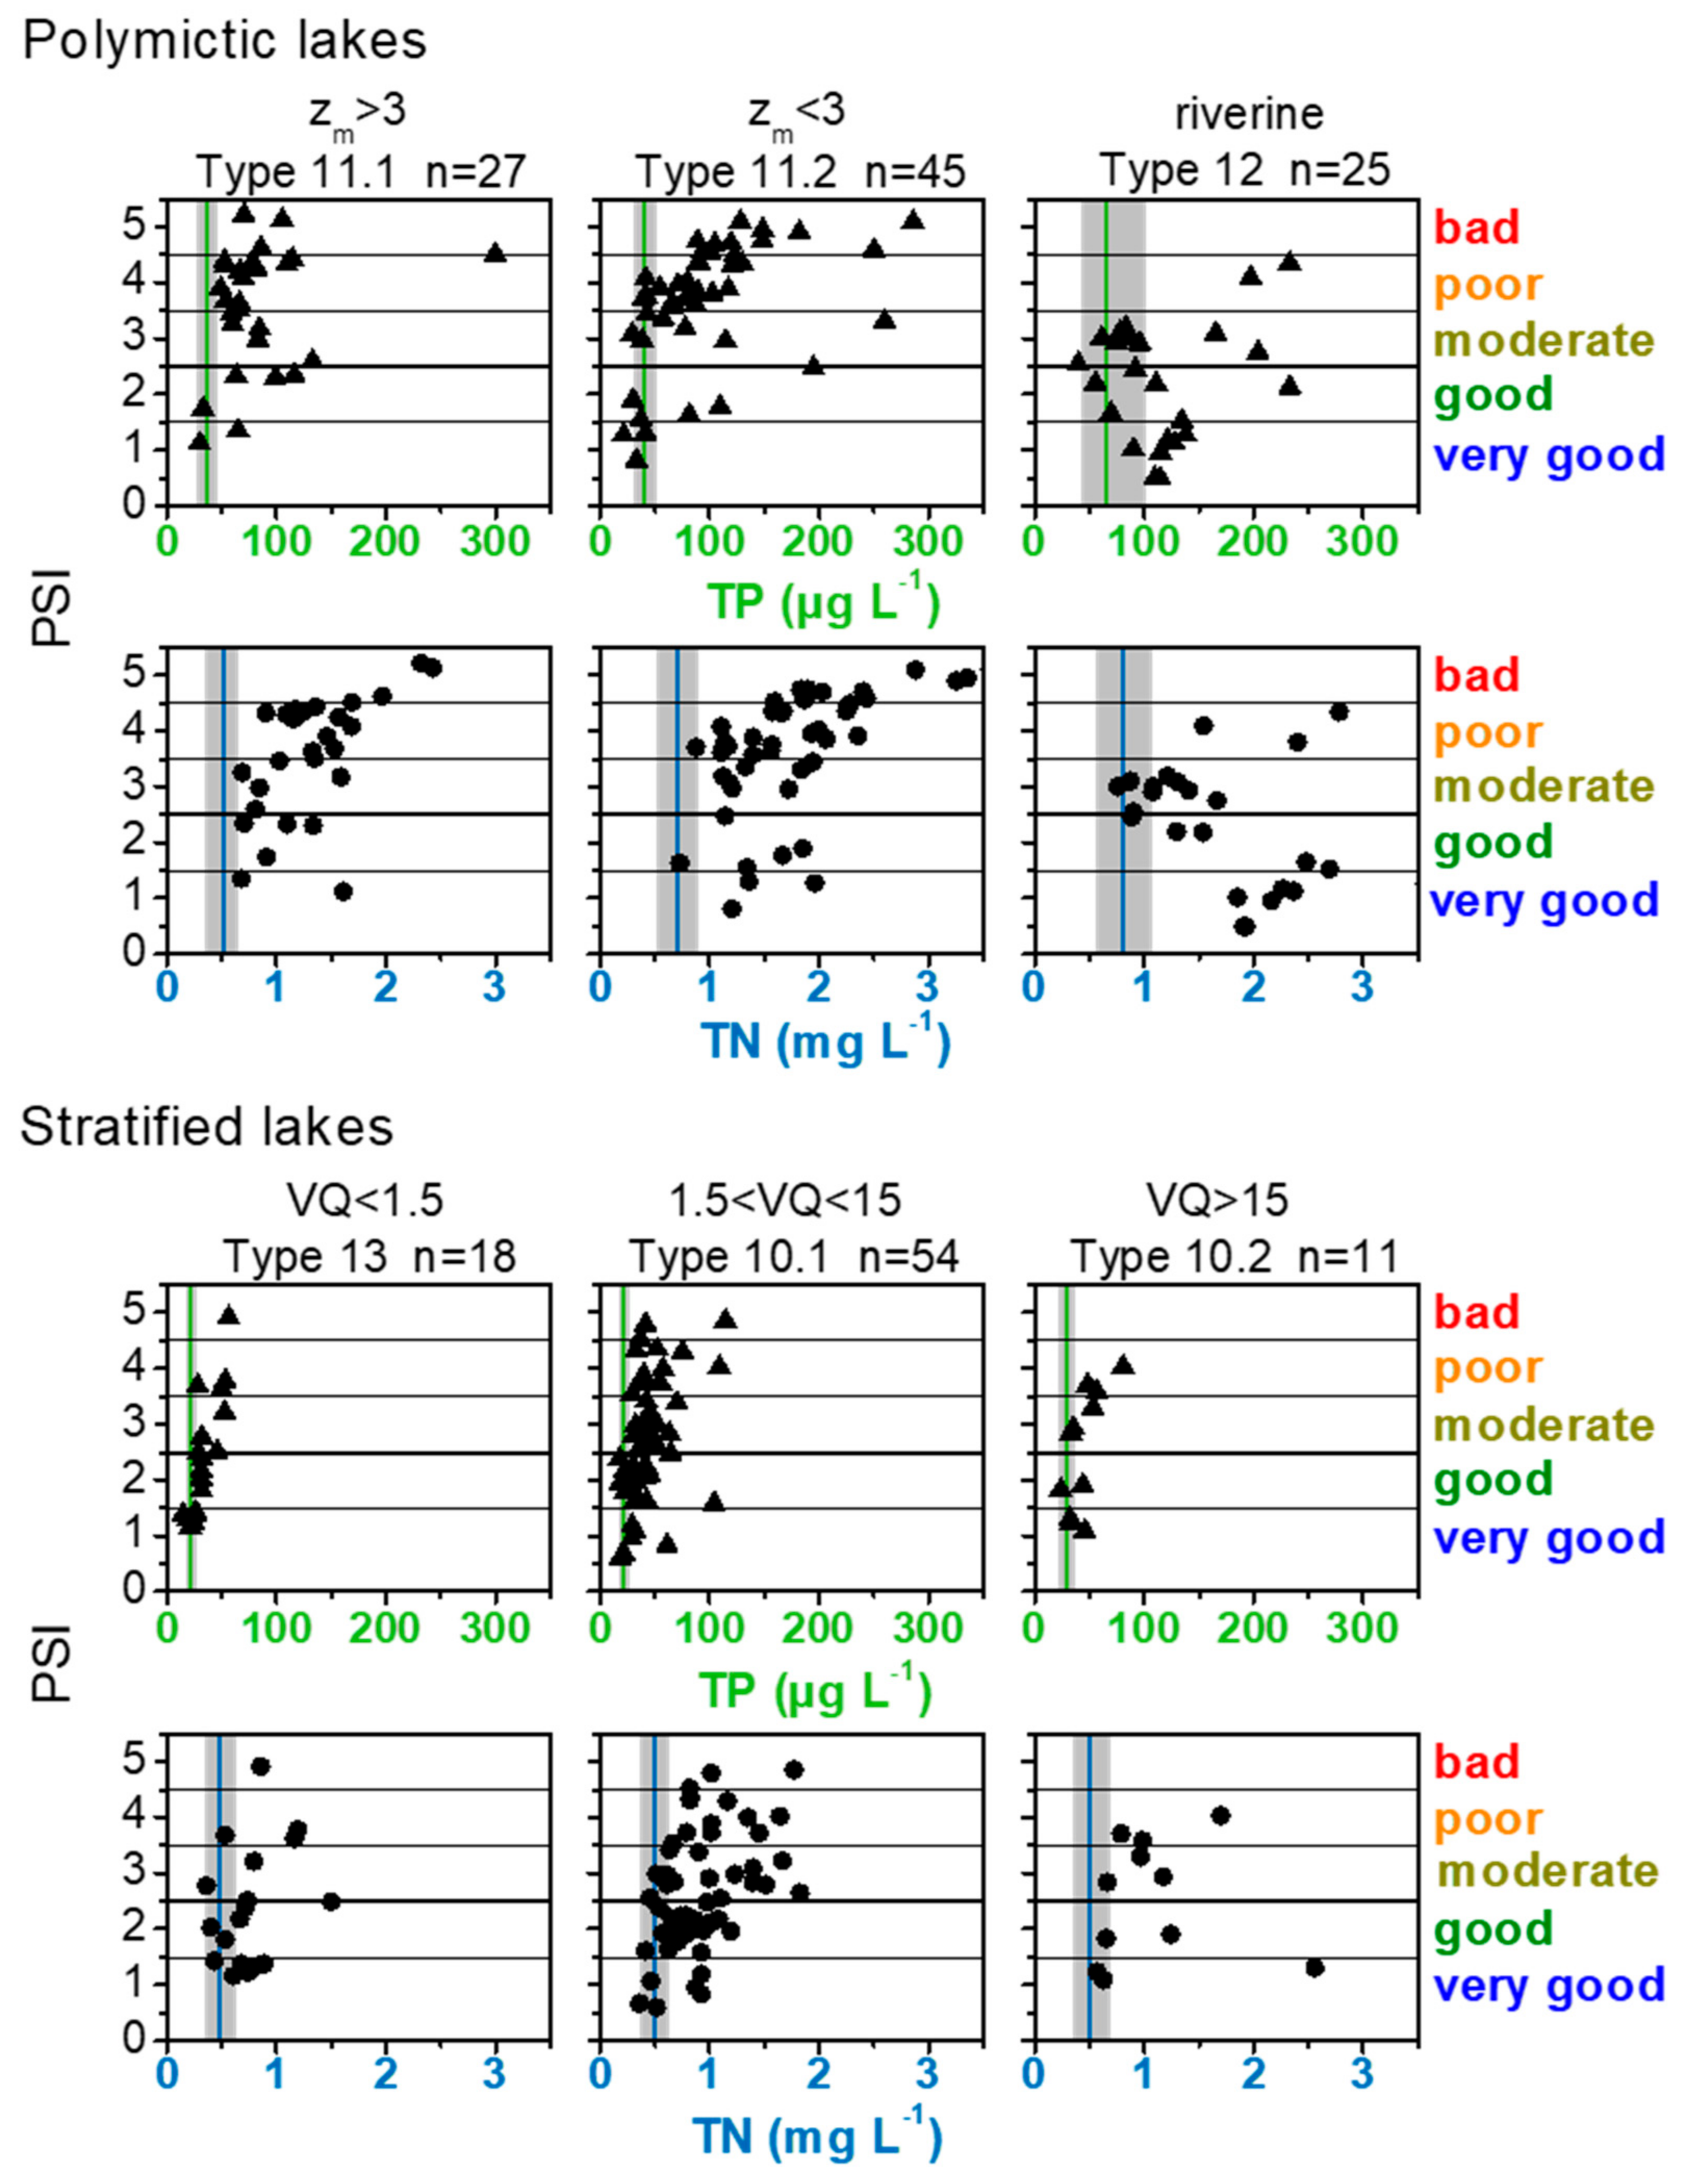
3.1. Ecological Status of Lakes in Brandenburg, According to WFD in 2014

The ecological status of 183 Brandenburg lakes, according to WFD, as reported to the European Commission in 2014, is analyzed here. The lakes studied represent lake types typical for the North German lowlands, respectively, central Europe (Central/Baltic GIG), with 83 (45%) stratified and 100 (55%) polymictic lakes (Figure 3). Stratified lakes are most frequent with a volume quotient between 1.5 and 15 m2 lake area per m3 lake volume (type 10.2, 54 lakes) and very shallow polymictic lakes (type 11.2, 45 lakes). Type 14 (polymictic lakes with a small catchment) comprised only three lakes and will not be discussed further.
According to the assessment of phytoplankton (PSI, Figure 3), 44%–50% of stratified lakes have reached the “good” or “very good” ecological state. This portion was much smaller for the polymictic lakes (type 11 and 12), with only 15%–24% in “good” ecological state based on the PSI. The high proportion of 63%–67% of lakes in a “poor” and “bad” state for lake types 11.1 and 11.2 was striking. The proportion of “poor” and “bad” lakes was the smallest in riverine lakes (12% in type 12). The ecological quality (EQC, Figure 3) as a more comprehensive evaluation, including other biological quality elements, is even worse than the PSI (only phytoplankton). In total, only a minority of 12% of all lakes achieved the EQC of “good” and “very good”. This portion was higher among stratified lakes (17%–36%). However, polymictic shallow lakes (types 11.1, 11.2 and 12) are especially at risk: Only 4% of 97 lakes have reached the “good ecological status” (EQC).
TP and TN concentrations of the lakes were analyzed for the year of assessment to investigate the causes for the failure to reach the water quality goals. This was compared to lake type-specific target values for TP and TN to achieve the “good ecological status,” according to PSI (vertical lines in Figure 4) derived by Dolman et al. (2016) [52]. The higher the TP concentrations, the more likely is an ecological status worse than “good”. Whereas the TP concentrations in lakes of “good” and “very good” ecological status are mostly relatively close to the lake type-specific target values, the TN concentrations tend to be more above the TN target values, especially in lakes of type 12, and also in the other polymictic lakes (type 11.1 and 11.2). Only some stratified lakes (and very few polymictic lakes) reach the TN target values. Generally, the TN concentrations are often far above the TN target values for all lake types, independent of the present ecological state.

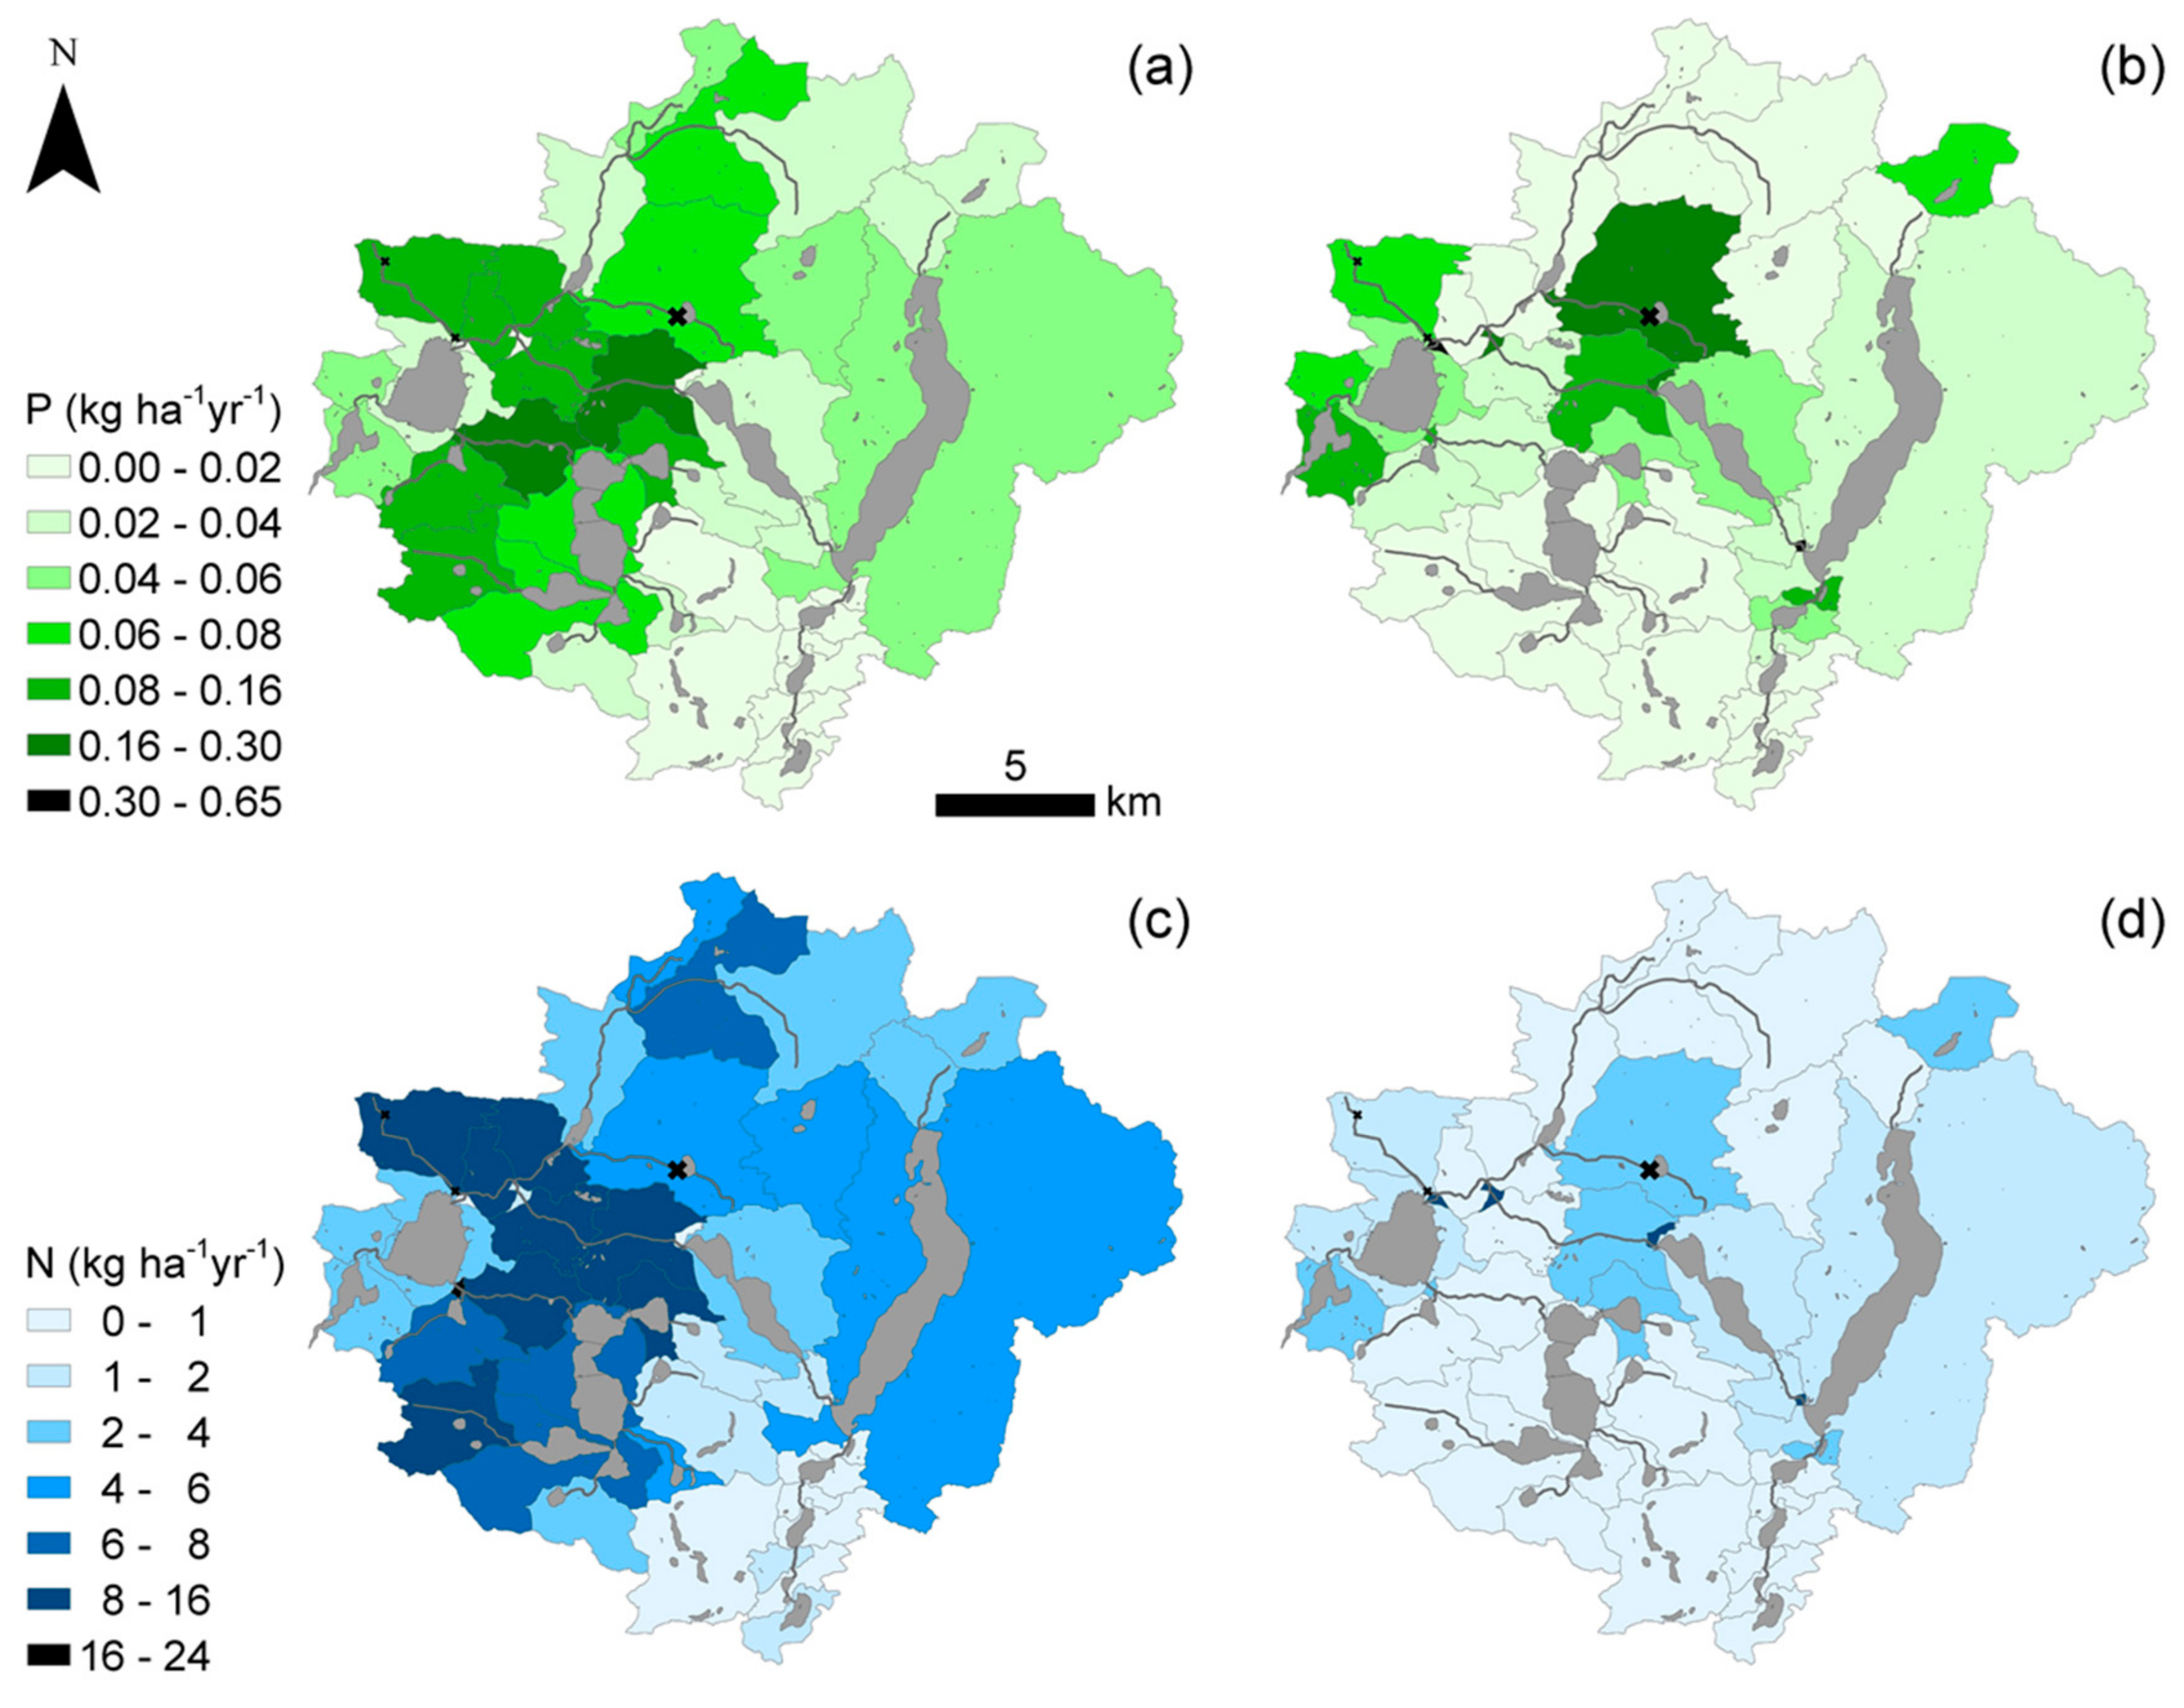
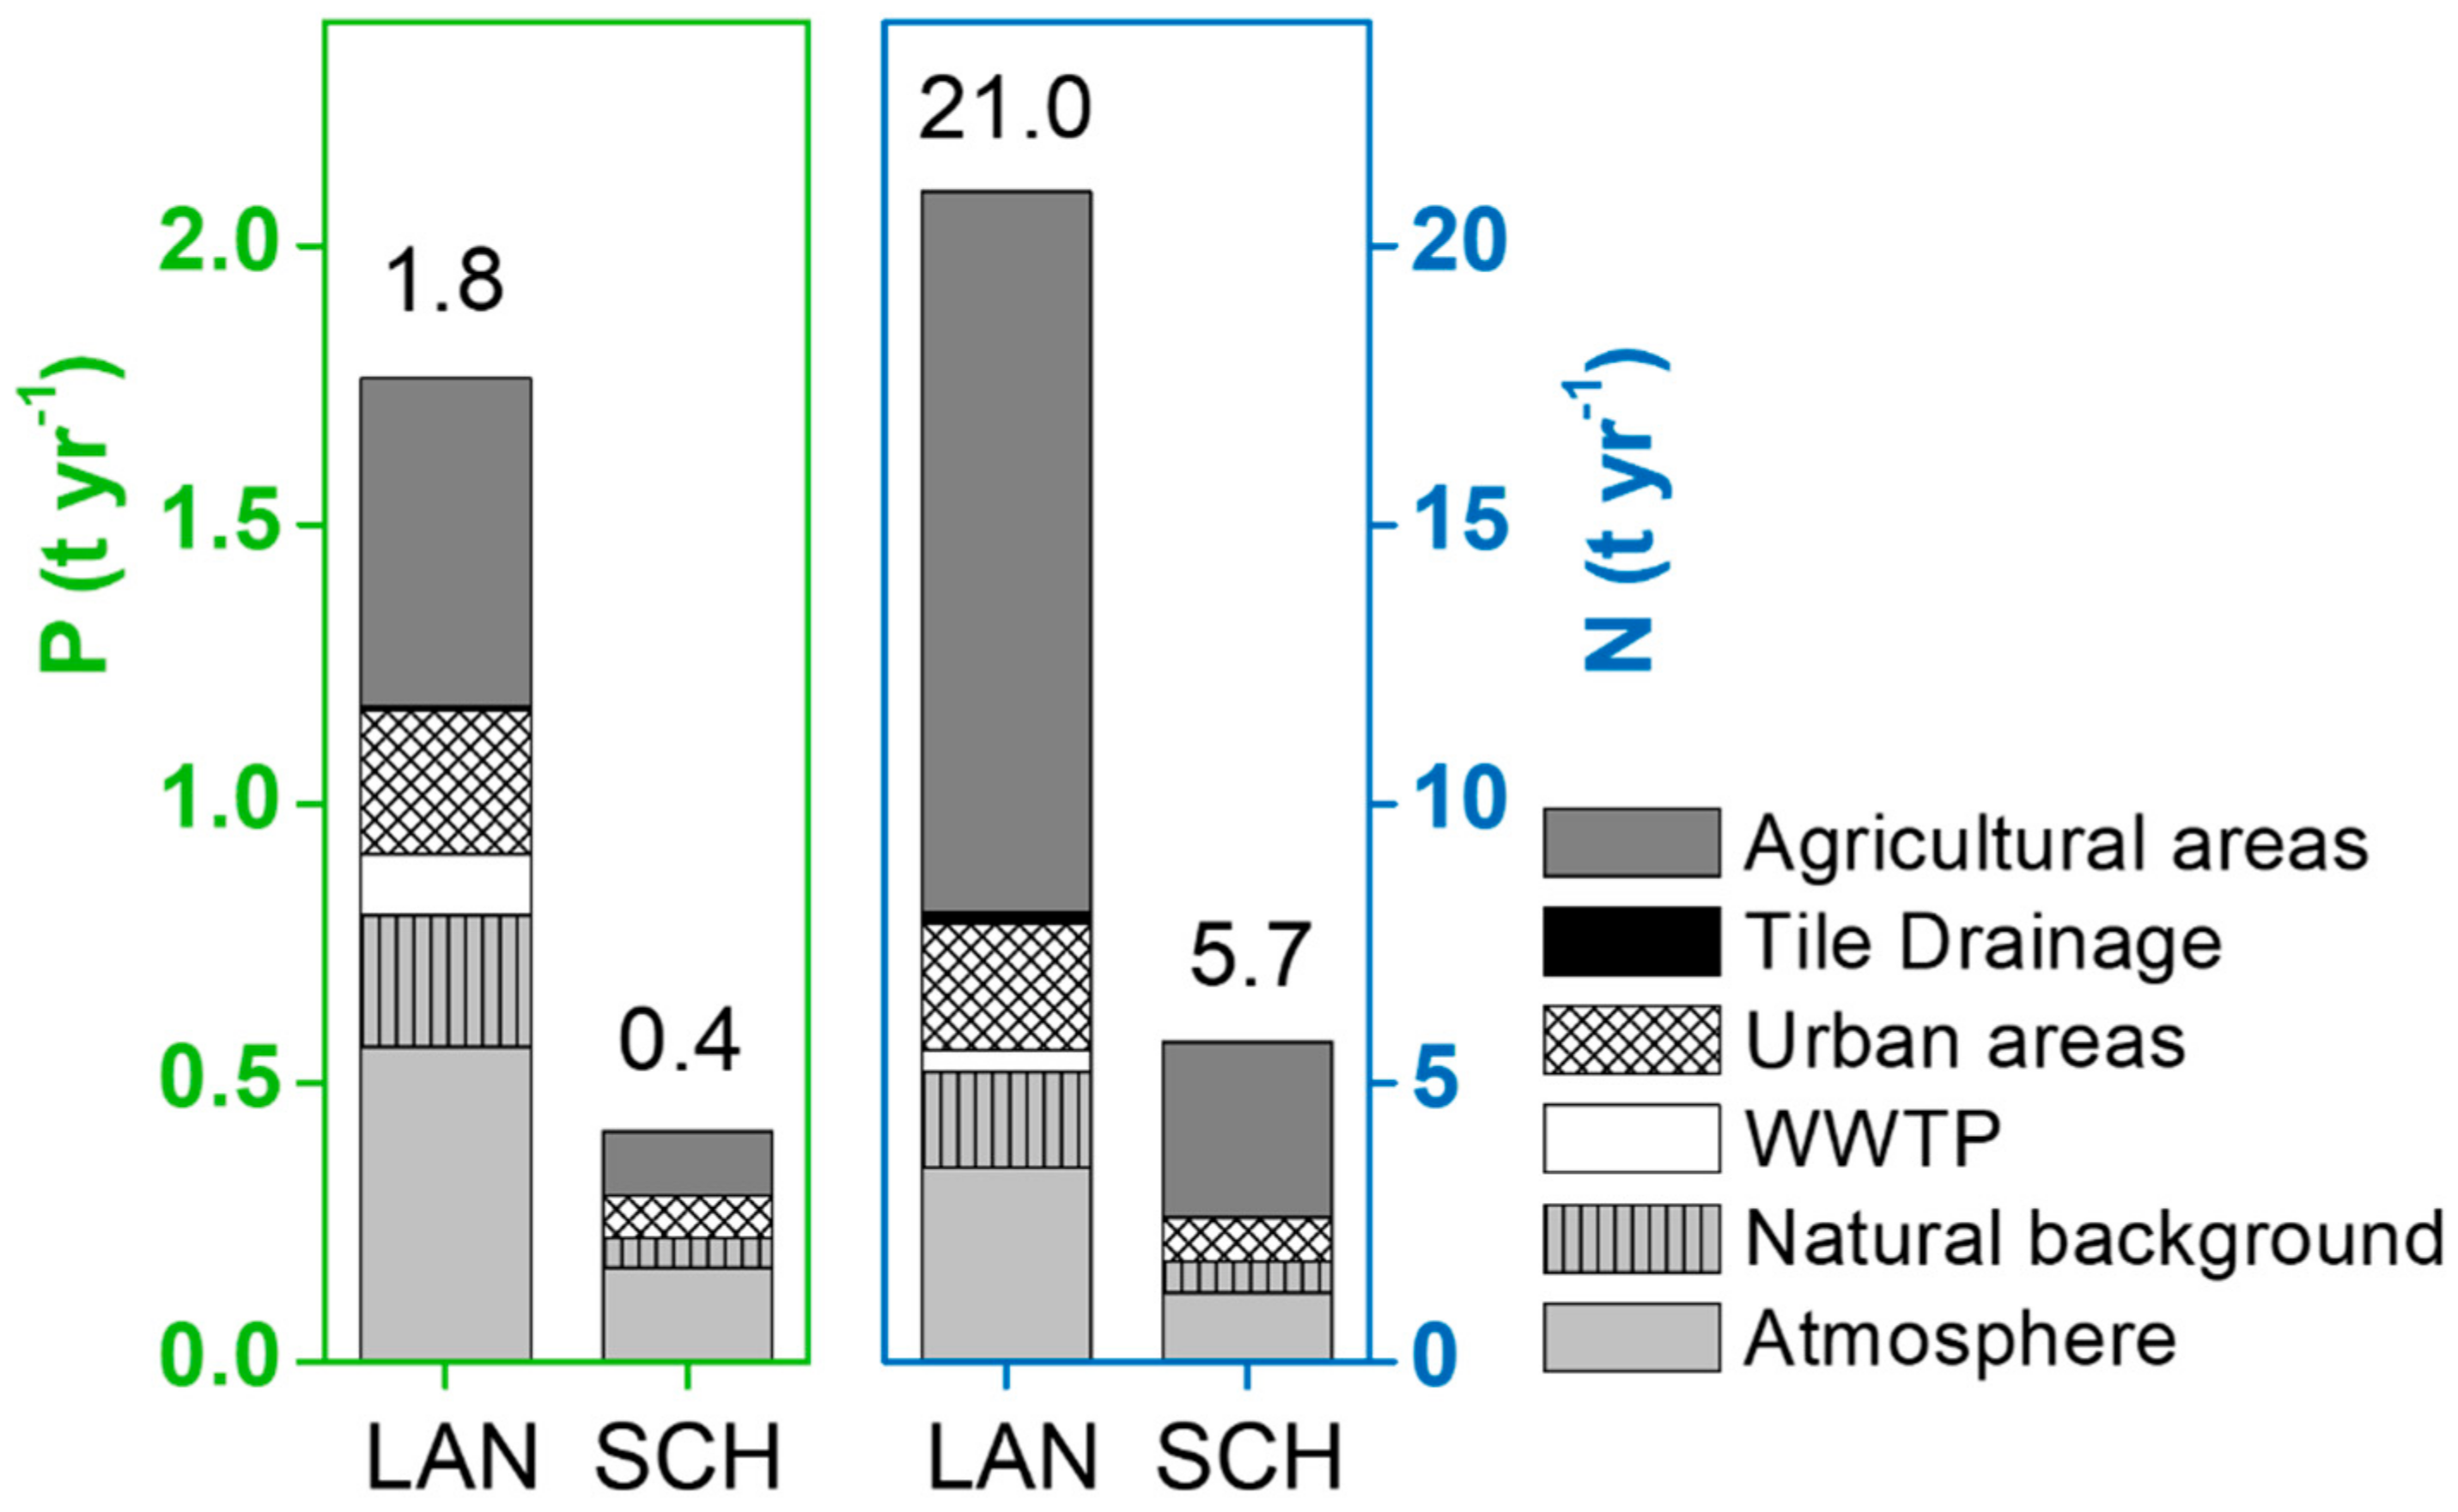
3.2. Nutrient Inputs from the Catchment—Case Study Scharmützelsee Region

Net P and N emissions for sub-catchments in the Scharmützelsee region were analyzed based on the land use information for the catchment without considering nutrient retention in the surface water bodies (Figure 5). It turns out that N emissions from sources related to agricultural usage (surface runoff or subsurface transport, Figure 5c) are much higher than from sources related to urban areas (Figure 5d). The N emissions were especially high (>10 kg ha−1 yr−1) in the western part of the Scharmützelsee region, where intensively used arable land is concentrated (Figure 2). In contrast to this, the P emissions from urban areas (Figure 5b) partly exceed the emissions from agricultural areas (Figure 5a). The main urban point source of P is the biggest wastewater treatment plant treating the wastewater of 22,202 population equivalents [22]. The sub-catchment where the WWTP is situated stands out with an annual P emission of 0.18 kg ha−1 yr−1.
Only a part of the nutrients emitted enters the lakes downstream due to the different retention rates for N and P in the surface water bodies considered in the method of LUGV [41]. The resulting nutrient loads are presented in Figure 6. The portion for N input from agricultural sources is relatively high at 55% for Lake Scharmützelsee and 62% for Lake Langer See. By contrast, about half of the P emissions originate from atmospheric deposition and natural background (groundwater), and the portion of urban sources (about 20%) is somewhat higher than for agricultural P sources (about 15%). The total nutrient input calculated from land use is much lower for upstream Lake Scharmützelsee (0.41 t P yr−1, 5.73 t N yr−1) than for Lake Langer See at the end of the catchment (1.76 t P yr−1, 20.96 t N yr−1). Applying these estimates, the empirical models predict in-lake TP concentrations of about 9 µg L−1 and 35 µg L−1 for Lake Scharmützelsee and Lake Langer See, respectively (mean values of four or three models).

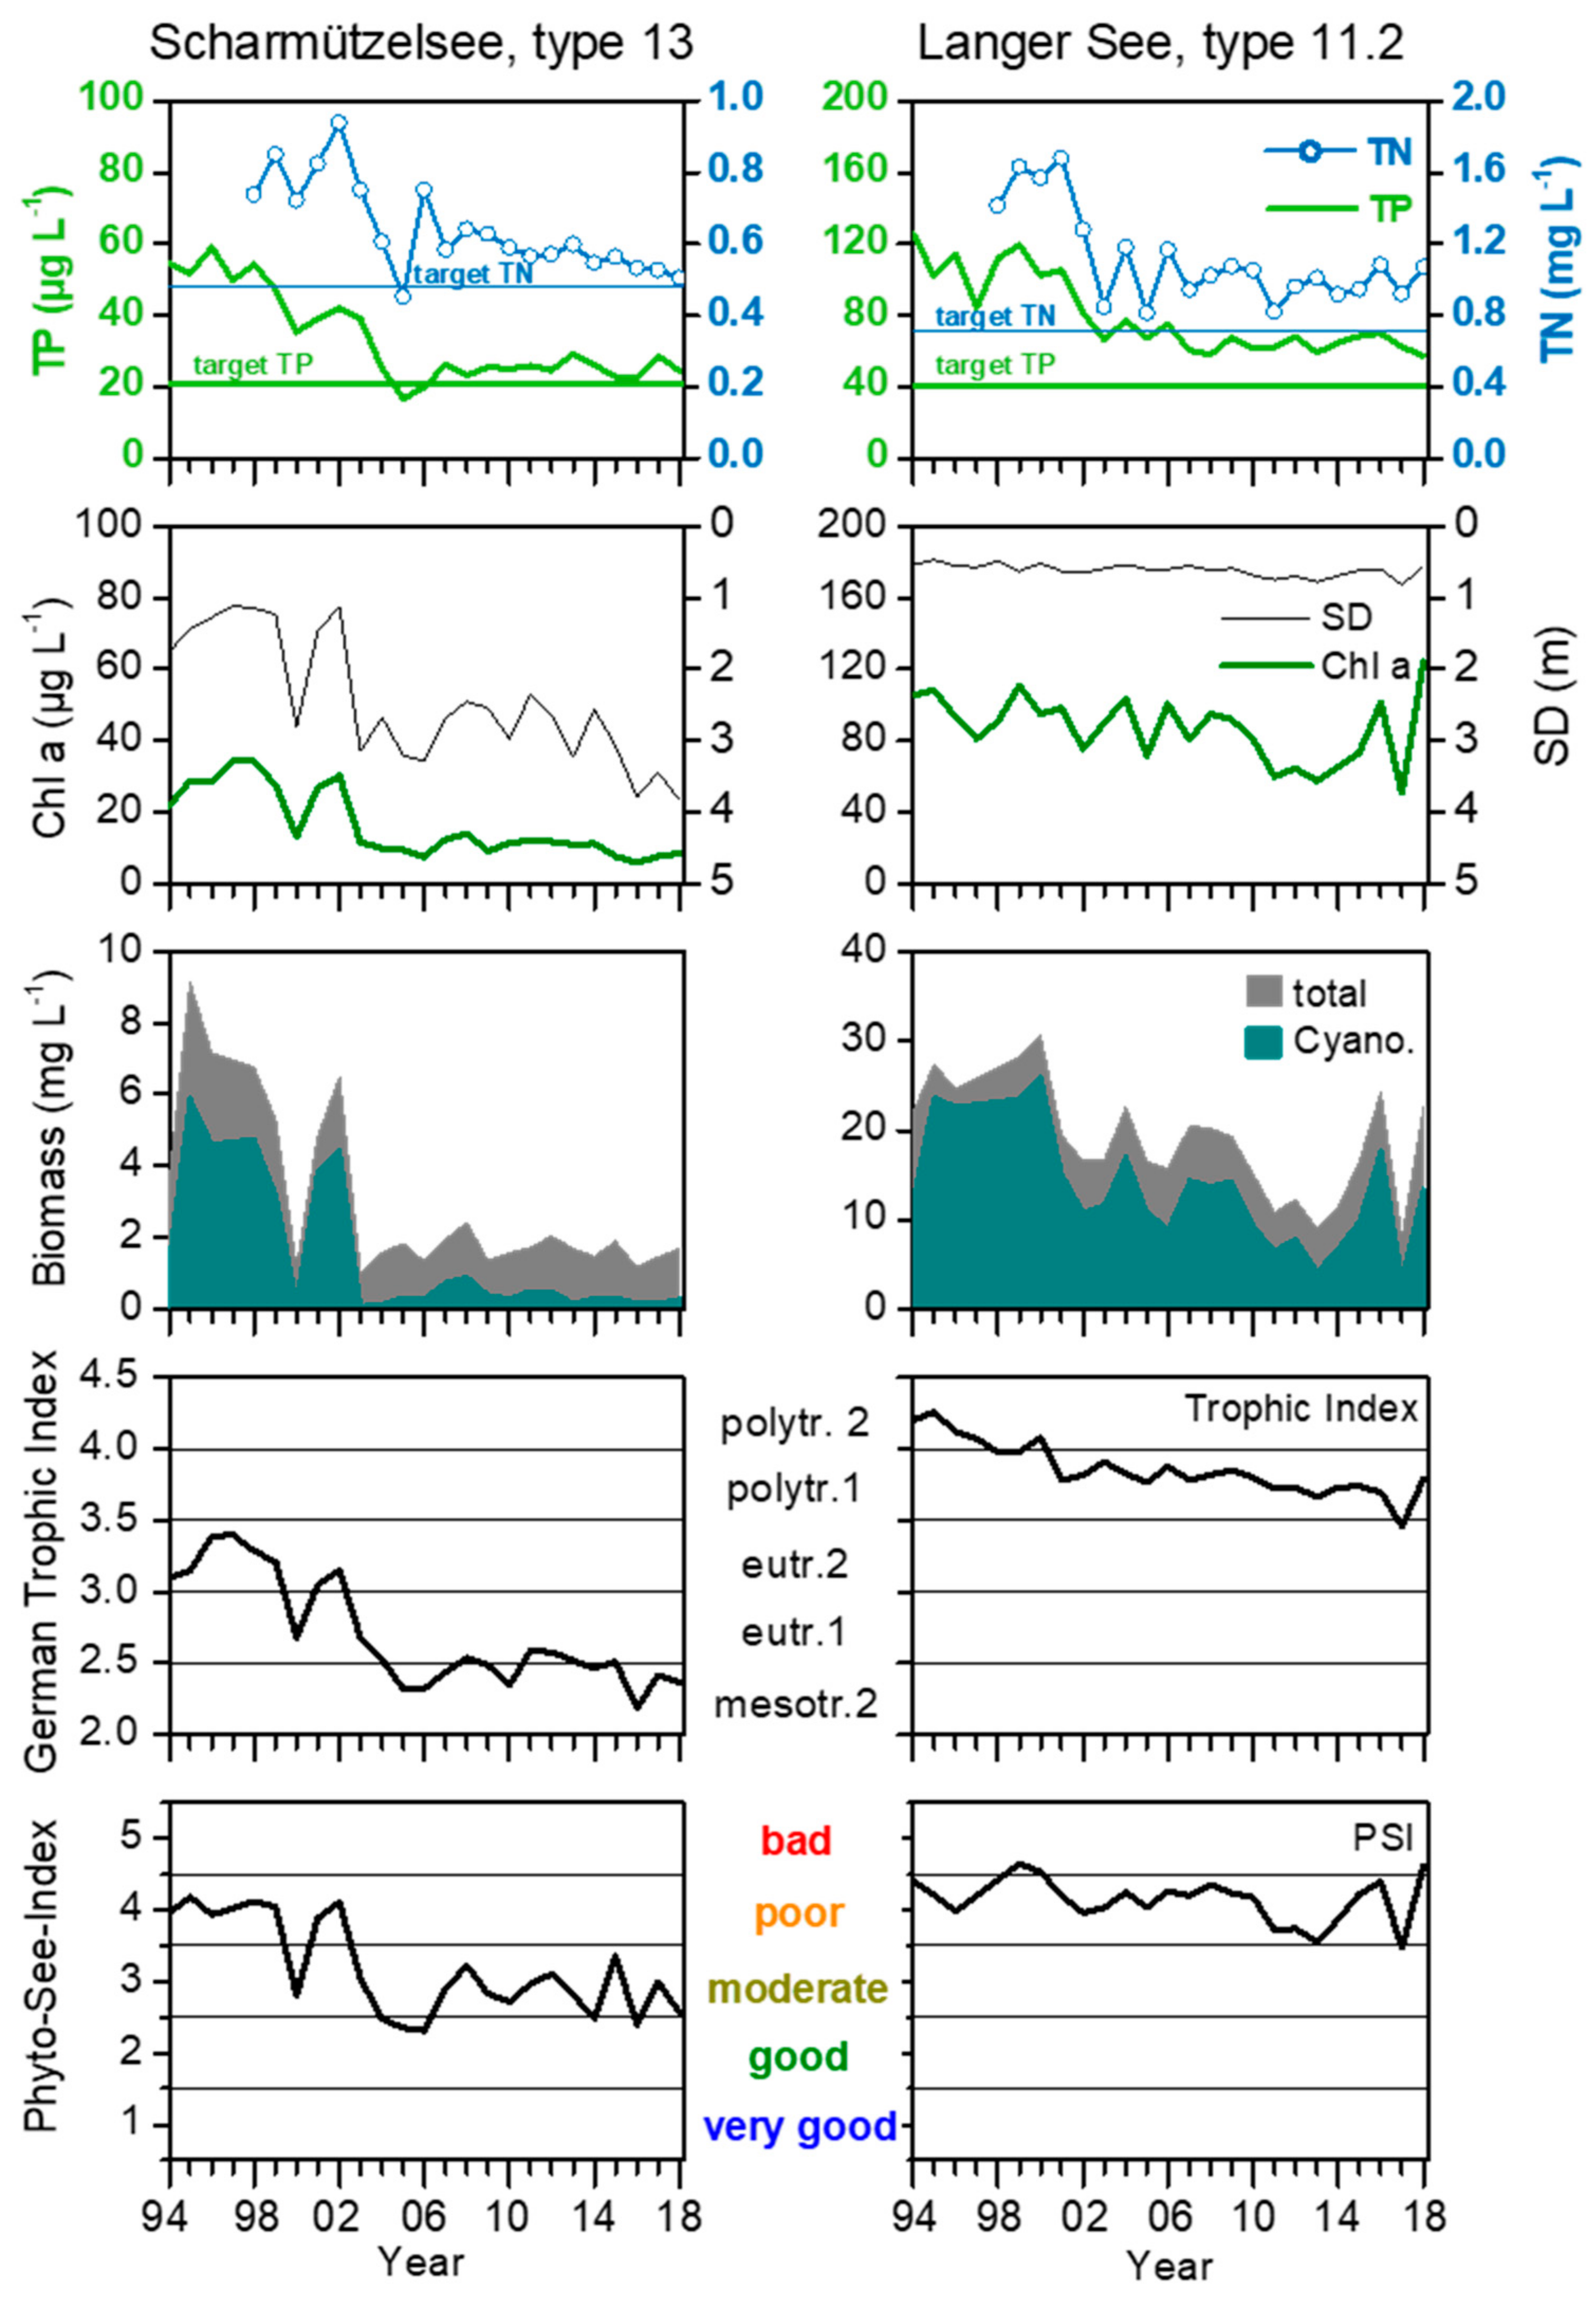
3.3. Long-Term Development of Lake Water Quality after Reduction of Nutrient Input from the Catchment—Case Studies Lake Scharmützelsee and Lake Langer See

The analysis of long-term data revealed decreasing TP and TN concentrations in both lakes (Figure 7). This corresponds to the declining nutrient loads derived from the empirical models (Table 3). Two periods of lake development could be clearly distinguished: 1994–2003 with higher in-lake nutrient concentrations and 2004–2018 with lower concentrations. Nutrient input from the catchment must have changed because the hydrologic conditions were similar during these periods. Grüneberg et al. [28] described these phenomena as the “transient phase” and the “recovery phase” for Lake Scharmützelsee, but they also apply to Lake Langer See.
However, the response to nutrient load reduction from the catchment was different for each lake. Whereas nutrient concentrations in Lake Scharmützelsee decreased continuously, phytoplankton biomass remained relatively high until 2002 (Figure 7). A drastic shift in phytoplankton biomass was observed in 2003, and the trophic status changed from highly eutrophic to mesotrophic. Since then, in-lake nutrient concentrations have remained at an almost constant level of TP: 24 µg L−1 and TN: 577 µg L−1 (mean 2004–2018, Table 4). That is close to the lake type-specific target values for the “good ecological status” (PSI) [52] of TP: 21 (18–25) µg L−1 and TN: 480 (350–620) µg L−1, respectively. The ecological status based on PSI improved from “poor” to “moderate”. The lake even reached “good” ecological quality in 2005 and 2006, and touched it in 2014 and 2016 but remains more or less in the “moderate” status. During this short period of two years, the portion of cyanobacteria of the total phytoplankton biomass decreased to 17% or 24%, respectively, compared to 35% to 70% in the highly eutrophic phase before 2003. The shift in phytoplankton composition during the summer was the most noticeable feature of the response to nutrient reduction in Lake Scharmützelsee. Mean seasonal courses of main phytoplankton groups illustrate the change in seasonal patterns for both trophic periods (Figure 8). The dominance of cyanobacteria over the whole summer in eutrophic years was replaced by a clear water phase usually lasting from May to July. The seasonal pattern and biomass of spring phytoplankton bloom remained almost unchanged.
Whereas summer phytoplankton before 2003 was characterized by cyanobacteria with fine filaments (Oscillatoriales: Pseudanabana spp., Planktolyngbya spp., Limnothrix spp., Nostocales: Aphanizomenon gracile, Cylindrospermopsis raciborskii) [33], a shift to a more diverse phytoplankton consisting of dinoflagellates, green algae, diatoms and cyanobacteria (now essentially Chroococcales and Nostocales) was observed in the mesotrophic years. However, cyanobacteria still occurred in a substantial portion of total phytoplankton biomass in the late summers of recent years, and local people claimed to observe a temporal and local occurrence of surface scums formed by N-fixing species of the order Nostocales (mainly Dolichospermum flos-aquae (formerly Anabaena flos-aquae) and Aphanizomenon flos-aquae). These species are responsible for the lake not achieving the “good ecological status” based on PSI despite the obvious improvements (Table 4).
Another consequence of lower phytoplankton biomass in Lake Scharmützelsee is the improvement of underwater light conditions for submerged macrophyte vegetation. Hilt et al. (2010) [34] described the recolonization of the lake by submerged macrophytes after eutrophic years with very low submerged vegetation. The charophyte Nitellopsis obtusa reappeared in 2004 and presently forms wide submerged meadows mainly at a depth of 2–4 m [46]. The number of submerged plant species increased from 6 in 1994 to 26 in 2011. In the same time, the lake bottom area covered by submerged macrophytes increased from 7% to 24%. However, the assessment of submerged macrophytes by the PHYLIB tool [12] also revealed only a “moderate ecological status” (Table 4). The failure here is caused by the absence of indicator species for the “good ecological status”. Moreover, species such as Nitellopsis obtusa give only a “good” assessment when they settle in depths below 4 m.
In the shallow Lake Langer See, nutrient concentrations also decreased in a similar way to Lake Scharmützelsee from 1994 onwards and remain on an almost constant level at TP: 65 µg L−1 and TN: 1 mg L−1 since 2004. In contrast to Lake Scharmützelsee, these concentrations are well above the lake type-specific target values [52] of TP: 41 (32–51) µg L−1 and TN: 710 (520–880) µg L−1, respectively (Figure 7). Trophic status improved by one class from polytrophic 2 to polytrophic 1, according to the German Trophic index classification system [45]. This refers to the hypertrophic status according to the OECD (1982) [48]. The biomass of phytoplankton and cyanobacteria showed a decreasing trend until 2013 (Figure 7). This change is also illustrated by a comparison of mean seasonal courses of the biomass of main phytoplankton groups in Figure 8. Here, the phytoplankton biomass was averaged for the years 1993–2000 (polytrophic 2) and 2001–2018, when the lake reached the lower trophic status (polytrophic 1). Both the biomass of summer and spring phytoplankton bloom decreased in Lake Langer See. Cyanobacteria growth still starts in May, but the biomass maximum in late summer is lower. In the years 2014–2018, phytoplankton biomass and chlorophyll concentrations reached again the level of the 1990s (except 2017, Figure 7). This is presumably due to the sharp reduction in discharge resulting from unusually long periods of drought. The hydraulic residence time in the vegetation time increased to more than 90 days in the vegetation period of the years 2015, 2016, and 2018. The correlation of the chlorophyll concentrations (vegetation mean) with the hydraulic residence time (May–October) showed a clearly positive trend for the years 2004–2018 in Lake Langer See (r2 = 0.6, Figure 9). Contrastingly, Lake Scharmützelsee showed a decreasing trend.
Among cyanobacteria, a drastic decline in Planktothrix agardhii after 2001 was striking. Since this is a microcystin-producing species, this shift was accompanied by a decrease in the concentrations of that cyanotoxin. Lake Langer See contributed a large portion of toxin data to several studies [52,53,54], although not explicitly mentioned in these papers. The biovolume of other filamentous cyanobacteria, such as Pseudanabana spp., Planktolyngbya spp., Limnothrix spp. and Aphanizomenon gracile, remained almost unchanged after 2001 [55]. Phytoplankton assessment based on PSI [9] improved slightly and is now between the “poor” and “moderate” ecological status. Submerged macrophytes seem to have expanded in the last few years, however, their biomass is still too low and species indicating eutrophic (“poor”) conditions dominate. That is why the assessment according to PHYLIB [12] yields a “bad” ecological quality (Table 4).

4. Discussion

4.1. Lakes Miss Water Quality Goals due to High Nutrient Loads—Ecological Status of Lakes in Brandenburg in 2014

Despite of great efforts in catchment restoration and thus a general decrease in nutrient emissions into lakes since 1990, the ecological quality of the majority of lakes is still inappropriate. Only 12% of the 183 natural lakes studied in Brandenburg reached the “good ecological status” (EQC), according to the WFD in 2014, which is below the average of 26% for all natural German lakes ≥50 ha [15]. This difference is due to a high number of shallow lakes in the North German lowlands, which comprises the lake types with the largest water quality deficits (Figure 3 and Figure 4) [56].
The main reason for the failure to meet the WFD water quality goals is still too high nutrient loading. Especially the N inputs due to intensive agriculture especially in lowland (peaty) areas with artificially intensified drainage become more evident. The extent of excess in-lake TN concentrations is obvious (Figure 4). This seems to be contradictory to the results of a statistical analysis of nutrient concentrations in lakes of the ecoregion German lowlands: Dolman and co-authors [52] found that the phytoplankton of about half of the lakes is limited by N during the vegetation period. These situations are characteristic for shallow lakes during summer when denitrification reduces nitrate concentration while P release from the sediment increases P availability [57]. The major portion of TN is bound in phytoplankton biomass or in dissolved organic substances. Furthermore, the N demand of primary producers will be covered by internal nutrient input due to intensive recycling of freshly settled organic material in the water and especially in the upper sediment layer, detectable as a high release of ammonia from the sediment [58]. Therefore, phytoplankton growth can be apparently N-limited even in lakes with high TN concentrations if P supply is sufficiently high. Consequently, management measures to reduce nutrient inputs (P and N) are recommended [59]. Considering the fast N recycling and the high N emissions from catchments resulting in a high deviation between target values and concentrations (Figure 4), phytoplankton control by P seems a more viable management option [57]. Management is successful if positive feedback is induced: Lower trophic status with less phytoplankton biomass results in a lower intensity of lake internal remineralization of organic matter and an increasing P sorption in sediments [60]. However, Germany belongs to the minority of countries (38%) that have not yet set target values for nitrogen, although the use of only one nutrient for lake assessment is increasingly questioned [61].
If other parameters (e.g., silica concentration or underwater light) are limiting, lakes can reach a good assessment for phytoplankton despite their P or N concentrations exceeding the target values (see also [61]). Some shallow lakes and especially riverine lakes in our study have been assessed as “good” or better, albeit TN and TP concentrations that were above the lake type-specific target values (Figure 4). Phytoplankton growth in these lake types is known to be controlled by light or dilution due to high discharge rather than by nutrient concentrations. This was also reported by Dolman and co-authors [52] analyzing a dataset of 369 German lowland lakes. Low concentrations of silica can control the biomass of diatoms and chrysophytes in spring and can, therefore, favor the development of cyanobacteria [62]. In addition to these “bottom up” control mechanisms, phytoplankton biomass and composition will also be influenced by “top down” control due to zooplankton grazing [63] or the filtration activity of benthic macroinvertebrates such as mussels. The interaction between submerged macrophytes and phytoplankton by different mechanisms (increased sedimentation, reduced resuspension, nutrient uptake, excretion of allelochemicals, providing shelter for phytoplankton grazers) is an additional factor regulating phytoplankton dynamics, especially in shallow lakes [64], but was also shown for deep Lake Scharmützelsee by Hilt et al. (2010) [34]. However, the recovery of submerged macrophytes after their eutrophication-related loss and subsequent restoration measures in shallow lakes and their catchments is a long-lasting process whose mechanisms are not yet fully understood [65]. In general, the way in which food web interactions, including macrozoobenthos, fish, and water birds, and interspecies competition between plants influence phytoplankton dynamics is not quantified for most lakes.
However, it is even more difficult to quantify the impact of climate change on water quality. Climate change is known to exacerbate the eutrophication process in lakes through several direct and indirect processes [66,67]. This is especially appropriate for lakes in the study region, regarding the climatic conditions with low precipitation and negative net hydrological budget (chapter 2.1.1.). Increasing water temperatures, decreasing water levels and summer discharges, cyanobacteria, and macrophyte mass developments are expected [68]. Consequently, with global warming, lakes become more sensitive to nutrient loading which underlines the requirement for strict catchment management.

4.2. Effects of Lake Morphometry and Catchment Size—Case Study Scharmützelsee Region

The Scharmützelsee region is an example of the successful restoration of a catchment in Brandenburg and the entire eastern part of Germany after political changes in 1990. The reduction of nutrient emissions, primarily by eliminating point sources, caused a significant improvement of water quality. Nutrient input from point sources is no longer relevant for Lake Scharmützelsee, although Grüneberg and co-authors [28] assumed a delayed P input via groundwater contaminated by septic systems. However, point sources still contribute 6% of TP input and 3% of TN input for Lake Langer See, caused mainly by the effluent of the main regional wastewater treatment plant.
The relative importance of nutrient transport pathways and the absolute quantity of nutrient loads differ for the two lakes due to their different geographical locations and different land use of the upstream catchment. Baseline nutrient imports gain in relevance with decreasing size of catchment, flushing rate, and decreasing trophic level. This was shown for Lake Scharmützelsee receiving 54% of P input via groundwater and atmospheric deposition (Figure 6). This was only 45% for Lake Langer See. Nutrient input from agriculture is more important for Lake Langer See, especially for N (63% for Lake Langer See, 55% for Lake Scharmützelsee). Lake Langer See, the last lake of the catchment, receives about twice as much TP and TN compared to Lake Scharmützelsee in the central part of the region (Table 4). However, the nutrient loads estimated from land use (Figure 6) were only half of the estimates from empirical models (Table 4) for Lake Langer See. The deviation between the different approaches was even a factor 4 (TN) to 5 (TP) for Lake Scharmützelsee. Based on the TP load estimates from land use, the empirical models predict in-lake TP concentrations that would refer to the oligotrophic status for Lake Scharmützelsee (9 µg L−1) or to the mesotrophic status for Lake Langer See (35 µg L−1) according to OECD (1982) [48]. This corresponds to neither the current nor the historical status of Lake Scharmützelsee nor the potential natural status in dependence of lake morphometry which is the mesotrophic status [69]. However, the method of LUGV (2015) [41] was developed for the whole of Brandenburg to identify hotspots of nutrient input into surface waters. It reflects the proportions of different nutrient entry pathways quite well, depending on the present land use. Differences for small sub-catchments are possible if assumptions in this country-wide method do not meet local conditions. Exemplarily, the mean groundwater concentration of 58 µg L−1 TP used is much smaller compared to the 100 µg L−1 used by Grüneberg et al. (2011) [28]. Since Lake Scharmützelsee is mainly (88%) fed by groundwater, a difference in background concentrations could explain the huge difference between the applied methods and models. The results from the empirical models prove that the total nutrient loads from the LfU study are underestimated, while the relative contribution of the different nutrient emission pathways in the sub-catchments is plausible. This confirms the results of different studies which found that including local know-how, soft information, and more detailed field investigations improves modeling of diffuse nutrient pollution and water quality [70,71].
Whereas the elimination of point sources caused a rather abrupt nutrient load reduction for Lake Scharmützelsee [28], this was probably a more gradual process for Lake Langer See at the end of the catchment. Lake Scharmützelsee responded to the reduction of nutrient loading with a distinct change in trophic status and biota after about 13 years. This time delay is in the range of 10 to 15 years as reported by Jeppesen et al. (2005) [72] for a variety of lakes independent of hydraulic residence time. It was caused by internal load, by delayed seepage from septic systems [28] and due to the long hydraulic residence time. Contrastingly, Lake Langer See is immediately influenced by changes of inflowing water quality due to large catchment size relative to lake volume or area (Table 1) and short hydraulic residence time (Table 1 and Table 3). This lake acts more like a plankton reactor. It could be shown that phytoplankton biomass is strongly influenced by the hydraulic residence time, the longer the residence time, the more phytoplankton can grow (Figure 9). Due to its shallowness, frequent mixing of the water column and, consequently, sufficient underwater light supply, nutrients are converted into phytoplankton biomass very efficiently, indicated by a TP to chlorophyll a ratio around 1 [17]. This lake depends on the water quality of all upstream lakes. In the course of lake chains, seasonal effects (summer nutrient release) can be amplified [73].
Despite the improvement of water quality classes by one step, both lakes are not in the “good ecological status” according to WFD. In-lake concentrations are still too high and biomass and species composition do not match the lake type-specific reference status. The latter is the mesotrophic status for deep and thermally stratified Lake Scharmützelsee with a relatively small catchment size and the eutrophic status for the very shallow, polymictic Lake Langer See with a relatively large catchment and low hydraulic residence time. According to the empirical models, a further reduction of TP load by 20% would be necessary to meet the target value to achieve the good ecological status [52] in Lake Scharmützelsee. However, the present TP load for Lake Langer See should be reduced by almost 45%. Since the contribution of point sources is only small, nutrient inputs from diffusive sources, especially for N from agricultural areas has to be reduced. However, some studies confirm, that nutrient loads should be close to natural background concentrations to meet WFD water quality goals. This means that land use would have to be drastically changed, which would be unrealistic from a socio-economic point of view [2,71].

5. Conclusions

Following a period of intense anthropogenic eutrophication of surface waters in the last century, great efforts have been undertaken in catchment restoration over the last few decades, mainly by improving sewage collection and wastewater treatment. Despite significant improvements, only a minority of 12% of lakes in Brandenburg (North German lowlands) meet the ecological quality requirements of the European Water Framework Directive by the end of the first River Basin Management Plan of the EC in 2015.
In-lake nutrient concentrations are still too high. The TN concentration especially deviates significantly from lake type-specific target values, a clear indication of elevated diffusive imports from the catchments. Thus, catchment size in relation to lake area or volume becomes a major predictor for the probability of lakes reaching at least a “good” ecological quality. With the present level of diffuse nutrient emissions, many lakes fail the objectives of the WFD. This applies especially to shallow lakes with a largely agriculturally used catchment. The deficits in catchment management resulting in elevated nutrient emissions are amplified downstream lake chains, with downstream lakes depending on delayed recovery and amplified seasonal effects (summer nutrient release) of all upstream lakes. These lakes may fail to meet water quality goals in the long-term. Consequently, either quality goals or land use practices require revision, as it was recently discussed by Carvalho and co-authors [2]. This is of large practical relevance as deficits in nutrient import reduction may increasingly be compensated by expensive substitute lake internal (technical) restoration measures to meet the objectives of the WFD. Often, these measures erroneously combat an “internal nutrient load” which is normally not significant if coupled with a sufficiently low import from the catchment [74].
Strategies to reduce nutrient emissions are generally known and measures to reduce especially N inputs in hotspots and sensitive areas have been published recently by the German Advisory Council on the Environment (Sachverständigenrat für Umweltfragen, SRU) [75,76]: Existing legal instruments for local protected-area management should be used to reduce agricultural fertilizer use. Buffer zones should be established around nature conserves or sensitive areas. Intensive agriculture in lowland peaty areas is questionable. A reduction of N emissions from agriculture should be accompanied by a reformation of the common agricultural policy leading to an increase in agri-environmental payments and an intensification of environmental requirements for agricultural subsidies (maintaining permanent grassland, setting far-reaching requirements for ecological focus areas, and crop diversification). A further step is to reform and strictly enforce the fertilizer regulations, and the SRU recommends that the legal requirements related to good agricultural practice must be specified.
Despite the frequent occurrence of N limitation, especially in shallow lakes [52], there are several arguments for directing the management to reduce P availability: Many lakes seem to be closer to P targets than to N targets, and catchment-wide reduction of DIN emission is difficult owing to its chemical mobility. However, N-limited lakes should benefit from reduced N availability, and there are indications that high N availability has adverse effects on reed and submerged macrophytes [57]. These secondary effects are likely to contribute to the difference between phytoplankton only and EQC assessments found in our study. In practice, most catchment measures have multiple effects on both N and P.

Author Contributions

Conceptualization, J.R. and B.N.; methodology, J.R., K.Q., B.G.; investigation, J.R., K.Q., B.G.; data curation, J.R., K.Q.; writing—original draft preparation, J.R.; writing—review and editing, B.N., B.G., K.Q.; visualization, J.R.; project administration, B.N.; funding acquisition, B.N., J.R., B.G.

Funding

This work was supported by the German Ministry for Education and Research (BMBF) as part of the projects NITROLIMIT I and II (grant numbers 033L041A and 0033W015AN) and the preliminary phase of the project AgriTip (01LC1717A). The long-term study of the two lakes was realized within the BMBF projects NITROLIMIT I and II, NOSTOTOX (0330792 B) and the German-Israeli Water cooperation (02WT0985), CYLIN funded by KWB Berlin (with the financial support of Veolia Waters, BWB) and the DFG project AZ NI347/5-1, funded by the German Research Foundation.

Acknowledgments

We are grateful to the State Office of Environment (LfU) of the Ministry of Rural Development, Environment and Agriculture of the Federal State of Brandenburg, namely to Antje Barsch, Jens Päzolt and Jörg Schönfelder, for supplying data and comprehensive material on lake assessment and management, land use and nutrient emissions. The Water and Shipping Authority of Berlin and the LfU kindly provided discharge data. We thank the staff of the Research Station of the Department of Freshwater Conservation in Bad Saarow for their reliable work in the long-term study and Claudia Wiedner for the coordination of NITROLIMIT and earlier research projects. We gratefully acknowledge the work of Annette Tworeck (LBH Hoehn, Freiburg) who did most of the phytoplankton analyses for the two lakes, furthermore Ute Hahmann (LBH), Ute Mischke and Paul Zippel. We are grateful to Klaus van de Weyer (Lanaplan, Nettetal) and colleagues for the macrophyte mapping and Philip Saunders for proofreading.

Conflicts of Interest

The authors declare no conflict of interest. The funders had no role in the design of the study; in the collection, analyses, or interpretation of data; in the writing of the manuscript, or in the decision to publish the results.

References

  1. European Union (EU). Directive 2000/60/EC of the European Parliament and of the Council of 23 October 2000 Establishing a Framework for Community Action in the Field of Water Policy; Official Journal L 327; EU, Publications Office of the European Union: Luxembourg, 2000; Available online: http://eur-lex.europa.eu/resource.html?uri=cellar:5c835afb-2ec6-4577-bdf8-756d3d694eeb.0004.02/DOC_1&format=PDF (accessed on 14 February 2018).
  2. Carvalho, L.; Mackay, E.B.; Cardoso, A.C.; Baattrup-Pedersen, A.; Birk, S.; Blackstock, K.L.; Borics, G.; Borja, A.; Feld, C.K.; Ferreira, M.T.; et al. Protecting and restoring Europe’s waters: An analysis of the future development needs of the Water Framework Directive. Sci. Total Environ. 2019, 658, 1228–1238. [Google Scholar] [CrossRef] [PubMed]
  3. European Environment Agency (EEA). Source Apportionment of Nitrogen and Phosphorus Inputs into the Aquatic Environment; EEA Report No. 7/2005; EEA, Office for Official Publications of the European Communities: Copenhagen, Denmark, 2005; Available online: https://www.eea.europa.eu/publications/eea_report_2005_7 (accessed on 27 November 2019).
  4. Kronvang, B.; Borgvang, S.A.; Barkved, L.J. Towards European harmonised procedures for quantification of nutrient losses from diffuse sources—The EUROHARP project. J. Environ. Monit. 2009, 11, 503–505. [Google Scholar] [CrossRef] [PubMed]
  5. Birk, S.; Bonne, W.; Borja, A.; Brucet, S.; Courrat, A.; Poikane, S.; Solimini, A.; Van De Bund, W.; Zampoukas, N.; Hering, D. Three hundred ways to assess Europe’s surface waters: An almost complete overview of biological methods to implement the Water Framework Directive. Ecol. Indic. 2012, 18, 31–41. [Google Scholar] [CrossRef]
  6. Solheim, A.L.; Rekolainen, S.; Moe, S.J.; Carvalho, L.; Phillips, G.; Ptacnik, R.; Penning, W.E.; Toth, L.G.; O’Toole, C.; Schartau, A.-K.L.; et al. Ecological threshold responses in European lakes and their applicability for the Water Framework Directive (WFD) implementation: Synthesis of lakes results from the REBECCA project. Aquat. Ecol. 2008, 42, 317–334. [Google Scholar] [CrossRef]
  7. Poikane, S.; van den Berg, M.; Hellsten, S.; de Hoyos, C.; Ortiz-Casas, J.; Pall, K.; Portielje, R.; Phillips, G.; Solheim, A.L.; Tierney, D.; et al. Lake ecological assessment systems and intercalibration for the European Water Framework Directive: Aims, achievements and further challenges. Procedia Environ. Sci. 2011, 9, 153–168. [Google Scholar] [CrossRef] [Green Version]
  8. Länderarbeitsgemeinschaft Wasser (LAWA-AO). In RaKon Monitoring Teil B, Arbeitspapier I—Gewässertypen und Referenzbedingungen; Stand 02.02.2016; LAWA-AO, MELUND: Kiel, Germany, 2016; Available online: http://www.gewaesser-bewertung.de/files/rakon_b-arbeitspapier-i_stand_20160202.pdf (accessed on 14 February 2017).
  9. Mischke, U.; Riedmüller, U.; Hoehn, E.; Nixdorf, B. Method Description of the Assessment of Lakes and Reservoirs with Phytoplankton and the Phyto-See-Index in Germany. In User Handbook. Excerpt of Original Version December; Electronic Publication: Berlin, Germany, 2016; Available online: http://www.gewaesser-bewertung.de/files/english_handbook_german_lake_assessment_method_description_psi_dec2016-1.pdf (accessed on 27 November 2019).
  10. Mischke, U.; Böhmer, J.; Riedmüller, U.; Deneke, R.; Maier, G. Auswertungsprogramm PhytoSee Version 7.0 zur Berechnung des Phyto-See-Index (PSI) für die Ökologische Bewertung von Natürlichen, Künstlichen und Erheblich Veränderten Seen in Deutschland Gemäß EG-Wasserrahmenrichtlinie; Erweitert um Das PhytoLoss Modul 1.2 zur Einbindung von Zooplanktonbefunden. Stand 15.12.2017. 2017. Available online: http://www.gewaesser-bewertung.de/files/phytosee-tool_7.0_dez2017.zip (accessed on 14 February 2018).
  11. Nixdorf, B.; Hoehn, E.; Riedmüller, U.; Mischke, U.; Schönfelder, I. Probenahme und Analyse des Phytoplanktons in Seen und Flüssen zur ökologischen Bewertung gemäß der EU-WRRL. In Handbuch Angewandte Limnologie—Methodische Grundlagen; III-4.3.1; Ergänzungslieferung 4/10, Wiley-VCH Verlag GmbH & Co. KgaA: Weinheim, Germany, 2010; pp. 1–24. [Google Scholar]
  12. Schaumburg, J.; Schranz, C.; Stelzer, D.; Vogel, A. Verfahrensanleitung für die ökologische Bewertung von Seen zur Umsetzung der EG-Wasserrahmenrichtlinie: Makrophyten und Phytobenthos. PHYLIB. Stand Februar 2014; Bayerisches Landesamt für Umwelt. Im Auftrag der LAWA Projekt-Nr. O 10.10: Augsburg/Wielenbach, Germany, 2015; Available online: http://www.gewaesser-bewertung.de/files/verfahrensanleitung_seen2015.pdf (accessed on 14 February 2018).
  13. Böhmer, J. Methodisches Handbuch zur WRRL-Bewertung von Seen Mittels Makrozoobethos Gemäß AESHNA—Handbuch zur Untersuchung und Bewertung von Stehgewässern auf der Basis des Makrozoobenthos vor dem Hintergrund der EG-Wasserrahmenrichtlinie; Bioforum GmbH: Kirchheim/Teck, Germany, 2017; Available online: http://www.gewaesser-bewertung.de/files/AESHNA_Anleitung_Endfassung_5-5-17.pdf (accessed on 27 November 2019).
  14. Ritterbusch, D.; Brämick, U. Verfahrensvorschlag zur Bewertung des ökologischen Zustandes von Seen anhand der Fische (1). Schriften Instituts Binnenfischerei eV 2015, 41, 69. [Google Scholar]
  15. Bundesministerium für Umwelt und Bau/Umweltbundesamt (BMUB/UBA). Water Framework Directive—The Status of German Waters 2015; BMU/UBA: Bonn/Dessau, Germany, 2016; Available online: http://www.gewaesser-bewertung.de/files/wrrl_englische_version_dez_2016.pdf (accessed on 14 February 2017).
  16. European Environment Agency (EEA). European Waters—Assessment of Status and Pressures 2018; EEA Report No. 7/2018; European Environment Agency, Publications Office of the European Union: Luxembourg, 2018; Available online: https://www.eea.europa.eu/publications/state-ofwater (accessed on 27 November 2019). [CrossRef]
  17. Nixdorf, B.; Deneke, R. Why ‘very shallow’ lakes are more successful opposing reduced nutrient loads. Hydrobiologia 1997, 342, 269–284. [Google Scholar] [CrossRef]
  18. Ministry of Rural Development, Environment and Agriculture of the Federal State of Brandenburg (MLUL). Landschaftswasserhaushalt. MLUL, Potsdam, Germany. Available online: https://lfu.brandenburg.de/cms/detail.php/bb1.c.327798.de (accessed on 28 November 2019).
  19. Deutscher Wetterdienst (DWD). Niederschlag: Vieljährige Mittelwerte 1981–2010. Available online: https://www.dwd.de/DE/leistungen/klimadatendeutschland/mittelwerte/nieder_8110_akt_html.html?view=nasPublication&nn=16102 (assessed on 30 September 2019).
  20. Umweltbundesamt (UBA, DLR-DFD). CORINE Land Cover (CLC2006); Umweltbundesamt, DLR-DFD: Weßling, Germany, 2009. [Google Scholar]
  21. Ministry of Rural Development, Environment and Agriculture of the Federal State of Brandenburg (MLUL). Lagebericht Abwasser 2015; MLUL: Potsdam, Germany, 2015; Available online: http://www.mlul.brandenburg.de/cms/media.php/lbm1.a.3310.de/kawb2015_teil3.pdf (accessed on 2 July 2016).
  22. Ministry of Rural Development, Environment and Agriculture of the Federal State of Brandenburg (MLUL). Kommunale Kläranlagen und Einleitstellen im Land Brandenburg [kommka.shp; kommeinleit.shp]; Stand 31.12.2011; MLUL: Potsdam, Germany, 2017; Available online: http://www.metaver.de/search/dls/dataset/365B64CD-55CA-4C65-8F48-8B93B9C06E40/4266D9C1-D20B-4922-B8B2-6BA116243CCE (accessed on 14 February 2018).
  23. Bundesamt für Kartographie und Geodäsie (BKG); BKG, Frankfurt/Main, Germany. Available online: http://sg.geodatenzentrum.de/web_download/vg/vg1000-ew_3112/utm32s/shape/vg1000-ew_3112.utm32s.shape.kompakt.zip (accessed on 23 November 2015).
  24. Ministry of Rural Development, Environment and Agriculture of the Federal State of Brandenburg (MLUL). Surface catchment areas. MLUL: Potsdam, Germany. Available online: http://www.mugv.brandenburg.de/lua/gis/ezg25.zip (accessed on 9 September 2014).
  25. Ministry of Rural Development, Environment and Agriculture of the Federal State of Brandenburg (MLUL). Water network. MLUL: Potsdam, Germany. Available online: http://www.mugv.brandenburg.de/lua/gis/gewnet25.zip (accessed on 9 September 2014).
  26. Ministry of Rural Development, Environment and Agriculture of the Federal State of Brandenburg (MLUL). Surface water bodies. MLUL: Potsdam, Germany. Available online: http://www.mugv.brandenburg.de/lua/gis/seen25.zip (accessed on 9 September 2014).
  27. Ministry of Rural Development, Environment and Agriculture of the Federal State of Brandenburg (MLUL). Municipal wastewater treatment plants: Potsdam, Germany. Available online: http://www.mlul.brandenburg.de/lua/gis/kommka.zip (accessed on 9 September 2014).
  28. Grüneberg, B.; Rücker, J.; Nixdorf, B.; Behrendt, H. Dilemma of non-steady state in lakes—Development and predictability of in-lake P concentration in dimictic Lake Scharmützelsee (Germany) after abrupt load reduction. Int. Rev. Hydrobiol. 2011, 96, 599–621. [Google Scholar] [CrossRef]
  29. Kleeberg, A.; Freidank, A.; Jöhnk, K. Effects of ice cover on sediment resuspension and phosphorus entrainment in shallow lakes: Combining in situ experiments and wind-wave modeling. Limnol. Oceanogr. 2013, 58, 1819–1833. [Google Scholar] [CrossRef]
  30. Wundsch, H.H. Beiträge zur Fischereibiologie märkischer Seen. VI. Die Entwicklung eines besonderen Seentypus (H2S-Oscillatorien-Seen) im Fluß-Seen-Gebiet der Spree und Havel und seine Bedeutung für die fischereibiologischen Bedingungen in dieser Region. Zeitschrift Fischerei 1940, 38, 443–658. [Google Scholar]
  31. Kleeberg, A. Re-assessment of Wundsch’s (1940) ‘H2S-Oscillatoria-Lake’ type using the eutrophic Lake Scharmützel (Brandenburg, NE Germany) as an example. Hydrobiologia 2003, 501, 1–5. [Google Scholar] [CrossRef]
  32. Müller, H. Die produktionsbiologischen Verhältnisse märkischer Seen in der Umgebung Storkows. Zeitschrift Fischerei Hilfswissenschaften 1952, 1, 95–160. [Google Scholar]
  33. Nixdorf, B.; Mischke, U.; Rücker, J. Phytoplankton assemblages and steady state in deep and shallow eutrophic lakes—An approach to differentiate the habitat properties of Oscillatoriales. Hydrobiologia 2003, 502, 111–121. [Google Scholar] [CrossRef]
  34. Hilt, S.; Henschke, I.; Rücker, J.; Nixdorf, B. Can submerged macrophytes influence turbidity and trophic state in deep lakes? Suggestions from a case study. J. Environ. Qual. 2010, 39, 725–733. [Google Scholar] [CrossRef] [PubMed]
  35. Ministerium für Ländliche Entwicklung und Landwirtschaft des Landes Brandenburg (MLUL). Umsetzung der Wasserrahmenrichtlinie: Beiträge des Landes Brandenburg zu den Bewirtschaftungsplänen und Maßnahmenprogrammen der Flussgebietseinheiten Elbe und Oder für den Zeitraum 2016 bis 2021; MLUL: Potsdam, Germany, 2016; Available online: https://lfu.brandenburg.de/cms/media.php/lbm1.a.3310.de/wrrl_2016_gesamt.pdf (accessed on 27 November 2019).
  36. Rücker, J.; Barsch, A.; Nixdorf, B. „Besser, aber noch nicht gut“—Ökologischer Zustand der Seen in Brandenburg 2014. WasserWirtschaft 2015, 12, 41–47. [Google Scholar] [CrossRef]
  37. Päzolt, J. Der Makrophytenindex Brandenburg—Ein Index zur Bewertung von Seen mit Makrophyten. Nat. Landsch. Brandenbg. 2007, 16, 116–121. [Google Scholar]
  38. European Commission, Joint Research Centre (EC, JRC). Water Framework Directive Intercalibration Technical Report; Part 2: Lakes; EC, JRC, Office for Official Publications of the European Communities: Luxembourg, 2009; Available online: https://publications.jrc.ec.europa.eu/repository/bitstream/JRC51340/3009_08-vol-lakes-cover.pdf (accessed on 27 November 2019).
  39. Johnes, P.J. Evaluation and management of the impact of land use change on the nitrogen and phosphorus load delivered to surface waters: The export coefficient modelling approach. J. Hydrol. 1996, 183, 323–349. [Google Scholar] [CrossRef]
  40. Behrendt, H.; Huber, P.; Kornmilch, M.; Opitz, D.; Schmoll, O.; Scholz, G.; Uebe, R. Nutrient Emissions into River Basins of Germany. UBA-Texte, 23/00, 2000. Available online: https://www.umweltbundesamt.de/sites/default/files/medien/publikation/long/1837.pdf (accessed on 14 February 2018).
  41. Landesamt für Umwelt, Gesundheit und Verbraucherschutz des Landes Brandenburg (LUGV). Methodik der Nährstoffbilanzierung in Brandenburg als Grundlage für die Ausweisung von Maßnahmen zur Nährstoffreduzierung für den BWPL 2014; Heft Nr. 144; Fachbeiträge des LUGV: Potsdam OT Groß-Glienicke, Germany, 2015; Available online: http://www.lfu.brandenburg.de/media_fast/4055/fb_144.pdf (accessed on 14 February 2018).
  42. DEV (Deutsche Einheitsverfahren zur Wasser-, Abwasser- und Schlammuntersuchung). D11, E5, D9, C9, E1, H7; WILEY-VCH Verlag GmbH & Co. KGaA, Beuth Verlag GmbH: Berlin, Germany, 1976–1998. [Google Scholar]
  43. Utermöhl, H. Zur Vervollkommnung der quantitativen Phytoplankton-Methodik. Mitt. Int. Ver. Theor. Angew. Limnol. 1958, 9, 1–38. [Google Scholar] [CrossRef]
  44. DEV (Deutsche Einheitsverfahren zur Wasser-, Abwasser- und Schlammuntersuchung). DIN EN 16695:2015-12: Water Quality—Guidance on the Estimation of Phytoplankton Biovolume, German version EN 16695:2015; WILEY-VCH Verlag GmbH & Co. KGaA, Beuth Verlag GmbH: Berlin, Germany, 2015. [Google Scholar] [CrossRef]
  45. Länderarbeitsgemeinschaft Wasser (LAWA). Trophieklassifikation von Seen. Richtlinie zur Ermittlung des Trophie-Index nach LAWA für natürliche Seen, Baggerseen, Talsperren und Speicherseen. Empfehlungen Oberirdische Gewässer; Access-Tool Version, 1.1; LAWA—Bund/Länder Arbeitsgemeinschaft Wasser, Ed.; Kulturbuchverlag: Berlin, Germany, 2014; ISBN 978-3-88961-345-52014. Available online: http://www.gewaesserfragen.de/pdfs/Auswerte-Tool_Trophie-Index_Seen_nach_LAWA_Version_1.1_Apr2015.zip (accessed on 14 February 2017).
  46. NITROLIMIT. NITROLIMIT—Stickstofflimitation in Binnengewässern: Ist Stickstoffreduktion ökologisch sinnvoll und wirtschaftlich vertretbar? Abschlussbericht des BMBF-Verbundprojekts NITROLIMIT I, Mai 2014; BTU Cottbus–Senftenberg, Lehrstuhl Gewässerschutz: Bad Saarow, Germany, 2014; p. 208. Available online: http://www-docs.tu-cottbus.de/gewaesserschutz/public/downloads/NITROLIMIT_Endbericht_Mai2014.pdf (accessed on 5 July 2016).
  47. Vollenweider, R.A. Advances in defining critical loading levels for phosphorus in lake eutrophication. Memorie Istituto Italiano Idrobiologia 1976, 33, 53–83. [Google Scholar]
  48. Organization for Economic Cooperation and Development (OECD). Eutrophication of Waters—Monitoring, Assessment and Control; OECD: Paris, France, 1982. [Google Scholar]
  49. Nürnberg, G.K. The prediction of internal phosphorus load in lakes with anoxic hypolimnia. Limnol. Oceanogr. 1984, 29, 111–124. [Google Scholar] [CrossRef]
  50. Sas, H. Lake Restoration by Reduction of Nutrient Loading. Expectations, Experiences, Extrapolations; Academia Richarz: Sankt Augustin, Germany, 1989; p. 497. [Google Scholar]
  51. Brett, M.T.; Benjamin, M.M. A review and reassessment of lake phosphorus retention and the nutrient loading concept. Freshw. Biol. 2008, 53, 194–211. [Google Scholar] [CrossRef]
  52. Dolman, A.M.; Mischke, U.; Wiedner, C. Lake-type-specific seasonal patterns of nutrient limitation in German lakes, with target nitrogen and phosphorus concentrations for good ecological status. Freshw. Biol. 2016, 61, 444–456. [Google Scholar] [CrossRef]
  53. Fastner, J.; Rücker, J.; Stüken, A.; Preußel, K.; Nixdorf, B.; Chorus, I.; Köhler, A.; Wiedner, C. Occurrence of the cyanobacterial toxin cylindrospermopsin in Northeast Germany. Environ. Toxicol. 2007, 22, 26–32. [Google Scholar] [CrossRef] [PubMed]
  54. Dolman, A.M.; Rücker, J.; Pick, F.R.; Fastner, J.; Rohrlack, T.; Mischke, U.; Wiedner, C. Cyanobacteria and cyanotoxins: The influence of nitrogen versus phosphorus. PLoS ONE 2012, 7, e38757. [Google Scholar] [CrossRef] [PubMed]
  55. NOSTOTOX. Development of Toxic Nostocales (Cyanobacteria) in the Course of Declining Trophic State and Global Warming. In Final Report of the Joint Research Project NOSTOTOX; IGB: Berlin, Germany, 2011; Available online: https://www-docs.b-tu.de/fg-gewaesserschutz/public/projekte/Nostotox_final_2011_web.pdf (accessed on 14 July 2016).
  56. German Environment Agency. Waters in Germany: Status and Assessment; German Environment Agency: Dessau-Roßlau, Germany, 2017; ISSN 2363-832X. Available online: http://www.gewaesser-bewertung.de/files/171018_uba_gewasserdtl_engl_bf.pdf (accessed on 14 February 2018).
  57. Moss, B.; Jeppesen, E.; Søndergaard, M.; Lauridsen, T.L.; Liu, Z. Nitrogen, macrophytes, shallow lakes and nutrient limitation: Resolution of a current controversy? Hydrobiologia 2013, 710, 3–21. [Google Scholar] [CrossRef]
  58. Nixdorf, B.; Rücker, J.; Grüneberg, B. Importance of internal nitrogen recycling on water quality and cyanobacterial biomass in a shallow polymictic lake (Lake Langer See, Germany). In Proceedings of the 3rd International Conference Water Resources and Wetlands, Tulcea, Romania, 8–10 September 2014; Gâştescu, P., Bretcan, P., Eds.; Asociatia Romana de Limnogeografie: Bukarest, Romania, 2016; pp. 38–46, ISSN 2285-7923. Available online: https://www.limnology.ro/wrw2016/proceedings/4_Brigitte_Nixdorf.pdf (accessed on 14 February 2018).
  59. Positionspapier des Projekts NITROLIMIT—Stickstofflimitation in Binnengewässern—Ist Stickstoffreduktion Ökologisch Sinnvoll und Wirtschaftlich Vertretbar? Wiedner, C., Schlief, J., Eds.; NITROLIMIT: Bad Saarow, Germany, 2016; Available online: https://opus4.kobv.de/opus4-btu/frontdoor/index/index/docId/4019 (accessed on 27 November 2019).
  60. Rothe, M.; Kleeberg, A.; Grüneberg, B.; Friese, K.; Pérez-Mayo, M.; Hupfer, M. Sedimentary Sulphur: Iron Ratio Indicates Vivianite Occurrence: A Study from Two Contrasting Freshwater Systems. PLoS ONE 2015, 10, e0143737. [Google Scholar] [CrossRef]
  61. Poikane, S.; Kelly, M.G.; Herrero, F.S.; Pitt, J.-A.; Jarvie, H.P.; Claussen, U.; Leujak, W.; Lyche Solheim, A.; Teixeira, H.; Phillips, G. Nutrient criteria for surface waters under the European Water Framework Directive: Current state-of-the-art, challenges and future outlook. Sci. Total Environ. 2019, 695, 133888. [Google Scholar] [CrossRef]
  62. Launhardt, A.; Rücker, J.; Nixdorf, B. Control of seasonal phytoplankton dynamics in Lake Scharmützelsee (northeast Germany) by nutrient competition during winter. Verh. Internat. Verein. Limnol. 2006, 29, 1675–1678. [Google Scholar] [CrossRef]
  63. Jeppesen, E.; Søndergaard, M.; Meerhoff, M.; Lauridsen, T.L.; Jensen, J.P. Shallow lake restoration by nutrient loading reduction-some recent findings and challenges ahead. Hydrobiologia 2007, 584, 239–252. [Google Scholar] [CrossRef]
  64. Scheffer, M.; Hosper, S.H.; Meijer, M.-L.; Moss, B.; Jeppesen, E. Alternative equilibria in shallow lakes. Trends Ecol. Evol. 1993, 8, 275–279. [Google Scholar] [CrossRef]
  65. Hilt, S.; Nuñez, A.; Marta, M.; Bakker, E.S.; Blindow, I.; Davidson, T.A.; Gillefalk, M.; Hansson, L.-A.; Janse, J.H.; Janssen, A.B.G.; et al. Response of Submerged Macrophyte Communities to External and Internal Restoration Measures in North Temperate Shallow Lakes. Front. Plant Sci. 2018, 9, 194. [Google Scholar] [CrossRef] [PubMed] [Green Version]
  66. Dokulil, M.T.; Teubner, K. Eutrophication and Climate Change: Present Situation and Future Scenarios. In Eutrophication: Causes, Consequences and Control; Ansari, A., Singh Gill, S., Lanza, G., Rast, W., Eds.; Springer: Dordrecht, The Netherlands, 2010. [Google Scholar] [CrossRef]
  67. Jeppesen, E.; Søndergaard, M.; Liu, Z. Lake Restoration and Management in a Climate Change Perspective: An Introduction. Water 2017, 9, 122. [Google Scholar] [CrossRef] [Green Version]
  68. Nixdorf, B.; Rücker, J.; Deneke, R.; Grüneberg, B. Gewässer im Klimastress? Eutrophierungsgefahr in Seen am Beispiel der Scharmützelseeregion. Forum Forschung 2009, 22, 99–106. [Google Scholar]
  69. Länder Arbeitsgemeinschaft Wasser (LAWA). Gewässerbewertung—Stehende Gewässer—Vorläufige Richtlinie für eine Erstbewertung von Natürlich Entstandenen Seen Nach Trophischen Kriterien 1998; Kulturbuch: Berlin, Germany, 1999; ISBN 3-88961-225-3. Available online: http://www.lawa.de/documents/Gewaesserbewertung_stehende_Gewaesser_2_4ed_copy_589.pdf (accessed on 14 February 2017).
  70. Arheimer, B.; Andersson, L.; Alkan-Olsson, J.; Jonsson, A. Using catchment models to establish measure plans according to the Water Framework Directive. Water Sci. Technol. 2007, 56, 21–28. [Google Scholar] [CrossRef] [Green Version]
  71. Volk, M.; Liersch, S.; Schmidt, G. Towards the implementation of the European Water Framework Directive? Lessons learned from water quality simulations in an agricultural watershed. Land Use Policy 2009, 26, 580–588. [Google Scholar] [CrossRef]
  72. Jeppesen, E.; Søndergaard, M.; Jensen, J.P.; Havens, K.E.; Anneville, O.; Carvalho, L.; Coveney, M.F.; Deneke, R.; Dokulil, M.T.; Foy, B.; et al. Lake responses to reduced nutrient loading—An analysis of contemporary long term data from 35 case studies. Freshw. Biol. 2005, 50, 1747–1770. [Google Scholar] [CrossRef]
  73. Lindim, C.; Becker, A.; Grüneberg, B.; Fischer, H. Modelling the effects of nutrient loads reduction and testing the N and P control paradigm in a German shallow lake. Ecol. Eng. 2015, 82, 415–427. [Google Scholar] [CrossRef]
  74. Hupfer, M.; Reitzel, K.; Grüneberg, B. Methods for measuring internal loading. In Internal Phosphorus Loading in Lakes: Causes, Case Studies, and Management; Steinman, A.D., Spears, B.M., Eds.; J. Ross Publishing: Plantation, FL, USA, 2019. [Google Scholar]
  75. German Advisory Council on the Environment (SRU). NITROGEN: Strategies for Resolving an Urgent Environmental Problem. Summary. January 2015; SRU: Berlin, Germany, 2015; Available online: http://www.umweltrat.de/SharedDocs/Downloads/EN/02_Special_Reports/2012_2016/2015_01_Nitrogen_Strategies_summary.pdf?__blob=publicationFile (accessed on 27 November 2019).
  76. German Advisory Council on the Environment (SRU). Sondergutachten Stickstoff: Lösungsstrategien für ein Drängendes Umweltproblem; SRU: Berlin, Germany, 2015; Available online: http://dip21.bundestag.de/dip21/btd/18/040/1804040.pdf (accessed on 20 July 2016).
Figure 1. Federal States of Germany (a). Brandenburg is highlighted in grey and the capital, Berlin, in black. The catchment Scharmützelsee region is surrounded by a line. Distribution of lakes in Brandenburg (b). Lakes to be assessed according to the European Water Framework Directive [1] and have an area ≥50 ha are shown in black. Scharmützelsee region is marked. Catchment of Scharmützelsee region (c). Arrows indicate the flow direction, crosses mark the effluents of wastewater treatment plants, and black asterisks mark the sampling locations in Lake Scharmützelsee (SCH) and Lake Langer See (LAN). Source of geographical data: [23,24,25,26,27].
Water 11 02547 g001
Figure 2. Land use of the catchment of Scharmützelsee region. The lakes in the case study are labeled. The pie chart summarizes the types of land use (industrial and urban areas are grouped together). Map created from CORINE Land Cover data (CLC2006) [20].
Water 11 02547 g002
Figure 3. Assessment of 183 natural lakes in Brandenburg ≥50 ha according to the Ecological Quality Class (EQC, left) and Phyto-See-Index (PSI, right) as reported to the EU in 2014. The EQC summarizes indicator values of different assessment tools for diverse biocomponents (phytoplankton, benthic diatoms, submerged macrophytes, and microphytobenthos). Lakes are classified in sub-types according to PSI [9]. Numbers of lake types and distinctive features are given. VQ—volume quotient (catchment area divided by lake volume (m2/m3)), zm—mean depth (m).
Water 11 02547 g003
Figure 4. The PSI and concentrations of total phosphorus (TP, triangles) and total nitrogen (TN, circles) of the vegetation period (April–October) for 180 lakes in Brandenburg (without lake type 14). Numbers of lake types and distinctive features are given. VQ—volume quotient (catchment area divided by lake volume (m−1)), zm—mean depth (m). Vertical lines indicate lake type-specific TP and TN target values for achieving good ecological status according to Dolman et al. (2016) [52] (range of error—grey area). The bold horizontal line is the boundary between “good” and “moderate ecological status”. (Figure modified from [36]).
Water 11 02547 g004
Figure 5. Phosphorus (a,b) and nitrogen net emissions (c,d) in kg ha−1 yr−1 from agricultural (a,c) and urban areas (b,d) for the sub-catchments in the Scharmützelsee region calculated without nutrient retention in the surface water bodies, according to the method of LUGV [41].
Water 11 02547 g005
Figure 6. Phosphorus (left) and nitrogen (right) input to Lake Scharmützelsee (SCH) and Lake Langer See (LAN) from different sources, calculated according to the method of [41]. Nutrient retention in the soil and in water bodies is considered. WWTP—wastewater treatment plant.
Water 11 02547 g006
Figure 7. Long-term trophic development of Lake Scharmützelsee (left) and Lake Langer See (right) from 1994 to 2018. From the top to bottom: Vegetation mean (April–October) of concentration of TP and TN. Vertical lines indicate lake type-specific target values to reach good ecological quality, according to Dolman et al. (2016) [52], for both nutrients, chlorophyll a (Chl a) and Secchi depth (SD), biomass of total phytoplankton and cyanobacteria, German Trophic Index [45] and ecological quality as Phyto-See-Index [9].
Water 11 02547 g007
Figure 8. Mean seasonal courses of biomass of different taxonomic groups of phytoplankton. Data are averaged for eutrophic years (1993–2002, except 2000) and mesotrophic years (2003–2018) for Lake Scharmützelsee (top) and for years when Lake Langer See (bottom) was either in the polytrophic 2 status (1993–2000) or polytrophic 1 status (2001–2018), according to the German Trophic-Index [45].
Water 11 02547 g008
Figure 9. Vegetation mean of chlorophyll a concentration in dependence of hydraulic residence time (May–October) for Lake Scharmützelsee (left) and Lake Langer See (right) for the years 2004–2018. One value was excluded from the correlation analysis (open triangle).
Water 11 02547 g009
Table 1. Morphological and hydrological characteristics of the lakes studied. Hydrological data are given as mean and range of annual values 1994–2018.
Scharmützelsee (SCH)Langer See (LAN)
Geographic coordinates (WGS84)52°15′ N, 14°03′ E52°14′ N, 13°47′ E
Catchment area (km2)127392
Lake area (km2)12.11.3
Lake volume (Mio. m3)108.22.84
Catchment to volume ratio (m−1)1.2138
Shore length (km)30.38.4
Maximum depth (m)29.53.8
Mean depth (m)8.92.2
Mean daily discharge (m3 s−1)0.35 (0.22–0.47)1.03 (0.70–1.44)
Hydraulic residence time (a)10.3 (7.4–15.8)0.09 (0.06–0.13)
Type of mixisdimicticpolymictic
Lake type according to WFD [8,9]13
(stratified hard water lake with small catchment)
11.2
(very shallow hard water lake with large catchment)
Table 2. Classification of calcareous (Ca2+ ≥ 15 mg L−1) German lowland lakes ≥50 ha, according to [8] (DE-type), and for the assessment of phytoplankton (PP-type), according to [9]. Classification is based on mixing behavior, the influence of the catchment expressed as volume quotient (VQ, catchment area (km2) divided by lake volume (106 m3)), mean depth (zm, lake volume divided by lake area) and hydraulic residence time (RT in days, lake volume divided by mean annual discharche). The European intercalibration lake type (IC type) is given if it exists (Lowland Central/Baltic Geographical Intercalibration Group [38]).
DE TypePP TypeMixisVQzmRTIC Type
1010.1stratified1.5–15 L-CB1
10.2>15
1313≤1.5
1111.1polymictic>1.5>3 m
11.2>1.5≤3 m L-CB2
1414≤1.5
1212riverine>1.5 3–30 d
Table 3. Phosphorus (P) and nitrogen (N) load for Lake Scharmützelsee and Lake Langer See for the periods 1994–2003 and 2004–2018 calculated by empirical models from mean annual discharge and mean annual concentrations of P and N in the upper mixed part of the water column as input data. Mean and standard deviation of two to four empirical models is given for the P load. The N load was derived from only one model [48]. The calculation of critical P and N loads is based on lake type-specific target values (vegetation mean) of Dolman et al. (2016) [52] (in italics). Due to the difference between annual mean and vegetation mean, the P-target value for Lake Scharmützelsee was multiplied by a factor of 1.5.
Lake Scharmützelsee (Type 13)Lake Langer See (Type 11.2)
1994–20032004–2018Target Value Critical Load1994–20032004–2018Target Value Critical Load
Input data, mean (minimum–maximum)
Mean annual discharge11.7 (8.6–14.7)10.5 (6.9–13.9) 33.5 (23.5–45.3)31.7 (22.2–43.9)
(106 m3 yr−1)
Total P (µg L−1)59.6 (48.6–78.6)38.4 (33.9–44.4)21 (18–25)99.9 (71.4–124.6)67.7 (55.3–76.4)41 (32–51)
Total N (mg L−1)0.87 (0.82–0.94)0.65 (0.55–0.74)0.48 (0.35–0.62)1.27 (0.81–1.49)1.06 (0.84–1.17)0.71 (0.52–0.88)
Nutrient load, mean (±standard deviation)
P load (t yr−1)3.3 (±1.0)1.9 (±0.4)1.6 (±0.3)6.5 (±2.8)3.9 (±1.3)2.5 (±0.7)
Area-specific P load (g m−2 yr−1) 0.27 (±0.08)0.16 (±0.03)0.14 (±0.02)4.6 (±2.0)2.8 (±0.9)1.7 (±0.5)
N load (t yr−1)32.8 (±5.3)20.8 (±3.9)14.8 (±1.8)50.6 (±14.1)36.2 (±8.9)24.1 (±4.8)
Area-specific N load (g m−2 yr−1)2.7 (±0.4)1.7 (±0.3)1.2 (±0.2)35.8 (±10.0)25.7 (±6.3)17.0 (±3.4)
Table 4. Limnological characteristics of the lakes studied and results of assessment of biological components according to the WFD. The range of vegetation means (April–October) of total phosphorus, total nitrogen, chlorophyll a concentrations, Secchi depth, and phytoplankton biovolume, and assessment values are given for the years 2011–2018, assessment of submerged macrophytes for 2011.
ScharmützelseeLanger See
Lake type acc. to WFD [8,9]13 (stratified hard water lake with small catchment)11.2 (very shallow hard water lake with large catchment)
Total phosphorus (µg L−1)17–2958–77
Total nitrogen (mg L−1)0.45–0.750.81–1.18
Secchi depth (m)2.4–3.80.5–0.8
Chlorophyll a (µg L−1)6–1451–125
Phytoplankton biovolume (mm3 L−1)1.2–2.49.1–24.2
German Trophic Index and trophic status acc. to LAWA [45]2.2–2.6 (mesotrophic – eutrophic)3.5–3.9 (polytrophic 1)
Assessment of phytoplankton (PSI) [9]2.3–3.4 (moderate)3.5–4.6 (poor)
Assessment of submerged macrophytes (PHYLIB) [12]3.0 (moderate)4.9 (bad)

