Article

Water Footprint Assessment of Eggs in a Parent-Stock Layer Breeder Farm

1
Department of Agricultural Structure and Bioenvironmental Engineering, College of Water Resources & Civil Engineering, China Agricultural University, Beijing 100083, China
2
Key Lab of Agricultural Engineering in Structure and Environment, Ministry of Agriculture and Rural Affairs, Beijing 100083, China
3
Beijing Engineering Research Center for Livestock and Poultry Healthy Environment, Beijing 100083, China
4
Department of Agricultural and Biological Engineering, University of Illinois at Urbana-Champaign, Urbana, IL 61801, USA
*
Author to whom correspondence should be addressed.
Water 2019, 11(12), 2546; https://doi.org/10.3390/w11122546
Submission received: 30 September 2019 / Revised: 29 November 2019 / Accepted: 29 November 2019 / Published: 2 December 2019
(This article belongs to the Section Water Use and Scarcity)

Abstract

:
Egg production and consumption of eggs in China account for about 40% of the global total, and this constitutes a significant demand for water resources. The shortage of water resources in China means egg production in this country has serious water challenges. However, there are few studies concerning water use in egg production. In this study, the water footprint network (WFN) methodology was applied to analyze the water footprint (WF) of intensive egg production using a typical parent-stock layer breeder farm in North China as a model, which raises 208,663 layer breeders and produces about 2791.39 t eggs per year. The feed and water consumption over 353 days were collected for analysis, and the water footprint of chicken eggs was estimated at the farm level. The water footprint of eggs in a parent-stock layer breeder farm in China was therefore assessed in detail for the first time, and suggestions are put forward to reduce the egg water footprint from the perspective of the production chain and improving water use efficiency on the farm. The results show that (1) the green WF of eggs (water volume/egg weight) ranged from 1.917 to 2.114 m3/kg, the blue WF was 0.584 to 0.644 m3/kg and the grey WF was 0.488 to 0.538 m3/kg; (2) the indirect WF generated by feed contributed over 99.8% of the total; (3) eggs laid by Hy-line Brown hens have a lower WF than those from Hy-line Sonia hens, and the studied layer breeder farm had a higher WF than the global average based on the literature. In this paper, the variation of the WF was also analyzed, and some advice on water management for layer farms in China is provided.

1. Introduction

Global demand for livestock products is increasing with the growth of the world population, and the improvement of diets in developing countries is proving a challenge to the sustainable utilization of water resources. Livestock production has caused significant consumption and waste of limited freshwater, and this situation will continue in the future [1,2,3]. Water conservation in animal production is a critical issue for governments, producers and the public, which could be relieved by increasing animal production efficiency [4]. Economic development, contributing to the improvement of diets, tends to correspond to an increased demand for animal products, such as has occurred in China and Brazil [5,6]. In China, water consumption related to food production has maintained an upward tendency due to a dietary shift towards more water-intensive animal products [7]. Water conservation in animal production is crucial for water sustainability and animal agriculture.
A scientific approach is essential for the study of water consumption in animal products. The water footprint (WF) is a comprehensive indicator of freshwater resource appropriation, alongside the traditional and restricted measure of water withdrawal, which was introduced by Hoekstra and Hung [8]. WF assessment was developed by the Water Footprint Network (WFN), and accounts for the green water (the volume of rainwater), blue water (surface and groundwater) and grey water (the volume of freshwater that is required to assimilate the load of pollutants) footprint; assessment of the sustainability of the WF and identifying response strategies [9,10,11].
Much research in recent years has focused on the WF of animal products due to water assessment of the value chain of animal production, which concentrates on water saving. The high grey WF in swine production leads to environmental pollution [12,13], and in terms of dairy cows [14,15] and sheep [16,17], changing the composition of feed and shifting the production system can reduce the water footprint. It has become clear that livestock and poultry products significantly contribute to water degradation and water scarcity [18].
China’s freshwater resources are indirectly influenced by egg production. The production quantity of eggs in China was 31,338,856 tons in 2017 [19], and it is the largest contributor to global egg production, accounting for 29.2% of the global total [20]. China has a very limited per-capita water capability. The amount of water available per-capita is only one-quarter of the world’s average level [21]. China’s water resources are unevenly distributed, with severe water scarcity in the northern regions [22], and yet the main feed crops producing areas are in the north. As the consumption of animal products increases, it will cause greater water stress in northern China. However, information on how much water is consumed per kilogram of eggs produced, which should be estimated and given to the public and water resource managers, is still limited. The WF of animal products varies largely, due to differences in farming systems and the species of animals [12,23,24]. Research studies on assessing water use of different species of laying hens in a parent-stock layer breeder farm are scanty. The published literature had assessed the WF of eggs in China, but their assessment was based on global averages rather than data obtained directly from the farm. Research on the water footprint of egg production could help managers, producers and consumers understand water use in all aspects of the value chain, and implement targeted water-saving measures to promote the water efficiency of the entire layer sector. Therefore, more reasonable and scientific ways of reducing the WF of eggs need to be considered.
The main objective of this study is to quantify the WF of the egg production chain, assess the local impacts resulting from water consumption and the differences in the WF of eggs laid by two species of laying hens. This study assesses the water footprint of eggs in China for the first time. Suggestions are put forward to reduce the egg water footprint from the perspective of the production chain and improving water efficiency in the farm, and case studies are used to improve the understanding of water footprint assessment methodology based on the WFN.

2. Materials and Methods

2.1. Information on the Farm

In this study, the WFN methodology was used as a tool with the objectives of accounting and assessing the WF of Chinese eggs in the parent generation. The unit of analysis was egg production from 2 July 2017 to 19 June 2018 (44,221,169 eggs).
The analysis was conducted from a life cycle perspective, including the green, blue and grey WF of the most relevant processes in the production chain of eggs, from feed production to animal production (Figure 1). Some processes associated with egg production, such as constructing infrastructure and transportation of feed and chickens, contribute very little to the total WF, which justifies excluding them from the study.
The laying hen farm involved in this research is located in Handan County, Hebei province, China. There are three areas on the farm: the living, production and waste treatment areas. A total of 208,663 chickens were raised in seven houses in the production area, including 183,186 laying hens and 25,477 males. Because the volume of wastewater is not monitored on this farm, this data could not be obtained.
Hy-line Brown and Hy-line Sonia chickens are employed on this farm. Hy-line Brown chickens were used in house A, house B and house C. Hy-line Sonia chickens were used in house D, house E, house F and house G. All the chickens were the same age and exploited on the same day. The laying period of the chickens in the seven houses was 110 to 461 days old, 108 to 459 days old, 106 to 457 days old, 103 to 454 days old, 98 to 449 days old, 91 to 442 days old and 85 to 436 days old, respectively. Automatic feed delivery systems were provided to deliver commercial fodder to the chickens. Drinking water was available from the nipple drinkers. The eggs were collected daily using automatic belts and moved to the egg-sorting room, where they were packaged in trays and boxes. Manure was moved to the end of each house via automatic manure belts under the cages.
After the productive life of the chickens, they are exhausted and sold. The economic value is the allocation key of the chickens’ water footprint between eggs and chicken meat. The price of a breeding egg, one kilogram of female chicken and one kilogram of male chicken is 2 yuan RMB, 8.8 yuan RMB and 12 yuan RMB, respectively. The WF of eggs was corrected based on the economic value of the egg in this paper. The proportions of economic value of the eggs in the houses A to G are 95.7%, 95.5%, 96.5%, 95.3%, 95.3%, 96.3% and 95.2%, respectively.

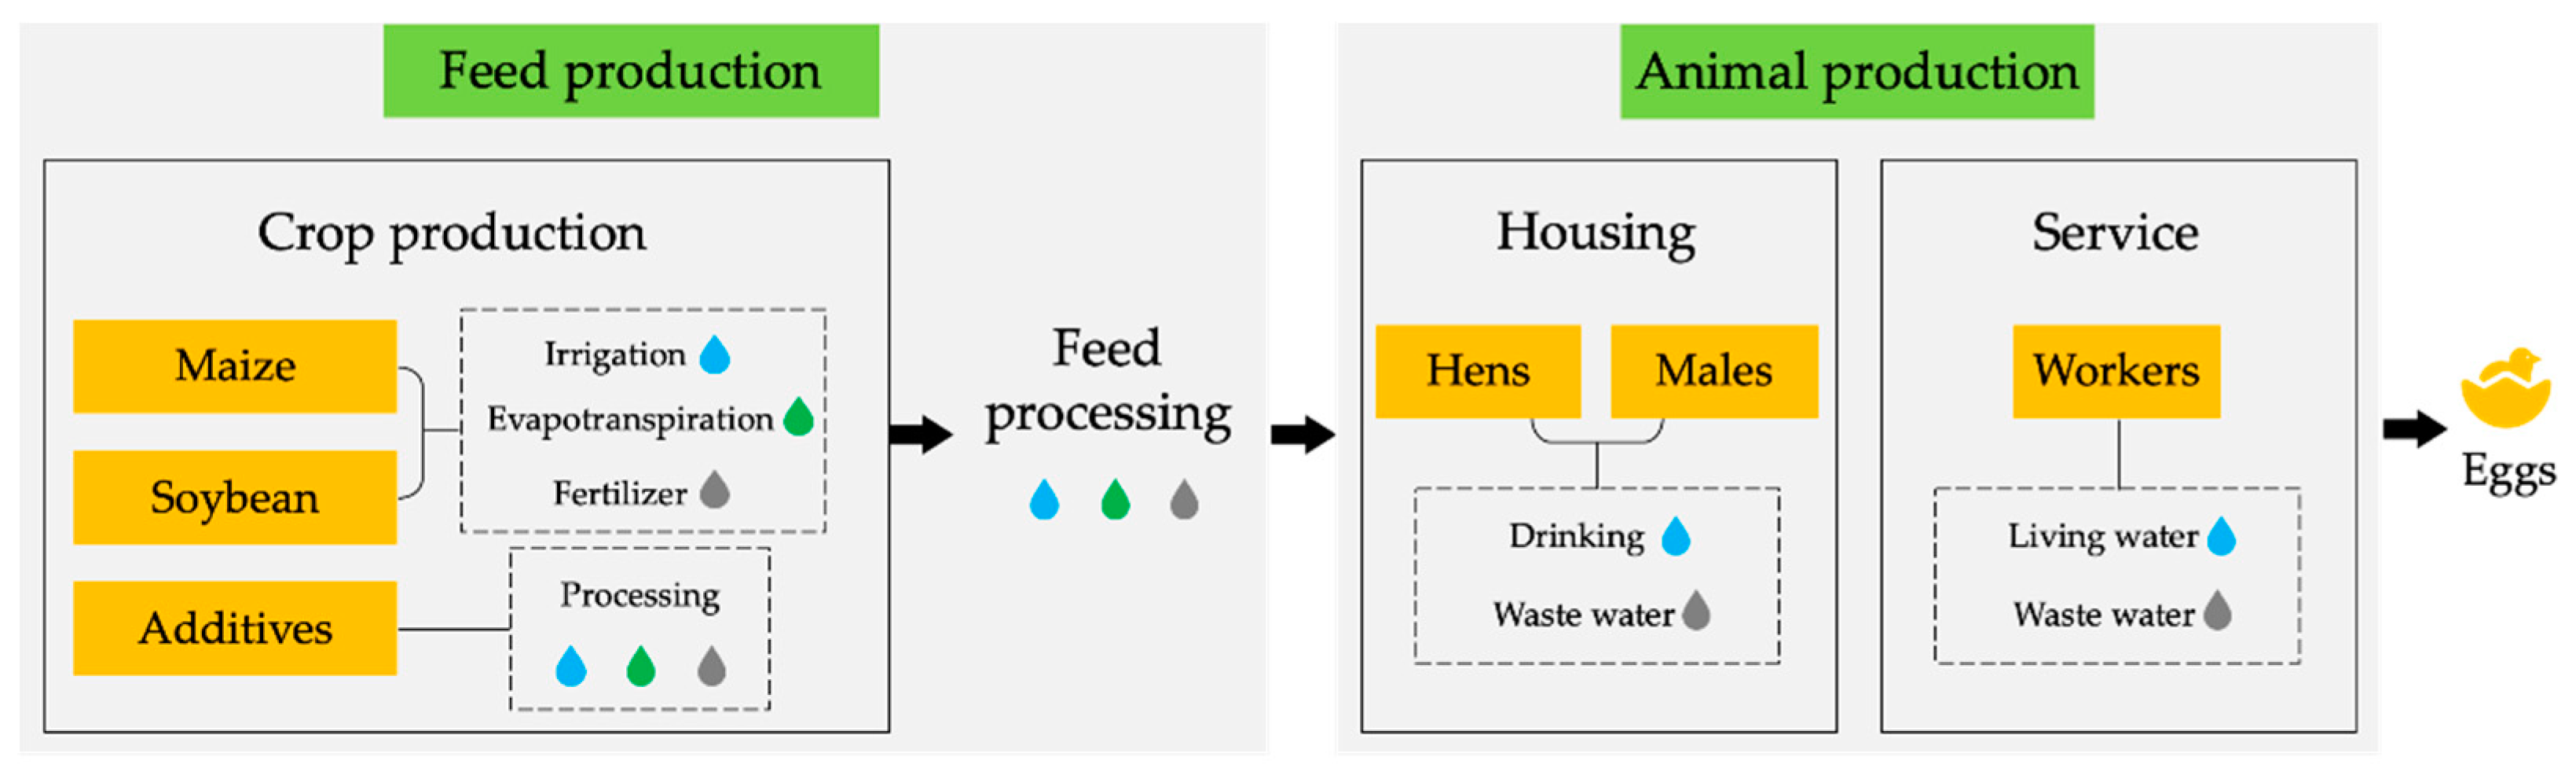
2.2. The Water Footprint Network Methodology

2.2.1. The Water Footprint of Eggs

The WF of an egg was estimated following the calculation framework developed by Mekonnen and Hoekstra [23]. The WF of an animal product is the total water use during the process of production, including the WF of feed, drink and services, and is calculated as follows:
WF   =   WF feed   +   WF drink   +   WF serv ,
where WFfeed, WFdrink and WFserv represent the WF of feed, drinking water and service water consumption of an animal, respectively. Service water includes water used to clean the chicken houses and sustain the living area.
The WF of feed consumed consists of the WF of all feed ingredients and the water used to mix the feed:
WF feed   =   p   =   1 n   ( Feed p   ×   WF prod )   +   WF mixing Pop ,
where Feedp represents the amount of feed ingredient p consumed by chickens during the period of egg production (ton/y), WFprod the WF of ingredient p (m3/ton), WFmixing the water used for mixing the feed for chickens (m3/y/animal) and Pop the number of egg-producing chickens in a year. In this study, the feed did not need to be mixed.
The calculation of WFdrink and WFserv is as follows:
WF prod [ o ]   =   s   =   1 k WF proc P ,
where WFproc is the process WF of drinking or service water (ton/y) and P is the production weight of eggs (ton/y).

2.2.2. Environmental Sustainability of the Water Footprint

The ‘green water availability’ (WAgreen) in a region x in a certain period t is defined as the total evapotranspiration of rainwater from the land (ETgreen) minus the evapotranspiration from land reserved for natural vegetation (ETenv) and minus the evapotranspiration from land that cannot be made productive:
WA green [ x , t ]   =   ET green [ x , t ]     ET env [ x , t ]     ET unprod [ x , t ]   [ volume / time ]
The variable ETenv is the ‘environmental green water requirement’ and refers to the quantity of green water used by natural vegetation in areas within the region that are to be reserved for nature, in order to preserve biodiversity and support human livelihoods that depend on the natural ecosystems. The variable ETunprod refers to evapotranspiration that cannot be made productive in crop production.
The level of green water scarcity in a region x in a period t is defined as the ratio of the total of green WFs in the region to the green water availability.
WS green [ x , t ]   =     WF green [ x , t ] WA green [ x , t ]
The ‘blue water scarcity’ in region x (WSblue) is defined as the ratio of the total of blue WFs in the region (ΣWFblue) to the blue water availability (WAblue):
WS blue [ x , t ]   =     WF blue [ x , t ] WA blue [ x , t ] .

2.3. Data Collection

In this study, the data needed for analysis were the basic data of the farm, hydrological data, and maize yield. The basic data of the farm includes the hen number, male number, sex ratio, beginning day old of chickens, laying period, feed intake, egg production, and total water consumption of houses, which was all obtained from the farm. The main data that were required to calculate the WF of eggs includes the feed intake, egg production and total water consumption. A water meter was installed in one house, and the drinking water and other water consumption were together classified as the total water consumption of each house. The hydrological data and maize yield were obtained from the 2018 Statistical Yearbook of Jilin and Hebei.

2.3.1. Basic Data of the Farm

The basic data of the farm were based on process data from bookkeeping data and dialogue with property managers. Table 1 show basic data for the farm.

2.3.2. Feed Intake

The WF of the feed is a major part of the total WF of animal products. The amount of water consumed by growing feed crops is a source of green water. Therefore, it is necessary to estimate the WF of the feed. Data on feed intake was obtained from bookkeeping data. The components of the feed were maize, soybeans and some additives (Table 2). The major WF is from maize and soybeans. Maize is produced in the north-eastern region of China (Jilin province). Data of the WF (blue, green and grey WF) of maize were obtained from a published paper [25], which assessed the WF of maize planted in the Jilin province of China. The WF of soybeans was taken from the literature which estimated the green, blue and grey WF of crop products [26]. The data on additives could not be obtained, including some nutrients such as salt and sodium bicarbonate, which were not considered.

2.3.3. Egg Production

The production quantity of animal products is a key part of estimating the WF of animal products. The egg production difference between Hy-line Brown and Hy-line Sonia chickens is not ignorable. Since the farm could only provide the quantity of egg production, the average weight of an egg laid by a Hy-line Brown was assumed to be 61.5 g [27], and of an egg laid by a Hy-line Sonia was 60.1 g [28] in this paper.

2.3.4. Water Consumption

The water consumption of the farm includes water use of the production area and living area. Chicken drinking and cleaning processes are in the production area, and daily water use of workers is in the living area. Each house has only one water meter, so drinking water and cleaning water were considered together in the data, which counted towards the overall water use of the production area.

3. Results

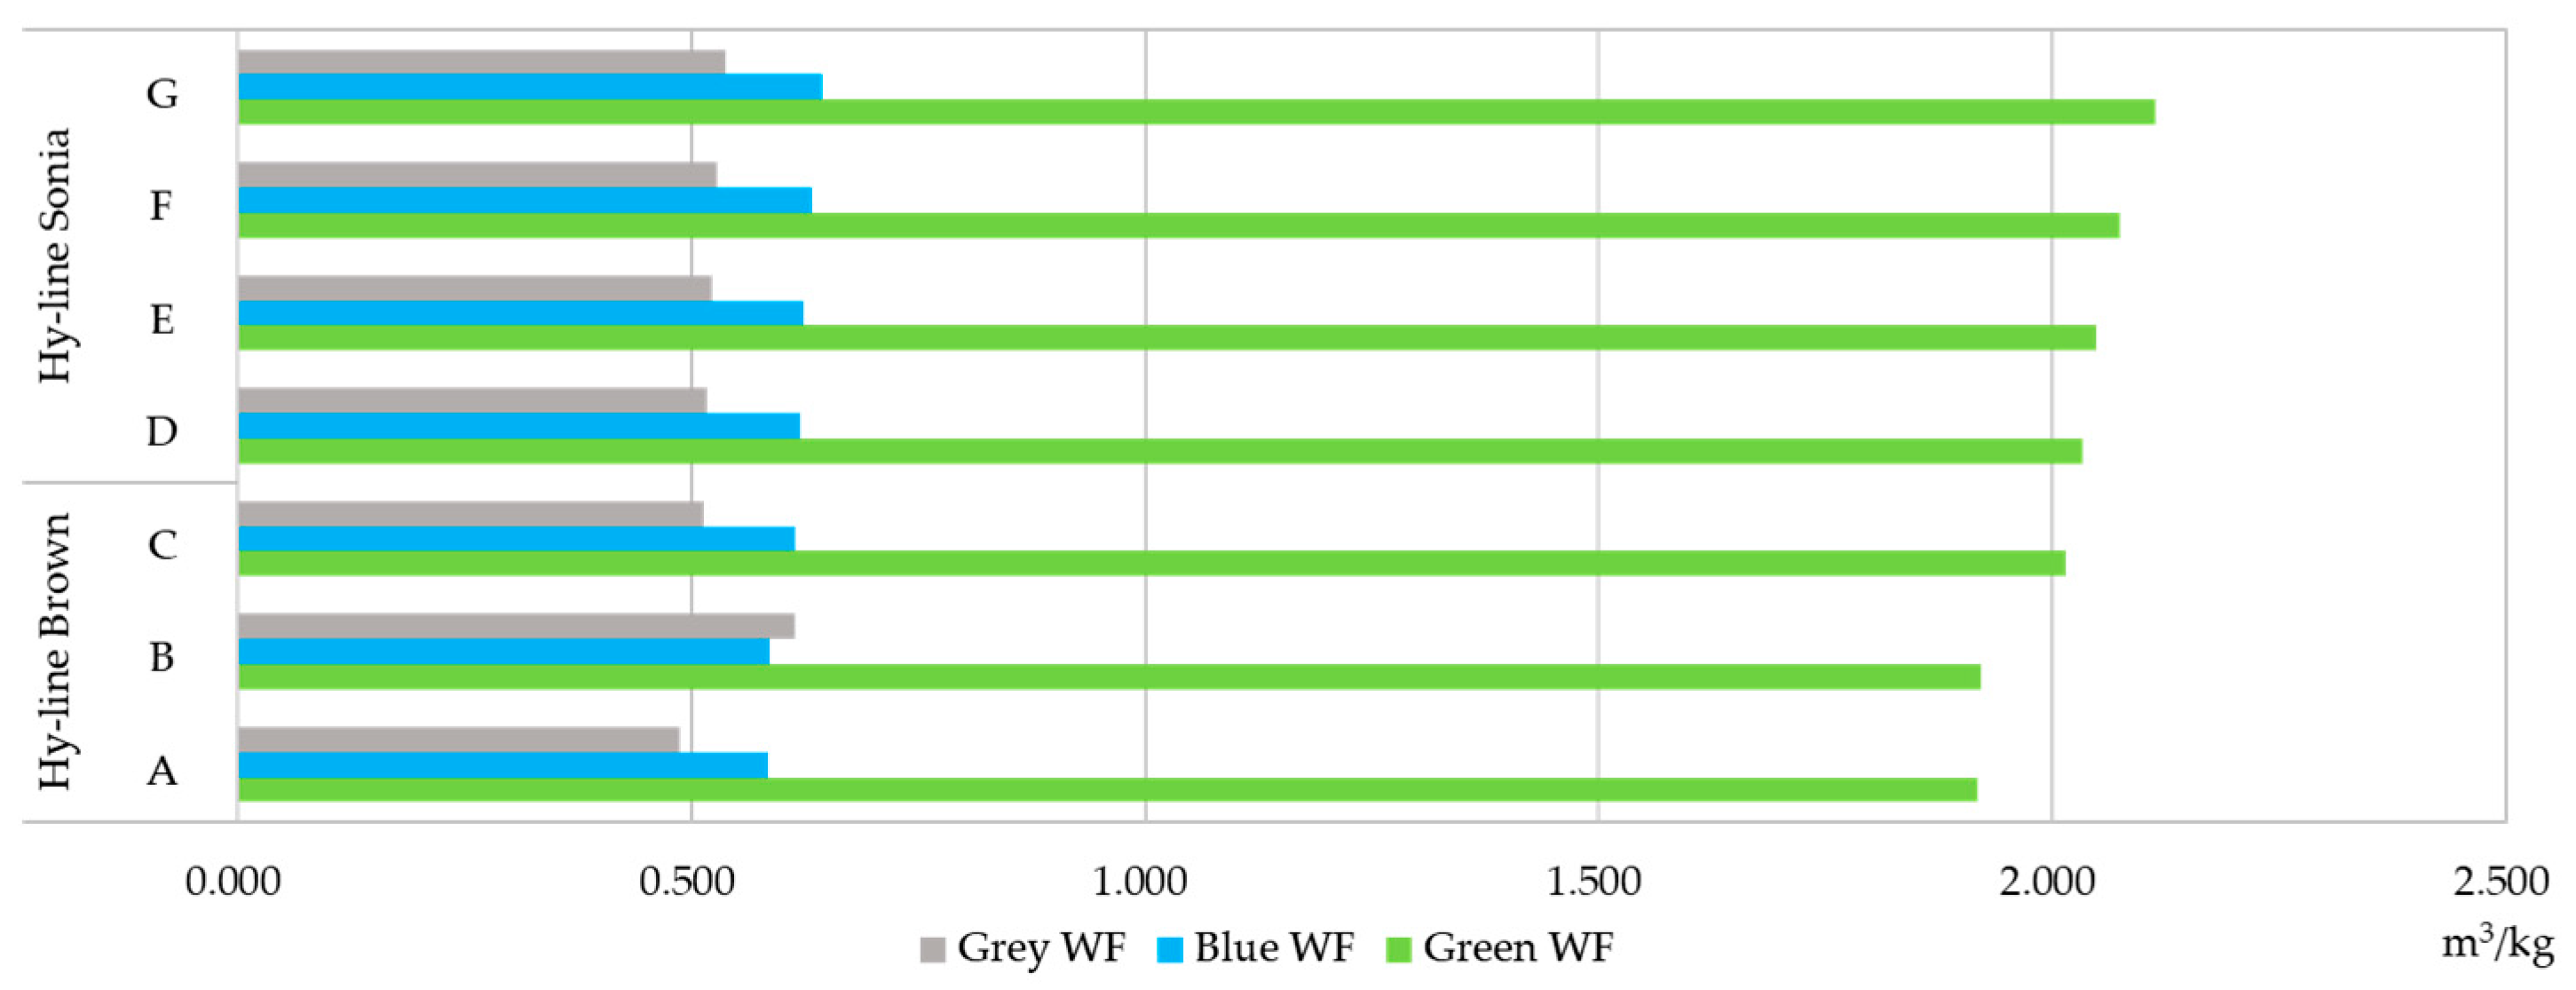
3.1. The Green, Blue and Grey Water of Eggs

3.1.1. Green Water

The green WFs and the consumption of main feed ingredients were presented in Table 3. Green water was consumed by feed. The average green WF of eggs was 2.018 m3/kg. Data in this table pointed out a variation of crop consumption from the two species of chickens. Maize and soybean produced in the house A had the greatest green water, followed by house F, house C and house G. The lowest green water of these crops was obtained with house D. Hy-line Brown chickens ate more feed than Hy-line Sonia chickens on average. However, the green WF was reversed. As can be seen, the green WF of eggs laid by Hy-line Brown hens (1.951 m3/kg) was lower than the eggs laid by Hy-line Sonia hens (2.068 m3/kg). It indicated that the production of one kilogram of eggs by Hy-line Sonia chickens required more consumption of feed.

3.1.2. Blue Water

Blue water includes water for farms (production and living areas) and water for irrigated feed crops. The water in the living area was divided into seven parts on average, which are accounted for in the total water consumption. As can be seen from Table 4, irrigation water accounted for the largest proportion, and this part of the water was still related to feed intake. The average blue WF of eggs was 0.615 m3/kg. House A had the greatest blue water, followed by house E and house D. It can be seen from the water consumption of the production area that differences of drinking water between the Hy-line Brown and Hy-line Sonia chickens were ignored. In fact, the blue WF of eggs laid by Hy-line Brown hens (0.595 m3/kg) was lower than the eggs laid by Hy-line Sonia hens (0.630 m3/kg). It indicated that the production of one kilogram of eggs by Hy-line Sonia chickens required more drinking water.

3.1.3. Grey Water

The unavailable sewage data of the farm was not analyzed. All of the grey water came from the feed in our study. As was shown in Table 5, the average grey WF of eggs was 0.531 m3/kg. The grey WF of eggs laid by Hy-line Brown hens (0.538 m3/kg) was higher than the eggs laid by Hy-line Sonia hens (0.526 m3/kg). It indicated that the production of one kilogram of eggs by a Hy-line Sonia chicken produced less pollution. Therefore, lower grey WF may not indicate less grey water. It was clear that due to the higher feed intake of Hy-line Brown, more grey water was produced during the growth of the feed crops.

3.2. The Total Water Use of Eggs

As mentioned previously, the aim of the study was to assess the WF of eggs at the farm level in China and compare the WF of eggs laid by two chicken species. According to Mekonnen and Hoekstra [23], the WF of eggs is lower than the other main animal products like pork, sheep meat and beef. In our study, the WF of eggs was estimated using the WFN method, a WF assessment modeling framework developed by Hoekstra [11].
The WF of eggs varies slightly from chicken house A to chicken house G, which can be partly explained from the different consumption levels of the feed and egg production of the two species of chickens. Figure 2 illustrated the green, blue and grey WFs of the eggs coming from the seven houses are different. The green WF accounted for the largest percentage of the total WF, which was consistent with the findings of other studies [12,13,14,16]. Eggs laid by Hy-line Brown chickens have a lower WF than that from Hy-line Sonia chickens on average.

3.3. Water Use of Two Species of Laying Hens

The differences between the water footprint of eggs produced by Hy-line Brown and Hy-line Sonia chickens were mainly caused by the lower egg production of the latter. The WF of eggs laid by Hy-line Sonia chickens was higher than Hy-line Brown chickens. Two factors contributed to this result. First, high death rates and easily increased stress levels resulted in the low egg production of Hy-line Sonia chickens. It was necessary to immunize the chickens, and laying hens got stressed or even died in this process, which reduced the overall egg production. Second, different ages between chickens on the date of entry resulted in a different time for laying eggs. Because the Hy-line Sonia chickens were younger than the Hy-line Brown chickens, the laying period of the Hy-line Sonia chickens was shorter. Due to the same culling time for all chickens, the Hy-line Sonia chickens therefore had a lower egg production than the Hy-line Brown chickens during the same period of time, which made the Hy-line Sonia’s egg WF higher. The same date of entry and reduced death rates of layers would increase the egg production during the laying period, and would reduce the WF of eggs from this breed.

3.4. Sustainability of the Water Footprint of Eggs

Maize, the main ingredient of the feed, is produced in Jilin Province. The blue WF of the farm was from the local area. A sustainability assessment of the green WF of the maize and the blue WF of the farm was required. It can be seen from Table 6 that the green WF of the maize producing area was sustainable, while the blue WF of the location of the farm is not sustainable. Due to low per capita water resources, it was still necessary to improve the water use efficiency of this farm.

4. Comparative Analysis between the Results and the Research Efforts around the World

This study highlighted the water use of egg production of two species of chickens at the farm level in China identified based on the WFN method. Three indicators (green, blue and grey WF) were compared with the results of research efforts around the world, and the limitations were analyzed.

4.1. The Water Footprint of Eggs

The results of this study can be compared with the results of the previous study. The first estimates made by Chapagain and Hoekstra [29] for the WF of eggs are very close to our results, although different in some aspects. As their study did not estimate the grey WF component, the green and blue WF can be compared between the two studies. They report a world average WF of eggs of 3.340 m3/kg, which is higher than our average estimate of 2.633 m3/kg. On the country level, they report a WF of 3.550 m3/kg in China, which is also higher than our results. The second study of the WF of eggs was a comprehensive publication with estimates of the WF of livestock and poultry products, with specifications for some major countries in the world, such as China, India, the USA, the Netherlands and the global average [23]. The data of these studies comes from FAOSTAT, and vary greatly from our estimates. In recent years, China has made progress in water conservation and in reducing the WF of animal products. However, in developed countries, such as the USA, the Netherlands and Japan, the WF of eggs is lower than that in China. Therefore, despite China’s progress in recent years, a big gap when compared to developed countries still persists (Figure 3).

4.1.1. The Green Water Footprint of Eggs

It was found that the green water footprint accounted for the largest percentage of the total water footprint, and was higher than that of the Netherlands and the USA. This indicated that the ratio of feed used in the farm is unreasonable, there was a waste of feed in the eating process of the chickens and the feed conversion efficiency was lower than in other countries. In addition, due to the larger dependence on concentrate feed in breeding chickens, this intensification of animal production systems will result in increasing blue and grey WFs per unit of animal product [23]. More pressure will be put on the freshwater and the environment of China due to the increasing consumption of eggs. The major composition of the feed used on the farm studied is maize, which was grown in the northeast of China. Under the context of climate change and water scarcity, a larger amount of water is required to grow maize. Therefore, producing feed crops in areas that are rich in green water resources is an opportunity for the rationalization of water use in egg production.
The production of animal products has an impact on the water resources of the planting area. The green WF of the maize planting area is sustainable. However, the maize in the feed used by the farm is planted in Jilin Province, which is the main planting area of maize. As the demand for animal products increases, it will lead to more water shortages in Jilin Province. On the one hand, agricultural water use efficiency should be improved. On the other hand, the production should be appropriately reduced and the planting area of maize should preferably be moved to relatively water-rich areas. Increasing the productivity of green water is crucial in order to achieve optimum production, and increased production based on green water resources reduces the need for production with blue water resources.

4.1.2. The Blue Water Footprint of Eggs

The percentage of blue WF is higher than in other countries, which indicate greater use of crops that are irrigated. In our research, blue water accounted for a large proportion of the overall footprint, indicating that a large amount of water is consumed in irrigation in China. Low agricultural water use efficiency leads to excessive irrigation water. It is necessary to reduce water use in growing feed crops and to find alternative feed ingredients with low WF. The production area consumed a small amount of water. The water resources consumed in the production area were related to the local water resources. Therefore, reducing water waste in the farm and improving the efficiency of water recycling can alleviate local water scarcity.
Hebei Province, where the farm is located, is an area that is extremely short of water. Water resources in the region are not sustainable. The proportion of agricultural production should be reduced, especially for animal products, and water scarcity should be improved by importing water-intensive products. Farms in this area should increase water use efficiency, reduce waste of water resources and increase investment in water-saving equipment.

4.1.3. The Grey Water Footprint of Eggs

In terms of grey WF, our estimates are higher than the Netherlands, USA and global average. This shows that too much fertilizer is used in the crop growing, making the grey WF higher indirectly. And the grey WF of eggs is larger due to the higher egg production of Hy-line Brown hens. The grey WF could not be reduced by increasing production efficiency. On the one hand, less fertilizer should be used in the process of growing feed crops. And on the other hand, it is of great necessity to increase the intensity of wastewater treatment.

4.2. Limitations of the Water Footprint Indicators

The green WF does not distinguish between the blue and green water consumed by crop growth. The green WF is mainly from rainwater, and this is part of the ecological environment. When the rainfall exceeds evapotranspiration, the excess water will enter the groundwater and flow into rivers, and the green water will be converted into blue water. Because the green WF accounts for the largest percentage of the total WF of animal products, it is necessary to address this issue.
The economic value of water resources should be reflected by the blue WF. A part of the blue WF of animal products comes from water use on the farm. Water use is closely related to the operating costs of a farm or company. The blue WF accounting and economic evaluation model should be combined, so that the blue WF indicator better serves the farm and company. The blue WF results were calculated without considering the local water scarcity where water is consumed. Therefore, the blue WF of different studies could not be compared. A high blue WF in a water abundant region might not be problematic while a relatively small blue WF in a water-scarce region might cause severe damage. Local water scarcity should be evaluated in the future research.
The grey WF is not the actual water consumption. Some farms discharge untreated sewage, in which case there is no grey water. Therefore, the method of grey WF assessment needs to be optimized according to the actual conditions of the farm.

5. Conclusions

This study firstly assessed the WF of the Chinese egg production system using farm-specific data. We showed that an average of 3.147 m3 of water is required to produce one ton of eggs in a parent-stock. The green WF of eggs ranged from 1.917 to 2.114 m3/kg, the blue WF was 0.584 to 0.644 m3/kg and the grey WF was 0.488 to 0.538 m3/kg. The vast majority of the WF of eggs came from an indirect WF, which was mainly caused by the cultivation of feed crops. The WF of feed represents 99.8% of the total volumetric WF of intensive egg production. In addition, the green WF accounts for the largest percentage of the total WF. This illustrated that water savings could be achieved by improving the water use efficiency of feed crops. Reducing the blue WF can be achieved by improving water management and adding water-saving equipment to the farm. Reducing dependence on fertilizers during the cultivation of feed crops can effectively reduce the grey WF. The WF assessment of egg production varied across chicken species, in that the eggs laid by Hy-line Sonia chickens had a higher WF. A same age at entry and a reduced death rate of layers could increase egg production during the laying period and reduce the WF of eggs in this breed. This research could be applied to other countries where has the same farming system and the species of chickens as our research.
For future research related to the WF of eggs, the following aspects should be considered. First, the WF of feed. The WF of crops can include an uncertainty factor of ±20%–30% [30]. Source of feed crops and feed compositions determine the WF of feed. Three compositions of feed were used during the period of egg production in this farm, however the details of only one could be obtained. The source of feed is another uncertainty since the WF of feed varies largely according to its origin. Second, a study on the quantitative analysis of the wastewater and the use of metals and antibiotics in poultry production needs to be carried out to provide basic data for the improved calculation of the grey WF. Finally, the WF of the transportation of the feed crops should be taken into account.

Author Contributions

Investigation, H.X.; methodology, H.X.; writing—original draft, H.X.; writing—review and editing, B.L., W.Z., Z.L. and Y.Z.

Funding

The study was supported by the China Agricultural Research System (CARS-40).

Acknowledgments

The study was supported by the China Agricultural Research System (CARS-40). We acknowledge the manager and staff of Hebei Huayu Poultry Breeding Co. Ltd., Handan, Hebei, China. Help and support from colleagues at the department during the project are also appreciated.

Conflicts of Interest

The authors declare no conflict of interest.

References

  1. De Vries, M.; de Boer, I.J.M. Comparing environmental impacts for livestock products: A review of life cycle assessments. Livest. Sci. 2010, 128, 1–11. [Google Scholar] [CrossRef]
  2. Notarnicola, B.; Hayashi, K.; Curran, M.A.; Huisingh, D. Progress in working towards a more sustainable agri-food industry. J. Clean. Prod. 2012, 28, 1–8. [Google Scholar] [CrossRef]
  3. Steinfeld, H.; Gerber, P.; Wassenaar, T.; Castel, V.; Rosales, M.; de Haan, C. Livestock’s Long Shadow-Environmental Issues and Options; FAO Agriculture Technical Paper; FAO: Rome, Italy, 2015. [Google Scholar]
  4. Mekonnen, M.M.; Neale, C.M.U.; Ray, C.; Erickson, G.E.; Hoekstra, A.Y. Water productivity in meat and milk production in the US from 1960 to 2016. Environ. Int. 2019, 132, 105084. [Google Scholar] [CrossRef] [PubMed]
  5. Gerbens-Leenes, P.W.; Nonhebel, S.; Krol, M.S. Food consumption patterns and economic growth. Increasing affluence and the use of natural resources. Appetite 2010, 55, 597–608. [Google Scholar] [CrossRef]
  6. Liu, J.; Savenije, H.H.G. Food consumption patterns and their effect on water requirement in China. Hydrol. Earth Syst. Sci. 2008, 12, 887–898. [Google Scholar] [CrossRef]
  7. Cai, B.M.; Liu, B.B.; Zhang, B. Evolution of Chinese urban household’s water footprint. J. Clean. Prod. 2019, 208, 1–10. [Google Scholar] [CrossRef]
  8. Hoekstra, A.Y.; Hung, P.Q. Virtual Water Trade: A Quantification of Virtual Water Flows between Nations in Relation to International Crop Trade; Value of Water Research Report Series No 11; UNESCO-IHE: Delft, The Netherlands, 2002. [Google Scholar]
  9. Murphy, E.; de Boer, I.J.M.; van Middelaar, C.E.; Holden, N.M.; Shalloo, L.; Curran, T.P.; Upton, J. Water footprinting of dairy farming in Ireland. J. Clean. Prod. 2017, 140, 547–555. [Google Scholar] [CrossRef]
  10. Munro, S.A.; Fraser, G.C.G.; Snowball, J.D.; Pahlow, M. Water footprint assessment of citrus production in South Africa: A case study of the Lower Sundays River Valley. J. Clean. Prod. 2016, 135, 668–678. [Google Scholar] [CrossRef]
  11. Hoekstra, A.Y.; Chapagain, A.K.; Mekonnen, M.M.; Aldaya, M.M. The Water Footprint Assessment Manual: Setting the Global Standard; Routledge: London, UK, 2011. [Google Scholar]
  12. De Miguel, Á.; Hoekstra, A.Y.; García-Calvo, E. Sustainability of the water footprint of the Spanish pork industry. Ecol. Indic. 2015, 57, 465–474. [Google Scholar] [CrossRef]
  13. Bai, X.; Ren, X.; Khanna, N.Z.; Zhang, G.; Zhou, N.; Bai, Y.; Hu, M. A comparative study of a full value-chain water footprint assessment using two international standards at a large-scale hog farm in China. J. Clean. Prod. 2018, 176, 557–565. [Google Scholar] [CrossRef]
  14. Noya, I.; Gonzalez-Garcia, S.; Berzosa, J.; Baucells, F.; Feijoo, G.; Moreira, M.T. Environmental and water sustainability of milk production in Northeast Spain. Sci. Total Environ. 2018, 616–617, 1317–1329. [Google Scholar] [CrossRef] [PubMed]
  15. Lu, Y.; Payen, S.; Ledgard, S.; Luo, J.; Ma, L.; Zhang, X. Components of feed affecting water footprint of feedlot dairy farm systems in Northern China. J. Clean. Prod. 2018, 183, 208–219. [Google Scholar] [CrossRef]
  16. Ibidhi, R.; Ben Salem, H. Water footprint assessment of sheep farming systems based on farm survey data. Animal 2019, 13, 407–416. [Google Scholar] [CrossRef] [PubMed]
  17. Ibidhi, R.; Frija, A.; Jaouad, M.; Ben Salem, H. Typology analysis of sheep production, feeding systems and farmers strategies for livestock watering in Tunisia. Small Rumin. Res. 2018, 160, 44–53. [Google Scholar] [CrossRef]
  18. Hoekstra, A.Y. Water for animal products: A blind spot in water policy. Environ. Res. Lett. 2014, 9, 091003. [Google Scholar] [CrossRef]
  19. FAO. FAOSTAT On-Line Database. Available online: http://faostat.fao.org (accessed on 15 November 2019).
  20. FAO. FAO Statistical Yearbook: World Food and Agriculture; FAO: Rome, Italy, 2013. [Google Scholar]
  21. Dong, H.J.; Geng, Y.; Fujita, T.; Fujii, M.; Hao, D.; Yu, X.M. Uncovering regional disparity of China’s water footprint and inter-provincial virtual water flows. Sci. Total Environ. 2014, 500, 120–130. [Google Scholar] [CrossRef]
  22. Chu, C.; Ritter, W.; Sun, X.H. Spatial variances of water-energy nexus in China and its implications for provincial resource interdependence. Energy Policy 2019, 125, 487–502. [Google Scholar] [CrossRef]
  23. Mekonnen, M.M.; Hoekstra, A.Y. A global assessment of the water footprint of farm animal products. Ecosystems 2012, 15, 401–415. [Google Scholar] [CrossRef]
  24. Toro-Mujica, P.; Aguilar, C.; Vera, R.; Cornejo, K. A simulation-based approach for evaluating the effects of farm type, management, and rainfall on the water footprint of sheep grazing systems in a semi-arid environment. Agric. Syst. 2016, 148, 75–85. [Google Scholar] [CrossRef]
  25. Duan, P.L.; Qin, L.J.; Wang, Y.Q.; He, H.S. Spatial pattern characteristics of water footprint for maize production in Northeast China. J. Sci. Food Agric. 2016, 96, 561–568. [Google Scholar] [CrossRef]
  26. Mekonnen, M.M.; Hoekstra, A.Y. The green, blue and grey water footprint of crops and derived crop products. Hydrol. Earth Syst. Sci. 2011, 15, 1577–1600. [Google Scholar] [CrossRef]
  27. Brown, H.-L. Hy-Line Brown Parent Stock Management Guides. Available online: https://www.hyline.com/userdocs/pages/BRN_PS_ENG.pdf (accessed on 16 January 2019).
  28. Sonia, H.-L. Hy-Line Sonia Parent Stock Management Guides. Available online: https://www.hyline.com/userdocs/pages/SO_PS_ENG.pdf (accessed on 16 January 2019).
  29. Chapagain, A.K.; Hoekstra, A.Y. Water Footprints of Nations; UNESCO-IHE Institute for Water Education: Delft, The Netherlands, 2004. [Google Scholar]
  30. Zhuo, L.; Mekonnen, M.M.; Hoekstra, A.Y. Sensitivity and uncertainty in crop water footprint accounting: A case study for the Yellow River basin. Hydrol. Earth Syst. Sci. 2014, 18, 2219–2234. [Google Scholar] [CrossRef] [Green Version]
Figure 1. System boundaries and water footprint (WF) components of egg production.
Water 11 02546 g001
Figure 2. The proportion of green, blue and grey WFs.
Water 11 02546 g002
Figure 3. Comparison of our estimates of the average WF of eggs at the farm level and Mekonnen and Hoekstra’s (2012) estimates at the country level.
Water 11 02546 g003
Table 1. Basic data of the farm.
ABCDEFG
Hy-line BrownHy-line Sonia
Hen number27,90027,90020,70527,92027,90722,87527,979
Male number3890381131563957384530163802
Sex ratioMale:female = 1:10
Beginning day old (days)110108106103989185
Laying period (days)352
Egg production (unit)6,767,2306,459,1506,302,0516,141,3636,189,8446,306,2056,055,326
Table 2. Composition of the commercial feed.
Component%(w/w)
Maize62
Soybeans24.8
Additives13.2
Table 3. Green water footprints of the seven chicken houses.
ABCDEFG
Hy-line BrownHy-line Sonia
Green water
Maize (kg)680,743652,381661,004643,346652,386667,249659,575
Soybean (kg)272,080260,745264,191257,133260,747266,687263,620
Green WF (m3/kg)1.9171.9212.0152.0342.0482.0752.114
Table 4. Blue water footprints of the seven chicken houses.
ABCDEFG
Hy-line BrownHy-line Sonia
Production area (t)1810177417771778179417731770
Living area (t)1274
Irrigation (t)251,785241,294237,953244,484241,296246,794243,955
Blue WF (m3/kg)0.5840.5860.6140.6190.6240.6320.644
Table 5. Grey water footprints of the seven chicken houses.
ABCDEFG
Hy-line BrownHy-line Sonia
Maize (t)171,384164,243161,969166,414164,245167,987166,054
Soybean (t)40,85339,15138,60938,60939,15140,04339,583
Grey WF (m3/kg)0.4880.4890.5130.5170.5220.5280.538
Total WF (m3/kg)2.9892.9963.1423.1713.1933.2363.296
Table 6. Data on the sustainability assessment.
Green Water ScarcityBlue Water ScarcityWater Resource per Capita in Jilin (m3)Water Resource per Capita in Hebei (m3)
69.0%111.1%1447.33184.53
A green and blue water scarcity of 100% means that the available green and blue water has been fully consumed. Scarcity values beyond 100% are not sustainable.

