Analysis of 15N-NO3− Via Anoxic Slurries Coupled to MIMS Analysis: An Application to Estimate Nitrification by Burrowing Macrofauna


 ,
,  ,
,  and
and
Abstract
:1. Introduction
2. Materials and Methods
2.1. Slurry Concentration Series
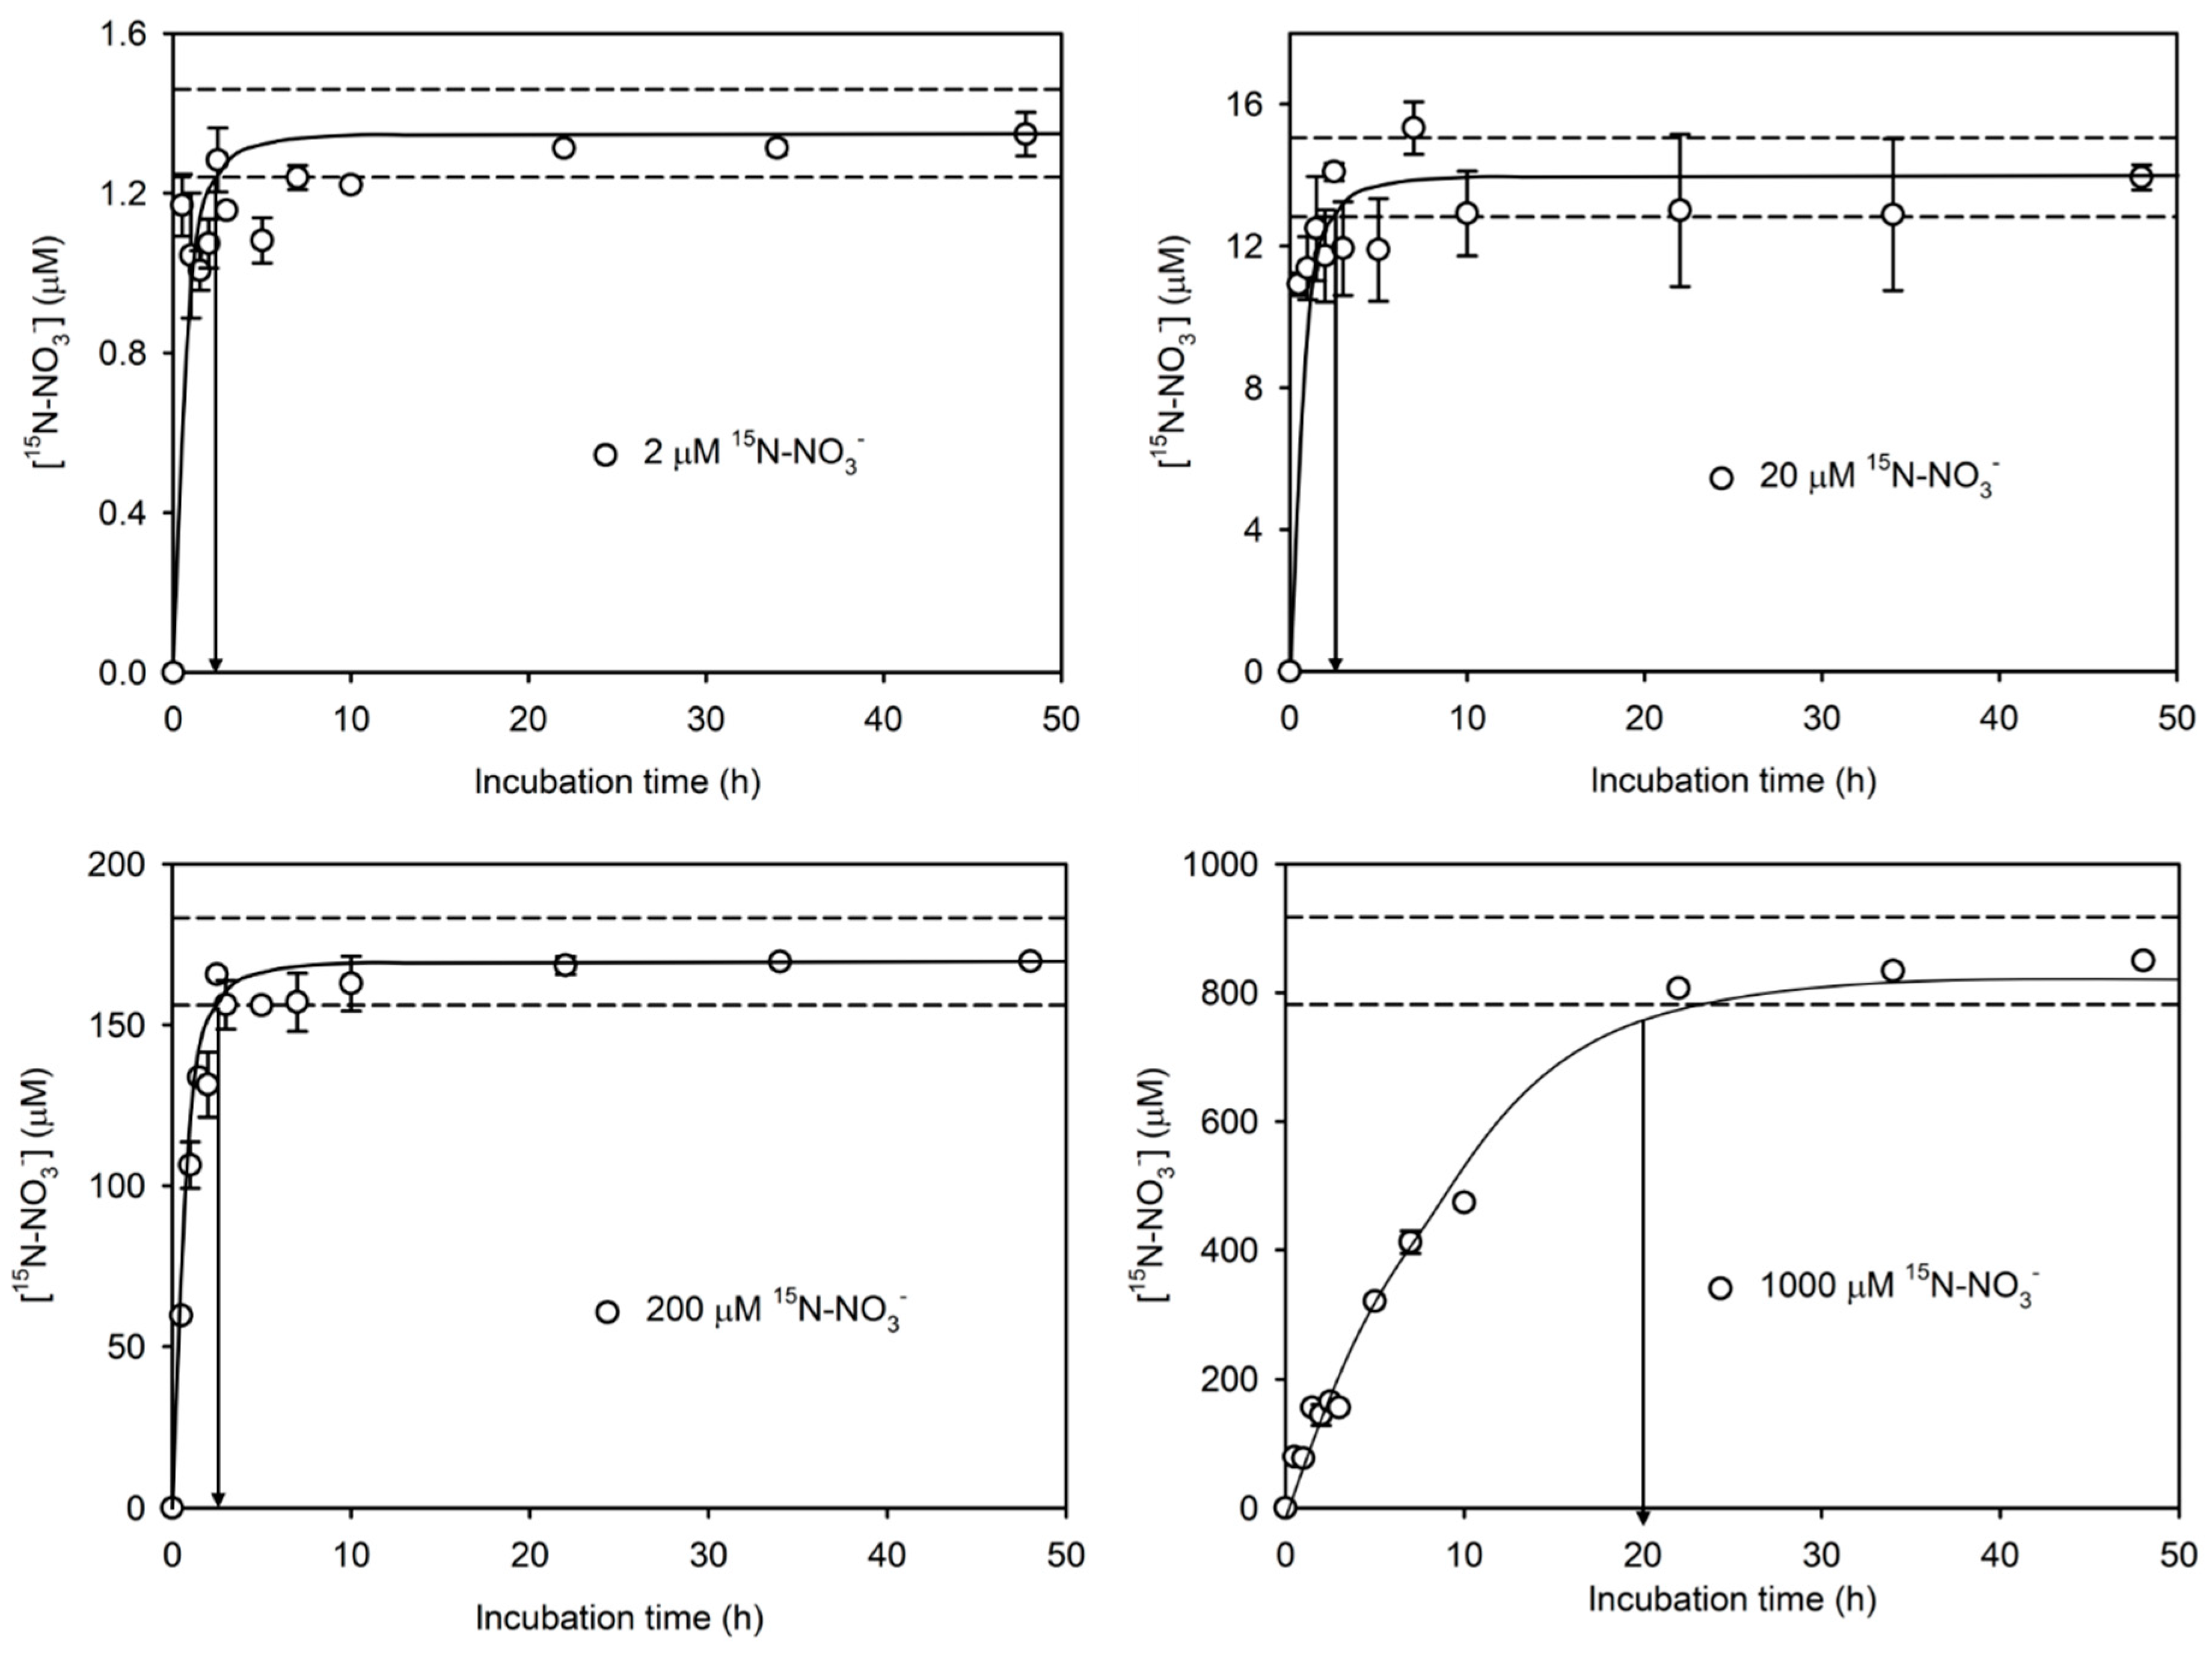
2.2. Time Series Experiment
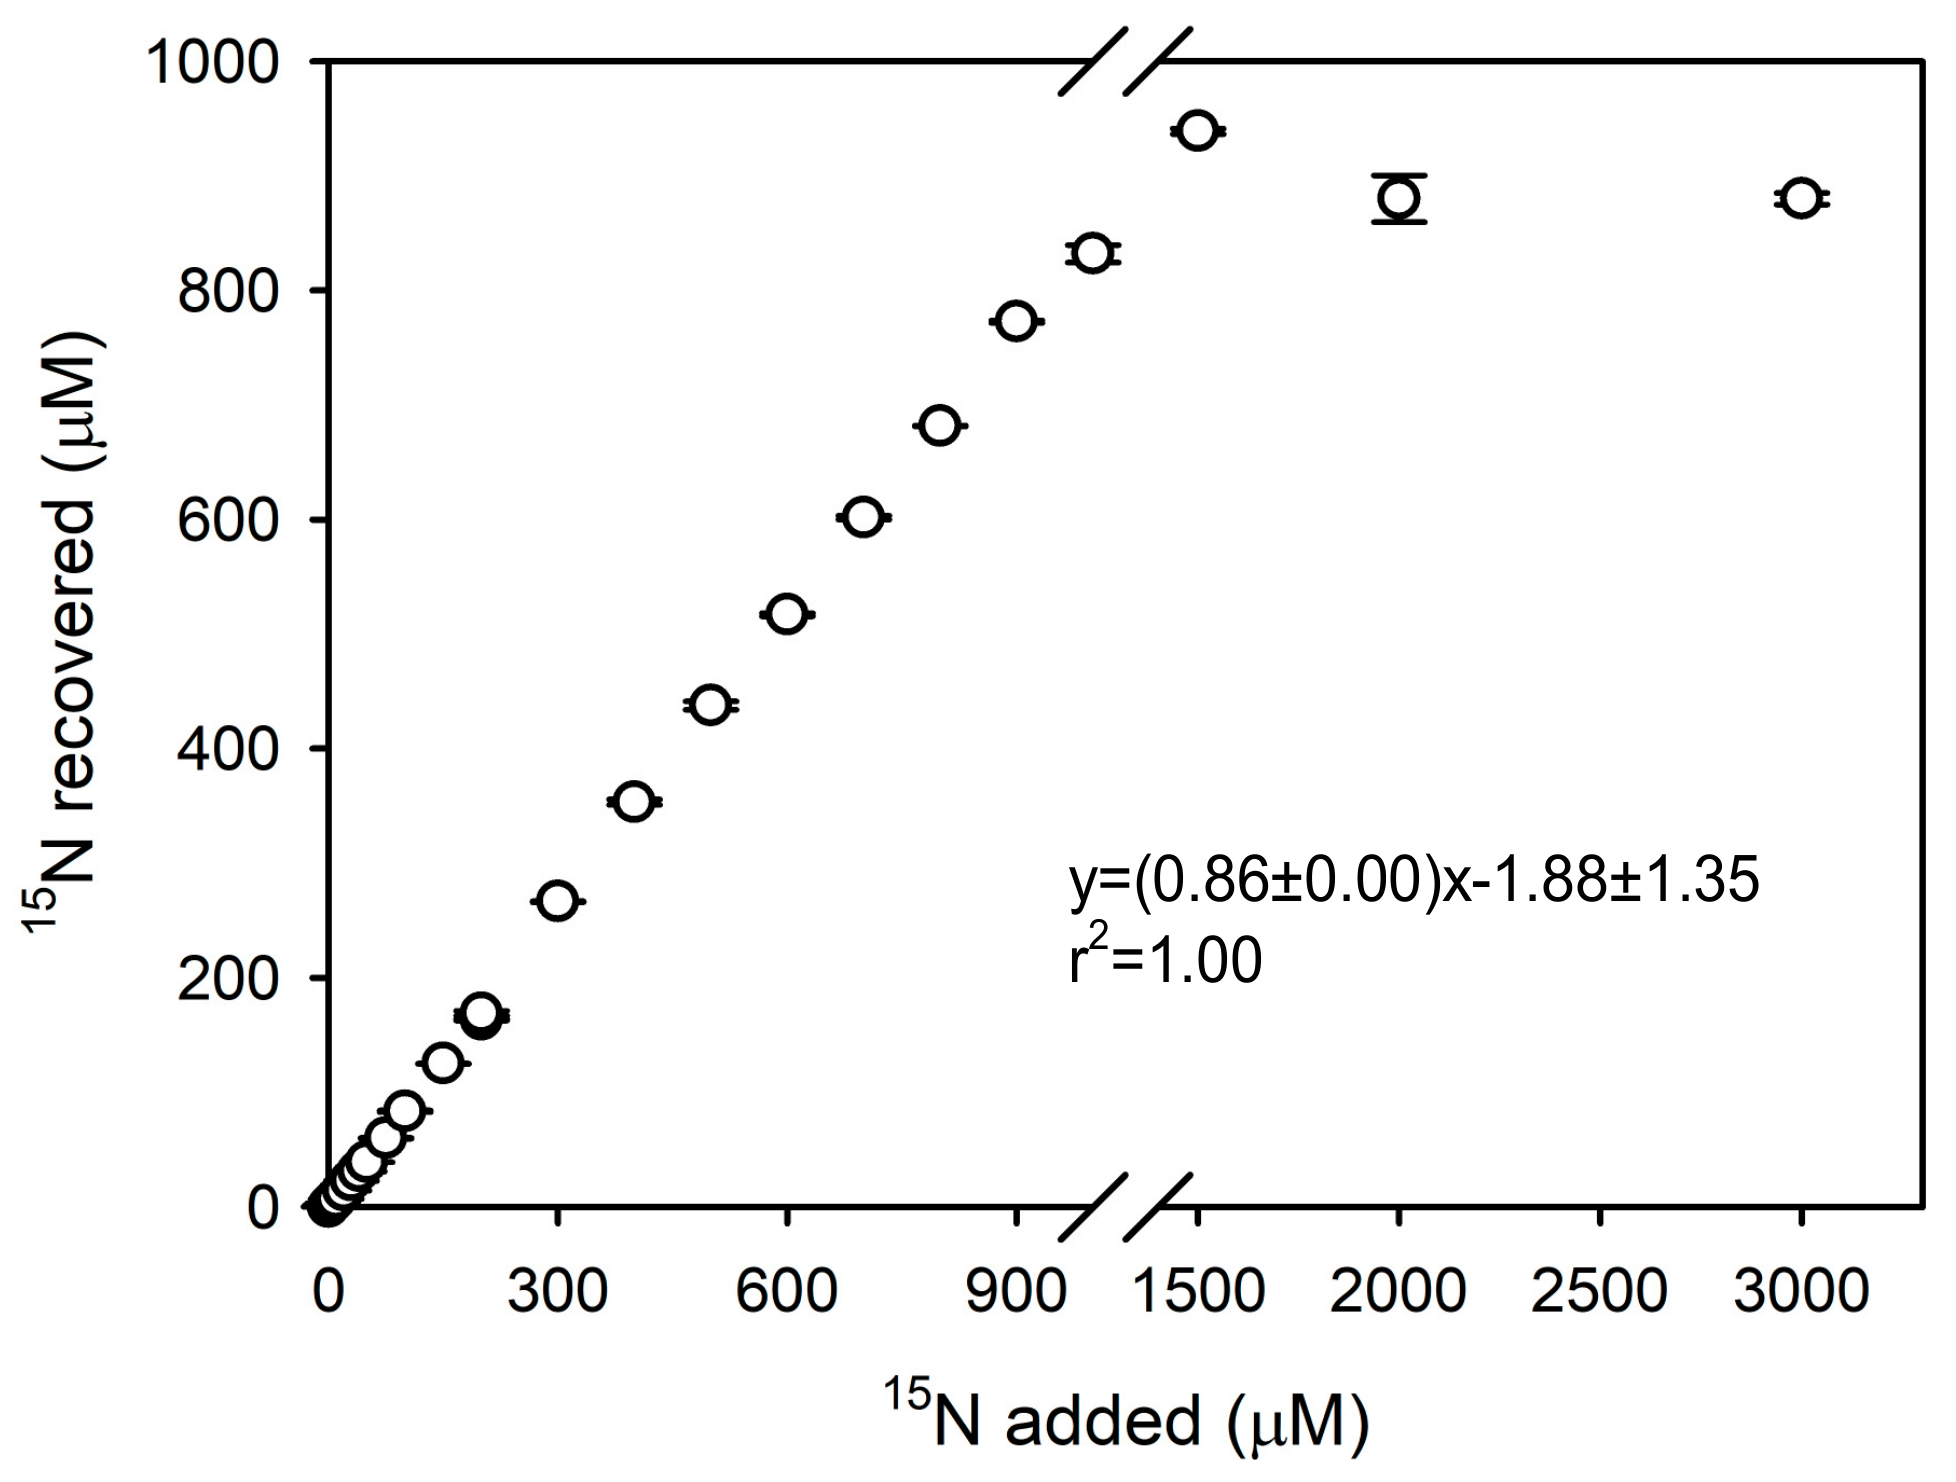
2.3. Concentration Series Experiment
2.4. Quantification of Labelled and Unlabeled N-NO3−
2.5. Anammox Assay
2.6. Calculations
2.7. Application of the Method to a 15N-NO3− Dilution Experiment to Measure Nitrification Rates in Bioturbated Sediments
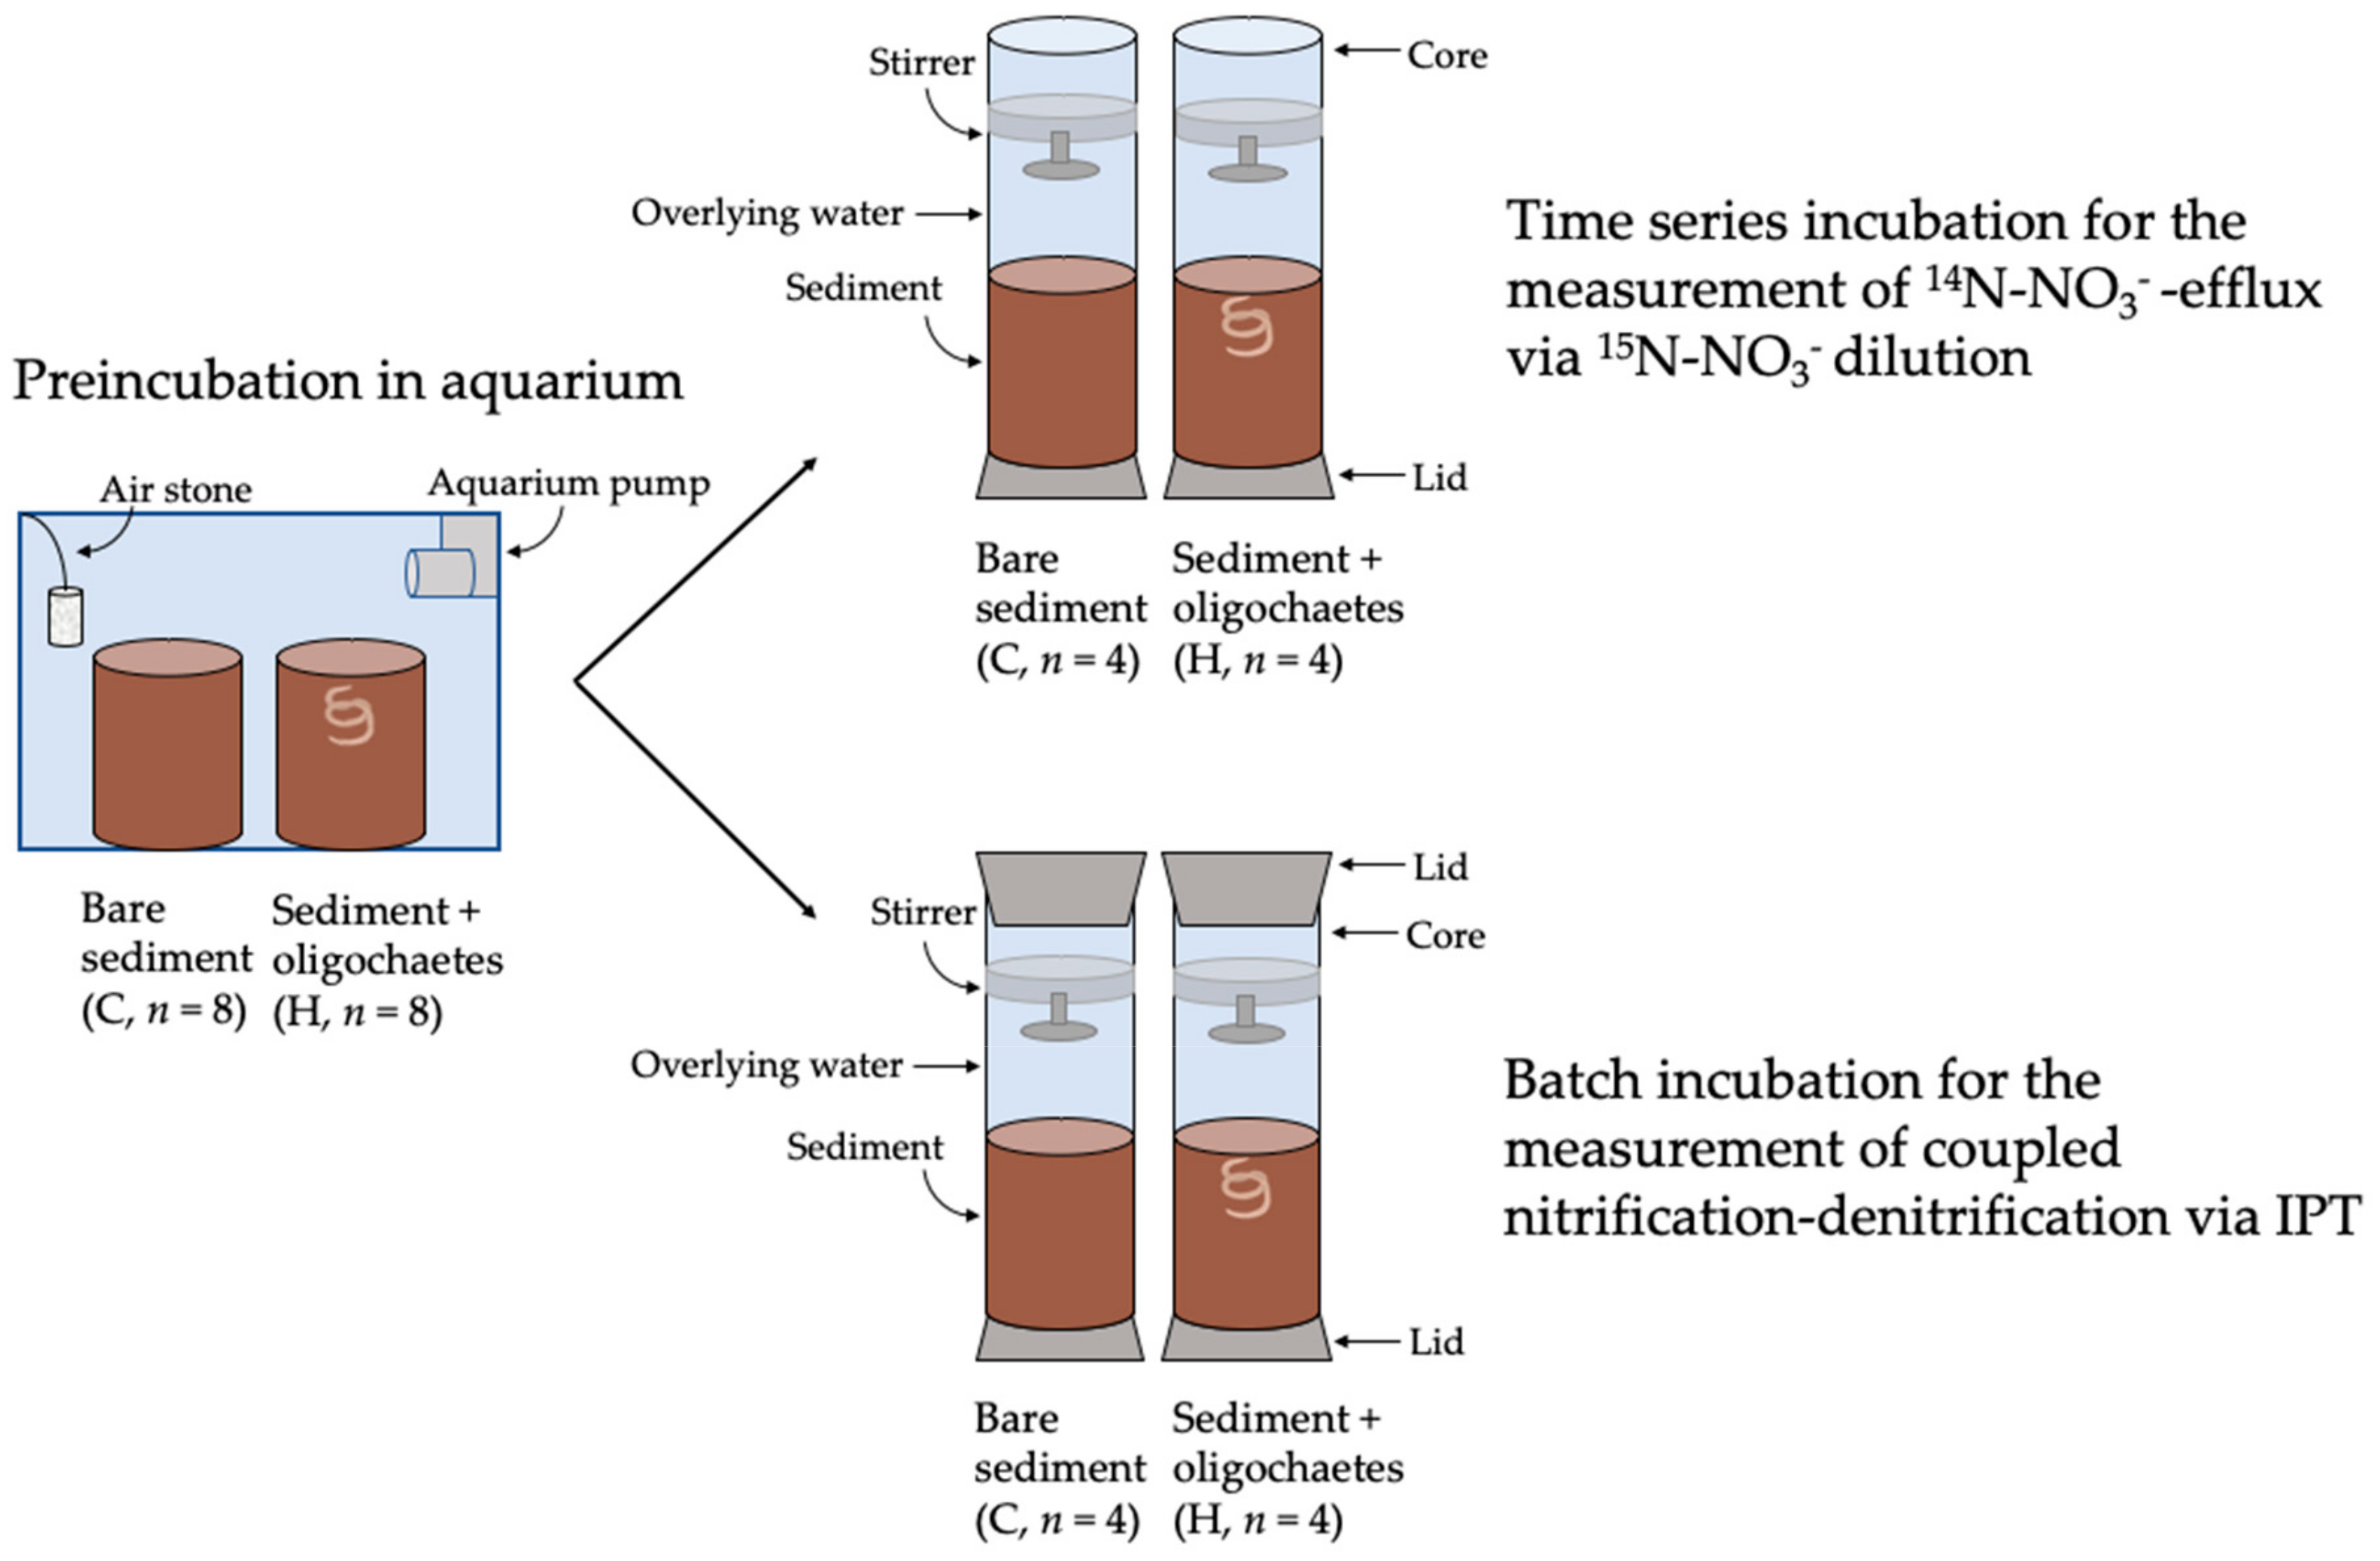
2.7.1. Microcosm Set Up and Incubation
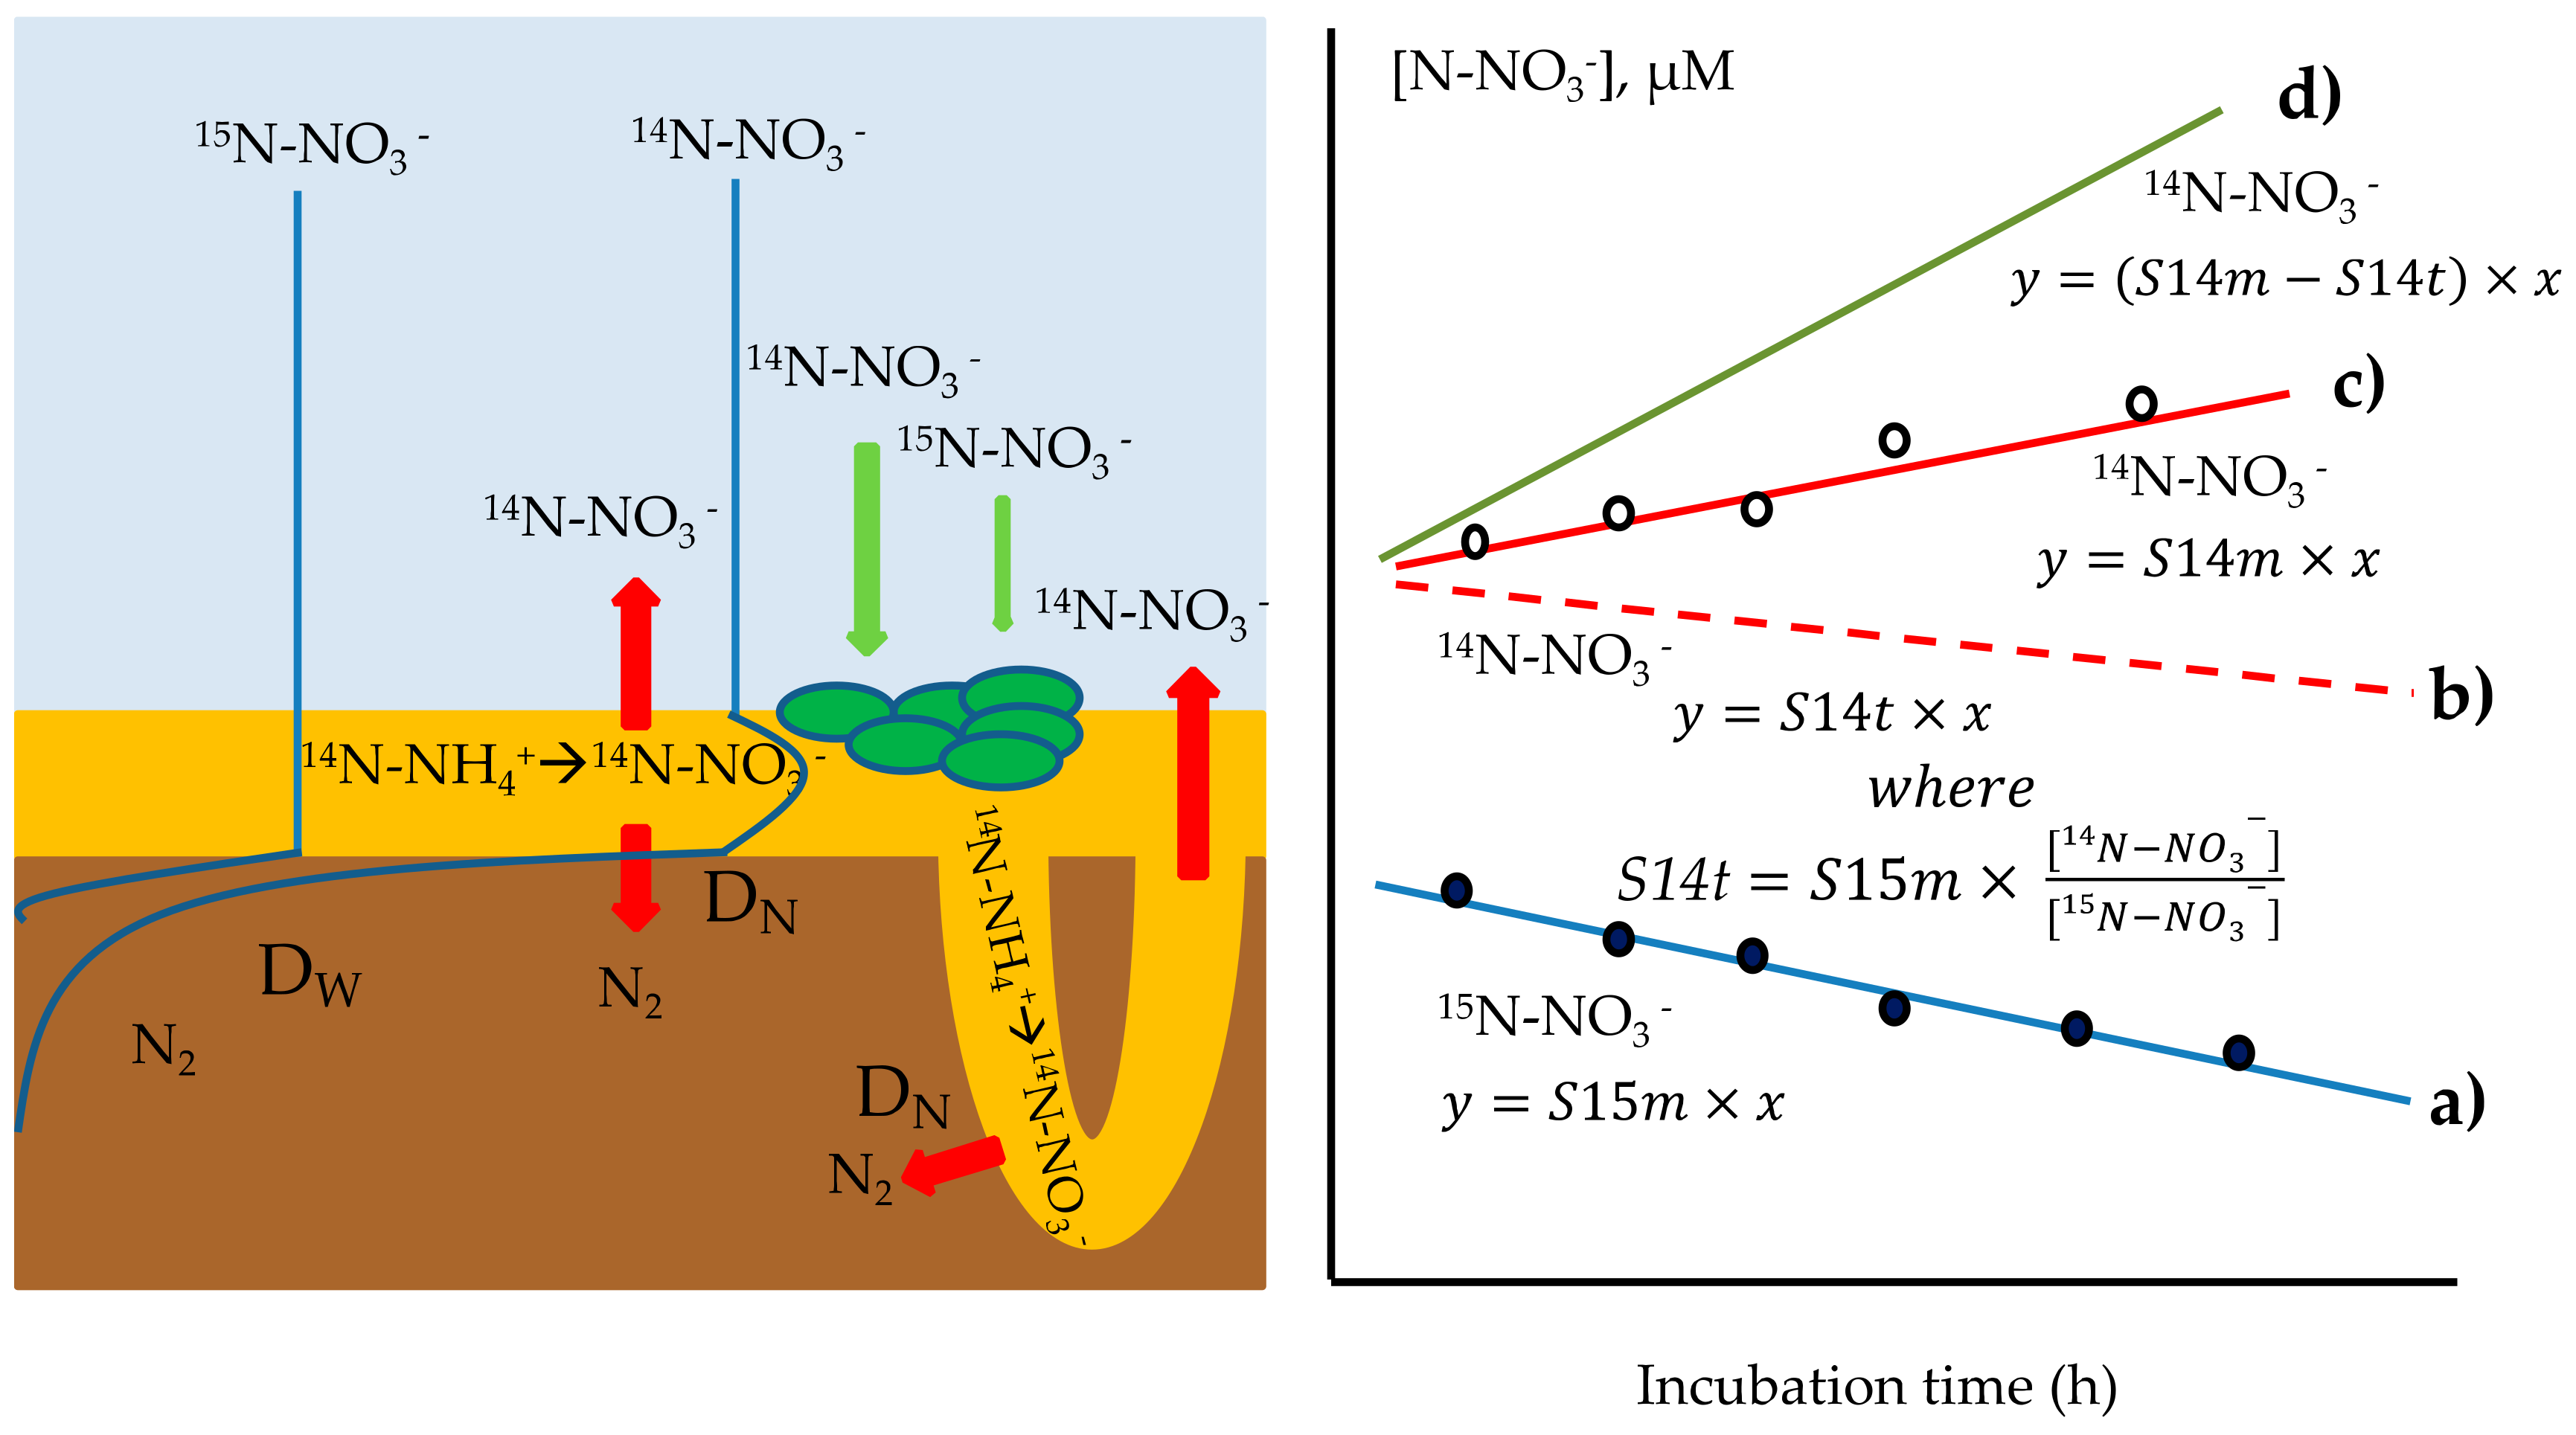
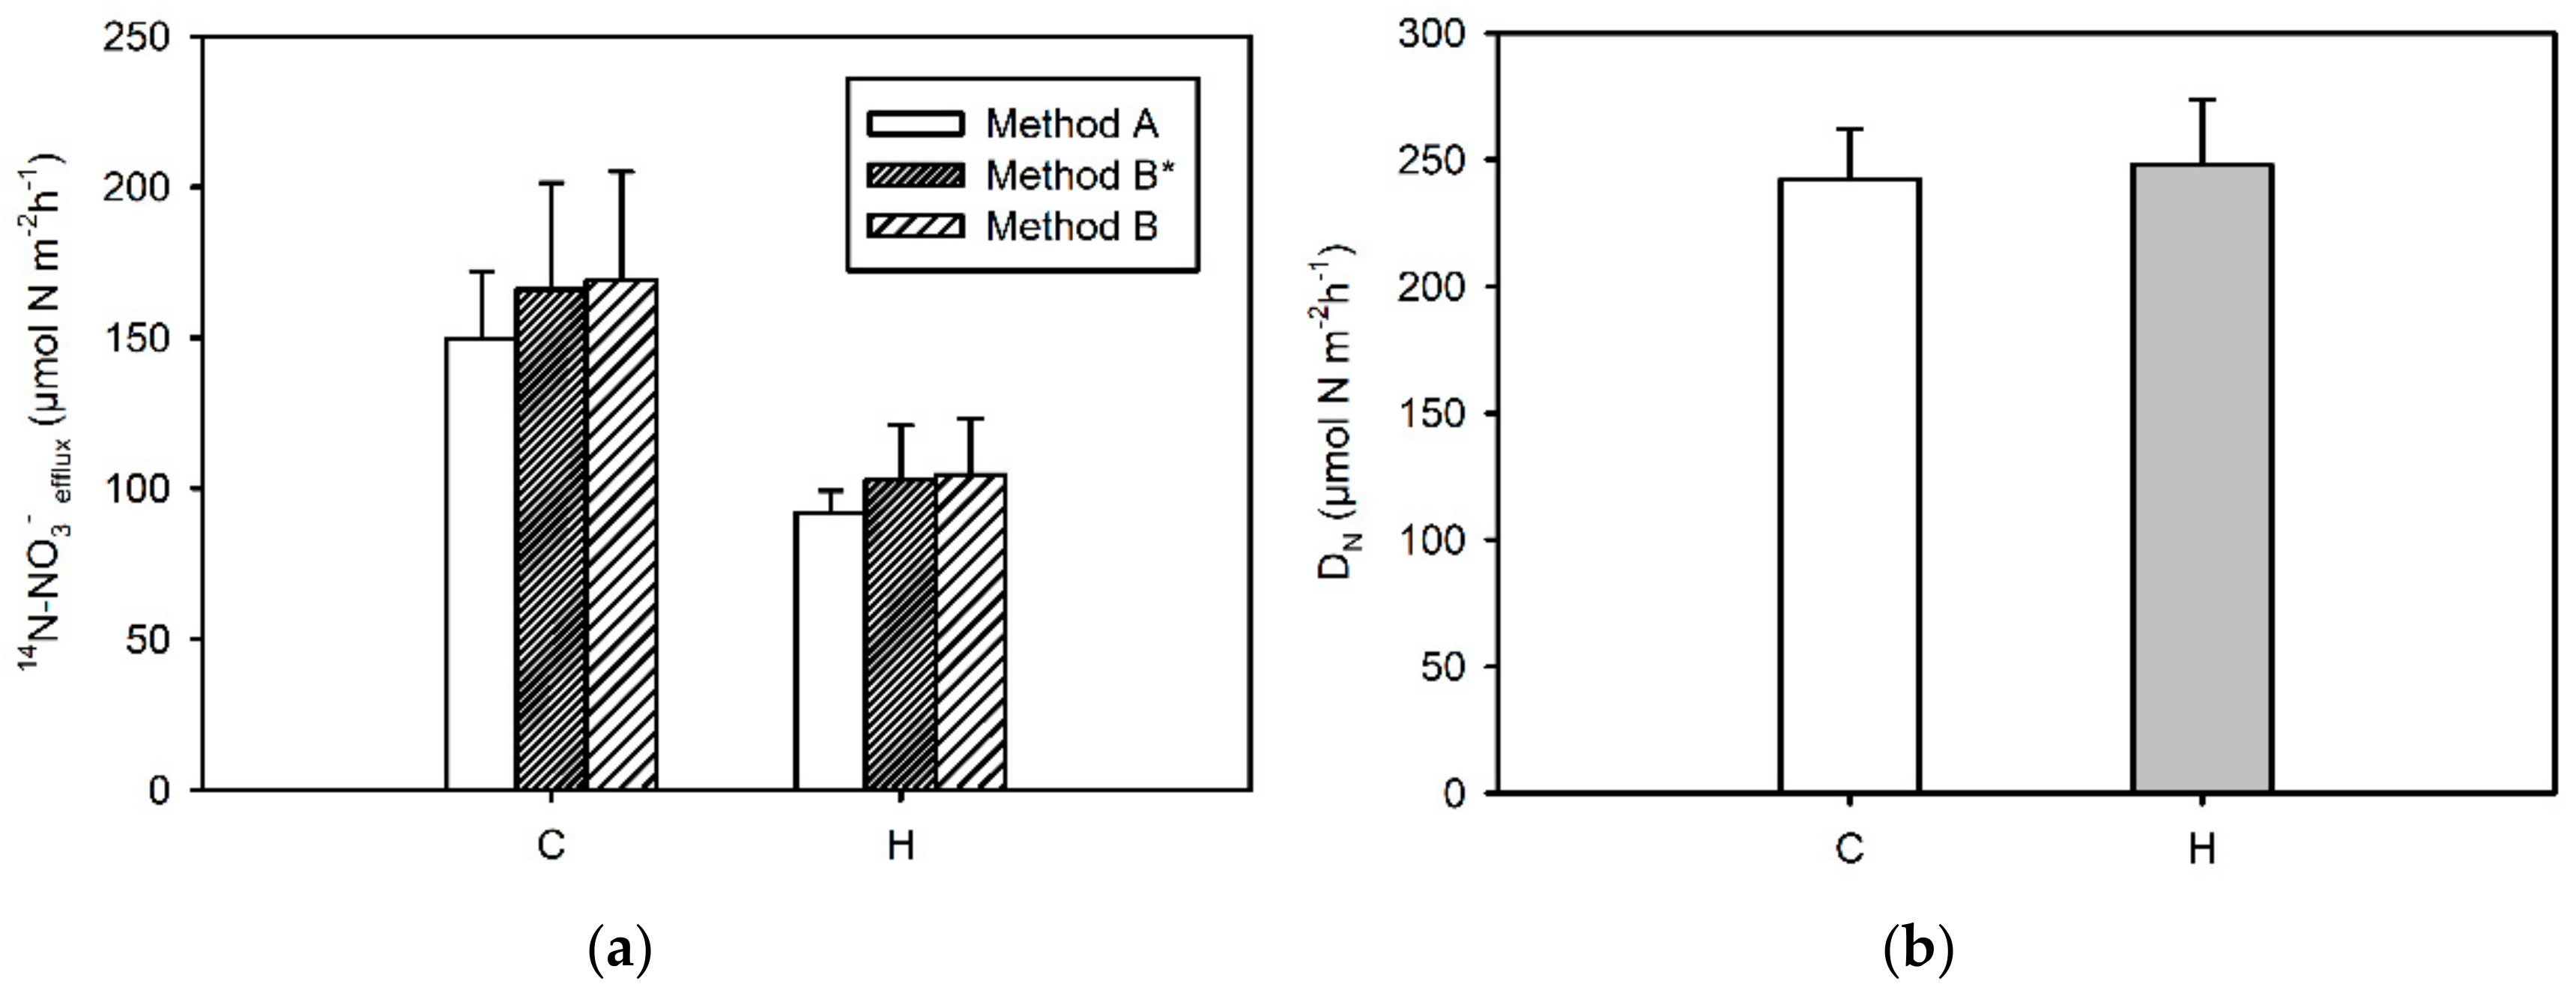
2.7.2. Calculation of 14N-NO3−-Efflux from Sediments
Method A
Method B
2.7.3. Measurement of Coupled Nitrification–Denitrification
2.8. Statistical Analyses
3. Results and Discussion
3.1. Slurry Concentration Series
3.2. Time Series Experiment
3.3. Concentration Series Experiment
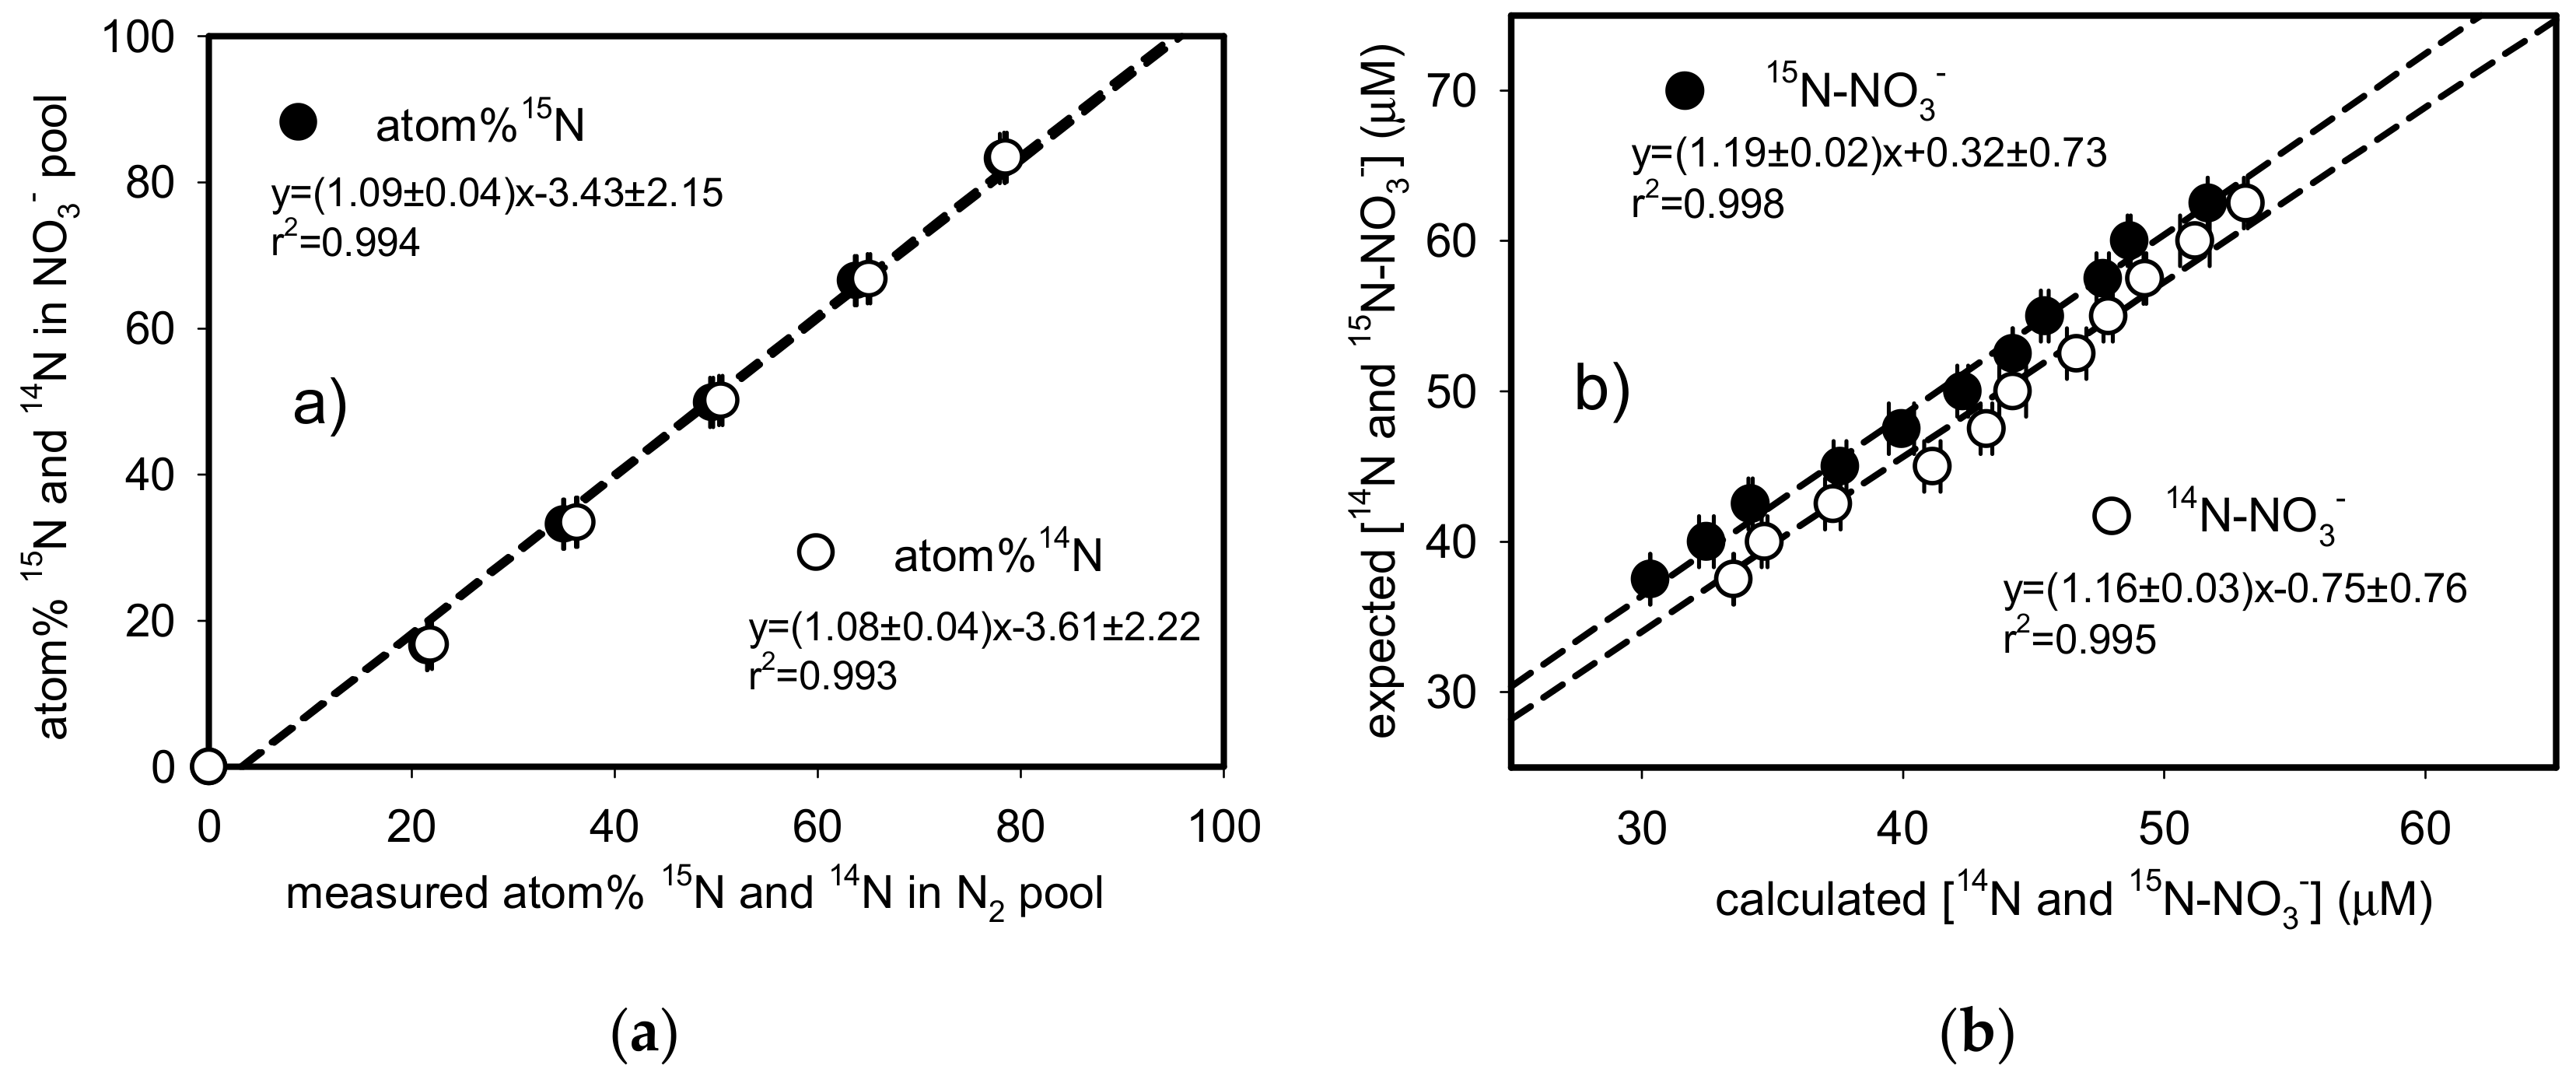
3.4. Quantification of Labelled and Unlabeled N-NO3−
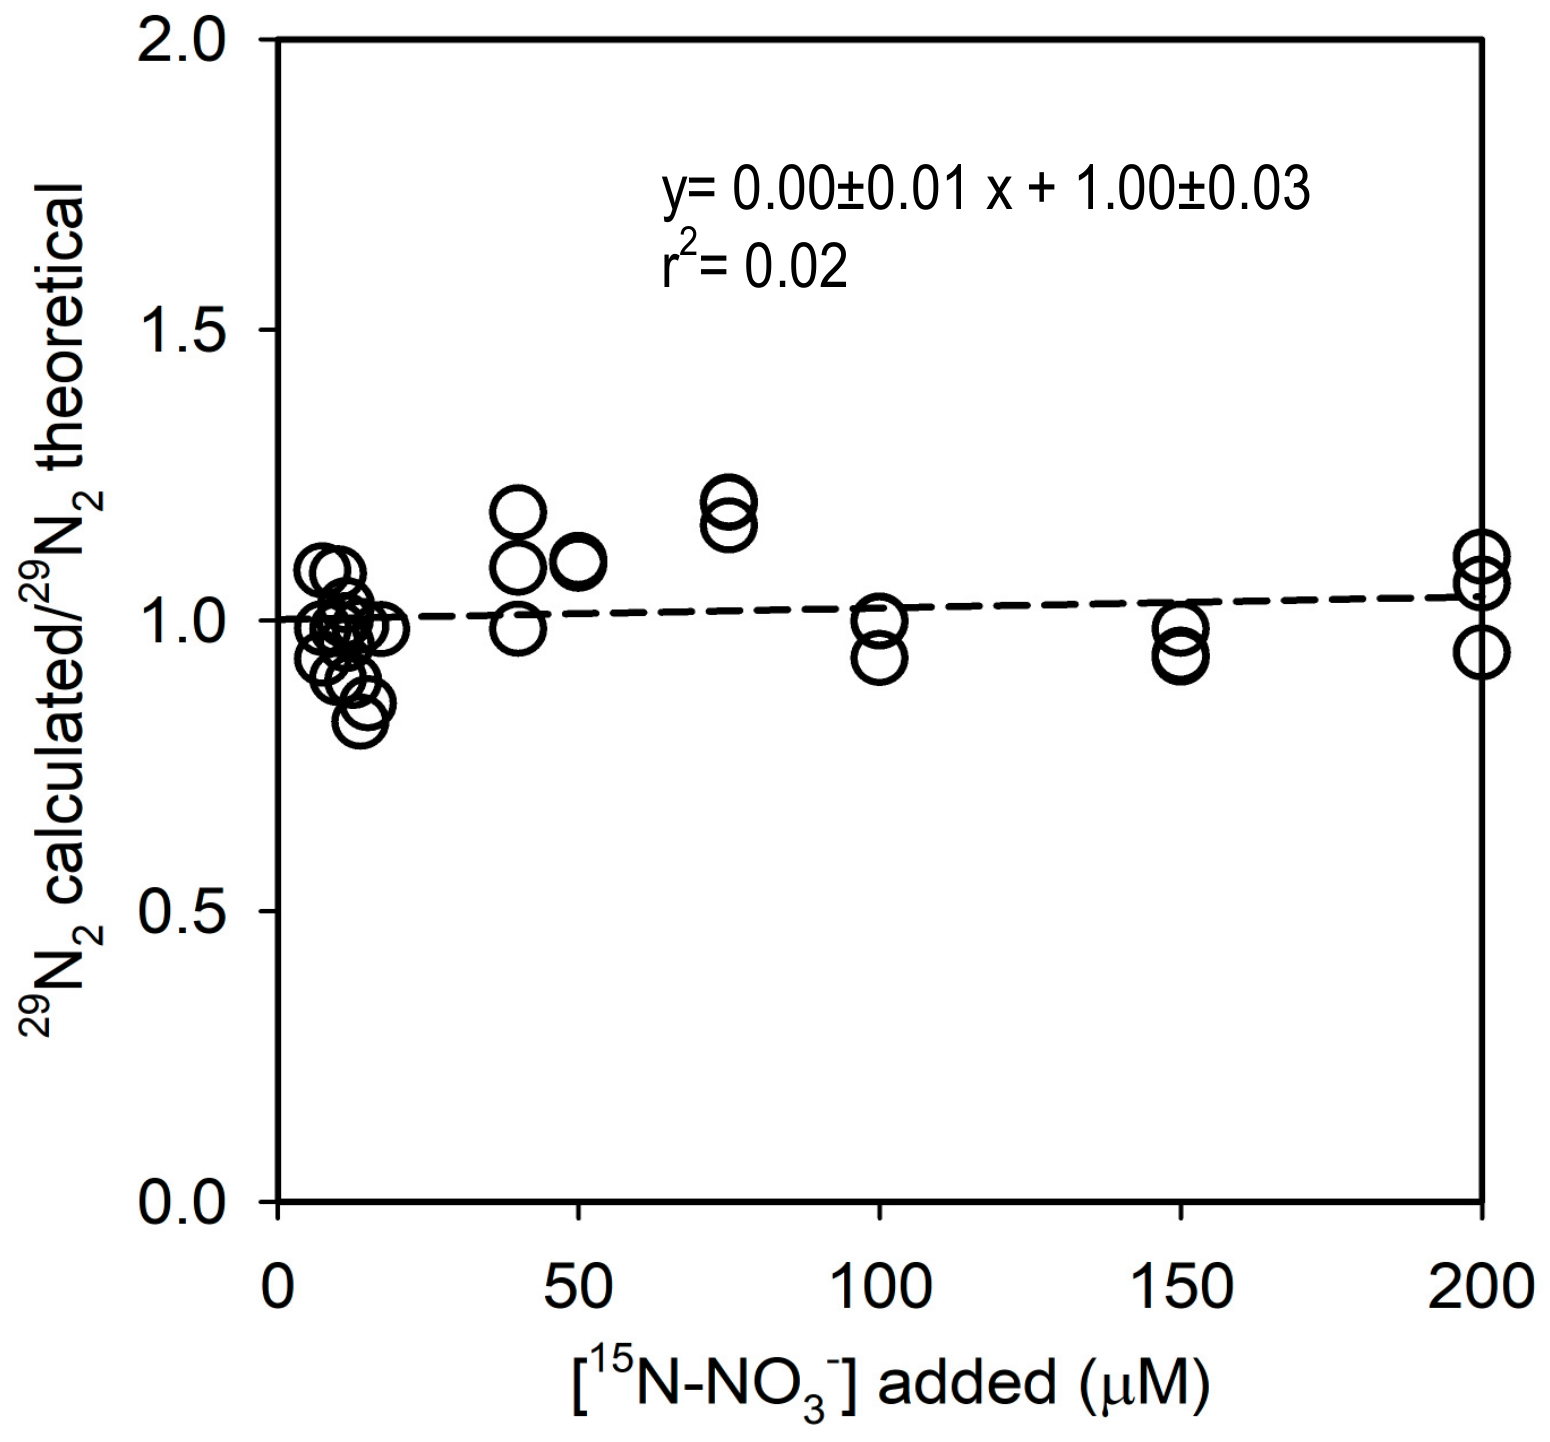
3.5. Anammox Assay
3.6. Measurements of 15N-NO3− and 14N-NO3− to Determine Nitrification Rates in Bioturbated Sediments
3.6.1. 14N-NO3−-Efflux from Sediments
3.6.2. Coupled Nitrification–Denitrification
4. Conclusions
Author Contributions
Funding
Acknowledgments
Conflicts of Interest
References
- Galloway, J.N.; Dentener, F.J.; Capone, D.G.; Boyer, E.W.; Howarth, R.W.; Seitzinger, S.P.; Asner, G.P.; Cleveland, C.C.; Green, P.A.; Holland, E.A.; et al. Nitrogen cycles: Past, present, and future. Biogeochemistry 2004, 70, 153–226. [Google Scholar] [CrossRef]
- Risgaard-Petersen, N.; Nielsen, L.P.; Blackburn, T.H. Simultaneous measurement of benthic denitrification, with the isotope pairing technique and the N2 flux method in a continuous flow-through system. Water Res. 1998, 32, 3371–3377. [Google Scholar] [CrossRef]
- Marchant, H.K.; Lavik, G.; Holtappels, M.; Kuypers, M.M.M. The fate of nitrate in intertidal permeable sediments. PLoS ONE 2014, 9, e104517. [Google Scholar] [CrossRef]
- Newell, S.E.; McCarthy, M.J.; Gardner, W.S.; Fulweiler, R.W. Sediment nitrogen fixation: A call for re-evaluating coastal N budgets. Estuaries Coasts 2016, 39, 1626–1638. [Google Scholar] [CrossRef]
- Nielsen, L.P. Denitrification in sediment determined from nitrogen isotope pairing. FEMS Microbiol. Ecol. 1992, 86, 357–362. [Google Scholar] [CrossRef]
- Burgin, A.J.; Hamilton, S.K. Have we overemphasized the role of denitrification in aquatic ecosystems? A review of nitrate removal pathways. Front. Ecol. Environ. 2007, 5, 89–96. [Google Scholar] [CrossRef] [Green Version]
- Risgaard-Petersen, N.; Rysgaard, S.; Revsbech, N.P. A sensitive assay for determination of 14N/15N isotope distribution in NO3-. J. Microbiol. Methods 1993, 17, 155–164. [Google Scholar] [CrossRef]
- Jensen, K.M.; Jensen, M.H.; Cox, R.P. Membrane inlet mass spectrometric analysis of N-isotope labelling for aquatic denitrification studies. FEMS Microbiol. Ecol. 1996, 20, 101–109. [Google Scholar] [CrossRef]
- An, S.; Gardner, W.S.; Kana, T. Simultaneous measurement of denitrification and nitrogen fixation using isotope pairing with membrane inlet mass spectrometry analysis. Appl. Environ. Microbiol. 2001, 67, 1171–1178. [Google Scholar] [CrossRef]
- Bonaglia, S.; Deutsch, B.; Bartoli, M.; Marchant, H.K.; Brüchert, V. Seasonal oxygen, nitrogen and phosphorus benthic cycling along an impacted Baltic Sea estuary: Regulation and spatial patterns. Biogeochemistry 2014, 119, 139–160. [Google Scholar] [CrossRef]
- Kana, T.M.; Darkangelo, C.; Oldham, J.B.; Bennett, G.E.; Cornwell, J.C. Membrane inlet mass spectrometer for rapid high-precision determination of N2, O2, and Ar in environmental water samples. Anal. Chem. 1994, 66, 4166–4170. [Google Scholar] [CrossRef]
- Heiss, E.M.; Fulweiler, R.W. Coastal water column ammonium and nitrite oxidation are decoupled in summer. Estuar. Coast. Shelf Sci. 2016, 178, 110–119. [Google Scholar] [CrossRef] [Green Version]
- Revesz, K.; Böhlke, J.K.; Yoshinari, T. Determination of 18O and 15N in nitrate. Anal. Chem. 1997, 69, 4375–4380. [Google Scholar] [CrossRef] [PubMed]
- McIlvin, M.R.; Altabet, M.A. Chemical conversion of nitrate and nitrite to nitrous oxide for nitrogen and oxygen isotopic analysis in freshwater and seawater. Anal. Chem. 2005, 77, 5589–5595. [Google Scholar] [CrossRef]
- Soana, E.; Naldi, M.; Bonaglia, S.; Racchetti, E.; Castaldelli, G.; Brüchert, V.; Viaroli, P.; Bartoli, M. Benthic nitrogen metabolism in a macrophyte meadow (Vallisneria spiralis L.) under increasing sedimentary organic matter loads. Biogeochemistry 2015, 124, 387–404. [Google Scholar] [CrossRef]
- Risgaard-Petersen, N.; Nielsen, L.P.; Rysgaard, S.; Dalsgaard, T.; Meyer, R.L. Application of the isotope pairing technique in sediments where anammox and denitrification coexist. Limnol. Oceanogr. Methods 2003, 1, 63–73. [Google Scholar] [CrossRef]
- Rysgaard, S.; Risgaard-Petersen, N.; Nielsen, L.P.; Revsbech, N.P. Nitrification and denitrification in lake and estuarine sediments measured by the 15N dilution technique and isotope pairing. Appl. Environ. Microbiol. 1993, 59, 2093–2098. [Google Scholar]
- Ribaudo, C.; Bartoli, M.; Racchetti, E.; Longhi, D.; Viaroli, P. Seasonal fluxes of O2, DIC and CH4 in sediments with Vallisneria spiralis: Indications for radial oxygen loss. Aquat. Bot. 2001, 94, 134–142. [Google Scholar] [CrossRef]
- Rota, E.; Bartoli, M.; Laini, A. First time in Italy. Is the elusive aquatic megadrile Sparganophilus Benham, 1892 (Annelida, Clitellata) accelerating its dispersal in Europe? J. Limnol. 2014, 73, 482–489. [Google Scholar] [CrossRef]
- Ruginis, T.; Bartoli, M.; Petkuviene, J.; Zilius, M.; Lubiene, I.; Laini, A.; Razinkovas-Baziukas, A. Benthic respiration and stoichiometry of regenerated nutrients in lake sediments with Dreissena polymorpha. Aquat. Sci. 2014, 76, 405–417. [Google Scholar] [CrossRef]
- Zhou, S.; Borjigin, S.; Riya, S.; Terada, A.; Hosomi, M. The relationship between anammox and denitrification in the sediment of an inland river. Sci. Total Environ. 2014, 490, 1029–1036. [Google Scholar] [CrossRef] [PubMed]
- Racchetti, E.; Bartoli, M.; Soana, E.; Longhi, D.; Christian, R.R.; Pinardi, M.; Viaroli, P. Influence of hydrological connectivity of riverine wetlands on nitrogen removal via denitrification. Biogeochemistry 2011, 103, 335–354. [Google Scholar] [CrossRef]
- Wang, S.; Zhu, G.; Peng, Y.; Jetten, M.S.M.; Yin, C. Anammox bacterial abundance, activity, and contribution in riparian sediments of the Pearl River estuary. Environ. Sci. Technol. 2012, 46, 8834–8842. [Google Scholar] [CrossRef] [PubMed]
- Zhao, Y.; Xia, Y.; Kana, T.M.; Wu, Y.; Li, X.; Yan, X. Seasonal variation and controlling factors of anaerobic ammonium oxidation in freshwater river sediments in the Taihu Lake region of China. Chemosphere 2013, 93, 2124–2131. [Google Scholar] [CrossRef]
- Pauer, J.J.; Aue, M.T. Nitrification in the water column and sediment of a hypereutrophic lake and adjoining river system. Water Res. 2000, 34, 1247–1254. [Google Scholar] [CrossRef]
- Svensson, J.M.; Enrich-Prast, A.; Leonardson, L. Nitrification and denitrification in a eutrophic lake sediment bioturbated by oligochaetes. Aquat. Microb. Ecol. 2001, 23, 177–186. [Google Scholar] [CrossRef]
- Strauss, E.A.; Lamberti, G.A. Effect of dissolved organic carbon quality on microbial decomposition and nitrification rates in stream sediments. Freshw. Biol. 2002, 47, 65–74. [Google Scholar] [CrossRef]
- Bonaglia, S.; Bartoli, M.; Gunnarsson, J.S.; Rahm, L.; Raymond, C.; Svensson, O.; Shakeri Yekta, S.; Brüchert, V. Effect of reoxygenation and Marenzelleria spp. bioturbation on Baltic Sea sediment metabolism. Mar. Ecol. Prog. Ser. 2013, 482, 43–55. [Google Scholar] [CrossRef] [Green Version]
- Kristensen, E.; Penha-Lopes, G.; Delefosse, M.; Valdemarsen, T.; Quintana, C.O.; Banta, G.T. What is bioturbation? The need for a precise definition for fauna in aquatic sciences. Mar. Ecol. Prog. Ser. 2012, 446, 285–302. [Google Scholar] [CrossRef] [Green Version]


| [15N-NO3−] µM | [14N-NO3−] µM | Time (h) | [Slurries] mL L−1 | |||||||||
|---|---|---|---|---|---|---|---|---|---|---|---|---|
| Slurry concentration series | 50 | 0 | 20 | 42 83 125 167 | 208 250 292 333 | 375 417 458 500 | ||||||
| Time series | 2 20 200 300 | 0 | 0.5 1 1.5 2 2.5 3 | 5 7 10 22 34 48 | 167 | |||||||
| Concentration series | 0.5 2.5 5 10 20 30 40 50 | 75 100 150 200 300 400 500 600 | 700 800 900 1000 1500 2000 3000 | 0 | 20 | 167 | ||||||
| Quantification of labelled and unlabeled N-NO3− | (a) | 0.2 0.6 2.5 6.5 16.5 | 33.0 50.0 67.0 83.5 93.5 | 97.5 99.4 99.8 | 99.8 99.4 97.5 93.5 83.5 | 67.0 50.0 33.0 16.5 6.5 | 2.5 0.6 0.2 | 20 | 167 | |||
| (b) | 37.5 40 42.5 45 47.5 | 50 52.5 55 57.5 60 | 62.5 | 62.5 60 57.5 55 52.5 | 50 47.5 45 42.5 40 | 37.5 | ||||||
© 2019 by the authors. Licensee MDPI, Basel, Switzerland. This article is an open access article distributed under the terms and conditions of the Creative Commons Attribution (CC BY) license (http://creativecommons.org/licenses/by/4.0/).
Share and Cite
Carpintero Moraes, P.; Arroyave Gòmez, D.M.; Vincenzi, F.; Castaldelli, G.; Fano, E.A.; Bartoli, M.; Benelli, S. Analysis of 15N-NO3− Via Anoxic Slurries Coupled to MIMS Analysis: An Application to Estimate Nitrification by Burrowing Macrofauna. Water 2019, 11, 2310. https://doi.org/10.3390/w11112310
Carpintero Moraes P, Arroyave Gòmez DM, Vincenzi F, Castaldelli G, Fano EA, Bartoli M, Benelli S. Analysis of 15N-NO3− Via Anoxic Slurries Coupled to MIMS Analysis: An Application to Estimate Nitrification by Burrowing Macrofauna. Water. 2019; 11(11):2310. https://doi.org/10.3390/w11112310
Chicago/Turabian StyleCarpintero Moraes, Paula, Diana Marcela Arroyave Gòmez, Fabio Vincenzi, Giuseppe Castaldelli, Elisa Anna Fano, Marco Bartoli, and Sara Benelli. 2019. "Analysis of 15N-NO3− Via Anoxic Slurries Coupled to MIMS Analysis: An Application to Estimate Nitrification by Burrowing Macrofauna" Water 11, no. 11: 2310. https://doi.org/10.3390/w11112310
APA StyleCarpintero Moraes, P., Arroyave Gòmez, D. M., Vincenzi, F., Castaldelli, G., Fano, E. A., Bartoli, M., & Benelli, S. (2019). Analysis of 15N-NO3− Via Anoxic Slurries Coupled to MIMS Analysis: An Application to Estimate Nitrification by Burrowing Macrofauna. Water, 11(11), 2310. https://doi.org/10.3390/w11112310