1. Introduction
This study investigates the movement of the boulders located in the southern sector of the Premantura (Kamenjak) Promontory (Croatia, southern Istria Peninsula) after an extremely severe storm named “Vaia” which struck during 29 October 2018 [
1]. Terrestrial, aerial and underwater surveys were performed to analyze the possible geomorphological effects of the storm on the boulder field in terms of movements of boulders, as well as their disappearance and the appearance of new ones.
In 2018, between Saturday, October 27 and the early hours of Tuesday, October 30, large sectors of the Italian and the northern Adriatic coasts were hit by one of the most intense, complex, and damaging storms in recent decades as the result of the passage of an exceptionally strong cyclone named Vaia. Monday, October 29, was characterized by violent gusts of Sirocco, (a southerly wind blowing across the Adriatic Sea), storm surges, and extraordinarily high tides in the northernmost Adriatic Sea combined with severe rainfall, particularly in the northeastern Alps. The storm caused 16 casualties in an area from Trentino (northern Italy) to Campania (southern Italy) and severe damage totaling more than two billion euros. Tens of thousands of customers were still without electricity two days after the event, especially in the Trentino, Veneto, and Friuli areas (Northeast Italy).
We investigated the relationship between this extreme Sirocco storm and an extensive boulder accumulation located at the southernmost tip of the Istrian Peninsula, in Premantura, Croatia [
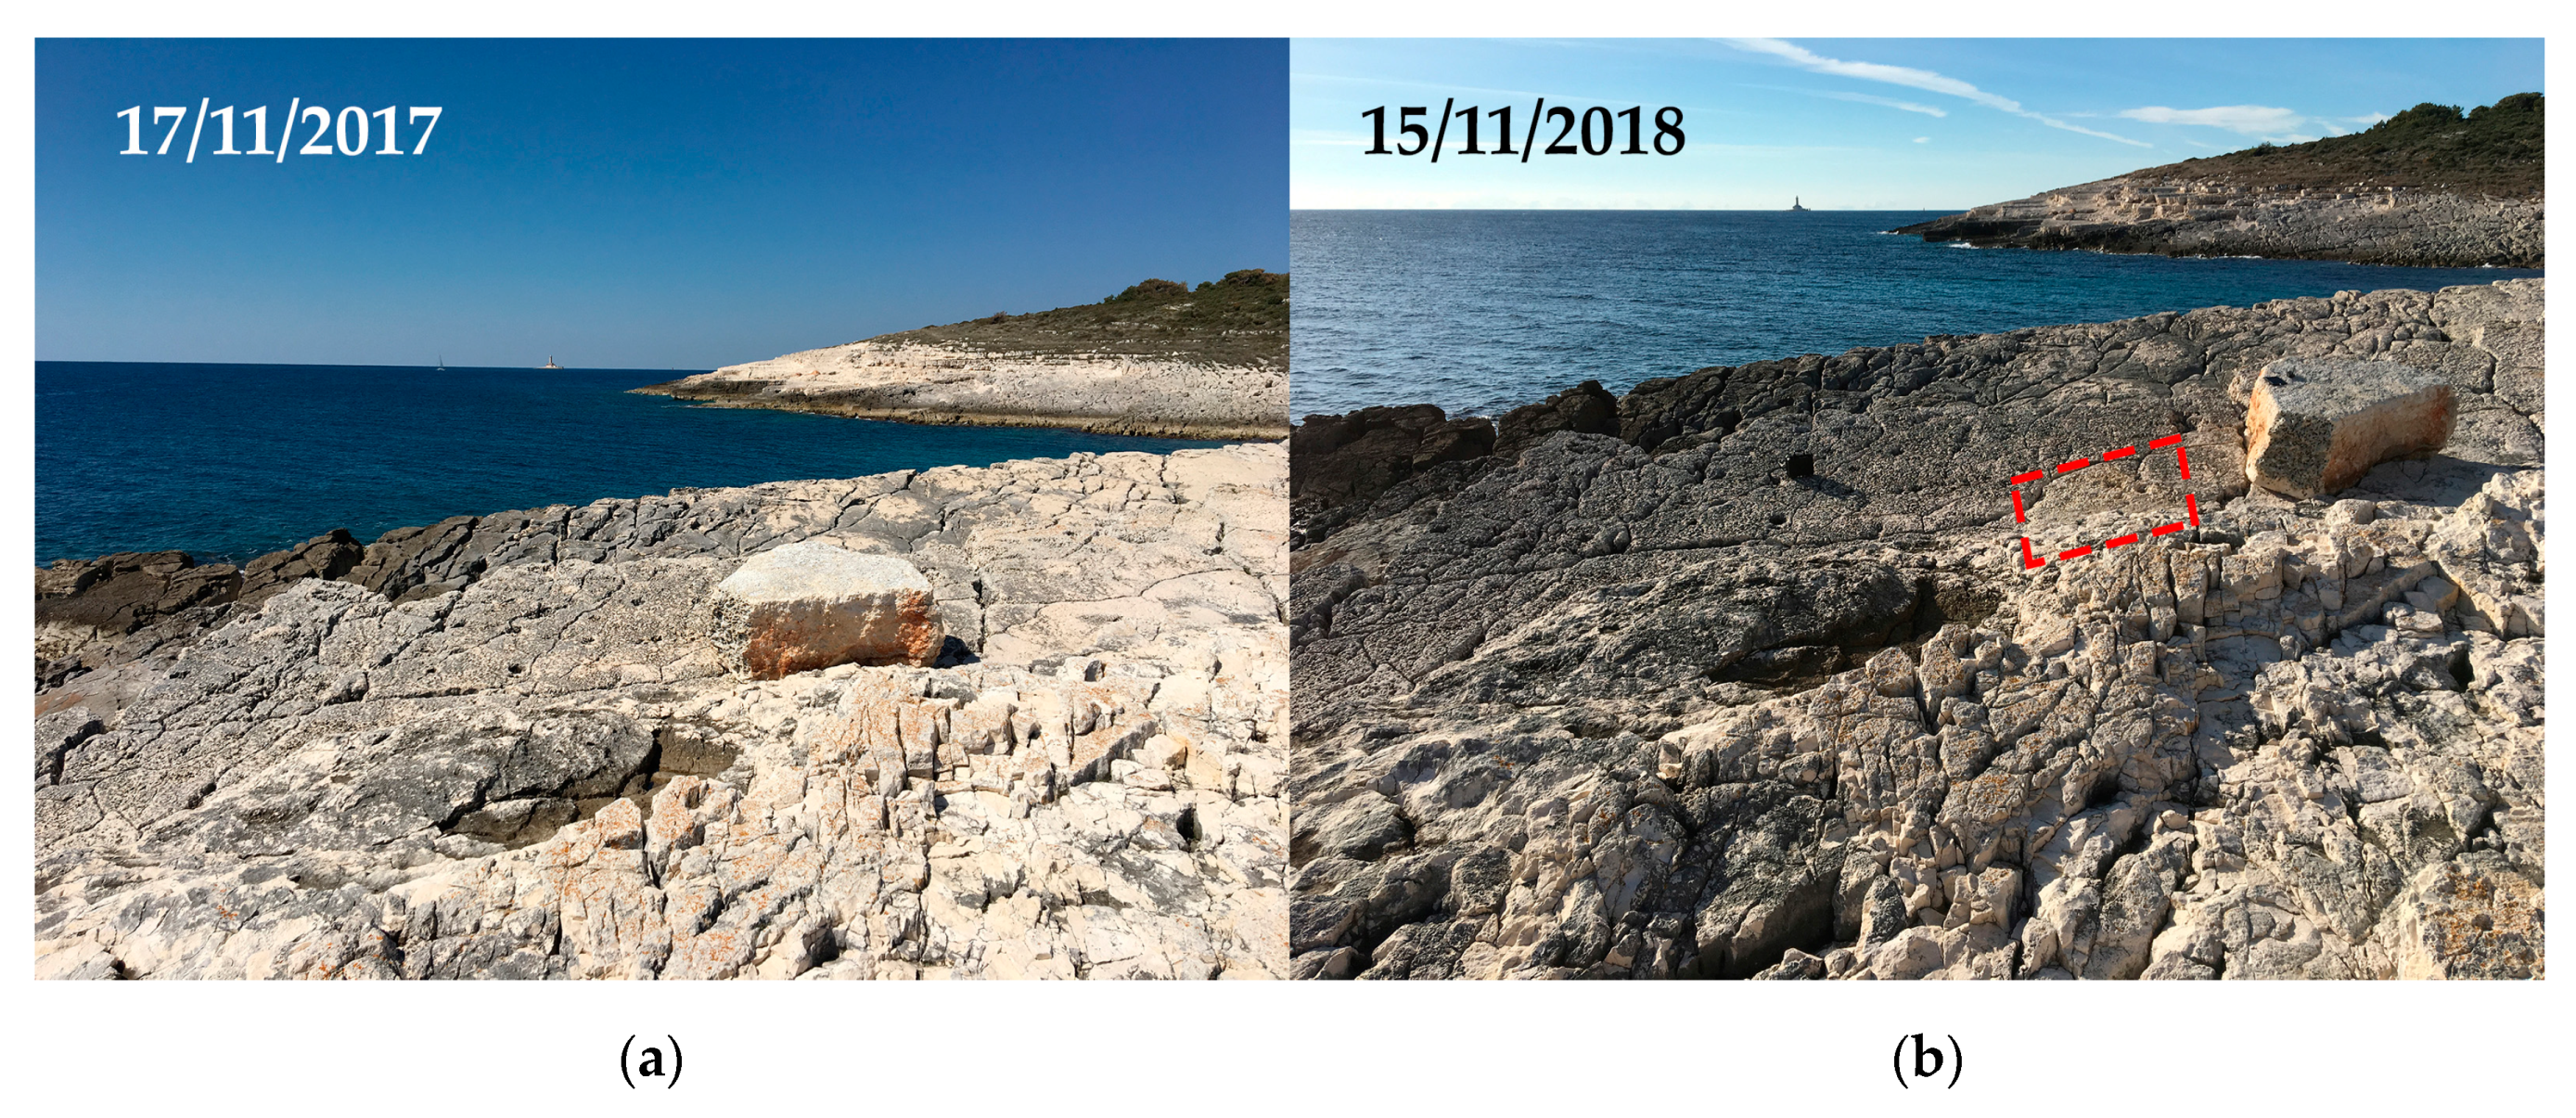
2]. This study provides the results of two years of monitoring using unmanned aerial vehicle (UAV) based multitemporal photogrammetric image comparison and the outputs of underwater environmental monitoring using a three-dimensional (3D) model obtained through photogrammetric analysis of underwater pictures. Field activities were carried out, assisted by a UAV survey, approximately two weeks after storm Vaia. These surveys revealed that the boulder positions had changed with respect to the previous field investigations carried out in November 2017. For example, the isolated boulder, K8, widely described by Biolchi et al. [
2] had been moved towards the northwest and rotated.
The transport of rocky boulders in the Mediterranean and more generally along oceanic coasts has been widely studied. It has been documented that waves associated with stormy events and major tsunami events can generate a force strong enough to detach boulders from the ground and transport them along the shore. Despite boulder motion being mostly attributed to tsunamogenic activities in the literature, several authors have recently proven that the impact of storm waves is, in fact, the primary mechanism for boulder detachment and transport [
3,
4,
5,
6,
7,
8,
9]. Moreover, at higher latitudes, Orviku et al. [
10] explained how the decomposition of sea ice and its drifting onshore can transport and accumulate boulders over 1 m in diameter, especially during the spring after ice melting.
Marriner et al. [
9] analyzed tsunami and storm data, contained in the EM-DAT (Emergency Events Database) for the 1900 to 2015 period, and found that up to 90% of tsunami attributions of high-energy events in the Mediterranean coastal records should be reconsidered. Cox et al. [
11,
12] and Cox [
13] reported on strong evidence that even some mega boulders in the open ocean setting (Northern Atlantic) were displaced along with the cliff platforms by storm waves.
This study presents a multidisciplinary approach based on the hypothesis that it was storm Vaia that impacted the coastal boulders. This approach, which integrates inland and submarine surveys, as well as numerical modeling aims to:
Detect possible transports triggered by storm Vaia and monitor the boulder movements using unmanned aerial vehicle digital photogrammetry (UAV-DP);
Examine the submarine environment by testing a new methodology that can be useful for future comparisons after future storms;
Produce accurate wave results for the period during the peak of the storm in order to confirm that the boulder motion could have been locally triggered by breaking waves.
The focus of this work is to study the relationship between a previously documented storm and coastal boulder movements, highlighting that a severe storm is sufficient to move or initiate boulder transport both from the sea bottom and in a subaerial environment. The work can be included in the scientific debate concerning the explanation of coastal boulder detachment and movement in terms of “storm vs. tsunami”. A clear relationship between a severe storm that occurred during 2014 and the emplacement of a large boulder in the southern Istria peninsula in Premantura was provided by [
2]. This study, performed in the same area after a different storm, confirms that sea wave energies are capable of moving or detaching new boulders from the submarine floor.
1.1. Study Area
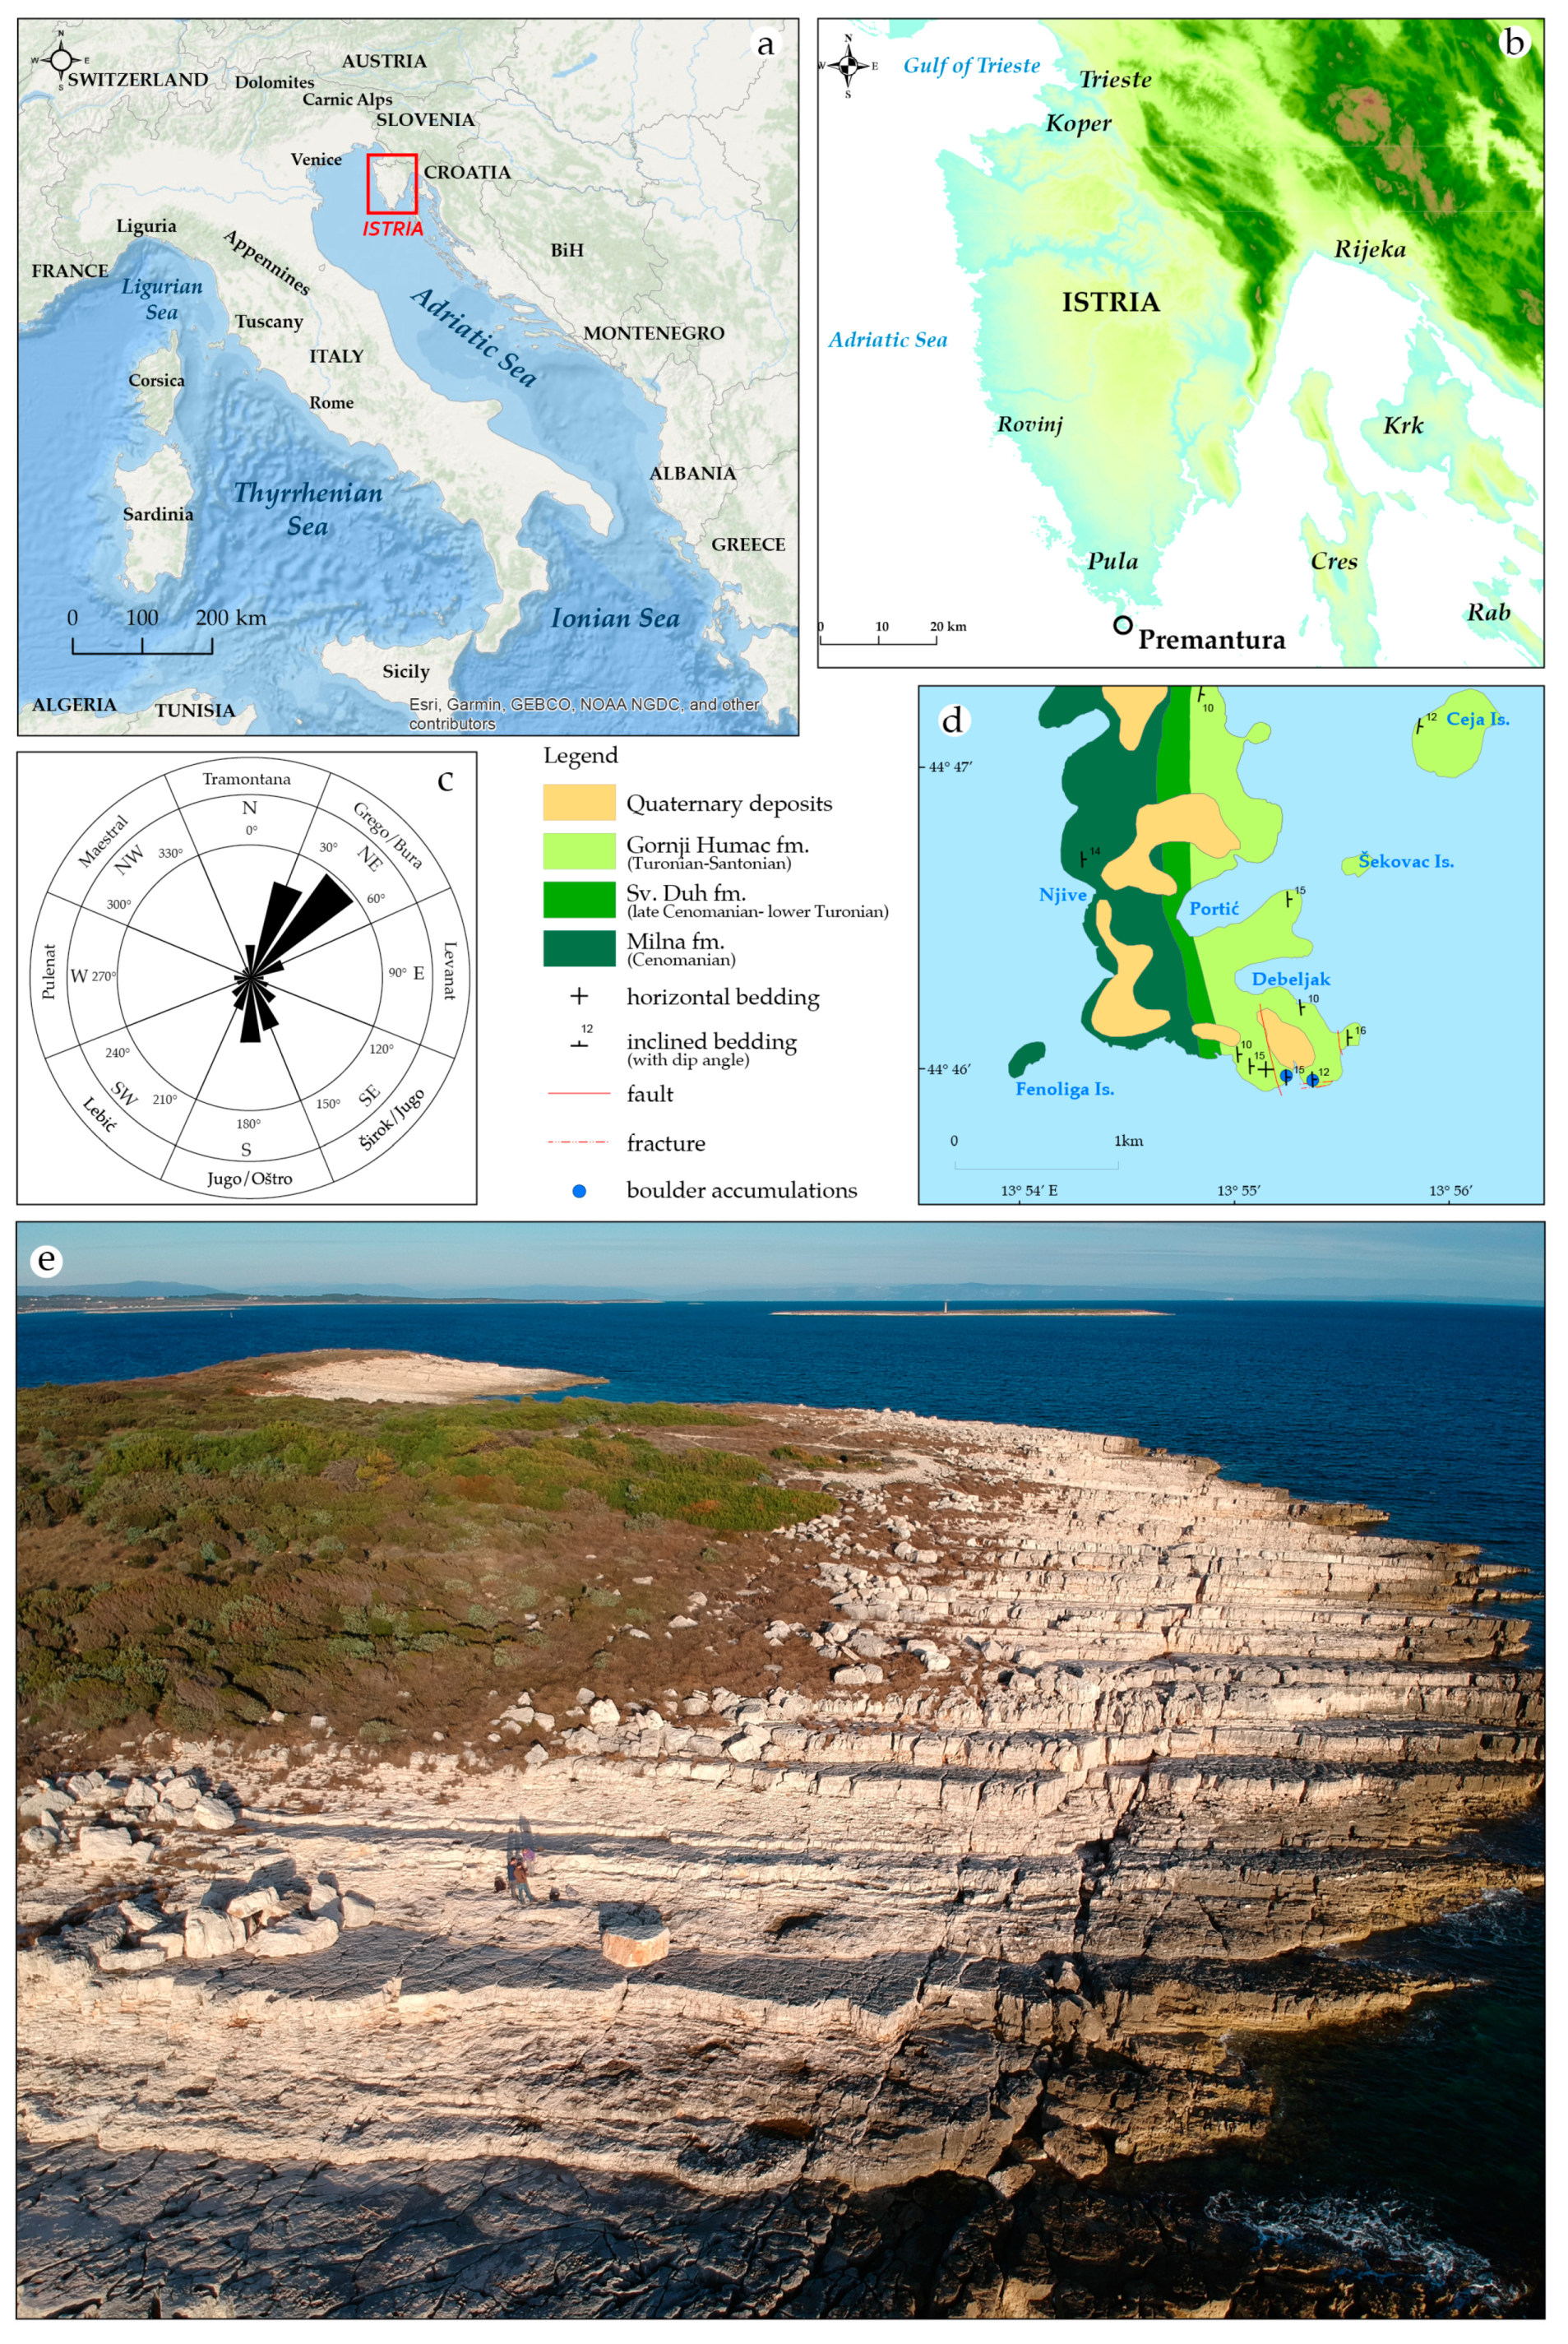
The studied boulder accumulation is located on the rocky coast of the Premantura Promontory (Kamenjak Nature Park) in the southernmost sector of the Istrian peninsula (Croatia, northern Adriatic Sea). The promontory is formed by a succession of stratified Late Cretaceous carbonate rocks, dipping gently towards the east [
2] (
Figure 1).
Its southeastern-most tip is named “Jugo Promontory”, after the powerful southeasterly wind (jugo in Croatian) and consists of a stratified, shallow-marine Cretaceous limestone succession. The succession is characterized by alternations of thin-bedded (10–30 cm), fine-grained peloidal packstones, and thick-bedded (50‒150 cm) mudstones and wackestones containing algal oncoids and rare rudist shells, typical of the lower part of the Gornji Humac Formation, which dates back to the Turonian [
14]. The Kamenjak Nature Park is characterized by elevations that are up to 50 m above sea level, rounded bays, pocket beaches, and small islands. The south and east coasts of the park are characterized by gentle slopes, which generally follow the dip angles of the bedrock strata.
At the studied site (southern part of Jugo Promontory), the washed (“white”) coastal zone is up to 70 m wide. The zone is the narrowest (40 m) at the highest elevation region, in the central part of the study site. The bed dip direction and the dipping angle on the southwestern part is 88/12, and boulders are grouped along the washed zone, situated 50 to 70 m from the sea, along the border with the vegetated zone, figured in Biolchi et al. [
2]. There are a few solitary boulders that are considered the youngest. More than 950 mostly meter-sized boulders (volumes from 0.385 to 11.440 m
3) were recognized on the promontory during a former survey [
2], with an estimated total volume of ~2000 m
3.
The submerged part of the coast is of similar morphology, and gently dipping limestone ramps continue under the sea. Cliffs with heights of a few meters developed locally (out of the studied localities) and are related to massive rock masses within the succession of the limestone rocks and to small local faults. Thus, the maximal runup during extreme storms is defined by the height of the breaking waves and the gentle dip angle of the coastal ramp and is marked by the boundary of the vegetated zone along the gentle coast that is around 70 m away from the sea [
2].
The Adriatic Sea is a semi-enclosed basin in the northern Mediterranean, with the following dominant winds: Sirocco (jugo in Croatian) blowing from the southeast, Bora (bura in Croatian) blowing from the northeast, and Libeccio blowing from the southwest (
Figure 1c) [
15]. The Sirocco has the longest fetch, and therefore generates the highest waves in the northern Adriatic Sea [
16]. Significant and maximum wave heights of 5.3 m and 10.8 m, respectively, were measured over a roughly 10-year interval (1978–1986) about 50 km southwest of the Premantura Promontory. The other two winds generate lower waves in the area under investigation. The Sirocco may also generate extreme storm surges and sea levels in the northern Adriatic Sea [
17], particularly between November and February, which can lead to the flooding of coastal regions. Together with the Adriatic seiche [
18] and tides, extreme sea levels can reach up to 1.5 m above mean sea level [
19,
20]. On top of the tides and the storm surges, tsunami-like waves of meteorological origin, meteotsunamis, may further raise the sea level along the open coastline of Istria by a few tens of centimeters [
21,
22].
Although they have been found to impact coastal boulders in various parts of the world’s oceans, no significant seismic tsunamis have been reported in the northern Adriatic Sea over the last two hundred years [
23,
24]. The worst-case hazard scenarios provide for a maximum tsunami height no higher than 20 cm [
25].
1.2. Storm Vaia
At the time of this study, storm Vaia had not yet been described in the literature and the only available information came from reports provided by the Italian Meteorological Society [
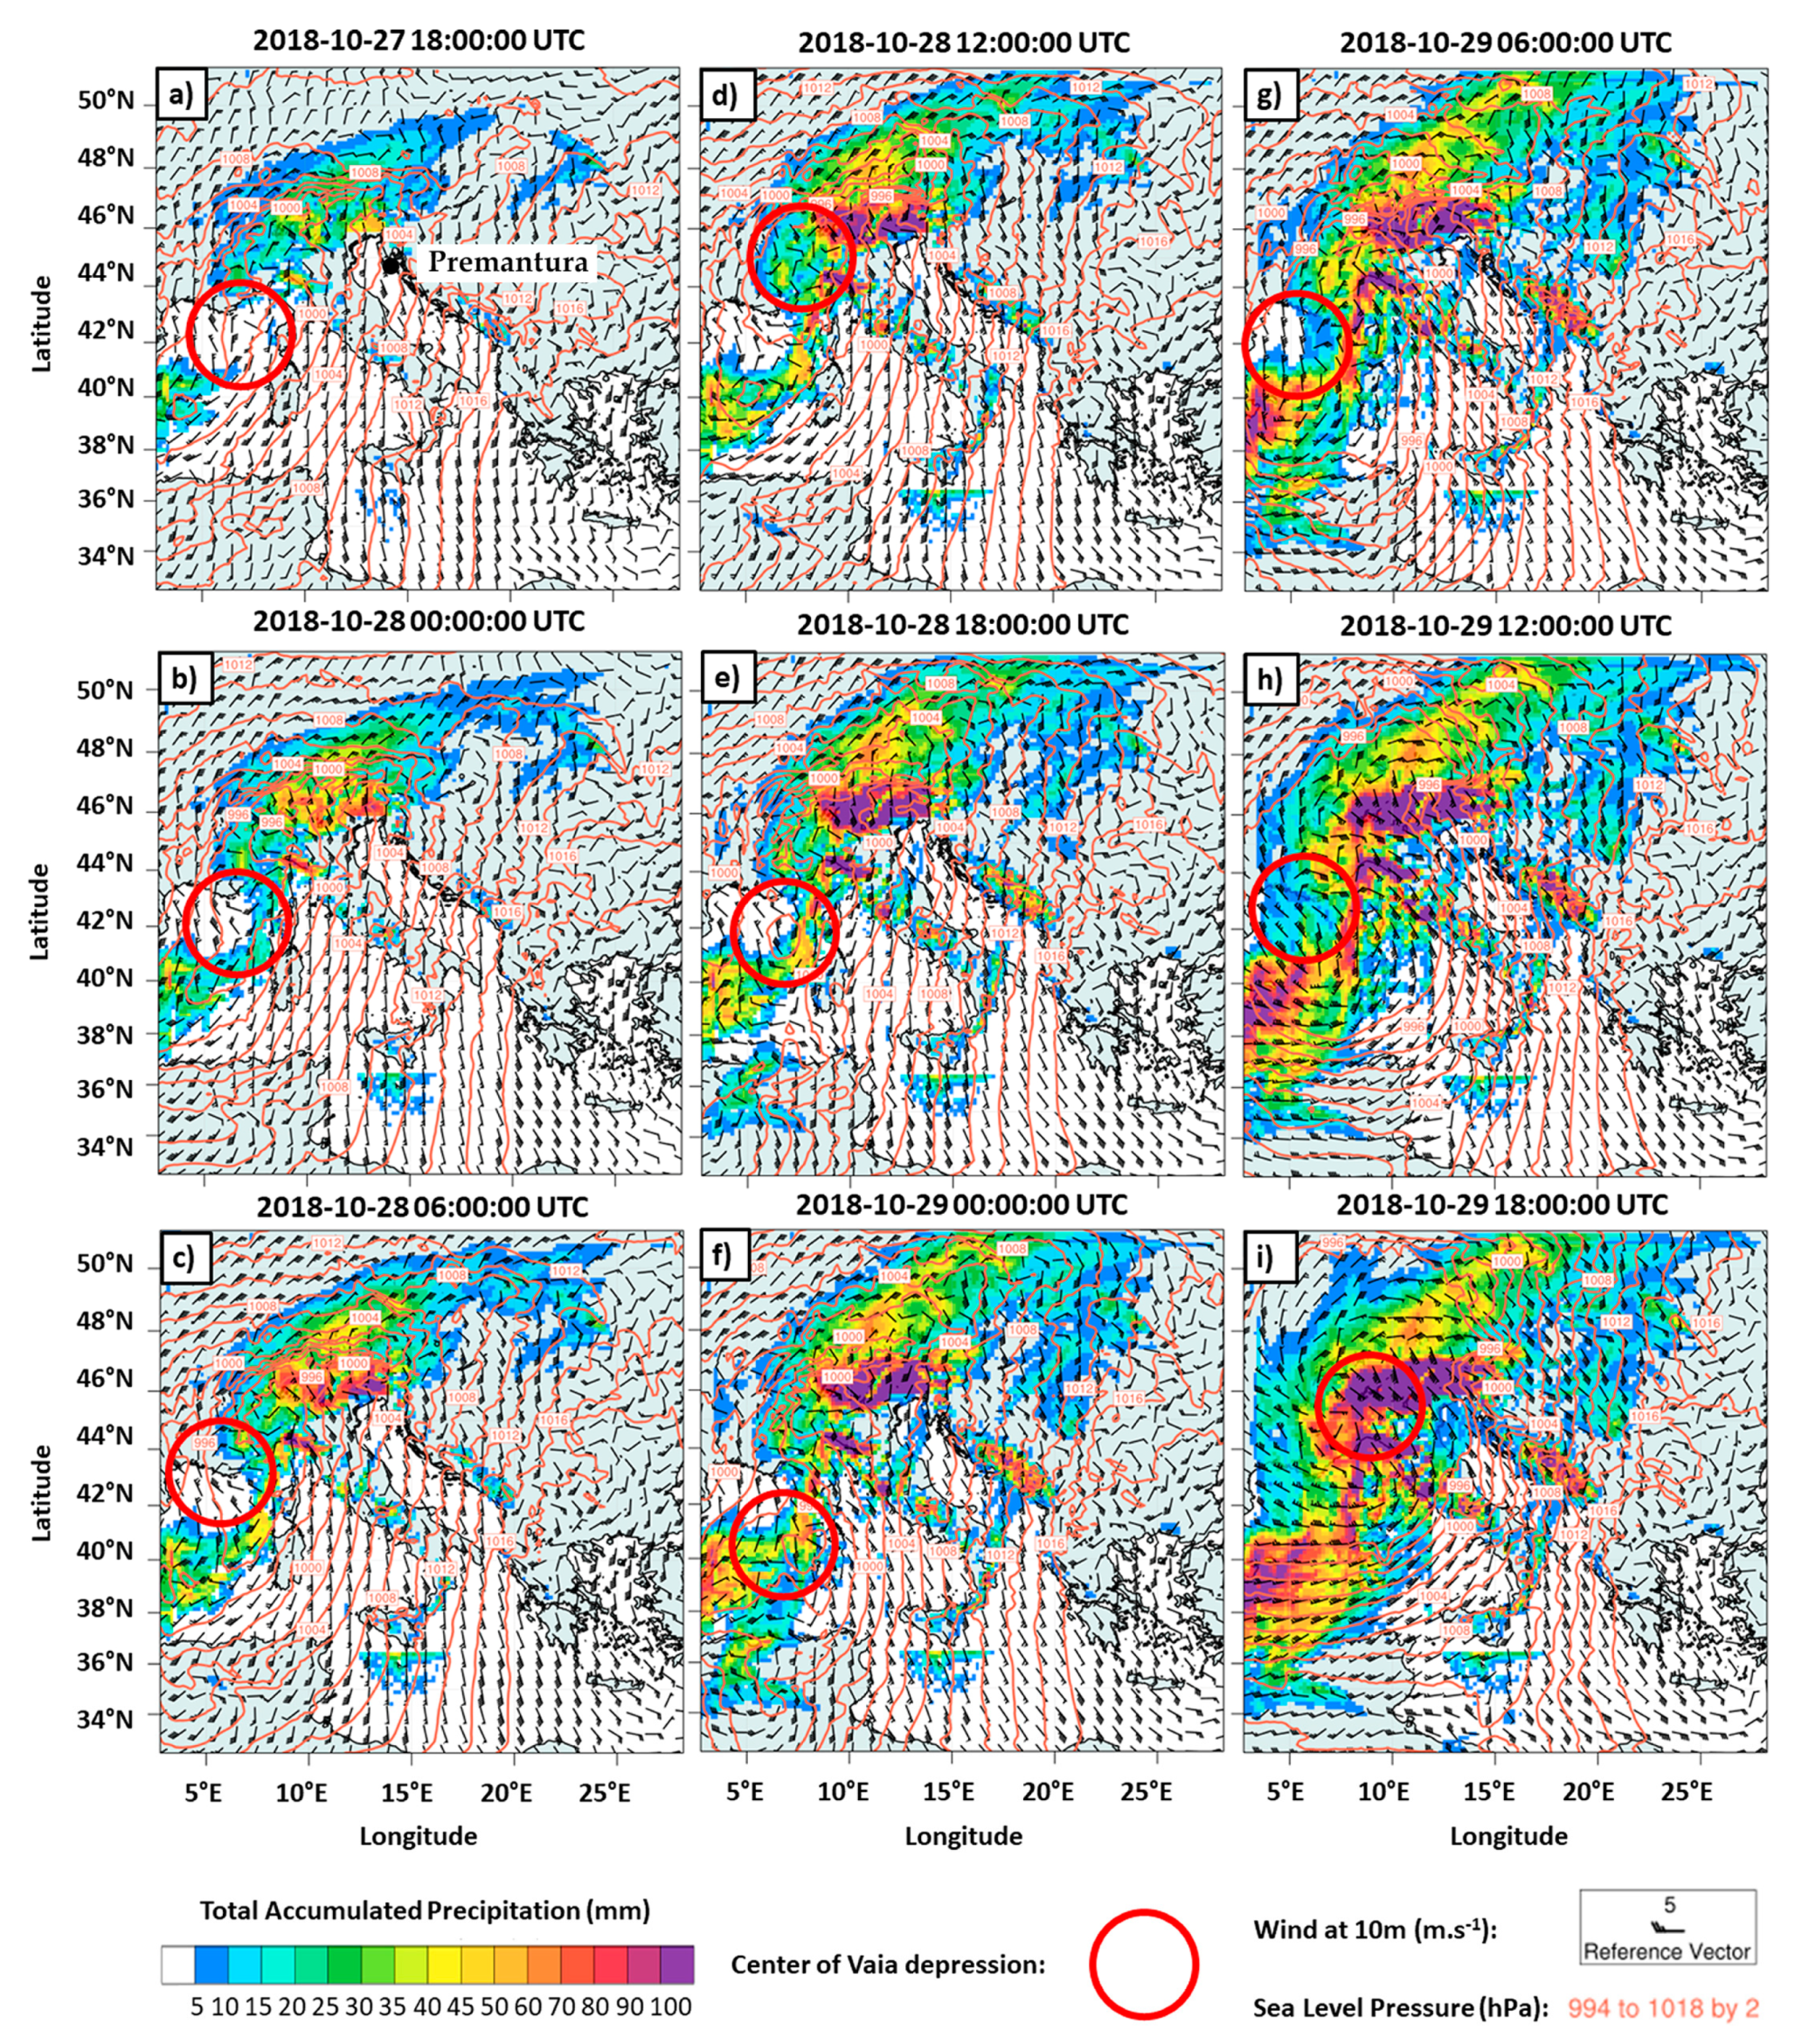
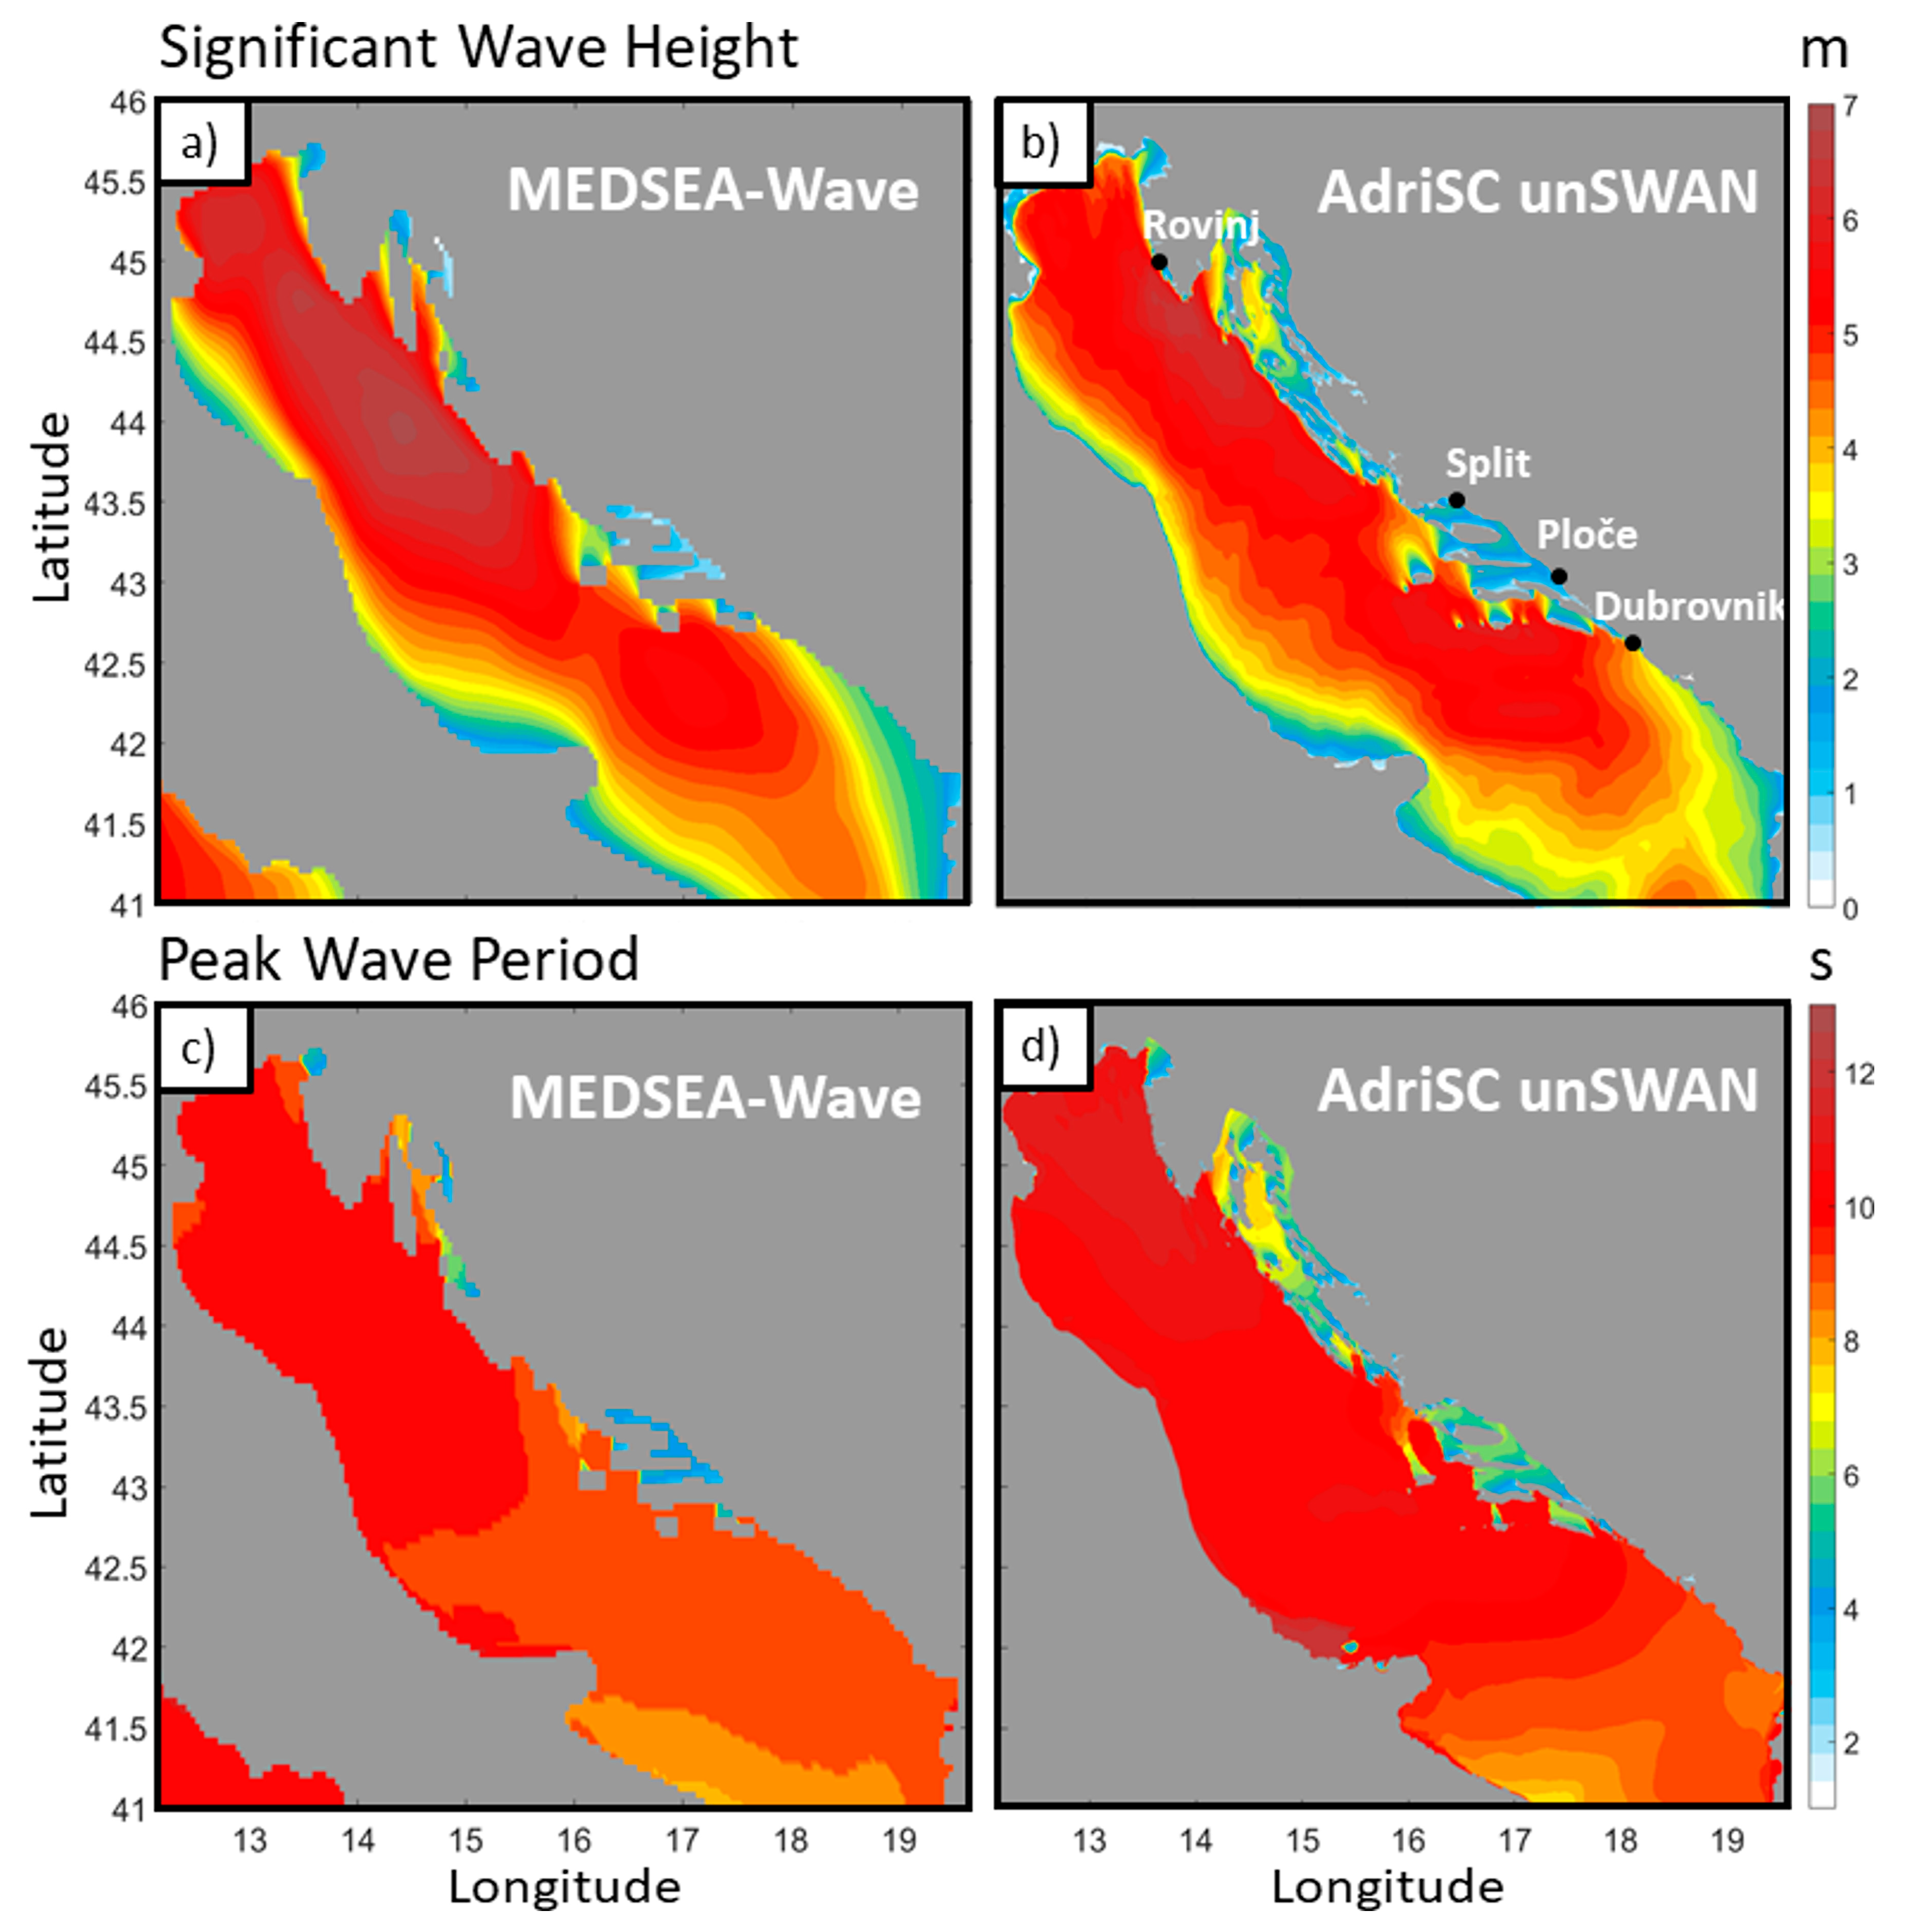
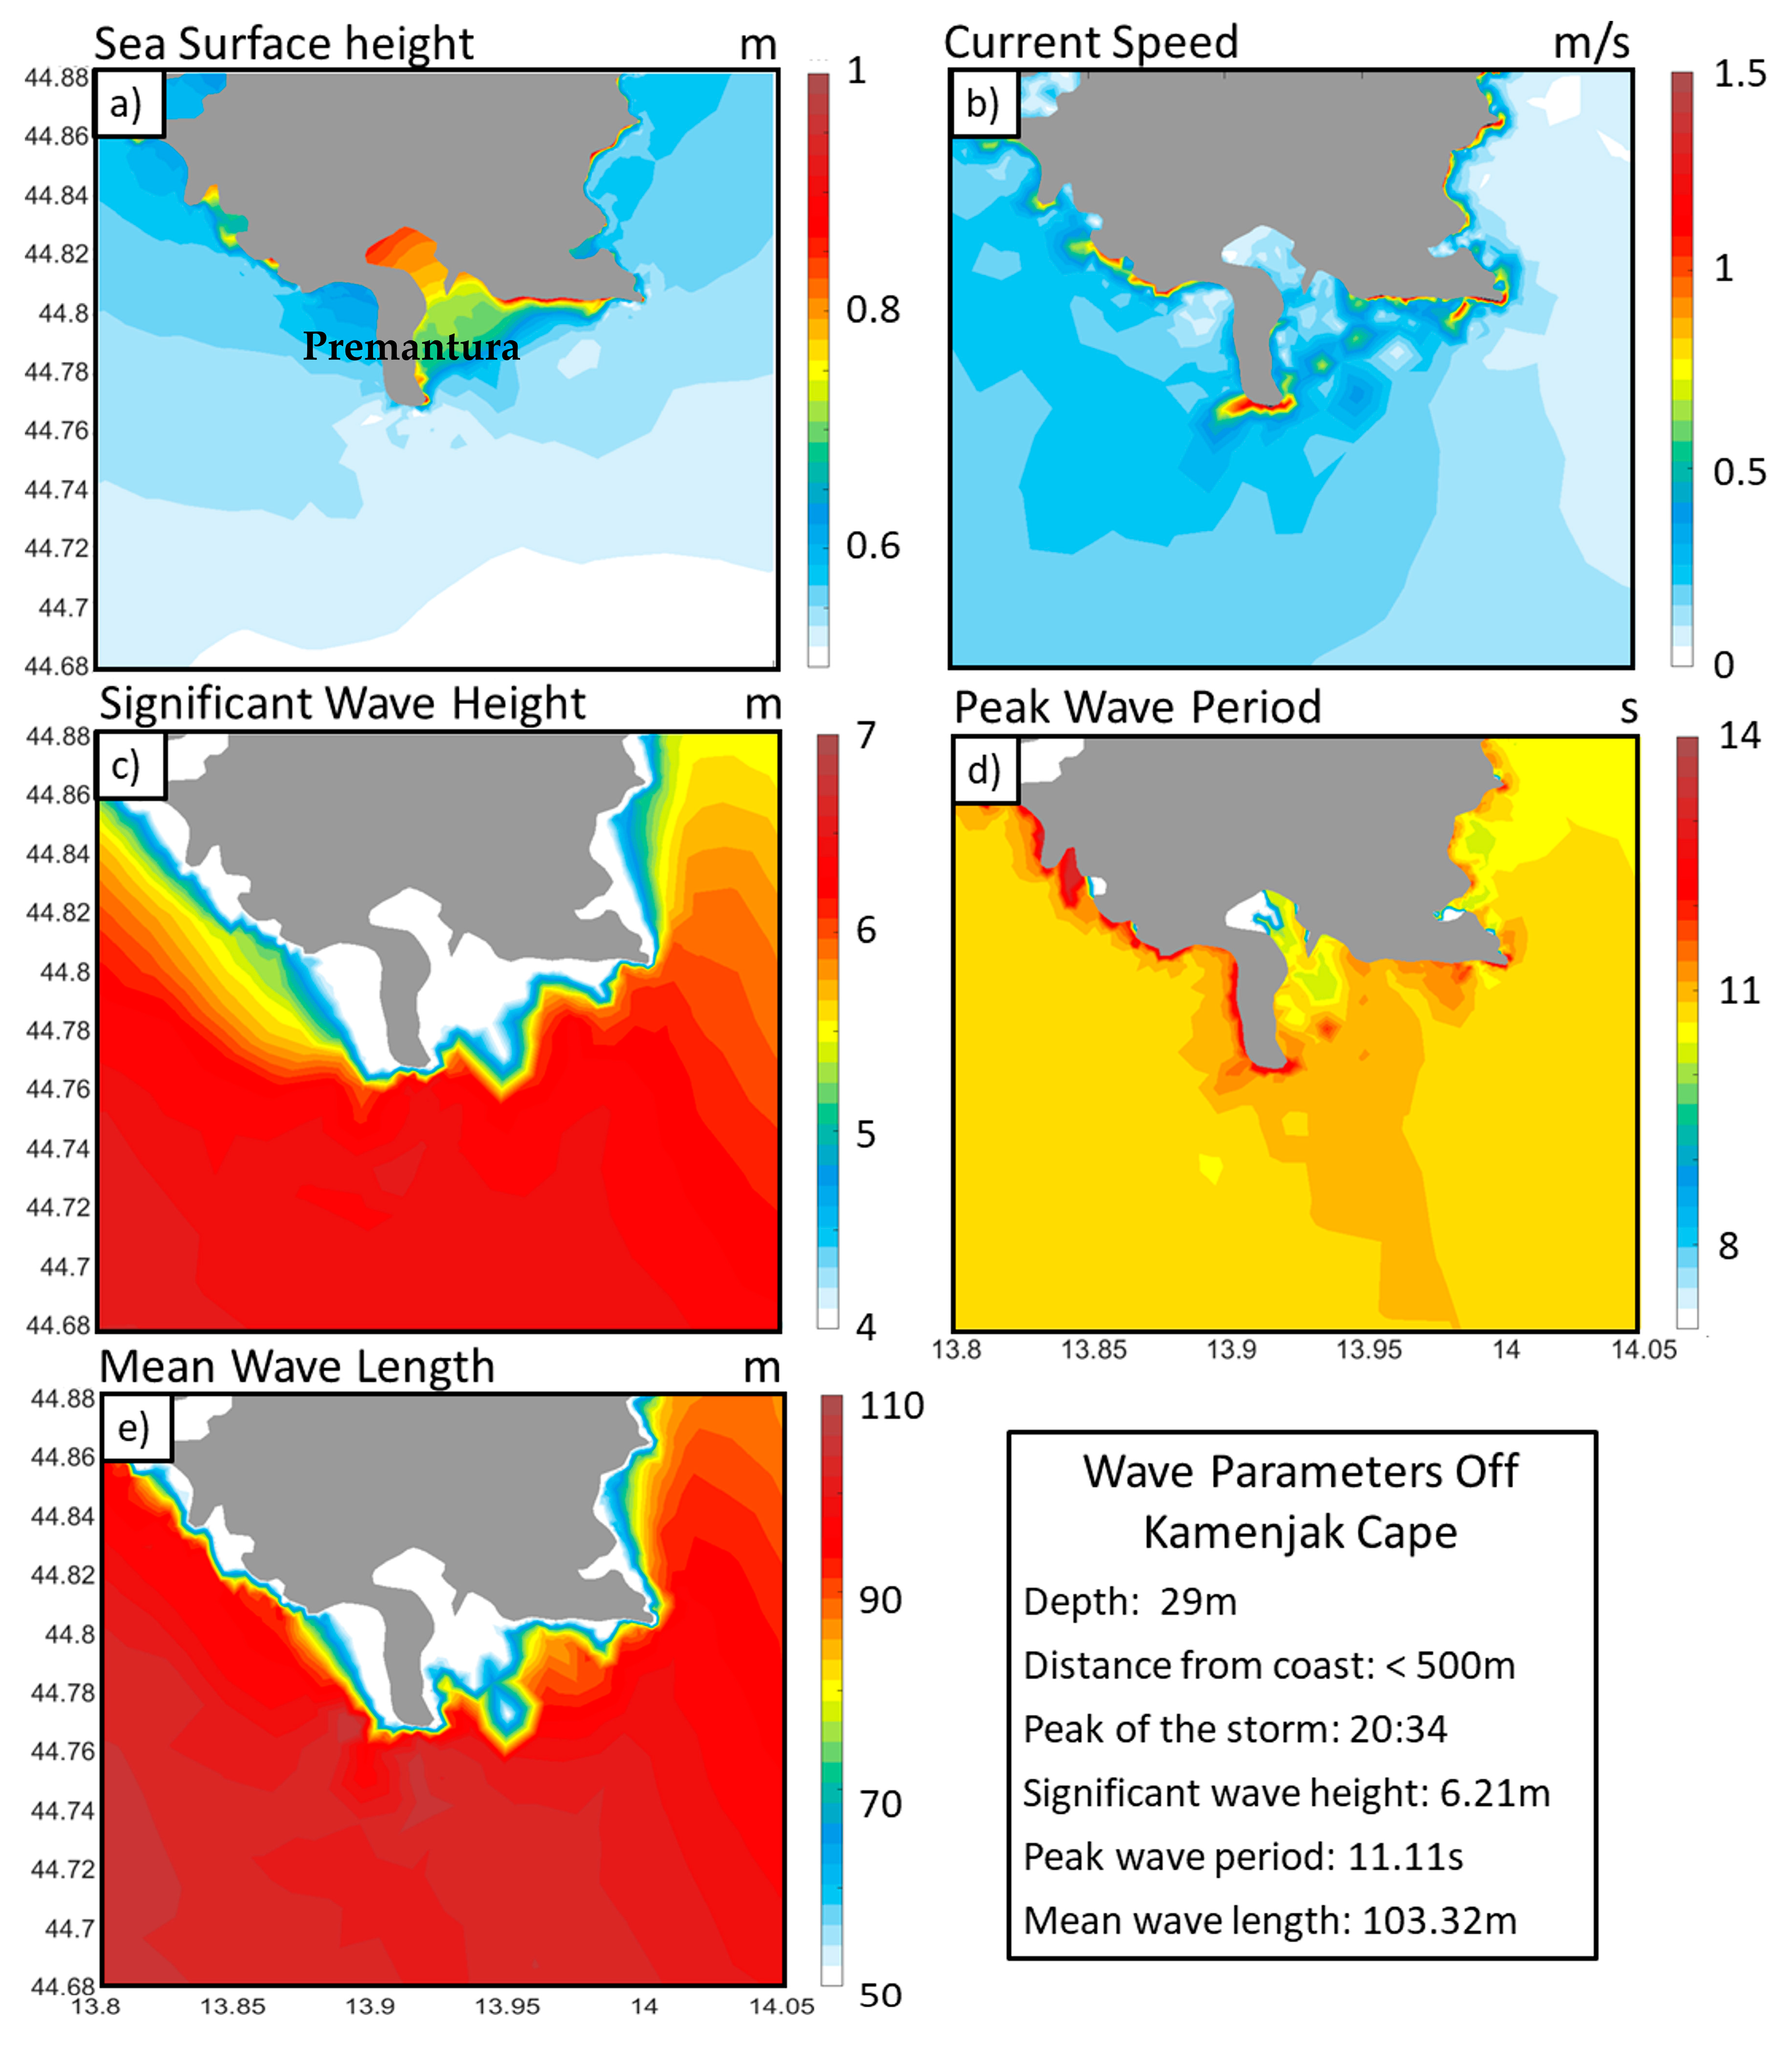
1] and the numerical results (
Figure 2) obtained during this study with the Adriatic Sea and Coast (AdriSC) modeling suite presented in more details in
Section 3.3.
Atmospherically speaking, the Vaia depression developed on Saturday, 27 October 2018, within an extensive low-pressure trough stretching from the Baltic to the western sector of the Mediterranean Sea.
This depression held its position at sea between the Gulf of Lion, the Balearics, and Sardinia until the morning of Monday, October 29. This first phase of the storm was marked by humid Libeccio air currents coming from between the south and southwest, accompanied by intense rainfall events in the northern Apennines and mountainous areas from northwestern Italy to the Carnic Alps (northeastern Italy). By midnight on October 28, more than 300 mm of rain had already fallen in many areas from the Prealps above the city of Brescia to the mountains of Friuli, with a noticeable increase in river flows. After a pause of a few hours, the storm’s second phase, fueled by the arrival of the first major cold front of the 2018 season in the Alps, developed on the morning of Monday, October 29. During the course of the day storm Vaia underwent rapid deepening (about 17 hPa in 18 h), almost classifiable as “explosive cyclogenesis” (the threshold for which is considered a pressure decrease of 24 hPa in 24 h), with the center of the depression moving from the west of Corsica to the northeast during the afternoon and then to northwestern Italy in the evening (red circles in
Figure 2). This deepening of the storm was accompanied by the following: (1) a brutal reinforcement of the winds across Italy, (2) a major strengthening of the Sirocco, and (3) the development of violent self-regenerating storm cells in the area of Sardinia, and the Tyrrhenian and Ligurian Seas. In the afternoon and evening of the October 29th a southeasterly windstorm reached the Adriatic basin while a heavy rain began to fall again on the already saturated soils of the Alps and Prealps but also in Northwest Italy due to its more southeasterly airflow.
The Vaia depression will be remembered not for the rainfall, but for the violence of the Sirocco that blew between morning and afternoon of Monday, October 29, when it swung round to the Libeccio in the evening, starting with Italy’s western sea areas (i.e., measured wind speeds reached 102 km/h at Rome Ciampino airport, 119 km/h at Genoa airport; 128 km/h in Lugano in southern Switzerland, 128 km/h on the Valles Pass in the Dolomites, 148 km/h at Capo Carbonara in southeastern Sardinia, 155 km/h at the Colle di Cadibona near Savona in NW Italy, 171 km/h at both La Spezia and Follonica in Tuscany, and 200 km/h on Monte Rest in the Carnic Prealps in northeastern Italy). The violent southerly gusts of wind, which persisted for many hours along considerable lengths of coastline, raised devastating storm surges, particularly in Liguria, with severe damage to the coastal roads and railways, buildings, and tourist facilities with dozens of boats destroyed in ports. On the evening of Monday, October 29, a buoy belonging to Liguria’s Environmental Protection Agency lying offshore from Capo Mele recorded a maximum wave height of 10.3 m with a very long period of 11 s, an indicator of highly destructive wave power along the coast. Also noteworthy was the episode of high water in Venice and along the northern Adriatic coast, including the Istrian peninsula. In particular, the tide gauge at Punta della Salute (at one end of Venice’s Grand Canal) measured a maximum of 156 cm at 14:10 on 29 October, a value exceeded by only three other events in the historical series since 1872: 1 February 1986 (158 cm), 22 December 1979 (166 cm), and the infamous 4 November 1966 (194 cm).
2. Materials and Methods
The investigations on the boulder accumulation located along the southern coast of the Premantura (Kamenjak) Promontory have been developed through a multidisciplinary approach, which envisaged inland surveys, submarine investigations, and wave modeling.
2.1. Inland Surveys
Field activities have been performed since 2017 and include traditional geomorphological and geological investigations and UAV surveys. Geomorphological and geological activities have included extensive fieldwork and are reported in [
2]. The above-cited paper includes a list of boulders and their axis lengths.
UAVs are widely used in various fields of geoscience [
26,
27,
28] and offer major benefits through their ability to provide high-resolution photographic images from reduced flight times [
29]. The digital photogrammetry (DP) technique enabled the reconstruction of high-resolution orthophotographs and a digital elevation model (DEM) of a large sector of the Premantura area. This reconstruction was done through the processing of 135 images collected by a DJI Phantom drone
TM (DJI, Nanshan District, Schenzen, China) in 2017 (flight altitudes between 20 and 60 m).
These images were processed using Agisoft Photoscan Professional software version 1.4.0 (Agisoft, St. Petersburg, Russia) and the results were processed in 2018 before storm Vaia in a GIS environment using QGIS version 2.18 Las Palmas (QGIS Development Team, QGIS Geographic Information System. Open Source Geospatial Foundation Project).
One of the main outputs of the photogrammetric processing was a detailed map of the position of 950 boulders spread along the Jugo Promontory, as shown in [
2].
In order to carry out a multitemporal photogrammetric survey devoted to recognizing possible movements of blocks triggered by storm Vaia and other future storm events, we performed three drone campaigns in November 2018 (two weeks after storm Vaia) and 2019, using a quadcopter DJI Spark droneTM (DJI, Nanshan District, Schenzen, China), equipped with a 12MP camera. DJIFlightplanner softwareTM (AeroScientific, Blackwood, Australia) and Litchi softwareTM (VC Technology, London, UK) assisted in the choice of 2019 flight plans and permitted the operator to easily set the altitude, radius, number of waypoints, speed, and directions.
We performed two flights on 15 November 2018, and six flights at different altitudes on 30 April 2019, and 14 June 2019. The DJI Spark droneTM executed automatically and autonomously the 2019 flight plans using the Litchi softwareTM installed on the remote controller device.
Table 1 lists which sector of the study area was investigated in each flight and the main characteristics of the UAV surveys.
In order to define the ground control points (GCPs) for the production of georeferenced aerial images, the flights carried out in 2019 were accompanied by a differential global navigation satellite system (DGNSS) survey [
30]. The GCPs were mainly located on the west side of the boulder accumulation where we had noticed the recent movement of the isolated boulder named K8 in [
2], and, we assumed, further possible movements of a few solitary boulders because their distribution was closer to the coastline. The master GCP was located in an area that may not be reached by any boulders, whereas 6 DGNSS bolts accompanied by black-yellow photogrammetric targets were spread in positions clearly identifiable from aerial photos taken in previous UAV campaigns. These DGNNS points were crucial for the quantification of possible boulder motion, with a maximum error of 15 cm calculated on the maximum discrepancy between the reconstructed coordinates and the one measured at the edge of the area.
The images were processed using 3DF Zephyr Aerial softwareTM version 4.007 (3Dflow, Verona, Italy) and detailed orthophotographs of 2018 and 2019 were computed. The best quality photos were taken on the later flights of 2018 and 2019 and for this reason we devoted our attention to these orthophotographs to analyze the western and central sector of the study area. These photos were imported into the QGIS software, which permitted the evaluation of possible boulder rotation and translation transport.
The distance between two known and measurable points on the ground, such as the pothole described in [
2] and the old position of boulder K8 (both clearly visible on aerial photos of 2018 and 2019), was measured using a QGIS tool. This measurement was compared with the real distance measured directly on the ground on 30 April 2018. The difference of approximately 10 cm validates the 15 cm accuracy of the model computed by the 3DF Zephyr Aerial software
TM.
2.2. Submarine Investigations
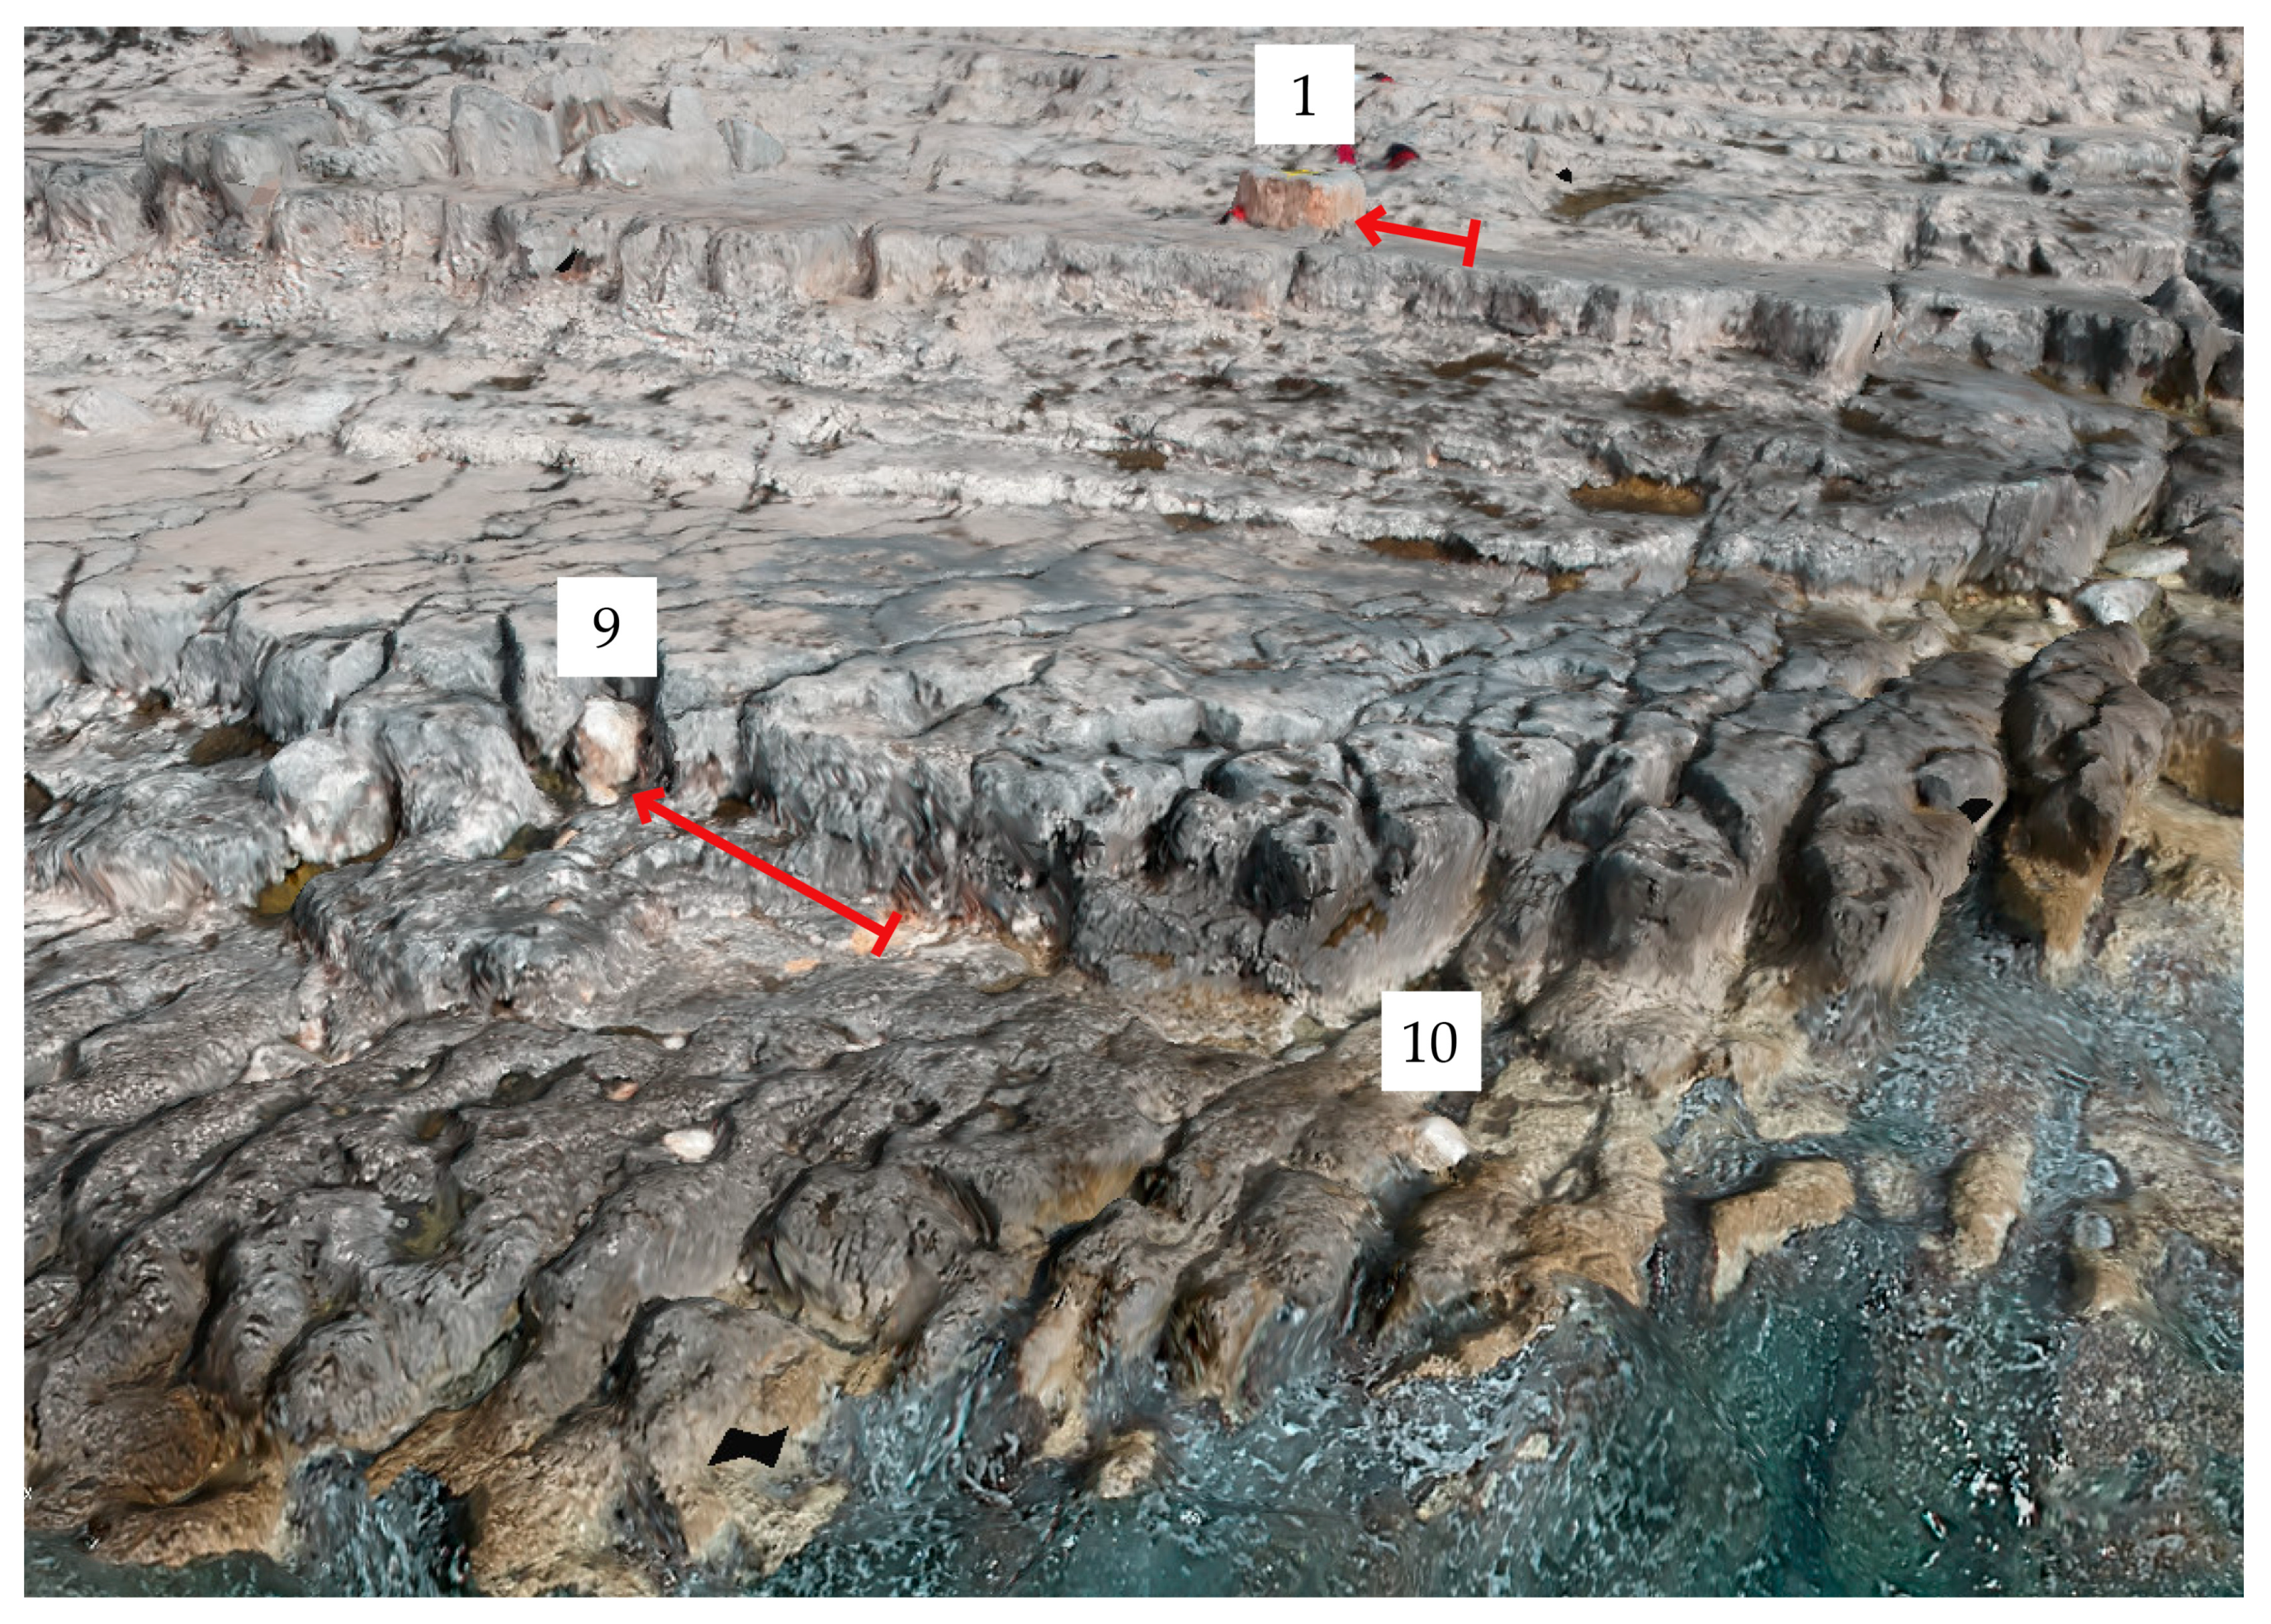
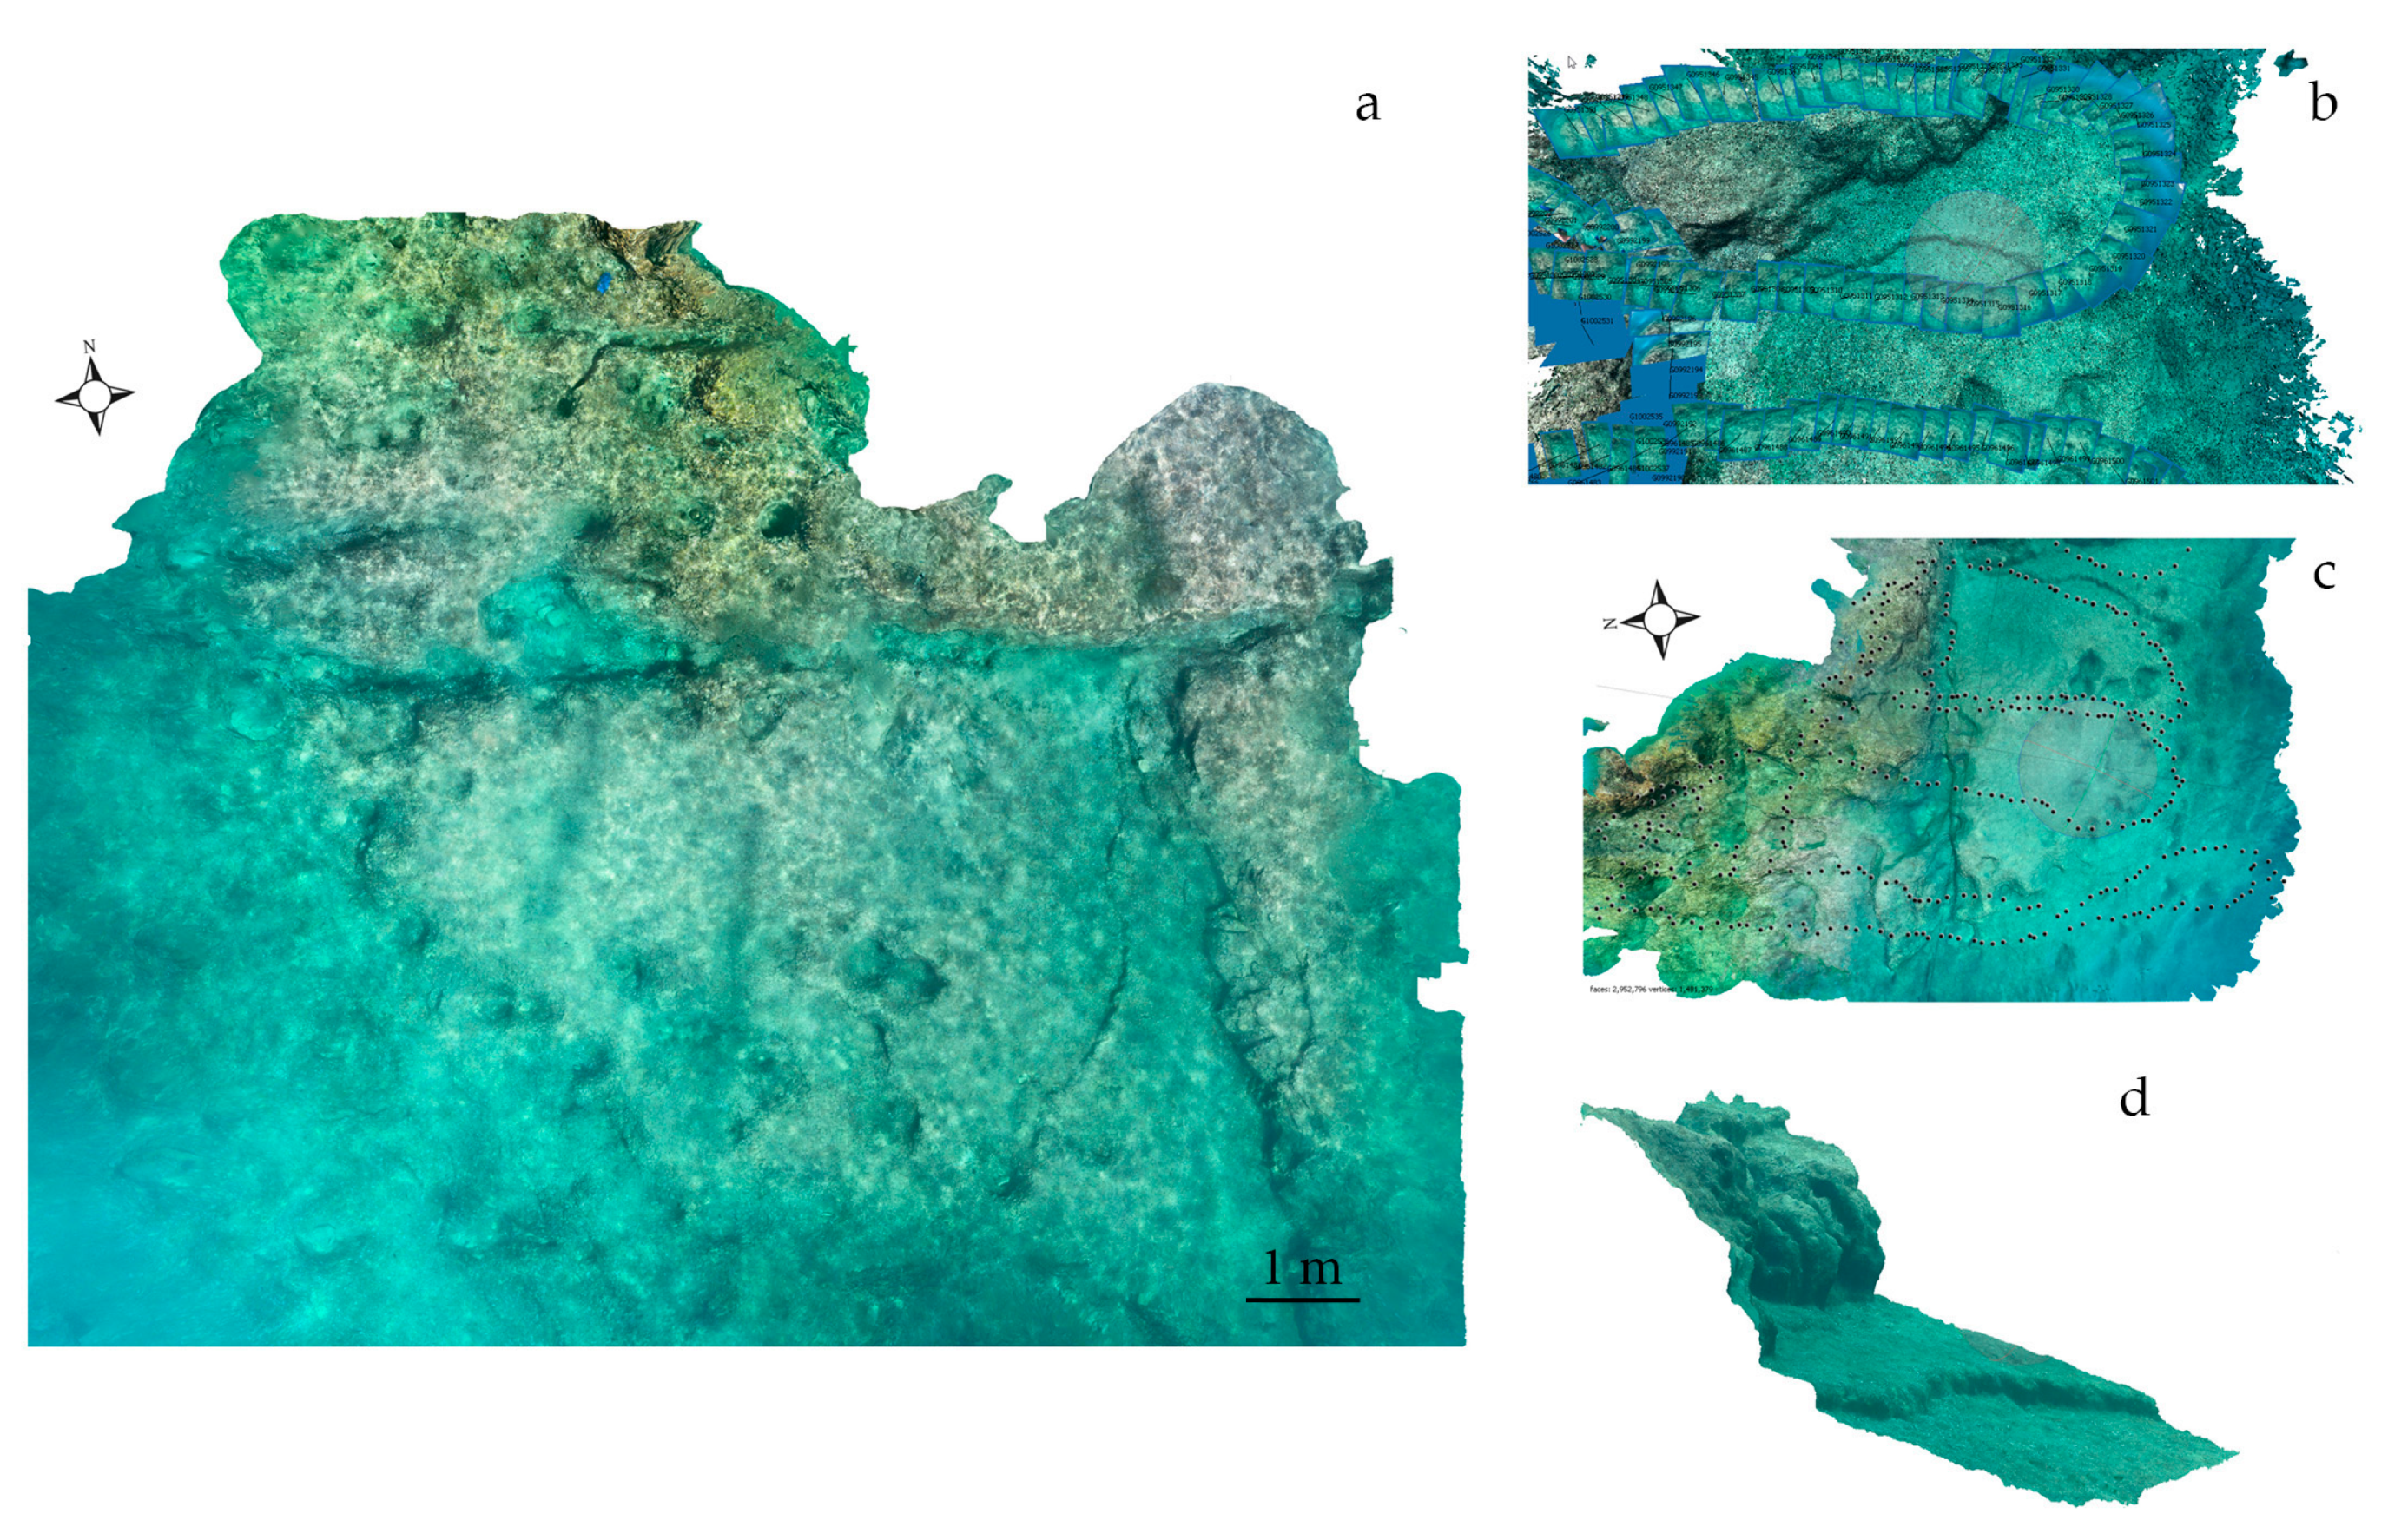
In order to reconstruct the 3D model of the seabed, underwater images were collected via a snorkel survey in June 2019. Photogrammetric procedures are a common and rapid technique to acquire metric measurements in a submarine environment using the combination of field operations and post-processing [
31,
32]. Submerged photogrammetry requires a precise preparation and setting of the images to reduce water refraction and distortion. Underwater photography is vulnerable to the different refraction coefficient of the marine water, which produces a reduction of the field of view (FOV) and a complete change in the optical parameter of the lens [
33]. To reduce the changes in focal length, we used a dome glass. Conversely, this increases the distortion of the system significantly. In this work, a ”quick and dirty” procedure was applied to evaluate the limitations of a low-cost approach using GoPro action cameras together with the capability of acquiring good quality data snorkeling from the surface. Action cameras are usually equipped with wide-angle lenses and the option of selecting a narrow FOV via software adjustment, losing a large percentage of the sensor resolution and resulting in a low-quality set of photos. We operated in full resolution to manage the wide FOV resulting in strong distortion and a huge color cast at the picture boundaries.
The 3D model was assembled in Agisoft Metashape TM (Version 1.5.0) starting from a selection of 916 of the 1200 images produced by a GoPro Hero 6 BlackTM (GoPro, San Mateo, California, USA) set in a six inch waterproof plastic case.
In order to remove the color cast and the large amount of suspension present at the picture corners, a mask was applied to each photo. This strategy removed almost one-third of the pixels belonging to the area with the strongest distortion and permitted a precise alignment.
To better cover the submarine area, an S-shape route was followed with a time-lapse camera set to 0.5 s. Therefore, the overlap of the underwater images was higher than in the aerial photogrammetry. This procedure avoided inaccurate orientation of the cameras at different depths of the seabed [
34].
2.3. Wave Modeling
The numerical modeling was carried out using the Adriatic Sea and Coast (AdriSC) modeling suite, that was jointly developed within the ADIOS [
35] and MESSI [
36] projects with the aim of accurately representing the processes driving the Adriatic’s atmospheric and oceanic circulation at different temporal and spatial scales. This modeling suite consists of: (1) a basic module that deals with the coupled ocean and atmospheric general circulation and (2) a nearshore module that provides high-resolution fields during extreme events.
The basic module is based on the Coupled Ocean–Atmosphere–Wave–Sediment Transport (COAWST) modeling system [
37]. The module is built around the Model Coupling Toolkit (MCT), which exchanges data fields and dynamically couples the Weather Research and Forecasting (WRF) atmospheric model, the Regional Ocean Modeling System (ROMS), and the Simulating WAves Nearshore (SWAN) model. The basic module was set up with (1) two different nested grids of 15 km and 3 km resolution used in the WRF model and covering the central Mediterranean area and the Adriatic-Ionian region, respectively, and (2) two different nested grids of 3 km and 1 km resolution used in the ROMS and SWAN models and covering the Adriatic-Ionian region (the same grid as the WRF model) and the Adriatic Sea, respectively.
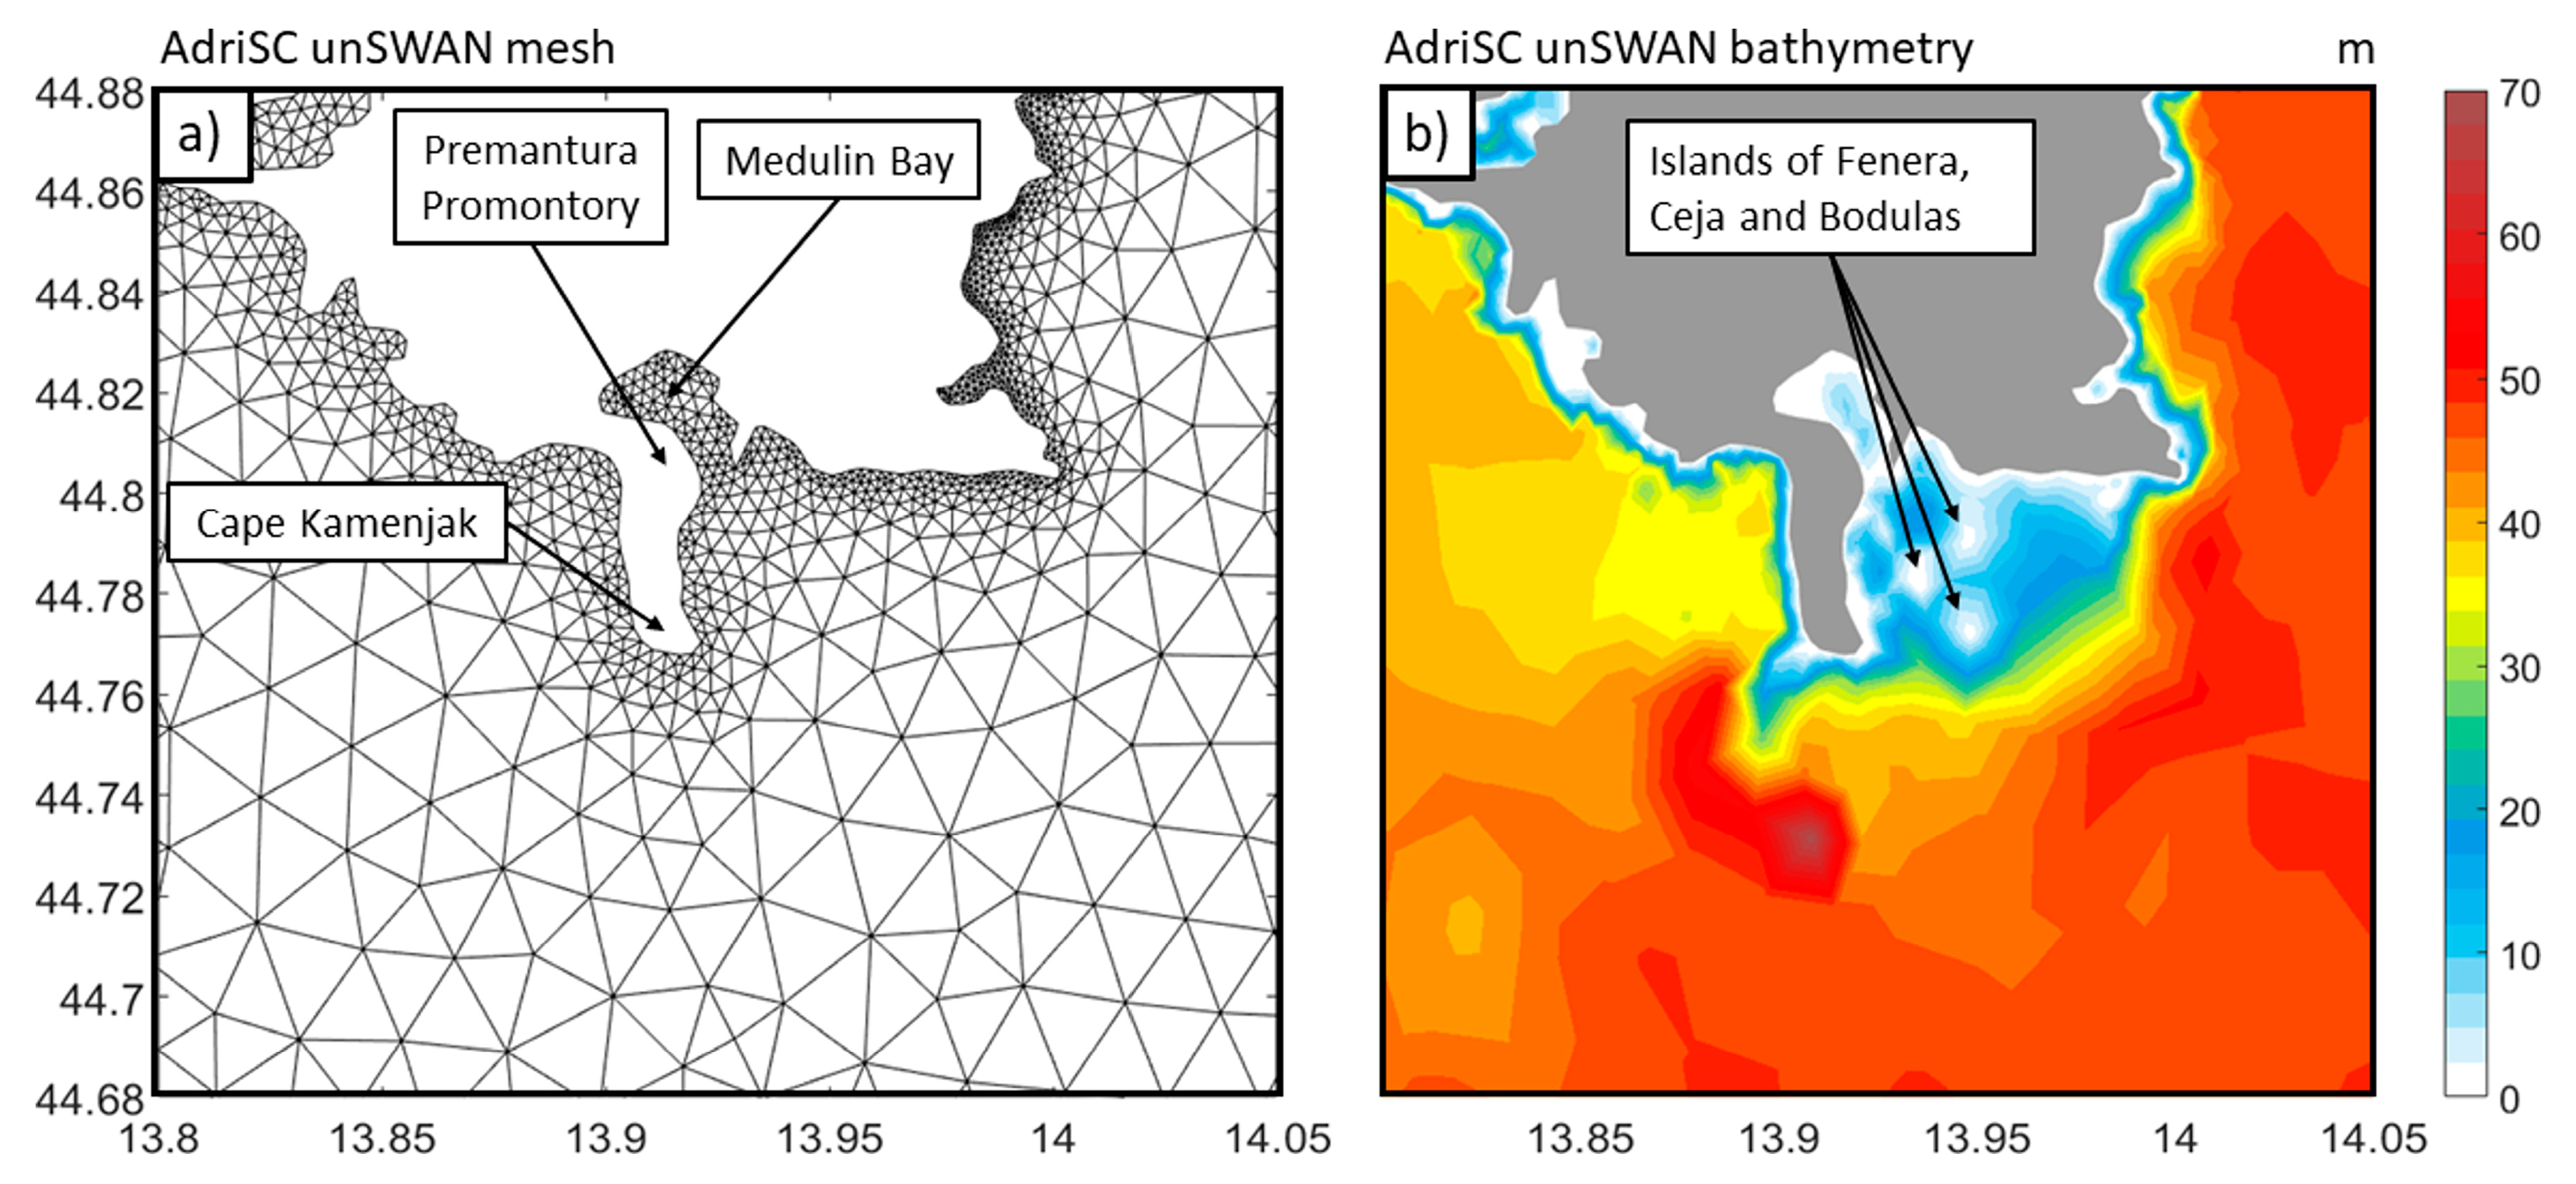
The nearshore module additionally accounts for the nearshore bathymetry changes and combines the WRF model with the fully coupled ADCIRC-SWAN unstructured off-line model [
38]. In this module, the hourly results from the WRF 3 km grid obtained with the basic module were downscaled to a 1.5 km grid covering the Adriatic Sea, while the hourly results from the 1 km ROMS grid and the 10 min results from the 1 km SWAN grid are used to force the unstructured mesh of the ADCIRC-SWAN model.
The AdriSC modeling suite was installed and fully tested on the European Centre for Medium-Range Weather Forecast (ECMWF) high-performance computing facilities. More details on the AdriSC modeling suite setup can be found in [
39].
In this study, in order to reproduce the storm which took place in the Adriatic Sea on 29 October 2018, the SWAN model was set up in both modules to be coupled with the oceanic and atmospheric models (i.e., WRF, ROMS, and ADCIRC). In addition, the computation of the bottom stress of the ocean models (respectively, ROMS and ADCIRC) was updated in order to consider the spatial distribution of the sediment grain size at the bottom of the Adriatic Sea, extracted from the Adriatic Seabed database [
40], and the wave effects. To reproduce the storm as accurately as possible, the basic module was set up to run for three days between 27 October and 30 October 2018, with initial conditions and boundary forcing provided by (1) the 6 hourly ERA-Interim reanalysis fields [
41], (2) the daily analysis MEDSEA-Ocean fields [
42], and (3) the hourly MEDSEA-Wave fields [
43]. The nearshore module, forced by the results of the basic module, was set up to run between midday on 28 and 30 October 2018.
In this study, only the wave results from the unstructured SWAN model of the nearshore module (hereafter referred to as AdriSC unSWAN) were analyzed.
Due to the lack of precise bathymetry data and resolution in the nearshore area where the waves are breaking (i.e., surf zone) and the known limitations of the physics used in the SWAN model (e.g., the parametrization of the wave breaking), the wave heights modeled by the AdriSC unSWAN module during the event were extracted off the surf zone (ideally in deep water) and the Sunamura and Horikawa equation [
44] was applied to evaluate the wave height at the breaking point, Equation (1):
where
Hb is the breaking wave height;
H0 and
L0 are the wave height and the wave length off the surf zone (ideally in deep water), respectively; and
β is the slope of the seabed near the coast (i.e., in the area where the waves are expecting to break). Finally, the breaking wave height obtained was compared with the hydrodynamic model proposed by Nandasena et al. [
45] which is extensively used in the literature to define the storm wave heights capable of detaching and transporting coastal boulders.
4. Discussion
The comparison of orthomosaics obtained from UAV images, repeated annually, can be a very useful tool for monitoring the variation of the boulder positions. This methodology has been successfully applied in both North Atlantic [
11,
12,
13,
48] and Mediterranean boulder sites [
49]. UAV-derived orthophotographs and digital surface models (DSMs) can provide excellent data and information on coastal boulder patterns. Orthophotographs allow for the mapping of a axes and b axes, including their orientation, whereas precise values for c axes and boulder volume can be taken from the DSM [
50]. In recent years, after an initial decade when the analyses were mostly dedicated to explaining boulder detachment and transport mechanisms and distinguishing between those of tsunamigenic and those of storm origin, boulder studies are now more oriented towards the observation of boulder movements and reassemblage after exceptional storm events [
13,
50]. In addition, Hastewell et al. [
51] have proposed an innovative technique for boulder movement reconstruction, using radio frequency Identification (RFID) tagging and DGNNS technology. A single RFID tag is inserted inside a boulder and can be activated with an electromagnetic signal emitted by a pole antenna moved by an operator also equipped with a backpack reader and a handheld computer.
On the Premantura Promontory, where the origin of the boulders has been ascribed to storm events, totally excluding those of tsunami origin [
2], and where boulders analysis began only recently (end of 2016), a proper monitoring network including orthophotograph comparison, both aerial and submarine, geomorphological observation, instrumental monitoring techniques, and numerical modeling, is most definitely needed as severe storms are forecast to increase in the near future [
52].
Following the long-term monitoring experience of coastal landslides affecting the northwestern part of Malta [
53,
54,
55], a network of GNSS benchmarks has also been installed in Premantura. At the same time, the submarine 3D model, presented here, could be the starting point for monitoring the effects of future storms in the underwater environment, that represents the source area for the quarrying and detachment of future boulders. Finally, every day since early 2019, the AdriSC operational component has been providing a 48 h forecast of high-resolution wave parameters, which can be used to detect in advance whether or not a potential storm can move boulders.
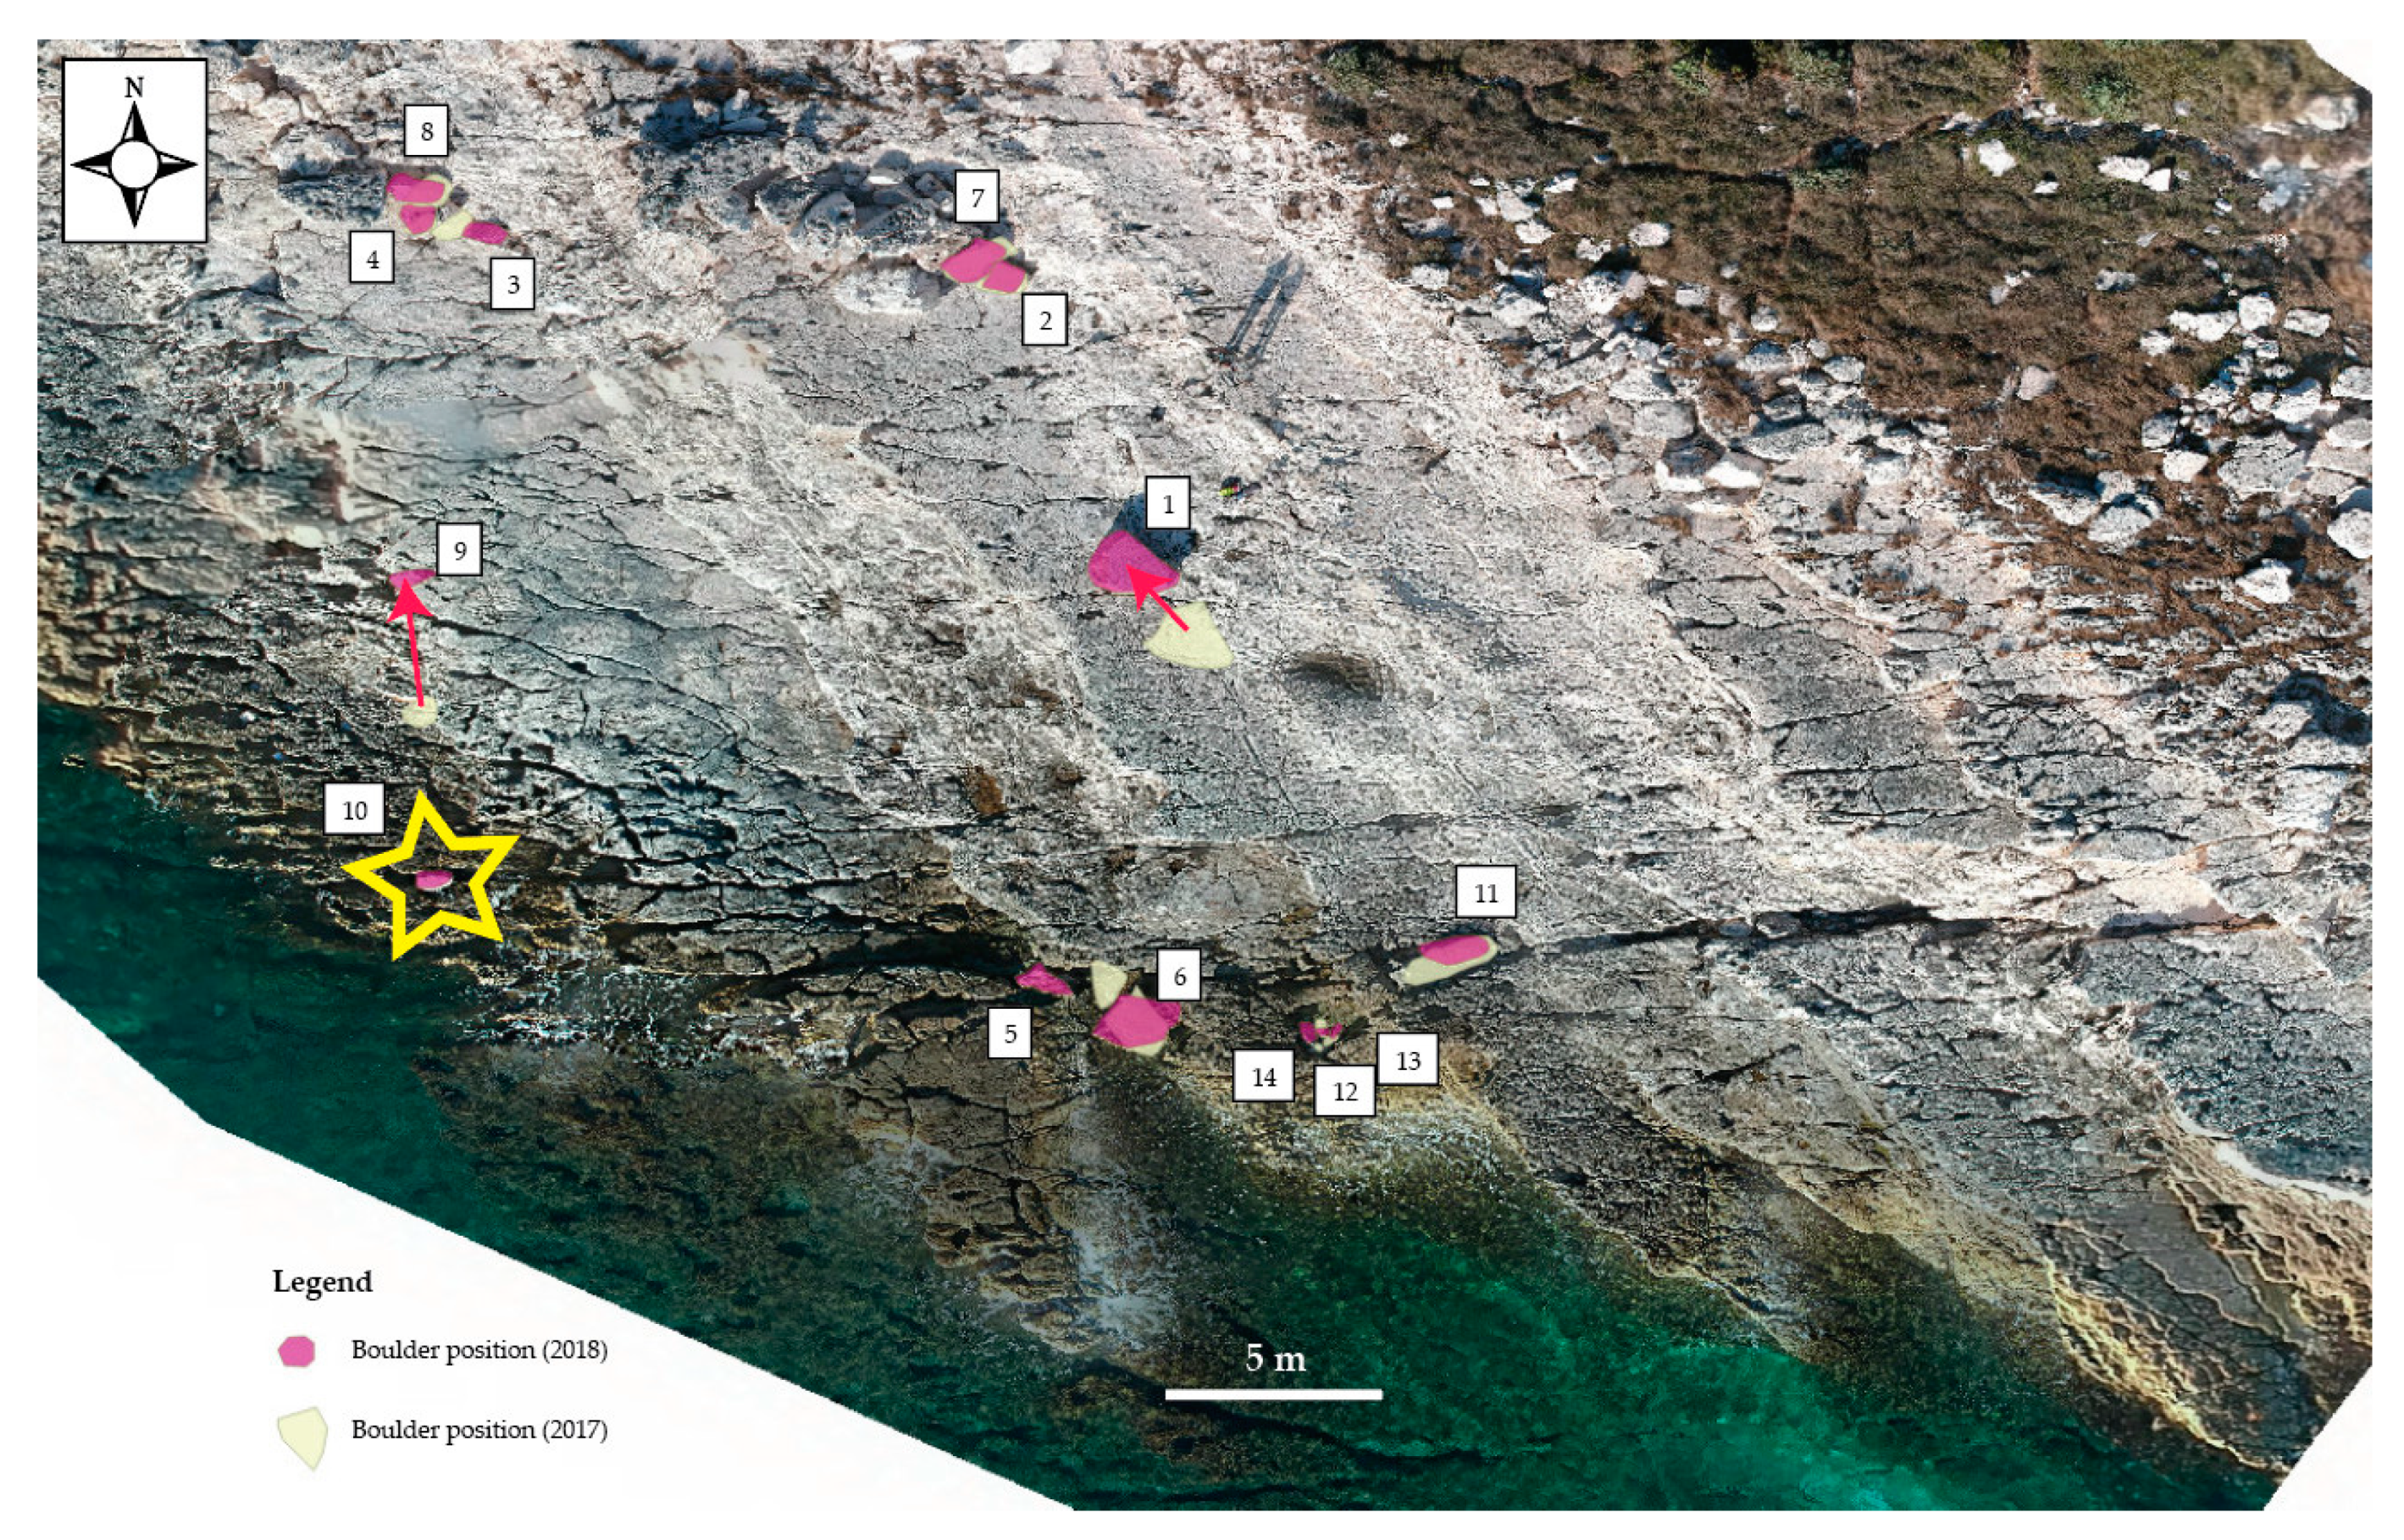
By comparing UAV-derived orthophotographs, we detected the movement of 13 boulders and the emplacement of a new one after a severe storm. The western part of the boulder field suffered the intensity of the last storm most, whereas the central and eastern part did not show any evidence of boulder movements. This lack of movement is related to the structural setting of the promontory, where, in the central and eastern sectors the boulders (probably older) are located at higher elevations. Thus, active erosion occurs in the western part of the Jugo Promontory (Cape Kamenjak).
By observing boulder movements (
Figure 4), the maximum inundation flow of the storm waves capable of transporting boulders was estimated to about 50 m of distance from the coast (that has been measured considering wave directions and orientation of the limestone ramps). The displacement followed the azimuth of the limestone beds strikes that, in turn, have conditioned the detachment of rocky material forming scarps throughout the past. These scarps, together with flat, gently inclined limestone bedding planes (pavements), have acted as ramps for boulder transport. Isolated boulders, such as boulder #1 (K8 in [
2]), are those that have been subject to the largest movements, while the boulders gathered in clusters were only rotated or toppled, but remained in position, trapped by other boulders or the abovementioned scarps, fractures, and faults. The latter, in particular, have been enlarged over time by coastal karst and marine weathering, as well as by the removal of small portions of rocky material. Some boulders exhibited signs of fragmentation, due to collisions with other boulders or against the rocky scarps.
The submerged scenario, accurately obtained using digital photogrammetric reconstructions, is a high energy environment, with fresh detachment scarps and rounded or sub-rounded potholes, where decimetric cobbles and boulders lie and move, causing the abrasion of the rocky seafloor. The topographical setting of the seafloor reflects the coastal geomorphology and topography, where limestone beds alternate with scarps and faults. With respect to the previous underwater geomorphological surveying, any recent detachment scar has been noted, while a clear detachment niche has been reconstructed in detail. The 3D submarine model obtained, reconstructed using digital photogrammetric analysis of underwater pictures, will be the starting point for future monitoring of the submerged environment, both before and after exceptional storms, that may affect the Adriatic Sea even more given the future climate predictions [
56].
After three years of studies and surveys, we can state that storm wave erosion at the Premantura site is active. The appearance of new boulders (especially the seven tonne boulder #1 during the 2014 storm) attests to a dynamic process of sea erosion that is continuously changing the coastal setting. As already suggested by [
2], the erosion process was more intense, in the past, when the coast was initially brought into contact with the sea, and the removal of rocky material due to the repetitive action of waves began. Radiocarbon dates provided by [
2] suggests that this process has been active over several centuries.
Regarding the numerical modeling, the AdriSC modeling suite presented some skills to reproduce storm Vaia and the unSWAN wave model provided high-resolution wave parameters in the vicinity of Premantura with an unstructured mesh capturing the global geomorphology of the area. The models also allowed for the quantification of the coastal dynamics, particularly the total elevation, including the wave set up and the wave-induced currents, which may significantly impact the wave field when reaching values as high as those modeled off the Premantura Promontory. However, the wave results indicate that the storm produced an estimated maximum wave height of 13.6 m at the breaking point near the area of interest, which was not enough to move Boulder #7. The hydrodynamic equations were used to have an idea about the wave height. The model of Nandasena is mostly used and generally presents a good fit with the measured waves, such as in our study. Of course, the model has its limits and does not offer a precise wave height. The parameters of the equations, such as the lift coefficient, which was calculated using laboratory experiments by [
57] for certain particle size and density conditions, are probably not applicable to the local geological, topographical, and climatic conditions where boulders move.
This study shows the following: (1) the need to accurately survey the nearshore bathymetry in the vicinity of the Premantura Promontory (e.g., via shipborne single-beam, multi-beam, side-scan sonar sensors or airborne laser scanning bathymetric surveys) and (2) the limitation of using the SWAN model which, contrarily to the XBeach model [
58] — which is developed for wave propagation, sediment transport and morphological changes of the nearshore area, beaches, dunes and backbarriers during storms, cannot correctly reproduce the dynamics in the swash zone (i.e., the land-ocean boundary) where some of the boulders are located. This study provides the first attempt to model the wave conditions responsible for the boulder motion during storm events in the Premantura Promontory, but more modeling efforts and better bathymetry data will be required in the future to truly quantify the wave effects on the boulder dynamics, particularly in the swash zone as described in [
59,
60]. In addition, the return period of the wave height modeled during storm Vaia, in the northern Adriatic Sea, is about 20 to 30 years. Given that the most extreme storms could, although not significantly, tend to increase slightly in the northern Adriatic Sea in future climate scenarios [
61], this might, together with the increase in mean sea level, increase the erosion of rocky coasts. Additionally, other areas, such as the lowlands along the coasts of the northern Adriatic Sea (some of which are subsiding) [
56], or the coastal cities with substantial cultural heritage [
62], may even be more endangered by the combination of mean sea level and wave activity. Therefore, both these factors should be included in any assessment of the vulnerability of the northern Adriatic Sea to climate change.
Finally, taking into account all the geomorphological observations, the aerial orthophotographic comparison, the wave data in a time range of 1 year (from November 2017 to November 2018), and the wave results from the AdriSC model during the storm, the recent boulder movements and rearrangements can be definitively linked to the 29 October, storm Vaia.
5. Conclusions
The Premantura Promontory represents a unique example of an extensive coastal boulder accumulation in the northern Adriatic Sea triggered and rearranged by storm waves, as reported by [
2] and confirmed in the present study.
The occurrence of this kind of boulder deposit depends on various factors (i.e., the discontinuity network, marine wave direction, and coastal exposure) and for these reasons the integration of underwater and onshore surveys is crucial in the understanding of the processes involved in boulder transport.
The integration of geomorphological surveys and multitemporal UAV-DP permitted the identification of 13 boulders that were moved or rotated and the emplacement of a new boulder during the severe storm that hit the northern Adriatic coasts on 29 October 2018, i.e., storm Vaia.
The western part of the promontory suffered the greatest impacts of the waves as a result of the structural settings of the limestone layers that acted as favorable pavements for the movements of the boulders.
The wave model confirmed that the storm waves had the potential to move these boulders during the storm Vaia event.
Boulder movement on the Premantura Promontory is, thus, linked to the frequency of exceptional storms capable of generating extreme wave heights. Following previous studies carried out in the Adriatic Sea, the return period of the waves modeled during storm Vaia is roughly 20 to 30 years, however, in the last four years, at least two major extreme storms have affected the northern Adriatic Sea (2014 and 2018), causing breaking waves exceeding 10 m height and capable of causing boulder movements.
We demonstrated that the tsunamogenic origin for coastal boulders movements is not required, especially where and when severe waves repeatedly hit the coast. In fact, in the study area the topographical and the geomorphological setting, together with the exposition of southern Istria towards the most severe winds and waves of the Adriatic Sea, favoured boulder detachment and accumulation.
Ongoing research should mainly focus on the improvements of the DP procedure in submarine environments and on the analysis of outputs of DGNNS surveys. Survey zero was carried out on 30 April 2019, when six GNSS benchmarks were installed on six boulders already displaced by storm Vaia. Moreover, the underwater 3D model could be the basis for future comparisons of submerged environments after future storms.

 ,
, 


