Abstract
Climate change is expected to affect the water cycle through changes in precipitation, river streamflow, and soil moisture dynamics, and therefore, present a threat to groundwater and surface water-fed wetland habitats and their biodiversity. This article examines the past trends and future impacts of climate change on riparian, water-dependent habitats within the special areas of conservation (SAC) of the Natura 2000 network located within Odra and Vistula River basins in Poland. Hydrological modelling using the Soil and Water Assessment Tool (SWAT) was driven by a set of nine EURO-CORDEX regional climate models under two greenhouse gas concentration trajectories. Changes in the duration of flooding and inundation events were used to assess climate change’s impact on surface water-fed wetland habitats. The groundwater-fed wetlands were evaluated on the basis of changes in soil water content. Information about the current conservation status, threats, and pressures that affect the habitats suggest that the wetlands might dry out. Increased precipitation projected for the future causing increased water supply to both surface water and groundwater-fed wetlands would lead to beneficial outcomes for habitats with good, average, or reduced conservation status. However, habitats with an excellent conservation status that are already in optimum condition could be negatively affected by climate change as increased soil water or duration of overbank flow would exceed their tolerance.
1. Introduction
Wetland bio-production has been used by man for many centuries, including fish for protein, peat for fuel, and timber and reeds for building materials [1]. More recently, it has been shown that wetlands play a vital role in the hydrological cycle, controlling flood generation, groundwater recharge, dry season flows [2], and water quality [3]. In order to maintain ecosystem services, it is essential to keep an appropriate hydrological regime within a wetland. This regime is related to the source of water which is different for specific kinds of wetlands [4] and may be altered by rising temperatures and changing patterns of precipitation [5]. Natural ecosystems are exposed to periodical changes of the habitat state, and due to evolution, they are well adapted to a wide range of amplitudes of abiotic conditions. However, the rapidity of the ongoing and projected climatic change manifested by rising temperatures and different rainfall patterns, combined with high anthropopressure may impact particular ecosystems beyond the resilience point, so that they could not bounce back [6].
Climate change and its implied threats are among the utmost challenges of modern times. According to Intergovernmental Panel on Climate Change’s (IPCC) Fifth Assessment Report [7], climate change will cause substantial alterations in the quality and availability of water resources. Precipitation is projected to increase in northern Europe and decrease in southern Europe [8], both yearly and during the summer, but changes in central and eastern Europe are more complex. There is a moderate agreement amongst large-scale hydrological projections driven by EURO-CORDEX, that hydrological extremes (floods and droughts) might be on the rise in this region [9,10]. Assessing and quantifying the impacts and vulnerabilities at the global and regional scale is crucial in the context of international and national policies and actions for climate change adaptation [7]. It is widely recognized that in the future, climate change, increasing water use, and land-use change are likely to affect the flow regimes of European rivers. The projected changes in climate are likely to affect wetlands significantly, by impacting their spatial extent, distribution, and function [11].
Studies projecting climate change’s impact and linking soil water or bankfull flow modelling with the well-being of wetlands are rare. An evaluation carried out by Schneider et al. [12,13] focused on the effect of climate change on floodplain inundation for the chosen important floodplain wetlands in Europe and in the world. That study was performed with the use of the WaterGAP 3 model driven by bias-corrected, daily climate data from five different general circulation models (GCMs). House et al. [14], with the use of the MIKE-SHE model, investigated the hydrological impacts of climate change on a 10 ha, lowland riparian wetland in the UK depending on the degree of groundwater or surface water interactions. A study by Holsten et al. [15] used the Soil and Water Integrated Model (SWIM) to investigate climate change’s impact on soil moisture in Brandenburg (Germany) and special areas of conservation (SACs) located within. No similar studies have been carried out with the use of the Soil and Water Assessment Tool (SWAT) model.
This study assesses climate change-induced hydrological impacts on the wetland habitats of Natura 2000 SACs located within the Vistula (Wisła) and Odra river basins in Poland. The assessment of climate change’s effects on wetland habitats requires projections of appropriate hydrological variables for the watershed. These were developed with the help of the (SWAT) hydrological model set up at high resolution (the median modelling unit area was equal to 10.7 km2). The model was driven by an ensemble of nine bias-corrected EURO-CORDEX simulations under two representative concentration pathways (RCPs): 4.5 and 8.5 for two projection horizons (2024–2050; i.e., near future denoted as NF, and 2074–2100, i.e., far future, denoted by FF) and compared to the baseline period (1971–2000). The novel component of this research allows us to link climate change’s impact on hydrology with Natura 2000’s wetland habitats’ well-being. This was achieved by considering soil water content and the duration of flooding and inundation events obtained from the model as proxies of wetland habitat’s condition. In order to evaluate the impact of climate change on those hydrological variables we compared their values obtained for the two future periods to the equivalent ones from the baseline period. The results were set in an ecological context by analyzing the current conservation status, threats, and pressures affecting habitats.
2. Materials and Methods
2.1. Study Area
The natural and drained wetlands in Poland cover an area of 4.4 million ha which is approximately 14.2% of the country’s area. Some 30% of wetlands are mires and 70% are other types of wetlands. Mires cover 1.3 million ha which constitutes 4% of the area of the country and it is estimated that “live” preserved, peat-accumulating ecosystems occupy an area of 202,000 ha (0.6% of Poland). Fens constitute 92% of mires, and the largest fens are located in the river valleys of Biebrza and Narew. Bogs cover an area of 62,000 ha (4.7% of all the mires) and mostly occur in lakelands, uplands, and in the mountains. Transitional bogs cover 3% of the total area of mires in Poland. Over 80% of the area of mires were dried to varying degrees and mostly began to be used as meadows and pastures [16].
Other wetlands which do not accumulate peat, cover an area of 3.1 million ha (70% of all wetlands and 10% of the country area). Even though they occupy an area larger than mires, they are far less researched. There is a lack of detailed data on their area and state of preservation, as most commonly, they occur in a patchy mosaic and the range of particular habitats is difficult to assess. Marshes dominate among the non-peat accumulating wetlands and swamps are rarer. Marshes can be found in most of the river valleys in Poland [16].
Natura 2000 SACs cover 11.2% (about 3.49 million ha) of the total land area of Poland. Wetlands of international importance (RAMSAR areas) designated on the basis of “The Convention on Wetlands of International Importance especially as Waterfowl Habitat” consist of 153,400 ha (data from 2018) within Poland (which is approximately 0.5% of the country’s area, including inland water bodies) [17].
This study focuses on wetland habitats of Natura 2000 SACs located within the two largest river basins in Poland, the Vistula and Odra basins (VOB) which cover 88% of the Polish territory (i.e., approximately 275,000 km2 of 312,873 km2). Both rivers drain into the southern Baltic Sea. The VOB region has a temperate climate. This study did not assess the areas in Northern Poland which drain directly to the Baltic Sea. All SACs in Poland and those with wetland habitats chosen for analyzes in the VOB are presented in Figure 1.
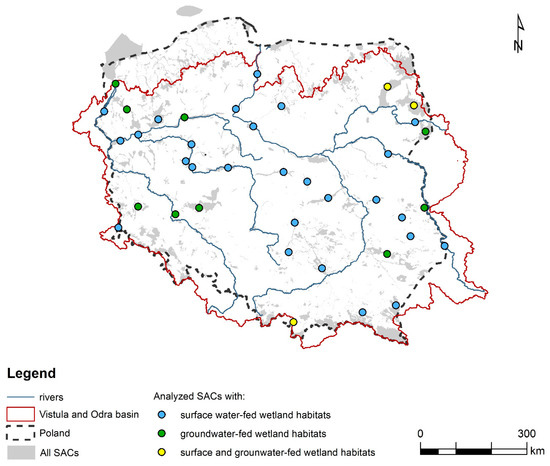
Figure 1.
Location of special areas of conservation (SACs) within the Vistula and Odra basins (VOB) in Poland. Color coding represents the type of wetland habitats present in the SACs selected for analysis: groundwater-fed (green) and surface water-fed (blue) wetland habitats, and both types of habitats (yellow).
2.2. Classes of Wetlands according to Hydrological Characteristics
In order to investigate the riparian vegetation response to stressors and avoid the confusing number of terms and names, for the purpose of this work, wetlands were divided into two general classes based on major hydrological characteristics; i.e., the source of water. Riparian wetlands where surface water plays a dominant role (associated with a river, lake, or pond) can be either covered by forest and bushes (mainly alder, poplar, and willow) or by non-forest vegetation; i.e., grasses, sedges and reeds. Groundwater and precipitation-fed wetlands where peat has or is being accumulated are called mires, which develop on a river valley edge or in higher elevated landscapes. Their basic characteristics are given in the subsequent sections.
2.2.1. Wetlands with a Dominant Role of Surface Water
One can distinguish two types of surface water-fed wetlands which differ in their lengths of inundation. In this paper, it is assumed that a swamp is inundated by shallow water [18] for a relatively long period with a substantial number of hummocks or dry land protrusions present on the floodplain. Swamps are not always peat-accumulating wetlands, and in a number of cases, the major soil type developing in those areas is alluvium. This is contradictory to fens and bogs which accumulate peat. Due to environmental conditions, swamp vegetation is adapted to growth in stagnating or slowly flowing water. As the water in swamps is rich in tannins from decaying vegetation, it has a characteristic brownish color. Swamps are usually associated with adjacent rivers or lakes.
A marsh has less open water than a swamp but is frequently inundated. The flooding phenomenon is much more dynamic, leading to the development of alluvial soils. Moreover, in contrast to a swamp, a marsh has no woody vegetation and is dominated by grasses, rushes, reeds, and sedges. A marsh obtains most of its water supply from surface water, and sometimes it is also fed by groundwater. Nutrients are abundant and the pH is usually neutral which causes an abundance of plant and animal life. Plants are rooted in mineral soil substrate and they are well adapted to saturated soil conditions over long time periods. Marshes are often grazed by wild animals and domestic cattle which suppress woody vegetation and maintain grassland communities [16,19].
2.2.2. Wetlands with a Dominant Role of Groundwater
On the basis of the main source of water, mires can be divided into bogs (fed by rain) and fens (fed by groundwater). The term peatland is used for areas of peat accumulation which are being drained for agricultural farming, peat extraction, or any other purposes.
Fens usually form in land depressions or river valley bottoms and are fed mainly by groundwater, but often have additional inputs of surface water and rain. Nutrient and mineral supply to vegetation is provided by water’s movement through the shallow peat layers. Due to alkalinity, fen vegetation is dominated by grasses (mostly sedges), reeds, and trees communities, such as birches (Betula L.), willows (Salix sp.), and alders (Alnus sp.).
Bogs can form either in locations where rainfall has no drainage network and causes local inundations over a long period, or where the peat layer builds-up and then isolates the fen from its groundwater supply. When that happens, a fen is fed only by direct rainfall, receives less nutrients, and could grow above the fen level and transform into an acidic bog. Rain, besides washing the hydroxide ions out of the peat, adds carbonic acid from carbon dioxide dissolved in rain water, making the soil pH more acidic. Nutrients are provided to bogs solely by precipitation. The presence of vegetation adapted to acidic conditions, e.g., Sphagnum moss and small sedges, pines, and dwarf birches, is characteristic of bogs [16,19].
2.3. Data on Wetland Habitats in Poland
As we were not able to acquire data for all Polish wetlands, we conducted an analysis using the GIS data on SACs and wetland habitats in Poland protected under the Habitat Directive [20] and managed by the General Directorate for Environmental Protection (GDEP) [21]. We assumed that projections done for those areas would give us good, representative information on the fate of important wetlands under changing climatic conditions. Habitats located within the Natura 2000 SACs and recognized as representative for the surface and groundwater-fed wetlands are presented in Table 1. Out of 13 habitat types that depend on either surface water or groundwater, nine were present in the VOB and suitable for further analysis (in bold in Table 1).

Table 1.
The Natura 2000 habitats occurring in Poland and fed by groundwater or surface waters (in bold habitats assessed in this study).
A grouping of Natura 2000 wetland habitats into surface water or groundwater-fed was carried out in order to gather the habitat types in communities with similar preferences for hydrologic features. The three surface water-fed habitat types were analyzed separately: 6430—hydrophilous, tall-herb fringe communities of plains and of the montane to alpine levels; 91E0—alluvial forests with Alnus glutinosa and Fraxinus excelsior (Alno-Padion, Alnion incanae, Salicion albae); and 91F0—riparian mixed forests of Quercus robur, Ulmus laevis, and Ulmus minor, Fraxinus excelsior, or Fraxinus angustifolia, along the great rivers (Ulmenion minoris). The six habitat types relying on groundwater were split into three groups and analyzed independently. The first group contained the class 91D0—bog woodland. The second group consisted of two types of fens: 7210—calcareous fens with Cladium mariscus and species of Caricion davallianae and 7230—alkaline fens. The third group included bogs: 7110—active raised bogs; 7120—degraded raised bogs still capable of natural regeneration and 7140—transition mires and quaking bogs. Only a portion (see Table 2) of Natura 2000 wetland habitat areas in Poland was suitable for this study due to procedures described in Section 2.4.3 and Section 2.4.4. The share of Natura 2000 wetland habitat area in Poland analysed in this project amounted to a maximum of 31.37% (habitat 7120), minimum of 6.01% (habitat 7210), and averaged to 15.19% (Table 2). This was judged to be a representative sample.
Table 2.
Comparison of average and total Natura 2000 wetland habitat area (km2) in Poland to area of habitats analyzed in this project. Percentage of total wetland habitat area in Poland analyzed in this project.
2.4. Hydrological Modelling Approach
2.4.1. Modelling with the Use of SWAT
SWAT is a process-based, continuous-time model which simulates hydrology on a catchment scale with a daily time step [22]. It is a complex tool designed to enable simulations of long-term impacts of land use and climate changes on water, sediment, and nutrient conditions. In this study, we built upon the existing, extensively calibrated and validated SWAT model of the VOB [23]. Two output variables simulated by SWAT were of main interest: streamflow (m3 s−1) and soil water content (amount of water in the soil profile, mm).
In SWAT, river basins are divided into sub-basins, which are then split into hydrological response units (HRUs). An HRU is a combination of land cover, soil, and slope overlaid within each sub-basin. Water balance components (such as water yield, which includes evapotranspiration; soil water content; and percolation) are calculated separately for individual HRUs and then aggregated at the sub-basin level. Three components contribute to water yield (and streamflow) in SWAT: surface runoff, lateral flow, and groundwater flow (baseflow). Water yield reaching the stream network is routed to the outlet of the basin. The median sub-basin and HRU areas for this model setup were 115 km2 and 10.7 km2, respectively [23].
2.4.2. Climate Change Scenarios
For the purpose of this paper, SWAT was driven by climate forcing data from the CHASE-PL Climate Projections: 5 km Gridded Daily Precipitation and Temperature Dataset (CPLCP-GDPT5) [24]. This dataset includes projections from an ensemble of nine bias-corrected climate model simulations from the EURO-CORDEX data set [8] up to the year 2100 and under two RCPs, called 4.5 and 8.5. The RCPs are plausible scenarios (based on various assumptions on future atmospheric concentrations of greenhouse gases and socio-economic development) towards reaching specific trajectories of target radiative forcing [25]. Two RCPs used in this paper correspond to the 4.5 W m−2 and 8.5 W m−2 levels of radiative forcing in the year 2100. The SWAT model runs represent pure climate change effects, assuming constant land use, which is typical for most hydrological impact studies.
The projected mean annual temperature in Poland is expected to rise by approximately 1.1 °C in the NF (near future, 2021–2050) and 2 °C in the FF (far future, 2071–2100) under the RCP 4.5, with a strong seasonal variation: the highest change occurs in winter (2.5 °C in FF) and the lowest in summer (1.7 °C in FF). For the RCP 8.5 scenario, the temperature increase rate seem to quicken in the second half of the century, reaching a mean of 3.6 °C in FF, whereas in NF, it is alike to RCP 4.5 (1.3 °C versus 1.1 °C). Poland is expected to get more precipitation in the future and for all seasons (with the highest increase in winter and spring). In the intermediate emission scenario (RCP 4.5), the projected annual mean precipitation increase is approximately 6% in NF and 10% in FF, while for RCP 8.5, the projections show a 16% increase in FF [26].
2.4.3. Assessment of Flooding Events
The magnitude, timing, and duration of inundation influences the abiotic conditions in floodplain ecotones [27]. Flood duration impacts abiotic soil conditions, the amount of fine sediment settlement, and groundwater contact [28]. The quality and functioning of floodplain wetland ecosystems that have evolved under, and are dependent on regular inundation, are vulnerable to hydrological alterations. Inundation (flooding) assures floodplain aquatic connectivity and allows the transport of matter and organisms [13,29]. Plant roots cannot function properly if they are experiencing excess inundation which cuts off or limits the availability of oxygen. Washing out nutrients and irreversible root decay caused by too much water results in the plant wilting [30]. Too much water can also cause washing out nutrients and irreversible root decay. If there is not enough water supplied by inundation and flooding and falls below some (species-specific) levels, plants suffer from water stress and decrease their physiological activities. This affects the transpiration rate, biomass production, and carbon assimilation and eventually causes wilting [31,32].
Assessment of impact of climate change on surface water-fed wetlands was carried out with the use of streamflow simulations obtained from the SWAT model for the particular river sections with the support of GIS tools. Out of all the SACs acquired from the GDEP [21], surface water-fed habitats located within the Vistula and Odra catchments were chosen. The next steps included linking sub-basin outlets to SACs by checking if the river network and land use data from SWAT sub-basins represented a wetland and if a geodetic wet cross-section of the river was available. Wet cross-sections were obtained during a nationwide project [33]. Measurements were carried out upstream and downstream from any hydro-technical structure, and in natural river-sections, every 1 km, using the real-time kinematic Global Positioning System (RTK GPS) technique combined with bathymetry of the channel bed. The land part of these sections covered the embankments and went out 5–20 m beyond the riverbed. The rest of the cross-section included the entire floodplain terrace and was developed from LIDAR images with a density of 4 beams per 1 m2. The combined data formed one cross section perpendicular to the valley [33]. The river-cross sections allowed for a manual, visual assessment, based on the topography of the river valley of the water table level at which bankfull flow occurs. Bankfull flow takes place when the channel is full to its capacity (to the top of the banks) and the flow begins to enter the active floodplain [34]. It is a suitable parameter for large-scale modelling, especially for the analysis of environmental flows and flood-related hydrological processes [28]. The calculation of bankfull flow was carried out with the use of the Manning equation. This procedure determined 30 SACs suitable for analysis (Figure 1). Each SAC was associated with a single SWAT river sub-basin and contained one or more of the considered habitats.
Obtaining the projected daily streamflow for the future scenarios allowed us to assess how the yearly number of days when streamflow exceeded bankfull flow (NOD) changes in comparison to the baseline scenario. Due to seasonal variation in the occurrence of flooding and inundation [35], a yearly time step was chosen for the assessment of the number of days when streamflow exceeds bankfull flow, instead of looking at, e.g., only the growing season. The NOD for each cross-section was calculated. It was decided that this indicator represents the hydrological requirements of the chosen habitats sufficiently well. If the daily streamflow modelled by SWAT exceeded the threshold of the calculated bankfull flow at a given cross-section, then an assumption was made that a flooding event occurred; if it was not exceeded then no flooding event occurred. Those calculations were carried out for each cross-section in 9 climate models for the baseline (1971–2000) and two future horizons (NF and FF) under two RCPs 4.5 and 8.5. The NODs from all cross-sections representing a habitat were calculated as a mean for each climate model. In the final step, the climate change impact on surface water-fed wetlands was presented as the change in the NOD for three different types of Natura 2000 habitats. For two future horizons, the calculations were carried out and presented separately for both RCPs studied. The uncertainty resulting from the use of nine climate models was addressed by preparing the results as box plots (Figure 4). The analysis scheme is presented in Figure 2.
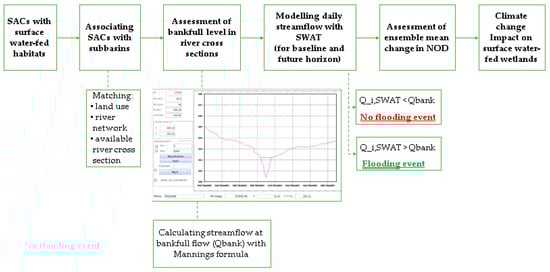
Figure 2.
Scheme of the analysis procedure for surface water-fed wetlands, where Q_i,SWAT is the streamflow obtained from SWAT model and Qbank is the bankfull flow at a given cross-section; the NOD is a yearly number of days when streamflow exceeds bankfull flow.
2.4.4. Soil Water Assessment
Soil water is of highest importance for vegetation growth and they mutually influence each other through the process of transpiration [36,37]. If soil water content decreases below a certain (species-specific) level, plants experience water stress, during which they decrease their physiological activities. This affects the transpiration rate, biomass production, and carbon assimilation and eventually causes wilting [30,32]. Excess waterlogging limits or cuts of the supply of oxygen which is essential for roots to function properly. Too much water can also cause washing out nutrients and irreversible root decay [30].
Assessing the groundwater-fed wetlands required a similar approach as for the riparian wetlands: acquiring the data on Habitat Directive [20] protected areas, which consists of habitats depending on precipitation and groundwater supply (Table 1). As a state indicator, we chose soil water content which results from water balance in the wetland area.
The investigation process was mainly based on a spatial analyzes and the use of the SWAT model’s output for particular locations. The entire procedure was supported with GIS tools. The first step included selection of SACs, acquired from GDEP, with groundwater-fed habitats located within Vistula and Odra catchments. Afterwards, the output map was overlaid with the HRUs to check if they contained organic soils (as soil class) and wetland vegetation (as land-use). For each habitat type in a given SAC, spatially associated HRUs that fulfilled the aforementioned conditions were attributed. Each habitat within a given SAC could be represented by more than one HRU. Each SAC could contain one or more of the considered groups of habitats. If the habitat constituted less than 1% of the HRU area, it was then considered non-representative, and in consequence, was removed from the analysis. Twelve SACs were considered in further analysis (Figure 1).
Available water capacity (AWC) of the soil layer (mm H2O/mm soil), which is an input for the SWAT model, is estimated by determining the amount of water released between in situ field capacity (the soil water content at soil matric potential of −0.033 MPa) and the permanent wilting point (the soil water content at soil matric potential of −1.5 MPa) [23,38]. The SWAT model produces as an output simulated soil water (SW) as mm of water in a soil column with varying depth, depending on the type of soil and location. Soil classes vary in terms of soil retention parameters and are affected by climatology, specific for a given area. Due to this fact, the results were normalized by dividing the average yearly SW in selected HRUs by AWC of each soil column and expressed in dimensionless units. Normalized data enables a better spatial comparison across a large-scale study [39]. This method allowed for a comparison of results between different soil types. Surface water-fed wetland characteristics are maintained by periodic waterlogging which typically occurs with a seasonal variation [35], so it was decided to asses SW in a yearly time step rather than looking at, e.g., only the growing season.
The significance of changes in the ratio between SW and AWC for groundwater-fed habitats was assessed by interpreting the magnitude of impact on habitats, based on SWAT model simulations run under 4.5 and 8.5 RCP scenarios, nine climate change projections, and two time horizons: NF and FF for each combination of SAC-habitat type-climate projection–RCP scenario. For two future horizons, the calculations were carried out and presented separately for both studied RCPs. The uncertainty resulting from the use of nine climate models was addressed by preparing the results as box plots (Figure 5). The analysis scheme is presented in Figure 3.
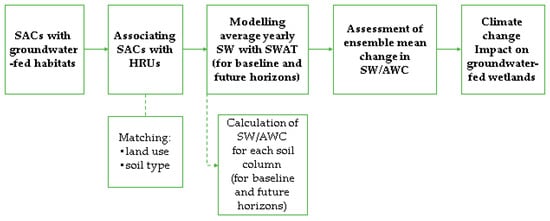
Figure 3.
Scheme of the analysis procedure for groundwater-fed wetlands, where SW is soil water and AWC is available water capacity.
2.4.5. Analysis of the Current Conservation Status, Threats, and Pressures Affecting Habitats
To assess the current condition of wetland habitats within the VOB, we reviewed the available resources. Information on (1) the conservation status of habitats and (2) the threats to maintaining a good habitat condition was extracted from the Standard Data Forms (SDF) for analyzed Natura 2000 SACs [40]. The SDFs contain a description of the site and its ecology. The analyzed SDFs were updated in 2017 and are available on the website of GDEP (http://natura2000.gdos.gov.pl/).
Conservation status included in the SDFs is the degree of conservation of the structure and functions of the considered natural habitat type and its restoration possibilities. This assessment criterion comprises three sub-criteria: (i) the degree of conservation of the structure, (ii) degree of conservation of the functions, and (iii) restoration possibility. For each SAC, the information on the conservation status of habitats of interest was gathered. The grading of this status was: (A) excellent conservation, (B) good conservation, and (C) average or reduced conservation. A habitat type that was present on the analyzed site in a non-significant manner was included in category (D)—non-significant presence. One of the aims of the Natura 2000 Network is to ensure that habitats are restored to, or maintained at, a favorable conservation status [41,42]. The information gathered was used to assess whether the current state of analyzed habitat in a given SAC was in its optimum condition (A) or had been already impacted by stressors and had a status B, C, or D.
Threats and pressures to maintaining a good habitat condition in SACs were narrowed down to those related to hydrology and grouped into two categories: (1) drying out (including K01.03—drying out; M01.02—droughts and less precipitations; J02.04.02—lack of flooding; J02.03—canalization and water deviation; J02.03.01—large scale water deviation; J02.03.02—canalization; J02.05—modification of hydrographic functioning, general) and (2) inundation: (L08—inundation (natural processes)). This information gave a wider view on what the stressors currently affecting habitats of interest were.
Gathering the information about current conservation status of habitats, threats, and pressures affecting SACs determined whether the projected changes in the average flooding duration and soil water could become an additional stressor or have a beneficial impact on further possibilities of maintaining or achieving an excellent conservation status “A” and eliminating or intensifying the threats. The analysis of the possible climate change impact on the habitat’s conservation status will be carried out in the discussion.
Due to a time discrepancy between information included in the Natura 2000 SDF and the shapefile layer of habitats obtained from GDEP, a given habitat may not appear in the SDF, but it may exist in the shapefile layer. If such a situation occurred, we assumed that such a habitat existed within the SAC, but was probably too small to be included in the SDF; therefore, it was included in the analysis with a conservation status D (assigned by authors).
3. Results
3.1. Climate Change’s Effect on Surface Water-Fed Wetlands
According to Figure 4, the impact of climate change on surface water-fed habitats is rising along with the increase in the RCP scenario and time horizon. The NOD is projected to increase for all three types of habitats; values for RCP 4.5 and 8.5 in NF are similar; in FF, the discrepancy between the two RCPs is larger. The minimum and maximum values of the NOD spread out further and are more divergent in the FF. The highest changes in the NOD are projected for riparian mixed forests (91FO) and the lowest for Hydrophilous tall herb fringe communities of plains and of the montane to alpine levels (6430). The number of analyzed sub-basins and SACs for given habitats are presented in Table 3.
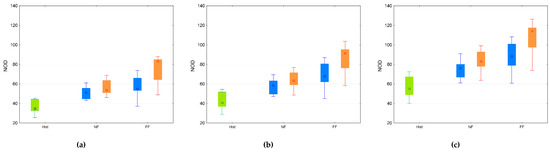
Figure 4.
Projected changes in yearly number of days when streamflow exceeds bankfull flow (NOD) for habitat: (a) 6430—hydrophilous, tall-herb fringe communities of plains and of the montane to alpine levels, (b) 91E0—alluvial forests with Alnus glutinosa and Fraxinus excelsior (Alno-Padion, Alnion incanae, Salicion albae); (c) 91F0—riparian mixed forests of Quercus robur, Ulmus laevis, and Ulmus minor, Fraxinus excelsior, or Fraxinus angustifolia, along the large rivers (Ulmenion minoris) in RCP 4.5 (blue) and 8.5 (orange), and the baseline scenario (green).
Table 3.
Number of SWAT sub-basins and hydrologic response units (HRUs) included in the analysis for given types of habitats within the Vistula and Odra basins with an assessment of threats connected to drying out and inundation according to the conservation status of SACs (A or B, C, D). Number of threats identified within all the considered SACs (threats and pressures of drying out: K01.03—drying out; M01.02—droughts and less precipitations; J02.04.02—lack of flooding; J02.03—canalization and water deviation; J02.03.01—large scale water deviation; J02.03.02—canalization; J02.05—modification of hydrographic functioning, general and threats and pressures of inundation: L08—inundation (natural processes)).
3.2. Climate Change Effect on Groundwater-Fed Wetlands
The impact of climate change on groundwater-fed habitats, according to Figure 5, is projected to slightly increase the SW/AWC. Impact rises along with the increase in the RCP scenario and time horizon. The SW/AWC is projected to increase for bog and fen habitats, while for bog woodlands, the results show ambiguity. Median SW/AWC values are similar in NF, when comparing results for RCP 4.5 and 8.5. For FF, the median value is higher for RCP 8.5. The projected changes are expected to have the largest impact on bogs which show the highest increase in soil water and the lowest on bog woodlands. As indicated by the span of the outliers, the uncertainty of the results is high, mostly in the NF scenarios but also for the historical period. The presence of outliers might suggest that the soil water content parameter is more sensitive to climate change and also more uncertain than NOD. Groundwater-fed habitats are strongly dependent on vegetation which directly uptakes the water from the soil profile. This means that their intensive growth is regulated not only by water supply but also air temperature, which for some climate models, might be higher and may cause higher evapotranspiration and water uptake from the soil profile. The number of analyzed HRUs and SACs for given habitats are presented in Table 3.
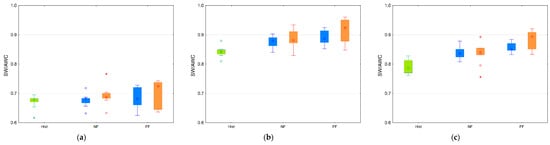
Figure 5.
Projected changes of soil water (SW) in relation to available water capacity (AWC) for habitat: (a) bog woodland (91D0—bog woodland); (b) bog habitats (7110—active raised bog; 7140—transition mires and quaking bogs; 7120—degraded raised bogs still capable of natural regeneration), (c) fen habitats (7210—calcareous fens with Cladium mariscus and a species of the Caricion davallianae, 7230—alkaline fens) in RCP 4.5 (blue), 8.5 (orange), and the baseline scenario (green).
3.3. Current Habitat Conservation Status, Threats, and Pressures
Approximately half (51%) of the analyzed SACs with surface water-fed habitats have identified threats connected to drying out (Table 3). On average, 85% of the analyzed habitats have a conservation status B (good), C (average or reduced), or D (non-significant presence), and just a few have status A (excellent). The number of threats for habitats 6430 and 91F0 is 1.7 threats per SAC and for habitat 91E0 is 1.4 threats per SAC. Only two SACs with surface water-fed habitats are threatened with inundation: one with A conservation status and second with D status.
The number of considered SACs with groundwater-fed habitats is smaller than for surface water-fed habitats. Over half (54%) of the analyzed SACs are threatened with drying out, but none of them are threatened with inundation. For bogs and fens, all the analyzed habitats within the SACs have a conservation status B, C, or D. None of the groundwater-fed habitats have a conservation status A. There is approximately one threat per SAC.
SACs with surface water-fed habitats which are under the highest number of threats are: Solecka Dolina Wisły (four); Dolina Środkowej Pilicy (three); and for groundwater-fed habitats: Lasy Sobiborskie and Puszcza Białowieska (two). The most commonly occurring threats within the study were: J02.03—canalization and water deviation (10 SACs), J02.05—modification of hydrographic functioning, general (seven SACs), K01.03—drying out (six SACs) (Figure A1 and Figure A2). Only two SACs are threatened with inundation and concern habitat 91E0. A list of analyzed SACs with conservation status and threats that apply to them are presented in Figure A1 and Figure A2 in the Appendix.
4. Discussion
Climate change projections prepared for the VOB suggest predominantly an increase in seasonal and annual runoff [23,43]. This partly explains the increases in other hydrological variables reported in this study. The data acquired from the SWAT model forced by rainfall and temperature projections show, for the majority of rivers in the Vistula and Odra basins, an increase in high and low flows and soil water [44]. Increasing trends are visible for NOD and SW/AWC, but changes are more significant for NOD, which suggests that surface water-fed wetlands will be more impacted by climate change. The rate of these increases is higher for the long-term future than for the near future; the same pattern is apparent for RCPs where changes in 8.5 are larger than in RCP 4.5. This suggests that wetland habitats which are well adapted to moist conditions should be the least affected by climate change.
The established modelling framework is a simplified representation of the ecological interactions and does not contain all the factors responsible for presence of a particular ecosystem. This approach is suitable for larger scales (river basin or country-scale) and transferring the framework to other catchments. This study focuses on the sole effect of climate change on hydrology, without other disturbances and man-made alterations, such as dams, water abstractions, and land-use changes. While focusing on mean values from long periods of time, information on the variability of wet and dry years and the amplitude was lost. As indicated by the outliers in Figure 4 and Figure 5, the results are highly uncertain. The current regional soil water pattern depends on the spatio-temporal interaction and distribution of temperature, soil texture, radiation, and atmospheric CO2 [32]. The last two components were not included in the SWAT model set up for VOB.
Most of the climate change projections for Eastern Europe show a decrease in the flooding duration; therefore, this study deals with an opposite situation. A study conducted by Schneider et al. [45] projected a decrease in flood volume for inundation and duration of overbank flows in Central and Eastern European rivers. Projections carried out by Dankers and Feyen [46] found a significant decrease in the occurrence of flood hazards in the northeast of Europe. Simulations prepared for global Ramsar sites by Schneider et al. [12] showed a significant decrease in flood pulses in 8% of them. Eastern Europe could become a hotspot of further flow modifications due to climate change [12]. Overall, it should be noted that there are numerous reasons why hydrological projections differ, so a direct comparison to other studies is usually hampered with methodological differences [47].
Numerous studies for temperate climates project a decrease in soil water of riparian areas, wetlands, and groundwater-dependent ecosystems due to climate change [32,48]. Similar trends are projected for other parts of Europe [49,50]. This study, along with several others, indicates a reverse trend. A clear increase in relative soil water content for terrestrial ecosystems in the regions north of ~50° N, which include Poland, was projected by Gerten et al. [32] for all prepared climate scenarios. A modelling study carried out by Holsten et al. [15] for the German state of Brandenburg projected, for all climate realizations, a decrease of average soil water content of 4% to 15% by 2050. The same study also found that available soil water content in SACs was higher while soil water dynamics were lower, mostly due to their favorable edaphic conditions. SACs within Brandenburg showed stronger absolute and relative changes in the projected trends for the past and future in comparison to the whole state, which indicates a high level of risk for wetland areas. Under the conditions of climate change, soil water content in SACs is projected to remain higher than average, and therefore, SACs have an important function as buffers [15]. Similar results were obtained for wetland habitats within SACs in VOB in this study.
4.1. Change in the Habitat Conservation Status
The important implication of our study is the possible impact of increases of SW/AWC and NOD on the analyzed habitats. Information about the current conservation status of habitats, threats, and pressures affecting SACs determines whether the projected changes in the average flooding duration and soil water could become an additional stressor or have a beneficial impact on further possibilities of maintaining or achieving an excellent conservation status “A” for habitats. In Webb et al. [51], the eco evidence method for systematic review was used to analyze literature for evidence of relationships between components of wetland water regimes (waterlogging, inundation, depth, duration, frequency, and timing) and their effects on riparian plant establishment, growth, reproduction, assemblage composition, and diversity. Waterlogging in the Webb et al. [51] study applies to the substrate when it is inundated, but not above soil level or when it is at field capacity (compared to dry or well-drained substrates). Inundation (submersion) refers to the situation when the water is present above soil level. Depth, duration, frequency, and timing relate to inundation events. Plant assemblage composition and diversity is relevant for this study. Due to the tools that were available for this study, it was possible to analyze waterlogging, inundation, and the duration of flooding. Waterlogging applies to groundwater-fed wetlands and inundation to surface water-fed wetlands (Table 4).
Table 4.
Causal criteria analysis results for hypotheses linking changes in wetland plant assemblage-composition and plant diversity, to increases in components of the water regime according to a systematic review carried out in [52].
Climate change is likely to affect the water regime, and in the light of the systematic review presented in [51], this will impact and alter the abiotic conditions important for wetlands. The literature supports the hypotheses that inundation and flood duration alter the composition of wetland plant assemblages. There was insufficient evidence to examine the effects of waterlogging on plant assemblages and diversity occurring in wetlands. Support was found for the hypothesis that inundation reduces plant diversity. It was concluded that increasing flood duration does not increase plant diversity [51].
Assuming that the habitats with excellent conservation status (A) are at their optimum, they could be the most affected by climate change, as increased soil water or overbank flow can exceed their tolerance. Surface water-fed habitats with status A, which are already in their optimum condition, might be subject to an increase in the duration of inundation expressed as NOD. Habitats with non-significant presence indicated as conservation status D and threatened by drying out could encounter opportunities to extend their range. Habitats with conservation status B (good), C (average or reduced), threatened with drying out, in the projected wetter conditions, could benefit from the changing climate. The scale of this potential improvement cannot be assessed in this study due to internal mechanisms of habitats that were not included here.
4.2. Impact on Analyzed Habitats
One of the primary determinants of species distribution is water availability, which also impacts community composition, ecosystem processes, and services like carbon sequestration [52]. Climate conditions and land use affect water availability. The likely result of anthropogenic climate and land-use change is the alteration of the hydrology of a substantial portion of the global terrestrial ecosystems [53,54,55,56]. Thus, there is a clear need to develop models suitable for simulating soil moisture and other hydrological conditions [52].
According to a study by Schneider et al. [13], focusing on habitats 91E0 and 91F0, extreme floods should occur at least every 10–20 years in order to halt the succession to a terrestrial forest. Richter and Richter [57] found that 125% of bankfull can be essential to create new pioneer sites along meandering rivers to colonize by succession precursors of alluvial and riparian forests. In order to maintain optimal conditions, flooding should occur for less than 40 days/year. The duration of the flood event should be no longer than 60% of the growing season and not two seasons in a row, which would give no time for the recovery of the habitat. Recruitment does not occur when the habitat is flooded more than 30–40% of the growing season [58]. Chronic increase in summer inundation can impact species composition in existing sites [13]. Flooding tolerance classes according to Glenz et al. [58] describe Alnus glutinosa as having a very high tolerance and Fraxinus excelsior an intermediate flooding tolerance. Both of those tree species are included in habitat 91E0—alluvial forests. For riparian mixed forests 91E0, according to Glenz et al. [58], Quercus robur, Ulmus minor, and Fraxinus excelsior have an intermediate flooding tolerance, while Ulmus laevis and Fraxinus angustifolia were not included in the analysis.
For 91E0, the NOD for the baseline period has a mean value of 42 days/year (Figure 4b) which is very close to condition set by Schneider et al. [13] of 40 days/year in order to maintain optimal inundation. For 91F0, it is 56 days (Figure 4c) which already exceeds the optimum value. In the future, for both habitats, the NOD is projected to increase even further up to 87 days in FF 8.5 for 91E0 and 108 days for 91F0. This might indicate that in the future, the NOD will exceed the flooding tolerance of both habitats.
A key factor is the individual habitat or species water condition preferences, but the range of tolerance is not available for all the remaining habitats analyzed. Ecohydrological guidelines for wetland plant communities available for the UK [59,60] try to tackle this issue, but they do not contain information about the optimal number of days with inundation or soil water content for Natura 2000 habitats. The increase in soil water or in frequency of flooding may trigger biological and ecological processes of changes in wetlands, which so far cannot be predicted. Research on this topic is especially significant in Natura 2000 SACs, in which there is a legal obligation (Habitats Directive) to ensure that the habitats are restored to, or maintained at, a favorable conservation status [42]. According to our findings, surface water-fed wetland habitats especially, will face a new standard in their habitats and whether they will be able to adapt is uncertain.
5. Conclusions
The SWAT modelling results showed a significant increase in the length of inundation and a slight increase in soil water content. According to the climate change projections prepared for the Vistula and Odra basins, the increase of yearly number of days when streamflow exceeds bankfull flow (NOD) and soil water in relation to available water capacity (SW/AWC) would be caused by an increase in precipitation and runoff. This study also examined the conservation status of habitats and the threats and pressures they are subject to. This allowed the conclusion that habitats that are under the threat of drying out might benefit from alterations induced by climate change. As those habitats will experience wetter conditions, possibly, with time, the threat of drying out will be reduced or eliminated without any man-made measures. Habitats with a conservation status A which are already in optimum condition could be negatively affected by climate change, as increased soil water or overbank flow can exceed their tolerance. This issue should be addressed by conducting monitoring and research on the impact of increased moisture on the long-term condition and of those habitats.
As most literature focuses on droughts, there is a knowledge gap about climate change and the potential increase of water availability. Attention should be placed on the research of waterlogging’s impact on the plant community’s composition and diversity, as according to Webb et al. [51] there is an insufficient evidence base. An increase in flooding duration and frequency could cause the application of flood protection measures. Such a possibility was not included in this research, but should be monitored. All flood protection measures should be conducted in such a way as to minimize disturbance of natural processes in river valleys. More detailed studies on the possibilities of incorporating the hydrotechnical infrastructure in climate change mitigation and adaptation plans are needed.
The presented issues and projections pose a challenge for the preparation of Natura 2000 management plans by raising questions on how to include the possible positive impact of climate change on reducing the habitat threats of drying out. The possibilities of fulfilling objectives of the Natura 2000 network should also be assessed with the inclusion of climate change projections. This study shows that the protection of status quo of wetland habitats within Natura 2000 might encounter new challenges caused by climate change.
Author Contributions
Conceptualization, T.O., J.O. and Z.W.K.; methodology, T.O., P.M. and J.O.; software, I.K.; formal analysis, P.M., M.U. and J.O.; investigation, J.O.; data curation, I.K.; writing—original draft preparation, J.O.; writing—review and editing, M.P., T.O. and Z.W.K.; visualization, P.M. and J.O.; supervision, T.O, M.P. and Z.W.K.
Funding
This research included in the project CHASE-PL (Climate change impact assessment for selected sectors in Poland) was financed by the Polish-Norwegian Research Programme operated by the National Centre for Research and Development (NCBiR) under the Norwegian Financial Mechanism 2009–2014 in the framework of project contract number Pol Nor/200799/90/2014. The first author received financing from the doctoral scholarship programme ETIUDA from the National Science Centre Poland (number 2018/28/T/ST10/00516).
Acknowledgments
Authors would like to thank Dorota Mirosław-Świątek for providing software to calculate bankfull flow.
Conflicts of Interest
The authors declare no conflict of interest. The funders had no role in the design of the study; in the collection, analyses, or interpretation of data; in the writing of the manuscript, or in the decision to publish the results.
Appendix A

Figure A1.
Analysis scheme for identified threats, pressures, and conservation status of surface water-fed habitats within SACs.


Figure A2.
Analysis scheme for identified threats, pressures, and conservation status of groundwater-fed habitats within SACs.

References
- Maltby, E. Waterlogged Wealth: Why Waste the World’s Wet Places? International Institute for Environment and Development: London, UK, 1986; ISBN 0905347633. [Google Scholar]
- Bullock, A.; Acreman, M. The role of wetlands in the hydrological cycle. Hydrol. Earth Syst. Sci. 2003, 7, 358–389. [Google Scholar] [CrossRef]
- Verhoeven, J.T.A.; Arheimer, B.; Yin, C.; Hefting, M.M. Regional and global concerns over wetlands and water quality. Trends Ecol. Evol. 2006, 21, 96–103. [Google Scholar] [CrossRef]
- Acreman, M.C.; Miller, F. Practical approaches to hydrological assessment of wetlands lessons from the UK. In Wetlands: Monitoring, Modelling and Management; Okruszko, T., Maltby, E., Szatyłowicz, J., Świątek, D., Kotowski, W., Eds.; Taylor & Francis: London, UK, 2007. [Google Scholar]
- Okruszko, T.; Duel, H.; Acreman, M.; Grygoruk, M.; Flörke, M.; Schneider, C. Broad-scale ecosystem services of European wetlands—Overview of the current situation and future perspectives under different climate and water management scenarios. Hydrol. Sci. J. 2011, 56, 1501–1517. [Google Scholar] [CrossRef]
- Côté, I.M.; Darling, E.S. Rethinking ecosystem resilience in the face of climate change. PLoS Biol. 2010, 8, e1000438. [Google Scholar] [CrossRef]
- IPCC. Summary for Policymakers. In Climate Change 2014: Mitigation of Climate Change. Contribution of Working Group III to the Fifth Assessment Report of the Intergovernmental Panel on Climate Change; Edenhofer, O.R., Pichs-Madruga, Y., Sokona, E., Farahani, S., Kadner, K., Seyboth, A., Adler, I., Baum, S., Brunner, P., Eickemeier, B., et al., Eds.; Cambridge University Press: Cambridge, UK; New York, NY, USA, 2014. [Google Scholar]
- Jacob, D.; Petersen, J.; Eggert, B.; Alias, A.; Christensen, O.B.; Bouwer, L.M.; Braun, A.; Colette, A.; Déqué, M.; Georgievski, G.; et al. EURO-CORDEX: New high-resolution climate change projections for European impact research. Reg. Environ. Chang. 2014, 14, 563–578. [Google Scholar] [CrossRef]
- Roudier, P.; Andersson, J.C.M.; Donnelly, C.; Feyen, L.; Greuell, W.; Ludwig, F. Projections of future floods and hydrological droughts in Europe under a +2 °C global warming. Clim. Chang. 2016, 135, 341–355. [Google Scholar] [CrossRef]
- Alfieri, L.; Burek, P.; Feyen, L.; Forzieri, G. Global warming increases the frequency of river floods in Europe. Hydrol. Earth Syst. Sci. 2015, 19, 2247–2260. [Google Scholar] [CrossRef]
- Candela, L.; Von Igel, W.; Elorza, F.J.; Aronica, G. Impact assessment of combined climate and management scenarios on groundwater resources and associated wetland (Majorca, Spain). J. Hydrol. 1997, 376, 510–527. [Google Scholar] [CrossRef]
- Schneider, C.; Flörke, M.; De Stefano, L.; Petersen-Perlman, J.D. Hydrological threats to riparian wetlands of international importance—A global quantitative and qualitative analysis. Earth Syst. Sci 2017, 215194, 2799–2815. [Google Scholar] [CrossRef]
- Schneider, C.; Flörke, M.; Geerling, G.; Duel, H.; Grygoruk, M.; Okruszko, T. The future of European floodplain wetlands under a changing climate. J. Water Clim. Chang. 2011, 2, 106–122. [Google Scholar] [CrossRef]
- House, A.R.; Thompson, J.R.; Acreman, M.C. Projecting impacts of climate change on hydrological conditions and biotic responses in a chalk valley riparian wetland. J. Hydrol. 2016, 534, 178–192. [Google Scholar] [CrossRef]
- Holsten, A.; Vetter, T.; Vohland, K.; Krysanova, V. Impact of climate change on soil moisture dynamics in Brandenburg with a focus on nature conservation areas. Ecol. Model. 2009, 220, 2076–2087. [Google Scholar]
- Dembek, W.; Grotek, A.; Jakubowski, W.; Piórkowska, H.; Oświecimska-Piasko, Z.; Siedlecki, T.; Szewczyk, M. System Informacji Przestrzennej o Mokradłach Polski “GIS-Mokradła”; IMUZ: Falenty, Poland, 2006. [Google Scholar]
- Statistics Poland. Statistical Analyses Environment 2018; GUS: Warsaw, Poland, 2018; ISBN 0867-3217.
- Okruszko, T.; Kiczko, A. Assessment of Water Requirements of “Swamp Communities: The River Narew Case Study. Publ. Inst. Geophys. Pol. Acad. Sci. 2008, E-9, 27–39. [Google Scholar]
- Dembek, W.; Pawlaczyk, P.; Sienkiewicz, J.D.P. Obszary Wodno-Błotne w Polsce; IMUZ: Falenty, Poland, 2004. [Google Scholar]
- EU. Council Directive 92/43/EEC of 21 May 1992 on the Conservation of Natural Habitats and of Wild Fauna and Flora; EU: Brussels, Belgium, 1992. [Google Scholar]
- GDEP. Spatial Information Database of Natura 2000 sites and habitats prepared by General Directorate for Environmental Protection (GDEP); GDEP: Warsaw, Poland, 2016. Available online: https://natura2000.gdos.gov.pl/ (accessed on 9 September 2018).
- Arnold, J.G.; Srinivasan, R.; Muttiah, R.S.; Williams, J.R. Large area hydrologic modeling and assessment part I: Model development. J. Am. Water Resour. Assoc. 1998, 34, 73–89. [Google Scholar] [CrossRef]
- Piniewski, M.; Szcześniak, M.; Kardel, I.; Berezowski, T.; Okruszko, T.; Srinivasan, R.; Vikhamar Schuler, D.; Kundzewicz, Z.W. Hydrological modelling of the Vistula and Odra river basins using SWAT. Hydrol. Sci. J. 2017, 62, 1266–1289. [Google Scholar] [CrossRef]
- Mezghani, A.; Dobler, A.; Haugen, J.E.; Benestad, R.E.; Parding, K.M.; Piniewski, M.; Kardel, I.; Kundzewicz, Z.W. CHASE-PL Climate Projection dataset over Poland – bias adjustment of EURO-CORDEX simulations. Earth Syst. Sci. Data 2017, 95194, 905–925. [Google Scholar] [CrossRef]
- Moss, R.H.; Edmonds, J.A.; Hibbard, K.A.; Manning, M.R.; Rose, S.K.; van Vuuren, D.P.; Carter, T.R.; Emori, S.; Kainuma, M.; Kram, T.; et al. The next generation of scenarios for climate change research and assessment. Nature 2010, 463, 747–756. [Google Scholar] [CrossRef]
- Piniewski, M.; Mezghani, A.; Szcześniak, M.; Kundzewicz, Z. Regional projections of temperature and precipitation changes: Robustness and uncertainty aspects. Meteorol. Zeitschrift 2017, 26, 223–234. [Google Scholar] [CrossRef]
- Hughes, F.M.R. Floodplain biogeomorphology. Prog. Phys. Geogr. Earth Environ. 1997, 21, 501–529. [Google Scholar] [CrossRef]
- Schneider, C.; Flörke, M.; Eisner, S.; Voss, F. Large scale modelling of bankfull flow: An example for Europe. J. Hydrol. 2011, 408, 235–245. [Google Scholar] [CrossRef]
- Tockner, K.; Malard, F.; Ward, J.V. An extention of the flood pulse concept. Hydrol. Proc. 2000, 14, 2861–2883. [Google Scholar] [CrossRef]
- Cooper, D.J.; Merritt, D.M. Assessing the Water Needs of Riparian and Wetland Vegetation in the Western United States; US Department of Agriculture, Forest Service, Rocky Mountain Research Station: Fort Collins, CO, USA, 2012. [Google Scholar]
- Smith, J.A.C.; Griffiths, H. Water Deficits: Plant Responses from Cell to Community; Bios Scientific Publishers: Oxford, UK, 1993; ISBN 1-872748-06-5. [Google Scholar]
- Gerten, D.; Schaphoff, S.; Lucht, W. Potential future changes in water limitations of the terrestrial biosphere. Clim. Chang. 2007, 80, 277–299. [Google Scholar] [CrossRef]
- KZGW. Baza Danych Przekroi Mokrych Rzek Polski Wykonana w Ramach Projektu “Informatyczny System Osłony Kraju Przed Nadzwyczajnymi Zagrożeniami” (ISOK); KZGW: Warsaw, Poland, 2014.
- Leopold, L.B.; Wolman, M.G.; Miller, J.P. Fluvial Processes in Geomorphology; Dover Publications, Inc.: New York, NY, USA, 1964. [Google Scholar]
- Maltby, E. Functional Assessment of Wetlands: Towards Evaluation of Ecosystem Services; Woodhead Publishing Limited: Cambridge, UK, 2009; ISBN 9781855738348. [Google Scholar]
- Stephenson, N. Climatic control of vegetation distribution: The role of the water balance. Am. Nat. 1990, 135, 649–670. [Google Scholar] [CrossRef]
- Yang, Y.; Watanabe, M.; Wang, Z.; Sakura, Y.; Tang, C. Prediction Of Changes In Soil Moisture Associated With Climatic Changes And Their Implications For Vegetation Changes: Waves Model Simulation On Taihang Mountain, China. Clim. Chang. 2003, 57, 163–183. [Google Scholar] [CrossRef]
- Arnold, J.G.; Kiniry, J.R.; Srinivasan, R.; Williams, J.R.; Haney, E.B.; Neitsch, S.L. Soil and Water Assessment Tool Input/Output Documentation; Texas Water Resources Institute: College Station, TX, USA, 2012. [Google Scholar]
- Andreadis, K.M.; Clark, E.A.; Wood, A.W.; Hamlet, A.F.; Lettenmaier, D.P. Twentieth-Century Drought in the Conterminous United States. J. Hydrometeorol. 2006, 6, 985–1001. [Google Scholar] [CrossRef]
- EC. Natura 2000 Standard Data Form: Explanatory Notes; European Comission: Brussels, Belgium, 2011. [Google Scholar]
- Cowx, I.G.; Fraser, D. Monitoring the Atlantic Salmon Salmo Salar; English Nature: Peterborough, UK, 2000.
- EC. Wildlife and Sustainable Farming and the Birds and Habitats Directives: How Species Conservation Can Be Supported through Rural Development Programmes—Good Practice Examples; European Comission: Brussels, Belgium, 2009. [Google Scholar]
- Marcinkowski, P.; Piniewski, M.; Kardel, I.; Szcześniak, M.; Benestad, R.; Srinivasan, R.; Ignar, S.; Okruszko, T. Effect of Climate Change on Hydrology, Sediment and Nutrient Losses in Two Lowland Catchments in Poland. Water 2017, 9, 156. [Google Scholar] [CrossRef]
- Piniewski, M.; Szcześniak, M.; Kundzewicz, Z.W.; Mezghani, A.; Hov, Ø. Changes in low and high flows in the Vistula and the Odra basins: Model projections in the European-scale context. Hydrol. Process. 2017, 31, 2210–2225. [Google Scholar] [CrossRef]
- Schneider, C.; Laizé, C.L.R.; Acreman, M.C.; Flörke, M. How will climate change modify river flow regimes in Europe? Hydrol. Earth Syst. Sci. 2013, 17, 325–339. [Google Scholar] [CrossRef]
- Dankers, R.; Feyen, L. Climate change impact on flood hazard in Europe: An assessment based on high-resolution climate simulations. J. Geophys. Res. 2008, 113, D19105. [Google Scholar] [CrossRef]
- Kundzewicz, Z.W.; Krysanova, V.; Dankers, R.; Hirabayashi, Y.; Kanae, S. Differences in flood hazard projections in Europe-their causes and consequences for decision making. Hydrol. Sci. J. 2017, 62, 1–14. [Google Scholar] [CrossRef]
- Dwire, K.A.; Mellmann-Brown, S.; Gurrieri, J.T. Potential effects of climate change on riparian areas, wetlands, and groundwater-dependent ecosystems in the Blue Mountains, Oregon, USA. Clim. Serv. 2017, 10, 44–52. [Google Scholar] [CrossRef]
- Jones, A.; Stolbovoy, V.; Rusco, E.; Gentile, A.-R.; Gardi, C.; Marechal, B.; Montanarella, L. Climate change in Europe. 2. Impact on soil. A review. Agron. Sustain. Dev. 2009, 29, 423–432. [Google Scholar] [CrossRef]
- Mihailović, D.T.; Drešković, N.; Arsenić, I.; Ćirić, V.; Djurdjević, V.; Mimić, G.; Pap, I.; Balaž, I. Impact of climate change on soil thermal and moisture regimes in Serbia: An analysis with data from regional climate simulations under SRES-A1B. Sci. Total Environ. 2016, 571, 398–409. [Google Scholar] [CrossRef]
- Webb, J.A.; Wallis, E.M.; Stewardson, M.J. A systematic review of published evidence linking wetland plants to water regime components. Aquat. Bot. 2012, 103, 1–14. [Google Scholar] [CrossRef]
- Maclean, I.M.D.; Bennie, J.J.; Scott, A.J.; Wilson, R.J. A high-resolution model of soil and surface water conditions. Ecol. Model. 2012, 237–238, 109–119. [Google Scholar] [CrossRef]
- Alcamo, J.; Döll, P.; Henrichs, T.; Kaspar, F.; Lehner, B.; Rösch, T.; Siebert, S. Global estimates of water withdrawals and availability under current and future “business-as-usual” conditions. Hydrol. Sci. J. 2003, 48, 339–348. [Google Scholar] [CrossRef]
- Foley, J.A.; Defries, R.; Asner, G.P.; Barford, C.; Bonan, G.; Carpenter, S.R.; Chapin, F.S.; Coe, M.T.; Daily, G.C.; Gibbs, H.K.; et al. Global Consequences of Land Use. Science 2005, 309, 570–574. [Google Scholar] [CrossRef]
- Neilson, R.P. Model for predicting continental-scale vegetation distribution and water balance—ScienceBase-Catalog. Ecol. Appl. 1995, 5, 362–385. [Google Scholar] [CrossRef]
- Oki, T.; Kanae, S. Global hydrological cycles and world water resources. Science 2006, 313, 1068–1072. [Google Scholar] [CrossRef]
- Richter, B.D.; Richter, H.E. Prescribing Flood Regimes to Sustain Riparian Ecosystems along Meandering Rivers. Conserv. Biol. 2000, 14, 1467–1478. [Google Scholar] [CrossRef]
- Glenz, C.; Schlaepfer, R.; Iorgulescu, I.; Kienast, F. Flooding tolerance of Central European tree and shrub species. For. Ecol. Manag. 2006, 235, 1–13. [Google Scholar] [CrossRef]
- Wheeler, B.D.; Gowing, D.J.G.; Shaw, S.C.; Mountford, J.O.; Money, R.P. Ecohydrological Guidelines for Lowland Wetland Plant Communities; Brooks, A.W., Jose, P.V., Whiteman, M.I., Eds.; Environment Agency Kingfisher House: Peterborough, UK, 2004.
- Barsoum, N.; Anderson, R.; Broadmeadow, S.; Bishop, T.N.H. Eco-Hydrological Guidelines for Wet Woodland—Phase 1; English Nature: Peterborough, UK, 2001; pp. 1990–2001.


© 2019 by the authors. Licensee MDPI, Basel, Switzerland. This article is an open access article distributed under the terms and conditions of the Creative Commons Attribution (CC BY) license (http://creativecommons.org/licenses/by/4.0/).