Article

Severe Water Deficiency during the Mid-Vegetative and Reproductive Phase has Little Effect on Proso Millet Performance

by
Mateja Grašič
*,
Aleksandra Golob
,
Katarina Vogel-Mikuš
and
Alenka Gaberščik
Department of Biology, Biotechnical Faculty, University of Ljubljana, Večna pot 111, SI-1000 Ljubljana, Slovenia
*
Author to whom correspondence should be addressed.
Water 2019, 11(10), 2155; https://doi.org/10.3390/w11102155
Submission received: 19 August 2019 / Revised: 11 October 2019 / Accepted: 11 October 2019 / Published: 16 October 2019
(This article belongs to the Section Water Use and Scarcity)

Abstract

:
Climate change can result in extreme droughts, significantly affecting crop production. C4 crop proso millet (Panicum miliaceum L.) has the lowest water consumption among all of the cereal crops. Understanding its survival mechanisms is thus crucial for agriculture. Furthermore, yield reduction does not only occur directly due to water shortage, but is also a consequence of an impaired element uptake during drought. This study aimed to examine the effect of water deficiency on proso millet leaf traits, plant biomass partition, and yield. In addition, leaf element contents were analysed, including silicon, which is an important multifunctional element for grasses. The majority of the measured parameters showed little change from the control to the moderate and severe water shortage treatments, even though the soil moisture levels differed significantly. The most pronounced reduction in comparison to the control was for leaf biomass, leaf stomatal conductance, and leaf silicon, phosphorus, calcium, and sulphur contents. Conversely, an increase was obtained for leaf potassium and chlorine contents. Panicle biomass was the same for all plant groups. Leaf silicon was positively correlated to reflectance in the UV region, while leaf calcium was negatively correlated to reflectance in the visible regions, which might prevent damage due to short-wave UV radiation and provide sufficient visible light for photosynthesis. The efficient light and water management, reduction of leaf biomass, and same-sized root system may be the mechanisms that mitigate the negative effects of water shortage in proso millet.

1. Introduction

Climate change is expected to result in more and more frequent extreme weather events, which will significantly affect crop production [1]. In recent years, most European countries have been affected by pronounced drought events [2,3]. Crops can suffer up to 50% yield loss if drought occurs during their reproductive phase [4,5]. Yield reduction does not only occur directly due to water shortage, but is also a consequence of impaired nutrient uptake during drought. These effects of drought on the nutritional status of crops varies across different nutrients and species [6].
According to Li et al. [7], the rates of yield reduction in major crops due to drought are expected to increase by >50% by 2050, and by almost 90% by 2100. Therefore, adaptation measures to avoid these losses need to be undertaken. Growing drought-tolerant crops with low nutrient requirements, or at least more resilient crops, is becoming increasingly important. In such a manner, it might be possible to compensate for yield reductions due to drought events and for the decreased quality and quantity of arable land, and thus to ensure more sustainable adequate food production for the ever-growing global population [8,9,10,11].
In addition, understanding plant strategies to cope with drought is becoming more and more important. Plants have evolved a variety of morphological and physiological adaptations to resist drought and thus to preserve optimal relative water content in their tissues [12,13]. The accumulation of silicon (Si) in plant tissues can increase plant resistance against various abiotic and biotic constraints, including water shortage [14,15]. The beneficial impact of Si on plant water status during water shortage has been shown for many plant species [15]. The deposition of Si in the cuticle, prickle hairs, epidermis, endodermis, and the outermost layers of the roots increases plant water-use efficiency [16,17]. Si also benefits plant water management by improving plant osmotic potential, through enhancing aquaporin transport activity and promoting root growth [15]. Hattori et al. [18] showed that in sorghum, Si has a critical role in root growth and water movement from the rhizosphere to the roots during water shortage. Drought stress also has strong negative effects on the growth rate and quality of Kentucky bluegrass, while Si application alleviated these negative effects [19].
However, during water shortage, the availability of Si is limited, as the uptake of Si and other elements depends on the transpiration stream in plants [20,21]. Nevertheless, the content of Si in proso millet leaves under moderate water shortage is only slightly affected. However, significant reductions in the leaf content of calcium (Ca) and phosphorus (P) were reported [22]. This does not hold true for barley, where moderate water shortage reduced leaf Si content by nearly 40% [23]. The differences regarding Si uptake might also arise due to different water-use efficiencies, which are significantly higher in C4 plants compared to C3 plants [24]. Indeed, Si is especially important for grasses, where its deposition in the plant tissues provides structural rigidity to leaves and stems, and thereby prevents plant lodging [25]. The different patterns of Si deposition are seen for different metabolic types, namely the C3 and C4 grasses [26]. Panicoid C4 grasses produce dumbbell-shaped silica structures in their leaves, while festucoid C3 grasses with long prickle hairs produce oval silica structures [27]. The changes in leaf element contents may significantly affect leaf optical properties [28,29]. The light reflected from leaves has multiple functions, namely it provides a basis for an understanding of the photosynthetic performance and energy balance in plants [30,31]. It may be used for stress detection [32], including stress due to decreased leaf water potential [33], and even for classification of species [34,35].
Chlorophyll fluorescence is a well-known phenomenon, suitable for investigating the effect of drought on plants [36]. In particular, the sensitive parameter is Fv/Fm that reflects the quantum efficiency of PS II photochemistry [37]. Our previous studies have shown that moderate water shortage during plant development does not affect the quantum efficiency of PS II photochemistry and the yield of proso millet plants [22]. In their review, Guidi et al. [38] also reported that mild water shortage did not affect the quantum efficiency of PS II photochemistry, while during severe stress, both photosystems may be affected. The response of different soybean cultivars showed maximum values of enzymatic activities, chlorophyll fluorescence parameters including Fv/Fm, and total soluble protein in a drought-tolerant cultivar [39]. However, the study of perennial ryegrass revealed that the reaction of the photosynthetic machinery to drought stress is a very complex process [40].
Proso millet (Panicum miliaceum L.) is an annual thermophilic, drought-resistant, and short-season C4 crop with a long history of cultivation [41]. By offering many health benefits to humans due to its abundance of phenolic compounds [42] and by being rich in nutrients, proso millet has gained in popularity once again, particularly in terms of an increase in ecological farming [43]. Through its short growing season and very low water and nutrient requirements, proso millet is a very resilient crop that can thrive and produce good yields at a variety of altitudes, and can withstand various environmental constraints, such as drought, high temperatures, and poor soils [44,45]. Proso millet has the lowest water consumption among all of the cereal crops due to its high water-use efficiency [45], which is one of the benefits of C4 metabolism [46].
The aim of our study was to examine the effect of severe water deficiency during the mid-vegetative and reproductive phase of proso millet on leaf traits, including the leaf element contents and leaf optical properties, on plant biomass partition, and on yield of proso millet. It was hypothesised that severe water shortage would cause stress to the proso millet plants, which would result in altered leaf structural and optical properties, and in reduced Fv/Fm and plant yield. Due to the dependence of the element uptake on water availability, a significant reduction of the contents of the leaf elements was also expected, namely silicon, calcium, and phosphorus in plants that suffered from severe drought in comparison to those exposed to control and moderate water shortage treatments.

2. Materials and Methods

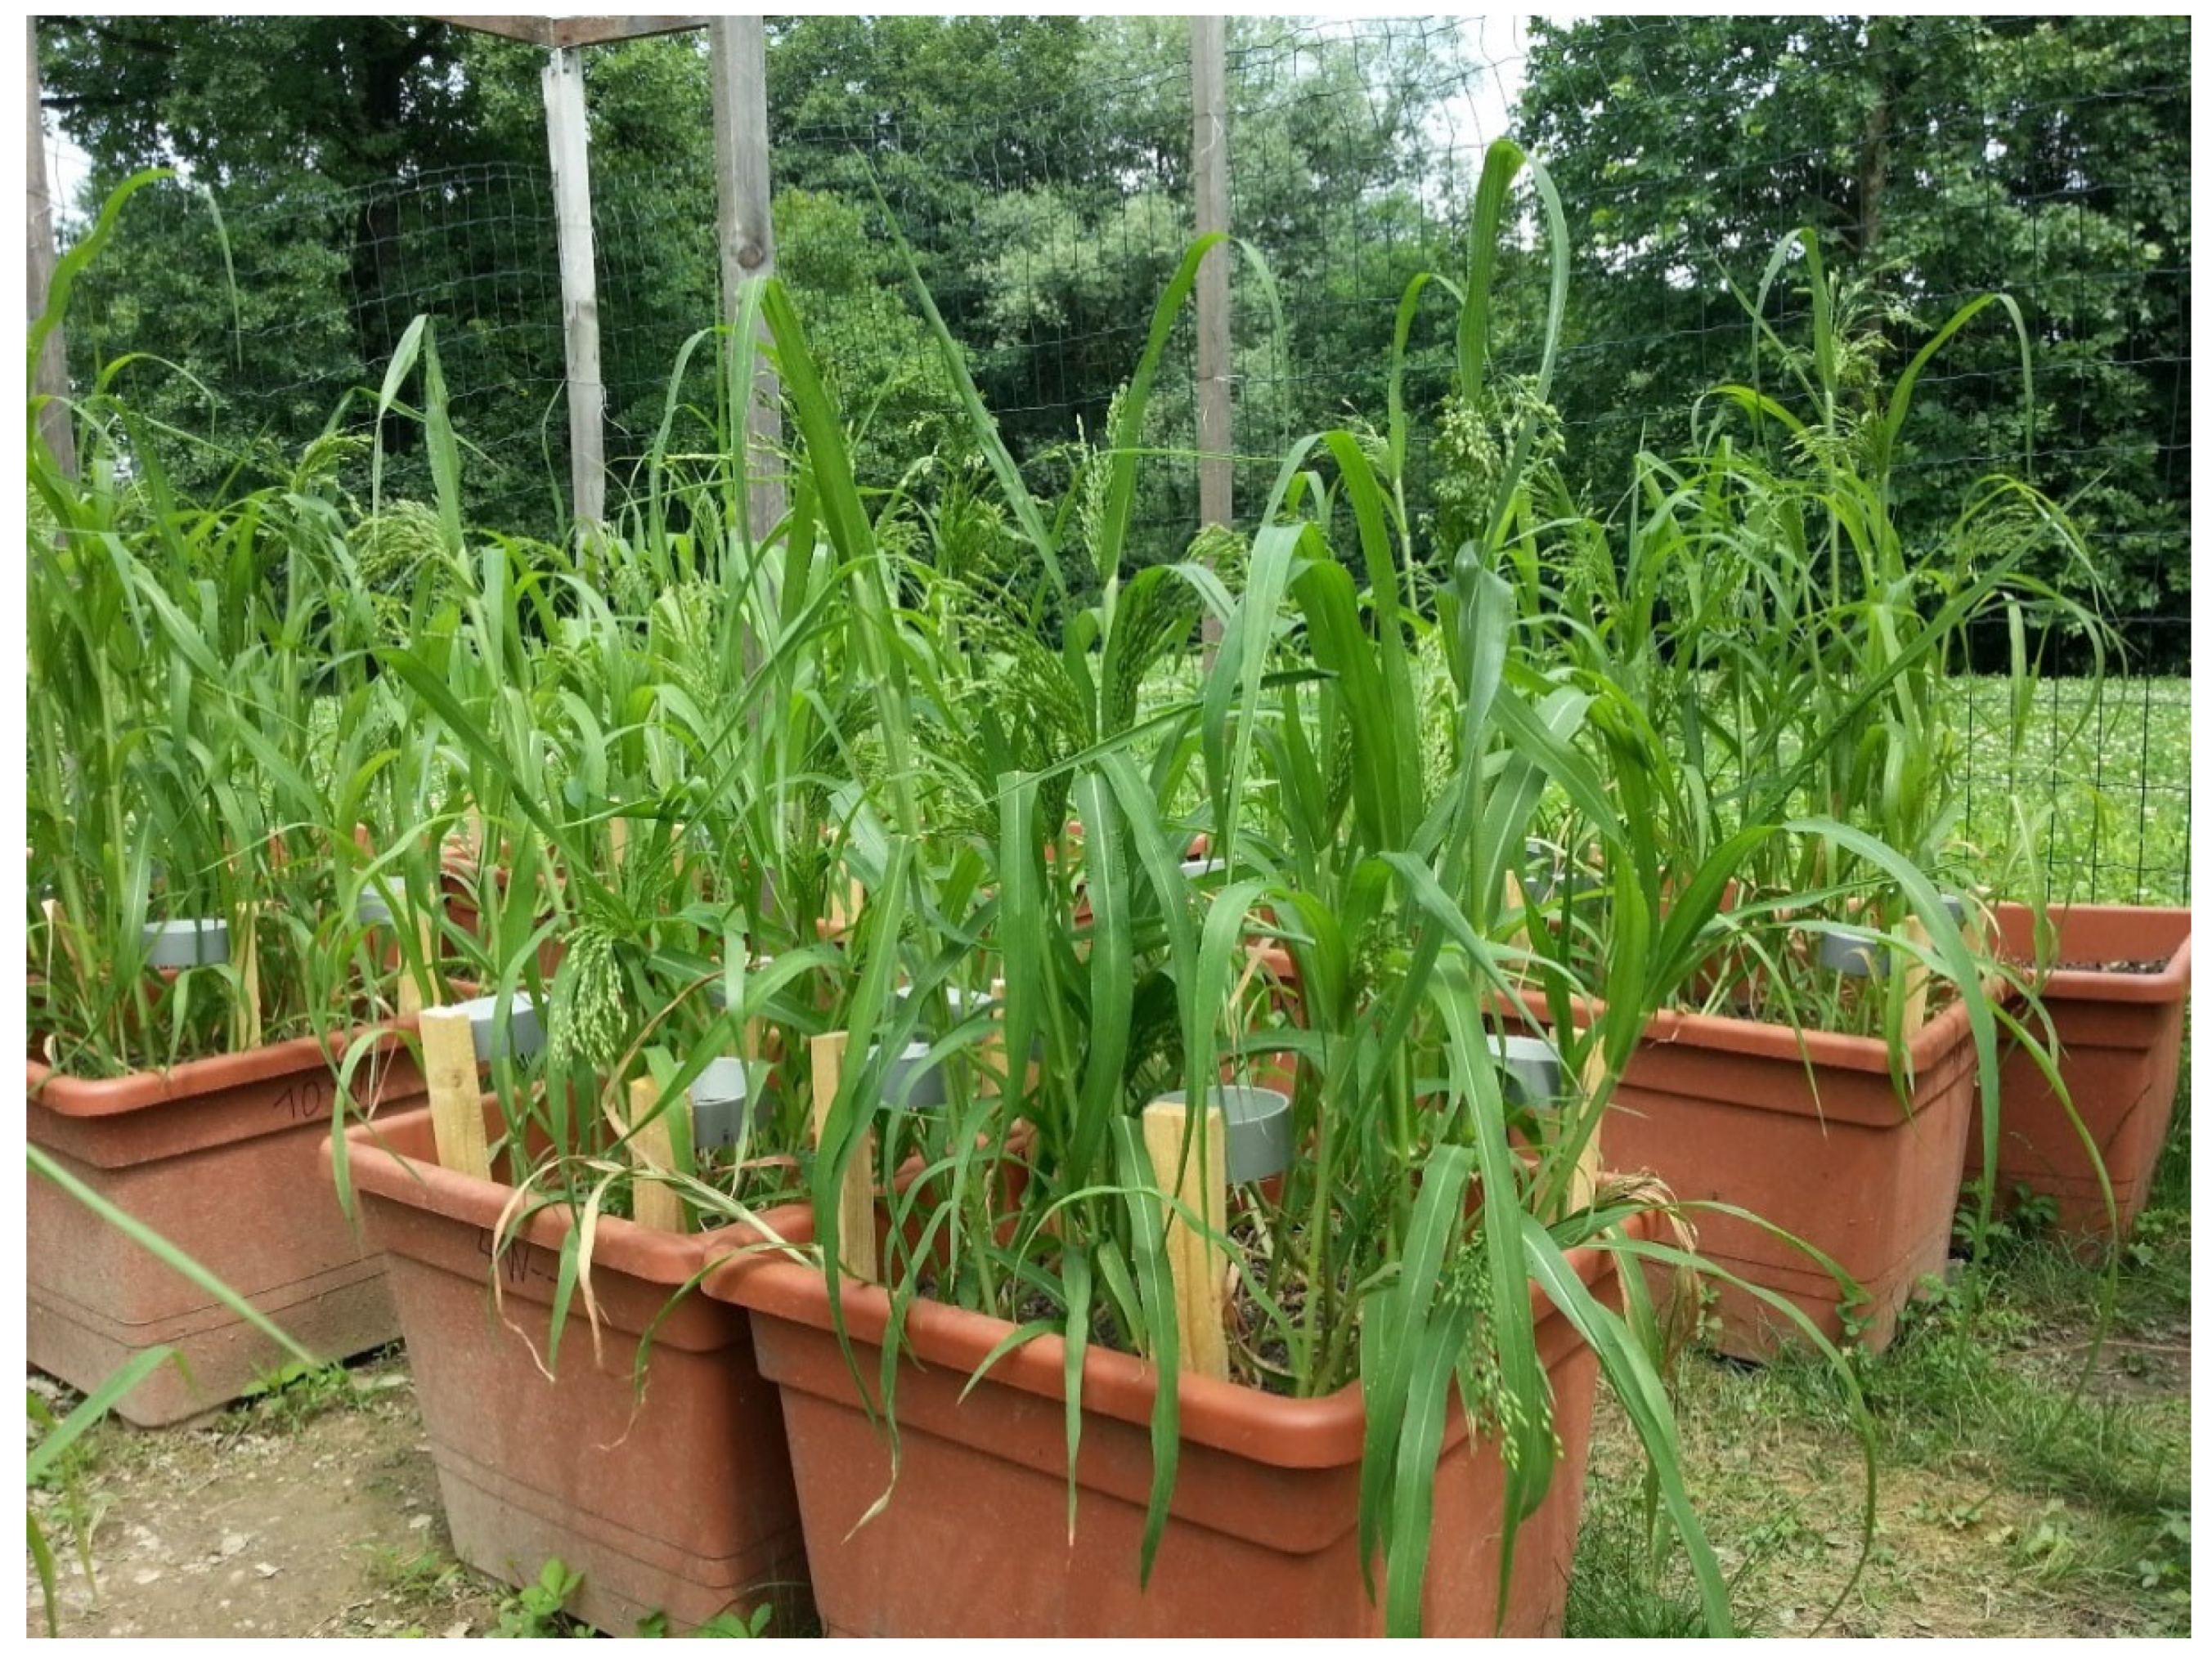
2.1. Experimental Design

The test species for this study was proso millet (Panicum miliaceum L.) cv. Sonček, which is an indigenous Slovenian variety. The seeds were sown in 15 plastic pots (44 cm × 44 cm × 36 cm; 56 seeds/pot) containing soil from the Ljubljana Botanical Garden (Ljubljana, Slovenia). The soil was well-stirred and sifted prior to the experiment, to achieve as homogeneous an initial soil composition as possible. The pots were placed outside in a fenced research plot (4 m × 6 m; Biotechnical Faculty, University of Ljubljana; 46°03′03.9′′ N, 14°28′14.4′′ E). On 7 June, 2018, cast polymethyl methacrylate sheets (Polycasa Cast UVT; Polycasa, Geel, Belgium) were erected on a wooden frame above the pots at ~150 cm above the soil level, to prevent any precipitation from reaching the soil in the pots, and thus to maintain the appropriate soil moisture levels. These panels were transparent to UV and visible radiation (transmission wavelengths, ≥290 nm). From 15 June, 2018, onwards, five pots received less water, and five further pots received an even smaller amount of water. This provided the three different water availability treatments (five pots/treatment): well-watered (WW), the control; mild water shortage (MWS); and severe water shortage (SWS). The experimental period was for ~1 month (Figure 1), from 15 June (day 0) to 17 July (day 32), 2018. During this time, the WW (control) plants were watered regularly, on average every 2 days. By day 31, the MWS plants had received ~56% the water of the control plants, while the SWS plants had only received water five times throughout the experimental period, as ~13% of the water received by the control plants. The first emerging inflorescences were seen on 21 June, 2018 (day 6), for the plants in the pots with the lowest water input (SWS).

2.2. Environmental Conditions

The soil moisture levels were measured before the plants were watered, always in five specified equally distant places per each pot around the proso millet plants and in the middle of them, with a moisture probe meter (MPM-160-B; ICT International Pty Ltd., Armidale, NSW, Australia). The initial soil moisture levels were determined at the beginning of the experimental period, on 15 June, 2018 (day 0). Afterwards, they were measured an additional seven times, to the end experimental period. The first five soil moisture measurements were ~6 days apart (days 0, 6, 12, 17, 24), while the remaining three measurements were carried out within the last week of the experimental period (days 25, 27, 32). The soil temperatures were recorded once every 2 h from 28 June to 17 July, 2018 (days 13–32), using water temperature data loggers (UTBI-001 TidbiT v2; Onset Computer Corporation, Bourne, MA, USA). The sensors were buried between the roots, ~3 cm deep and as close as possible to the middle of each of two randomly selected pots per treatment. The data collected were then transferred to a computer via a USB connector, using a U-4 HOBO Optic USB Base Station and a 2-D Coupler (Onset Computer Corporation).

2.3. Plant Analyses

The initial measurements on 15 June, 2018 (day 0), were also performed for the leaf physiological parameters of stomatal conductance, and the maximum and effective quantum efficiency of photosystem (PS) II photochemistry. The leaf physiological parameters were subsequently measured another four times, at ~6-day intervals (days 6, 12, 17, 25 for stomatal conductance; days 6, 12, 17, 24 for maximum and effective quantum efficiency of PS II photochemistry). Almost four weeks after the start of the experimental period, on 11 July, 2018 (day 26), proso millet leaves were analysed for their morphological, biochemical, and optical properties. Three leaves/pot (subsamples) were used for all of these analyses. On 12 July, 2018 (day 27), two leaves/pot (subsamples) were analysed for their relative water content. On 16 July, 2018 (day 31), the proportions of lodged plants/pot were determined, along with the plant height (including panicles) for the three tallest proso millet plants/pot (subsamples). These were subsequently collected for analysis of the plant biomass based on the dry matter.
The plants collected were separated into the different plant parts, as panicles, living leaves, dead leaves, stems, and roots. All of the healthy-looking green leaf parts were allotted to the living leaves category, and parched brownish parts of the leaves were considered as dead leaves. These plant parts were separately dried in an oven (Memmert Modell 100–800; Memmert GmbH and Co. KG, Schwabach, Bavaria, Germany) at 105 °C for at least 24 h to reach constant weight, which depended on the thickness of each plant part [47]. As soon as they were taken out of the oven, the plant parts were put into a desiccator containing silica gel for ~30 min, to allow them to cool down and to prevent moisture uptake before weighing. The experimental period ended on 17 July, 2018 (day 32), at which time the leaves were collected for element analysis. All of the leaf properties were analysed on the second youngest fully developed vital proso millet leaves. On the following day (18 July, 2018; day 33), five grains/treatment were collected to determine their dry matter. These had their fresh weights recorded initially, and then their dry weights after drying in an oven at 105 °C for 24 h.

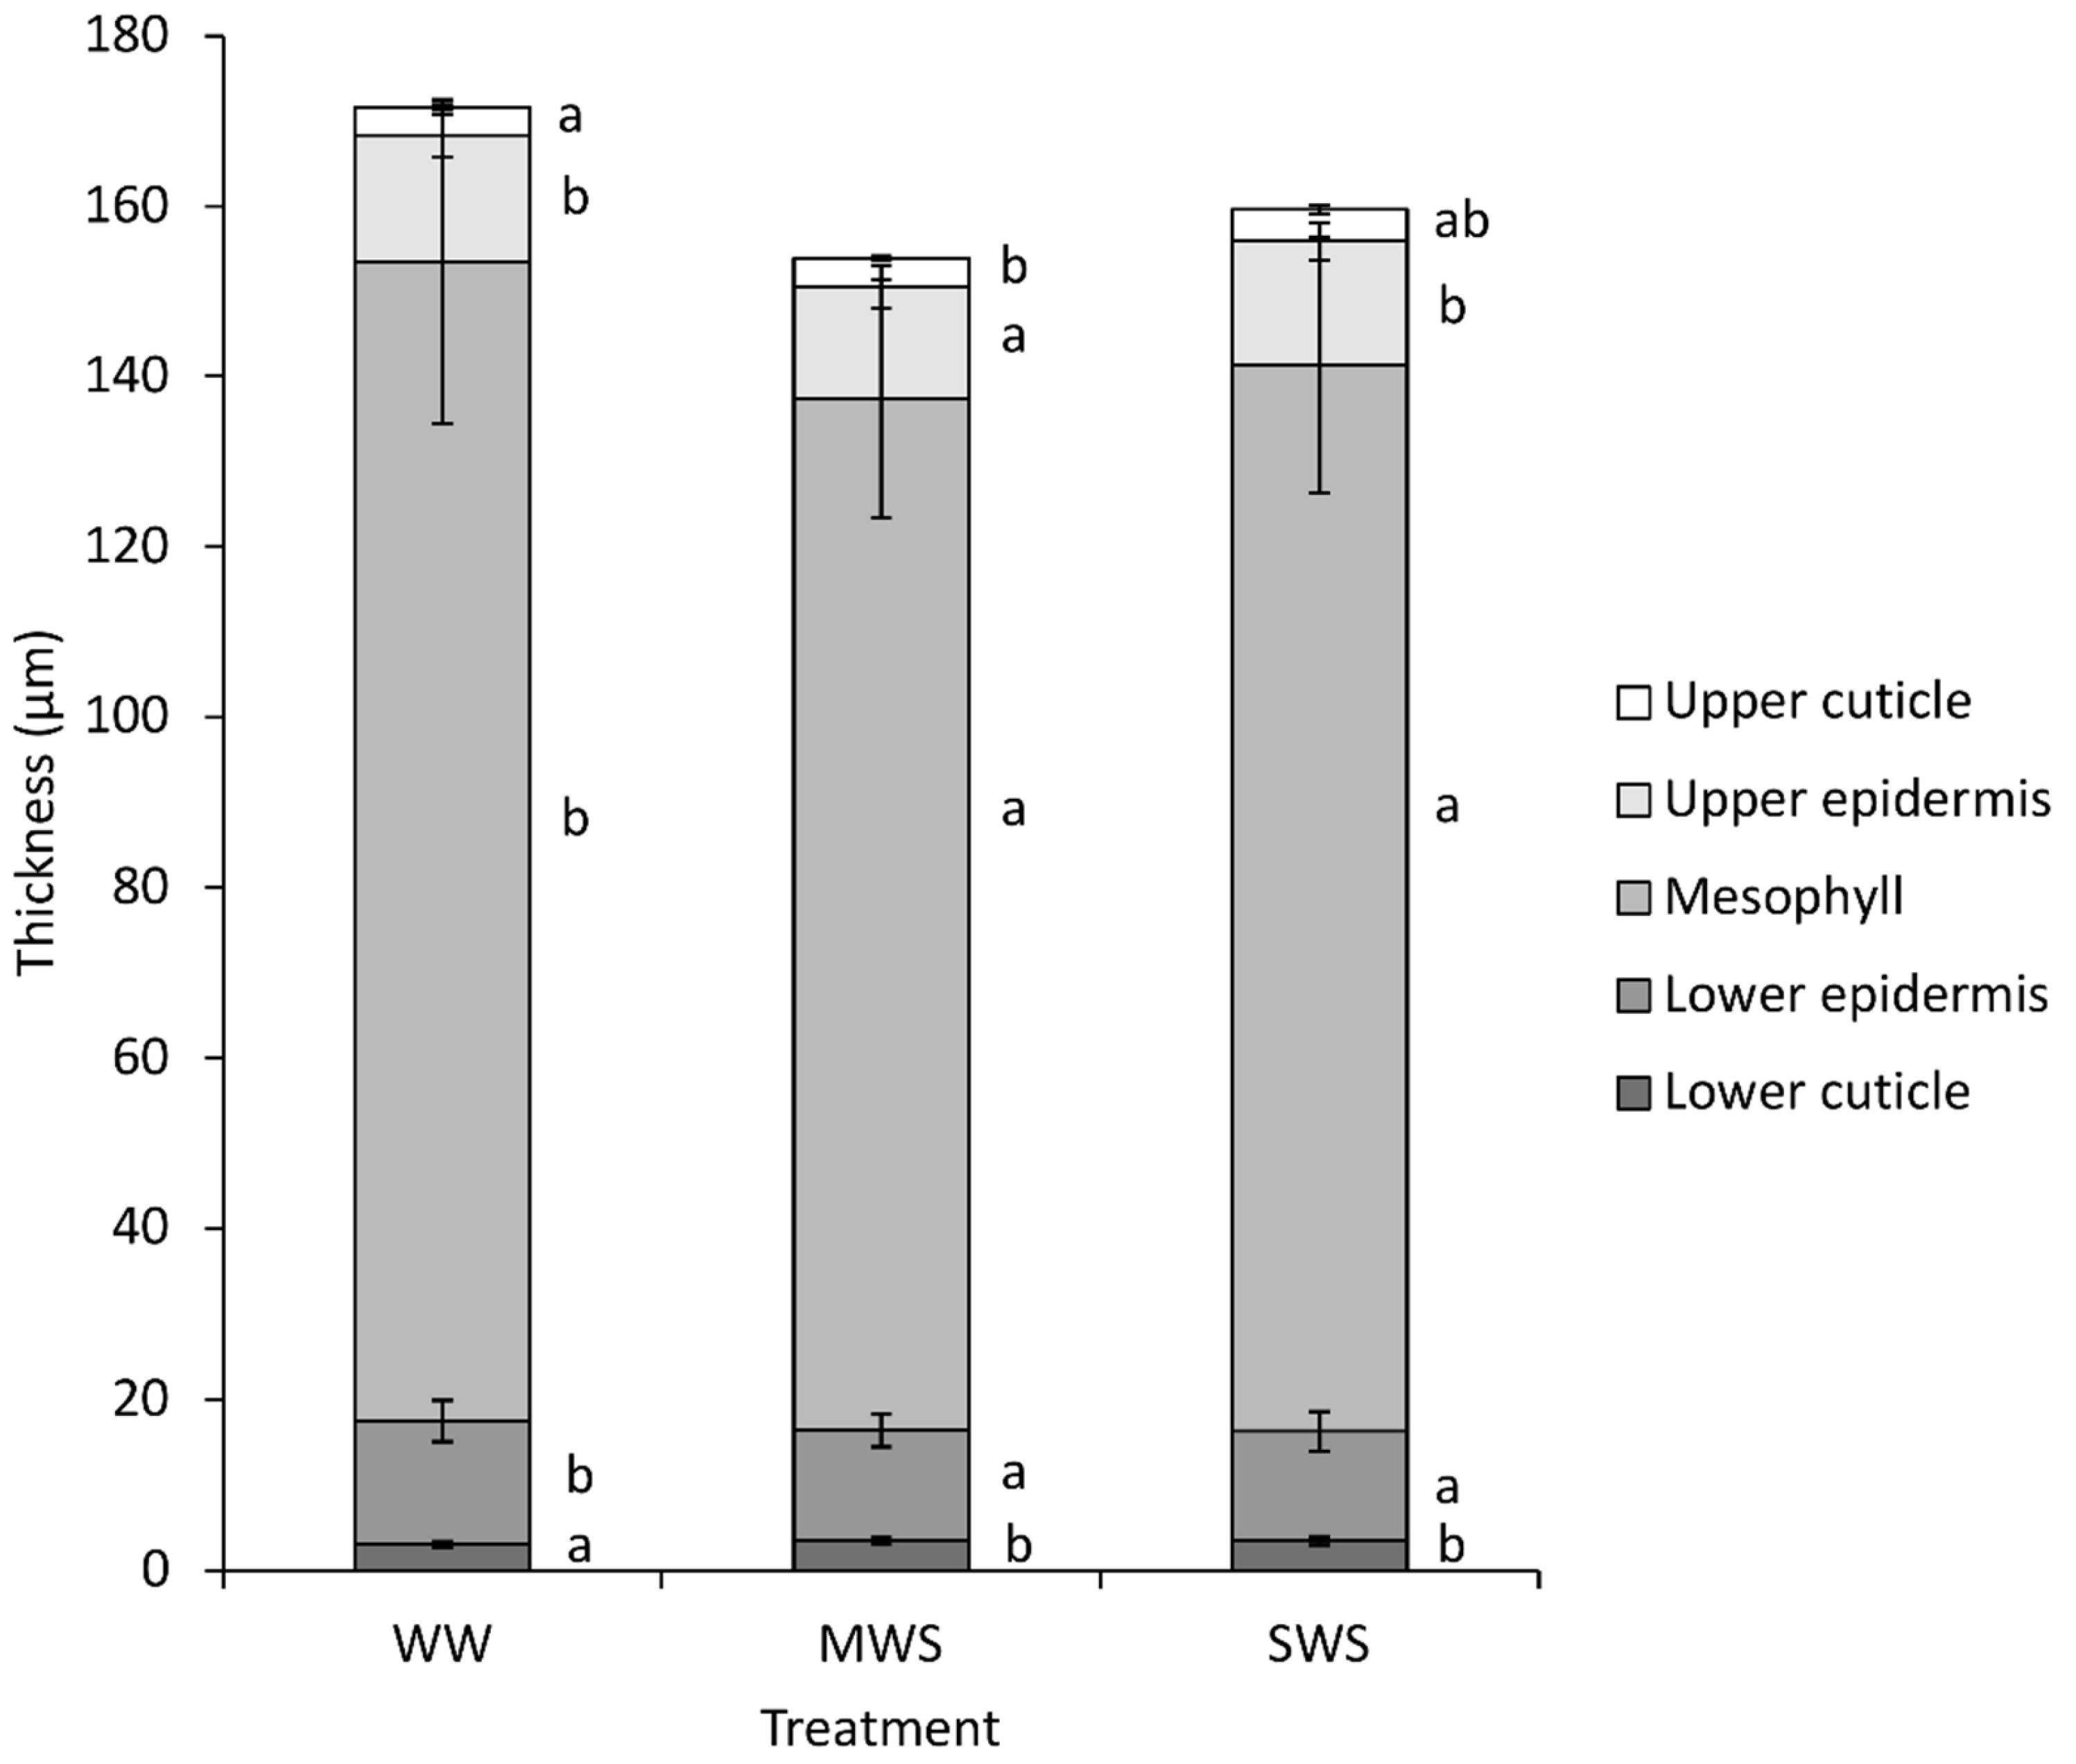
2.3.1. Leaf Morphological Properties

An analysis of the proso millet leaf morphological properties was carried out on the leaves collected on day 26, as transverse sections of vital and fully developed proso millet leaves, and on their impressions that were made using transparent nail polish. The parameters measured were leaf and mesophyll thickness (magnification, 100×), epidermis and cuticle thickness, and leaf stomata length and density (magnification, 400×). While cutting, the leaves were held between two pieces of expanded polystyrene. Approximately, 20 µm thick slices were cut with a razor-blade from the central part of the leaf, to the left or right of the main leaf vein. All of the measurements were performed on the central part of the leaves, under light microscopy (CX41; Olympus, Tokyo, Japan) equipped with a digital camera (XC30; Olympus) and the cellSens Imaging Software 1. 4. 1 (Olympus).
Additionally, the specific leaf area of the leaves was used for these analyses, as determined according to dry weight of round leaf cuttings with known leaf area (r = 4.5 mm). These were dried in an oven to reach constant weight at 105 °C for 24 h.

2.3.2. Leaf Biochemical Properties

Leaf chlorophyll a, chlorophyll b, and carotenoid contents were determined on proso millet leaf extracts [48,49], from the leaves collected on day 26. The absorbance was measured using a UV/VIS spectrometer (Lambda 25; Perkin-Elmer, Norwalk, CT, USA) at 470 nm, 645 nm, and 662 nm. The leaf anthocyanin content was also determined on the leaf extracts of the proso millet leaves, with absorbance measured at 530 nm [50]. Additionally, the total methanol-soluble UV-B–absorbing and UV-A–absorbing compounds were extracted from fresh proso millet leaves, with absorbance measured from 280 nm to 319 nm, and 320 nm to 400 nm, respectively [51]. The extinction values were integrated for each UV region.

2.3.3. Leaf Physiological Properties

The measurements of chlorophyll fluorescence of the proso millet leaves were conducted using a modulated fluorometer (OS5-FL; Opti-Sciences, Hudson, NH, USA). The maximum and effective quantum efficiency of PS II photochemistry (Fv/Fm and Fq’/Fm’, respectively) on days 0, 6, 12, 17, 24 was evaluated according to Schreiber et al. [52]. The leaf stomatal conductance on days 0, 6, 12, 17, 25 was measured using a steady-state leaf porometer (Decagon Devices, Inc., Pullman, WA, USA). This device surveyed the rate of water vapour diffusion via the leaf surfaces. All of the leaf physiological parameters were measured around noon time in situ.

2.3.4. Leaf Optical Properties

The reflectance and transmittance of the proso millet leaves collected on day 26 were determined in the laboratory on vital and fully developed proso millet leaves straight after they were cut. Carefully, the cut leaf ends were immediately covered with wet towels to limit turgor loss. The reflectance spectra were measured from 290 nm to 880 nm, and the transmittance spectra were measured from 290 nm to 800 nm, at a resolution of ~1.3 nm. The measurements were conducted using a portable spectrometer (Jaz Modular Optical Sensing Suite; Ocean Optics, Inc., Dunedin, FL, USA; grating, #2; slit size, 25 µm) with an optical fibre (QP600-1-SR-BX; Ocean Optics, Inc.) and an integrating sphere (ISP-30-6-R; Ocean Optics, Inc.). The leaf reflectance spectra were measured for the adaxial leaf surfaces by illumination with a UV/VIS-near infrared (NIR) light source (DH-2000; Ocean Optics, Inc.). The white reference panel with >99% diffuse reflectance (Spectralon; Labsphere, North Sutton, NH, USA) was used for calibration of the spectrometer to 100% reflectance. The leaf transmittance spectra were measured for the abaxial leaf surface by illumination of the adaxial leaf surface with the light source. Here, the calibration to 100% transmittance was done with a light beam passing directly into the interior of the integrating sphere.

2.3.5. Leaf Relative Water Content

The analysis of relative water content of leaves collected on day 27 was carried out following the procedure described by González and González-Vilar [53]. Ultrapure water (Milli-Q Advantage A10 Water Purification System; Merck KGaA, Darmstadt, Hesse, Germany) was used for this analysis. To avoid excessive water loss from the fresh leaf cuttings, only four leaves were processed at once.

2.3.6. Leaf Bulk Element Analysis

The contents of Si, P, sulphur (S), chlorine (Cl), potassium (K), and Ca in the proso millet leaves collected on day 32 were determined using X-ray fluorescence spectrometry. From 100 mg to 500 mg of dried and powdered leaves was pressed into pellets using a pellet die and a hydraulic press. 55Fe (25 mCi; Isotope Products Laboratories, Valencia, PA, USA) was used as the primary excitation source for the analysis. The emitted fluorescence radiation was collected by a Si drift diode detector (Amptek, Inc., Bedford, MA, USA) with a 12-μm-thick beryllium window. The energy resolution of the spectrometer at count rates <1000 cps was 140 eV at 5.9 keV. The X-ray fluorescence spectrometry analysis was conducted under vacuum and the samples were irradiated for 5000 s to obtain spectra with sufficient statistics [54]. The analysis of the X-ray spectra was carried out using an iterative least-squares programme, as included in the quantitative X-ray analysis system software package [55]. The element quantification from the measured spectra was performed using a quantitative analysis of environmental samples based on the fundamental parameters [56]. The quality assurance for the element analysis was determined using standard reference materials: NIST SRM 1573a (tomato leaves as a homogenised powder), in the form of pressed pellets.

2.4. Soil Analysis

The soil samples were collected from all of the 15 experimental pots before and after the experimental period (days −1, 32). The samples were air-dried for ~3 months and ~2 months, respectively, and were later sifted through a 0.5 mm × 0.5 mm mesh sieve. For each of the two samplings, five samples were collected, which comprised three subsamples (i.e., every sample contained soils from three randomly chosen pots, wherein each pot was included only once). In addition, the pots from the second sampling were selected in such a way that all of the three treatments were included in each sample.

2.4.1. Analysis of Plant-Available Si in the Soil

The plant-available Si in the soil was extracted from ~300 mg of dried and powdered soil samples collected on days −1 and 32, using 0.01 M CaCl2, according to Korndörfer et al. [57]. These samples were then processed using a commercially available kit (Heteropoly Blue Method (1.600 mg/L SiO2; method number, 8186); Hach Lange GmbH, Düsseldorf, Germany). The absorbance was measured with a spectrometer at 815 nm (DR 3900; Hach Lange GmbH). The results are expressed as mg Si per kg of soil dry matter (mg Si kg−1 soil DM) for the samples collected before and after the experimental period.

2.4.2. Soil Bulk Element Analysis

The total soil Si and Ca levels before and after the experimental period (days −1, 32) were measured from ~300 mg dried and powdered soil samples. The methodology was already described in Section 2.3.6.

2.5. Statistical Analysis

The Shapiro-Wilk tests were used to evaluate the normal distributions of the data. The homogeneity of variance from the means was analysed using Levene’s tests. A one-way analysis of variance (ANOVA) according to Duncan’s post-hoc multiple range tests was used to assess the differences between the three treatments for each measured parameter. Pearson’s correlation analysis was performed to examine the relationships between the selected parameters. This study used IBM SPSS statistics 22.0 for these statistical calculations, with significance accepted at p ≤ 0.05. To assess the difference between plant-available Si levels in the soil before and after the experimental period, Student’s t-tests were performed in Microsoft Excel 2016. The same type of statistical analysis was also performed for the total soil Si and Ca levels. For the exploratory data analysis, detrended correspondence analysis using the CANOCO for Windows 4.5 programme package was used. Due to the gradient lengths obtained (<3 SD) [58], redundancy analysis was conducted to determine whether the variations in the leaf element contents were related to the water-related parameters. The significance of the effects of the variables was determined using Monte Carlo tests with 999 permutations. To avoid collinearity, forward selection of the explanatory variables was used. All of the variables used in the analysis were standardised. Figure 2, Figure 3, Figure 4, Figure 5 and Figure 6 were drawn using Microsoft Excel 2016, while Figure 7 was generated using CanoDraw for Windows 4.5.

3. Results

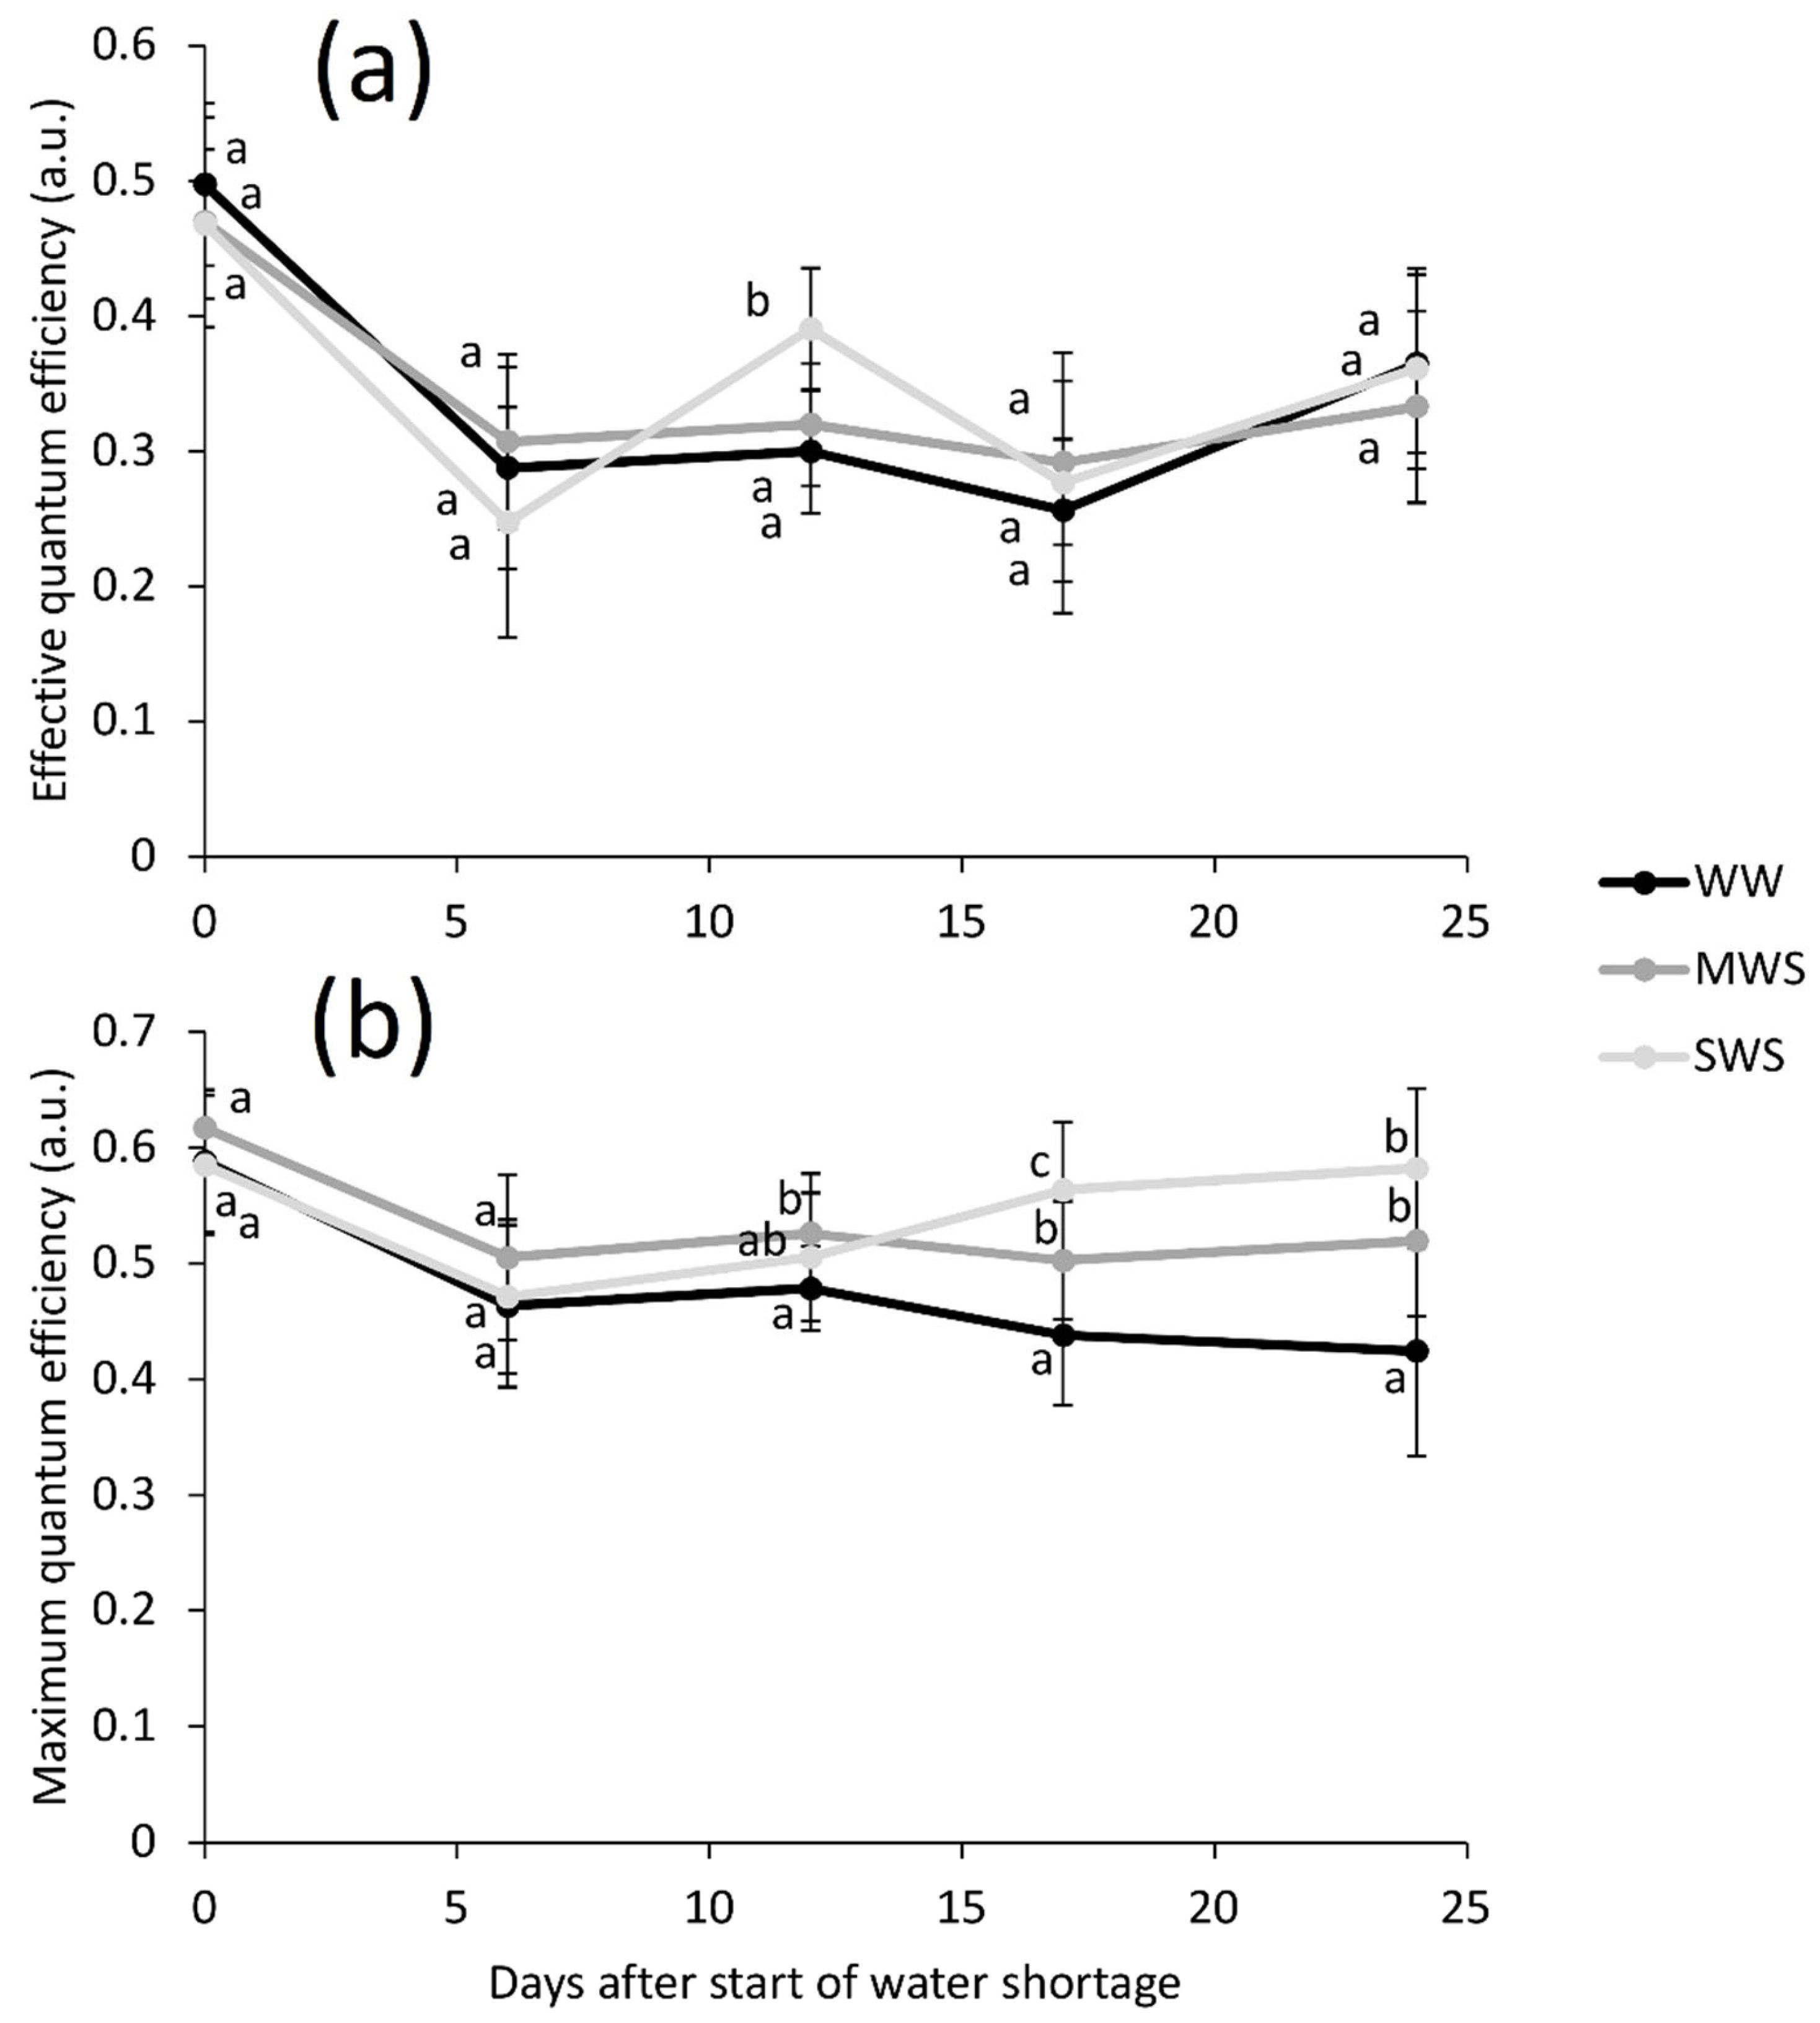
3.1. Environmental Conditions and Plant Parameters

Throughout the experimental period, three significantly different soil moisture levels were created and maintained for the three treatments (Figure 2). Initially, as can be seen from Figure 2, the soil moisture levels did not differ significantly between the three treatments. Later on, the only exception where the soil moisture levels did not differ significantly between the MWS and SWS treatments was for day 25 of water shortage. Overall, the mean soil moisture levels during the water shortage (i.e., days 6, 12, 17, 24, 32) were 20.5 ± 5.2%, 10.5 ± 5.1%, and 6.8 ± 4.6%, for WW, MWS, and SWS, respectively (Figure 3; n = 25).
The soil temperature was also recorded during the experimental period, although no significant differences were seen between the water treatments. The mean soil temperature ranged from 21.9 °C to 22.7 °C (n = 460).
The Si content in the proso millet leaves sampled on day 32 decreased significantly from WW to SWS, thus paralleling the decreased soil moisture levels (Figure 3). However, there was no significant difference in the leaf Si content between the MWS and SWS plants. Among the other measured elements in the proso millet leaves sampled on day 32, P and S showed similar responses to Si, where the leaf contents were significantly lower under the two drought treatments (MWS, SWS) compared to the control (WW) (Table 1). A similar trend was also seen for Ca for these leaves sampled on day 32, with a significant difference only seen between WW and SWS. On the other hand, Cl and K on day 32 showed just the opposite, with significantly higher leaf contents for the SWS treatment compared to WW and MWS for K, although for Cl this difference only reached significant for MWS versus SWS.
The Fq’/Fm’ of the leaves from the proso millet plants showed only minor differences under these three different water availability levels that did not reach statistical significance (Figure 4, Table 1). In general, across all of the water treatments during the experimental period (Figure 4; days 0–24), there were similar decreases and increases seen due to the variations in the weather conditions for the different measurement days. The only significant difference was seen for the day 13 of the water shortage, where the SWS plants showed significantly higher Fq’/Fm’ compared to the plants from the remaining two treatments (WW, MWS).
The Fv/Fm of the leaves from the proso millet plants was also very similar between the three treatments during the experimental period (Figure 4, Table 1; days 0–24). The significant differences between the treatments started to emerge only after day 13 of water shortage, as Fv/Fm of the MWS plants was significantly higher compared to the control WW plants, as later also for the SWS plants. These SWS plants generally showed higher Fv/Fm in the second half of the experimental period. For day 18 of water shortage, Fv/Fm also differed significantly between MWS and SWS.
On day 0, when the water shortage treatments were started, there were no significant differences between the treatments for the stomatal conductance, which ranged from 15 to 19 mmol m−2 s−1 (n = 5). By day 25, this remained relatively low for all of the water treatments (Table 1). Nevertheless, it was significantly different across the three water treatment groups, showing a decrease with decreased water availability.
The thickest proso millet leaves were seen for the control WW treatment, with significant differences compared to both MWS and SWS (Table 1, Figure 5). In general, the epidermis and mesophyll was seen to be significantly thinner in the MWS and SWS leaves compared to the WW control (Figure 5), although this significance was lost compared to the upper epidermis from WW to SWS. Conversely, the cuticles of the proso millet leaves were seen to be thicker for MWS and SWS compared to the WW control, although again this significance was lost comparing the upper cuticle from WW to SWS.
The proso millet specific leaf areas and stomata lengths and densities did not show any significant differences between these water treatments (Table 1). The only exception here was for the upper leaf surface stomata density, which was significantly higher for MWS in comparison to the WW control. It should be noted that a few prickle hairs were seen on some of the proso millet leaf sections during the analysis of the leaf morphology under light microscopy. These were, however, not analysed here due to their low occurrence.
Among the plant biomass parameters, there were no significant differences between the three water treatments for panicles and roots sampled on day 31 (Figure 6). However, a trend to increased panicle biomass with decreased water availability was noted. Moreover, by the sampling here on day 31 of the water treatments, the SWS plants appeared to be more mature than the WW and MWS plants. The stem biomass on day 31 differed significantly only between the MWS and SWS plants. On the other hand, the leaf biomass correlated with water availability, as the living leaf biomass was significantly lowest with the SWS treatment, while the MWS and SWS plants had significantly greater dead leaf biomass than the WW control.
No significant differences were seen for the leaf biochemical parameters measured according to the water availability (Table 1). Nonetheless, the SWS plants showed the highest amounts of the protecting UV-absorbing compounds.
Leaf reflectance and transmittance on day 26 did not show many significant differences between these three water treatments (Table 1). The MWS and SWS plants showed significantly lower leaf reflectance in the UV than the WW control, while in the visible regions of the spectrum, the leaf reflectance was generally significantly highest for the SWS plants. The differences were even less clear for leaf transmittance, with the only real significance seen for the violet and blue regions of the spectrum, which were significantly higher for the SWS plants.
The leaf relative water content on day 27 was similar for the WW and MWS plants, while it was significantly lower for the SWS treatment (Table 1). The plant height on day 31 was, however, significantly lower with decreased water availability, with the lowest plants seen for SWS. The highest proportion of lodged plants was seen for the WW control, and this was significantly lower for the MWS plants. The SWS plants showed an intermediate level that was not significantly different from either WW or MWS.
The mean grain dry matter at the end of the experimental period (day 33) showed an increasing trend with decreasing water availability, from 33.9 g to 52.8 g. However, these data were not analysed further due to the lack of material.

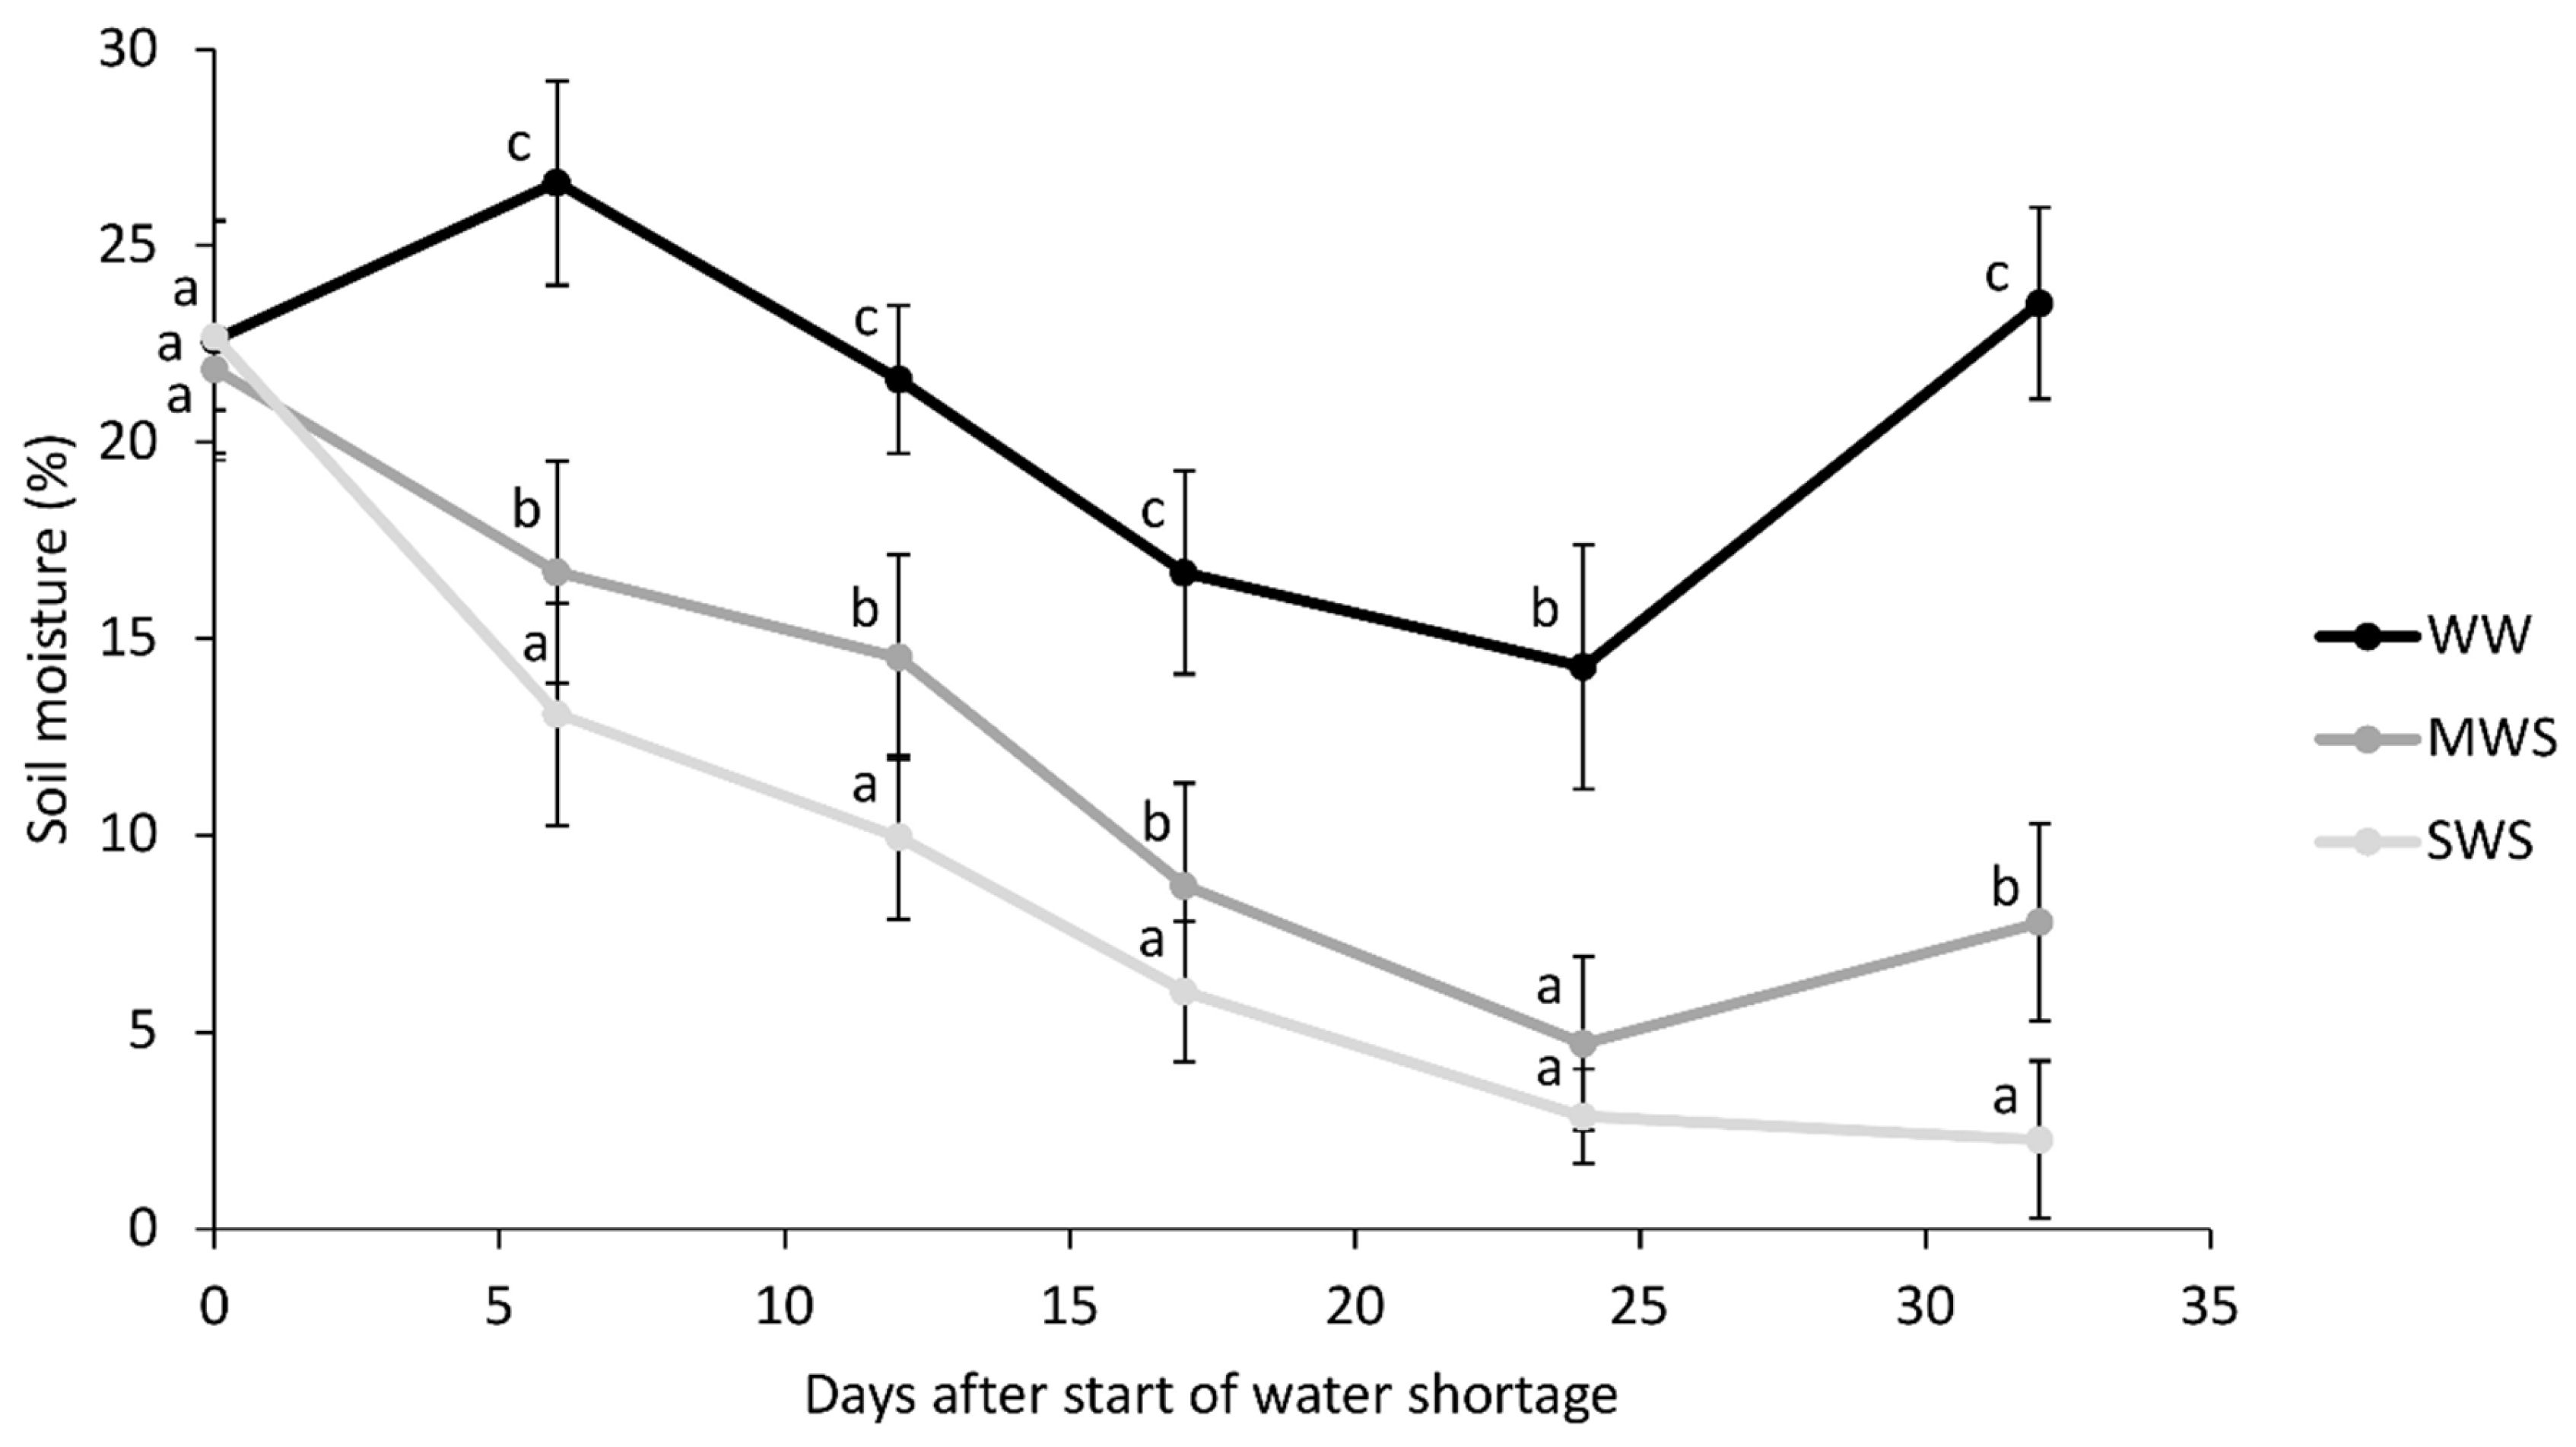
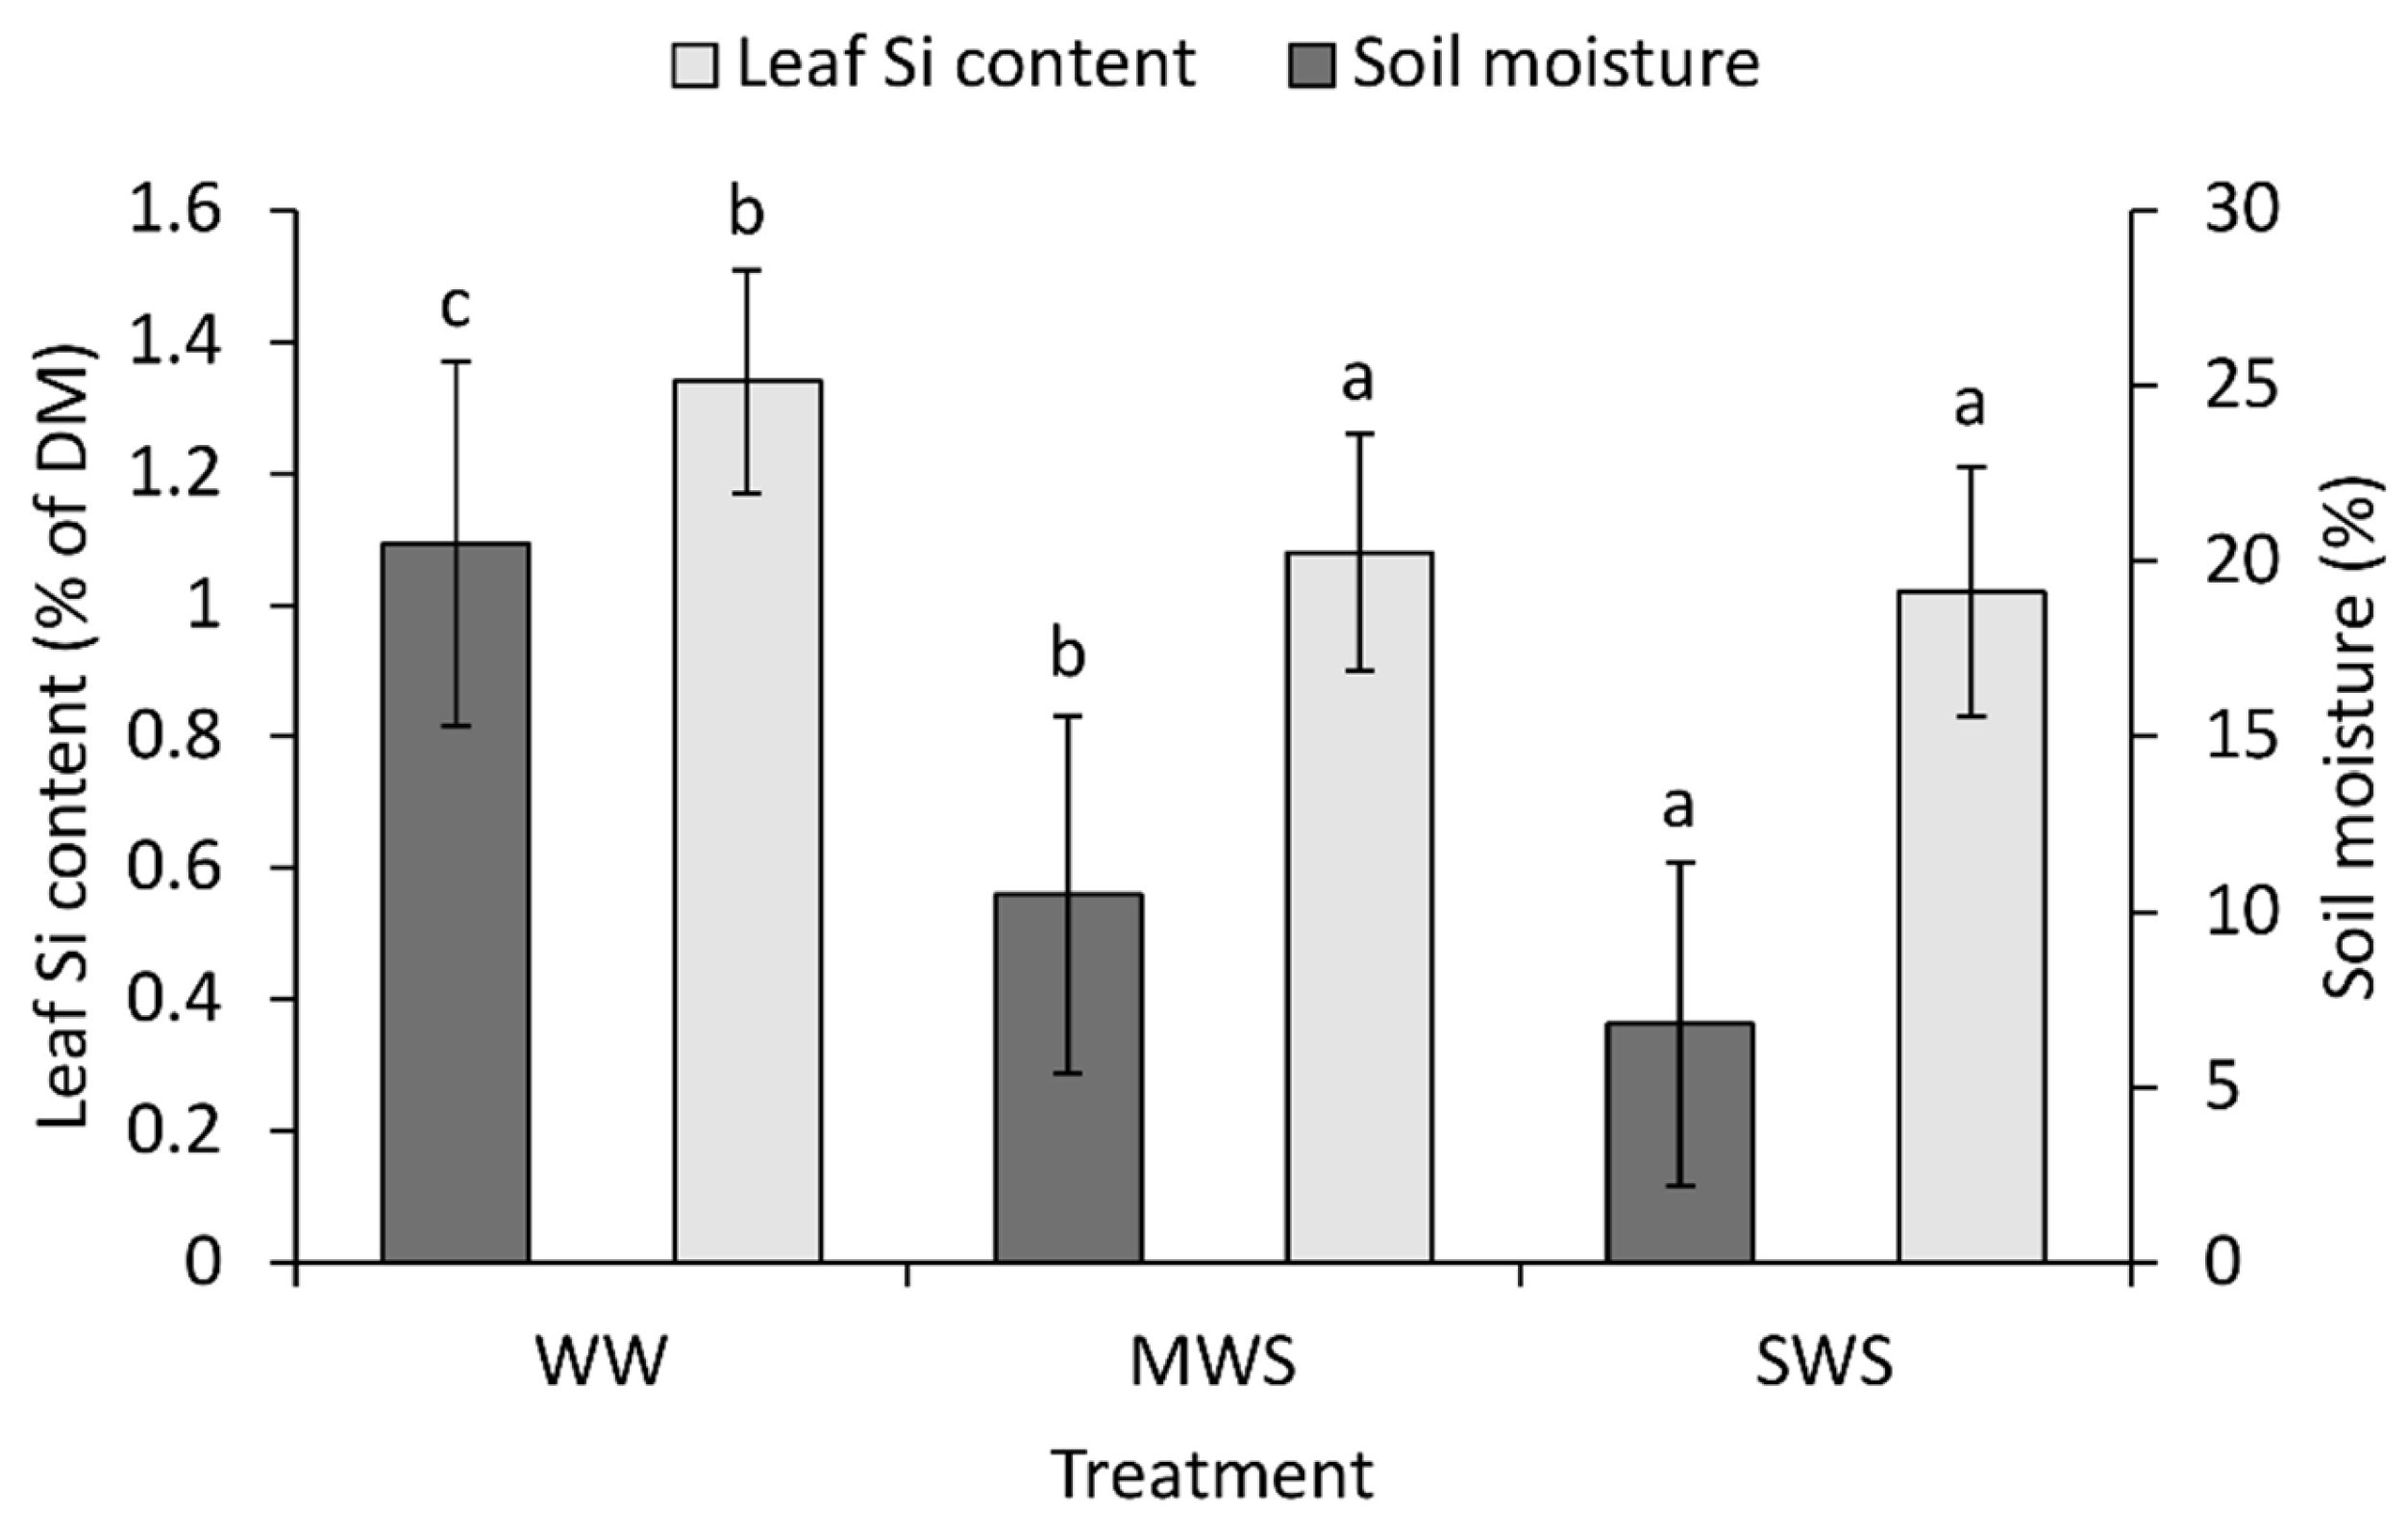
3.2. Soil Parameters

The plant-available Si level in the soil for day −1 was 26.73 ± 2.16 mg Si kg−1 soil DM (n = 5), while by day 32 this was 25.62 ± 0.79 mg Si kg−1 soil DM (n = 5). These values thus showed that there were no significant differences for the plant-available Si in the soil before and after the experiment.
There were no significant changes in either total soil Si or Ca levels from the beginning of the experimental period to the end (Table 2).

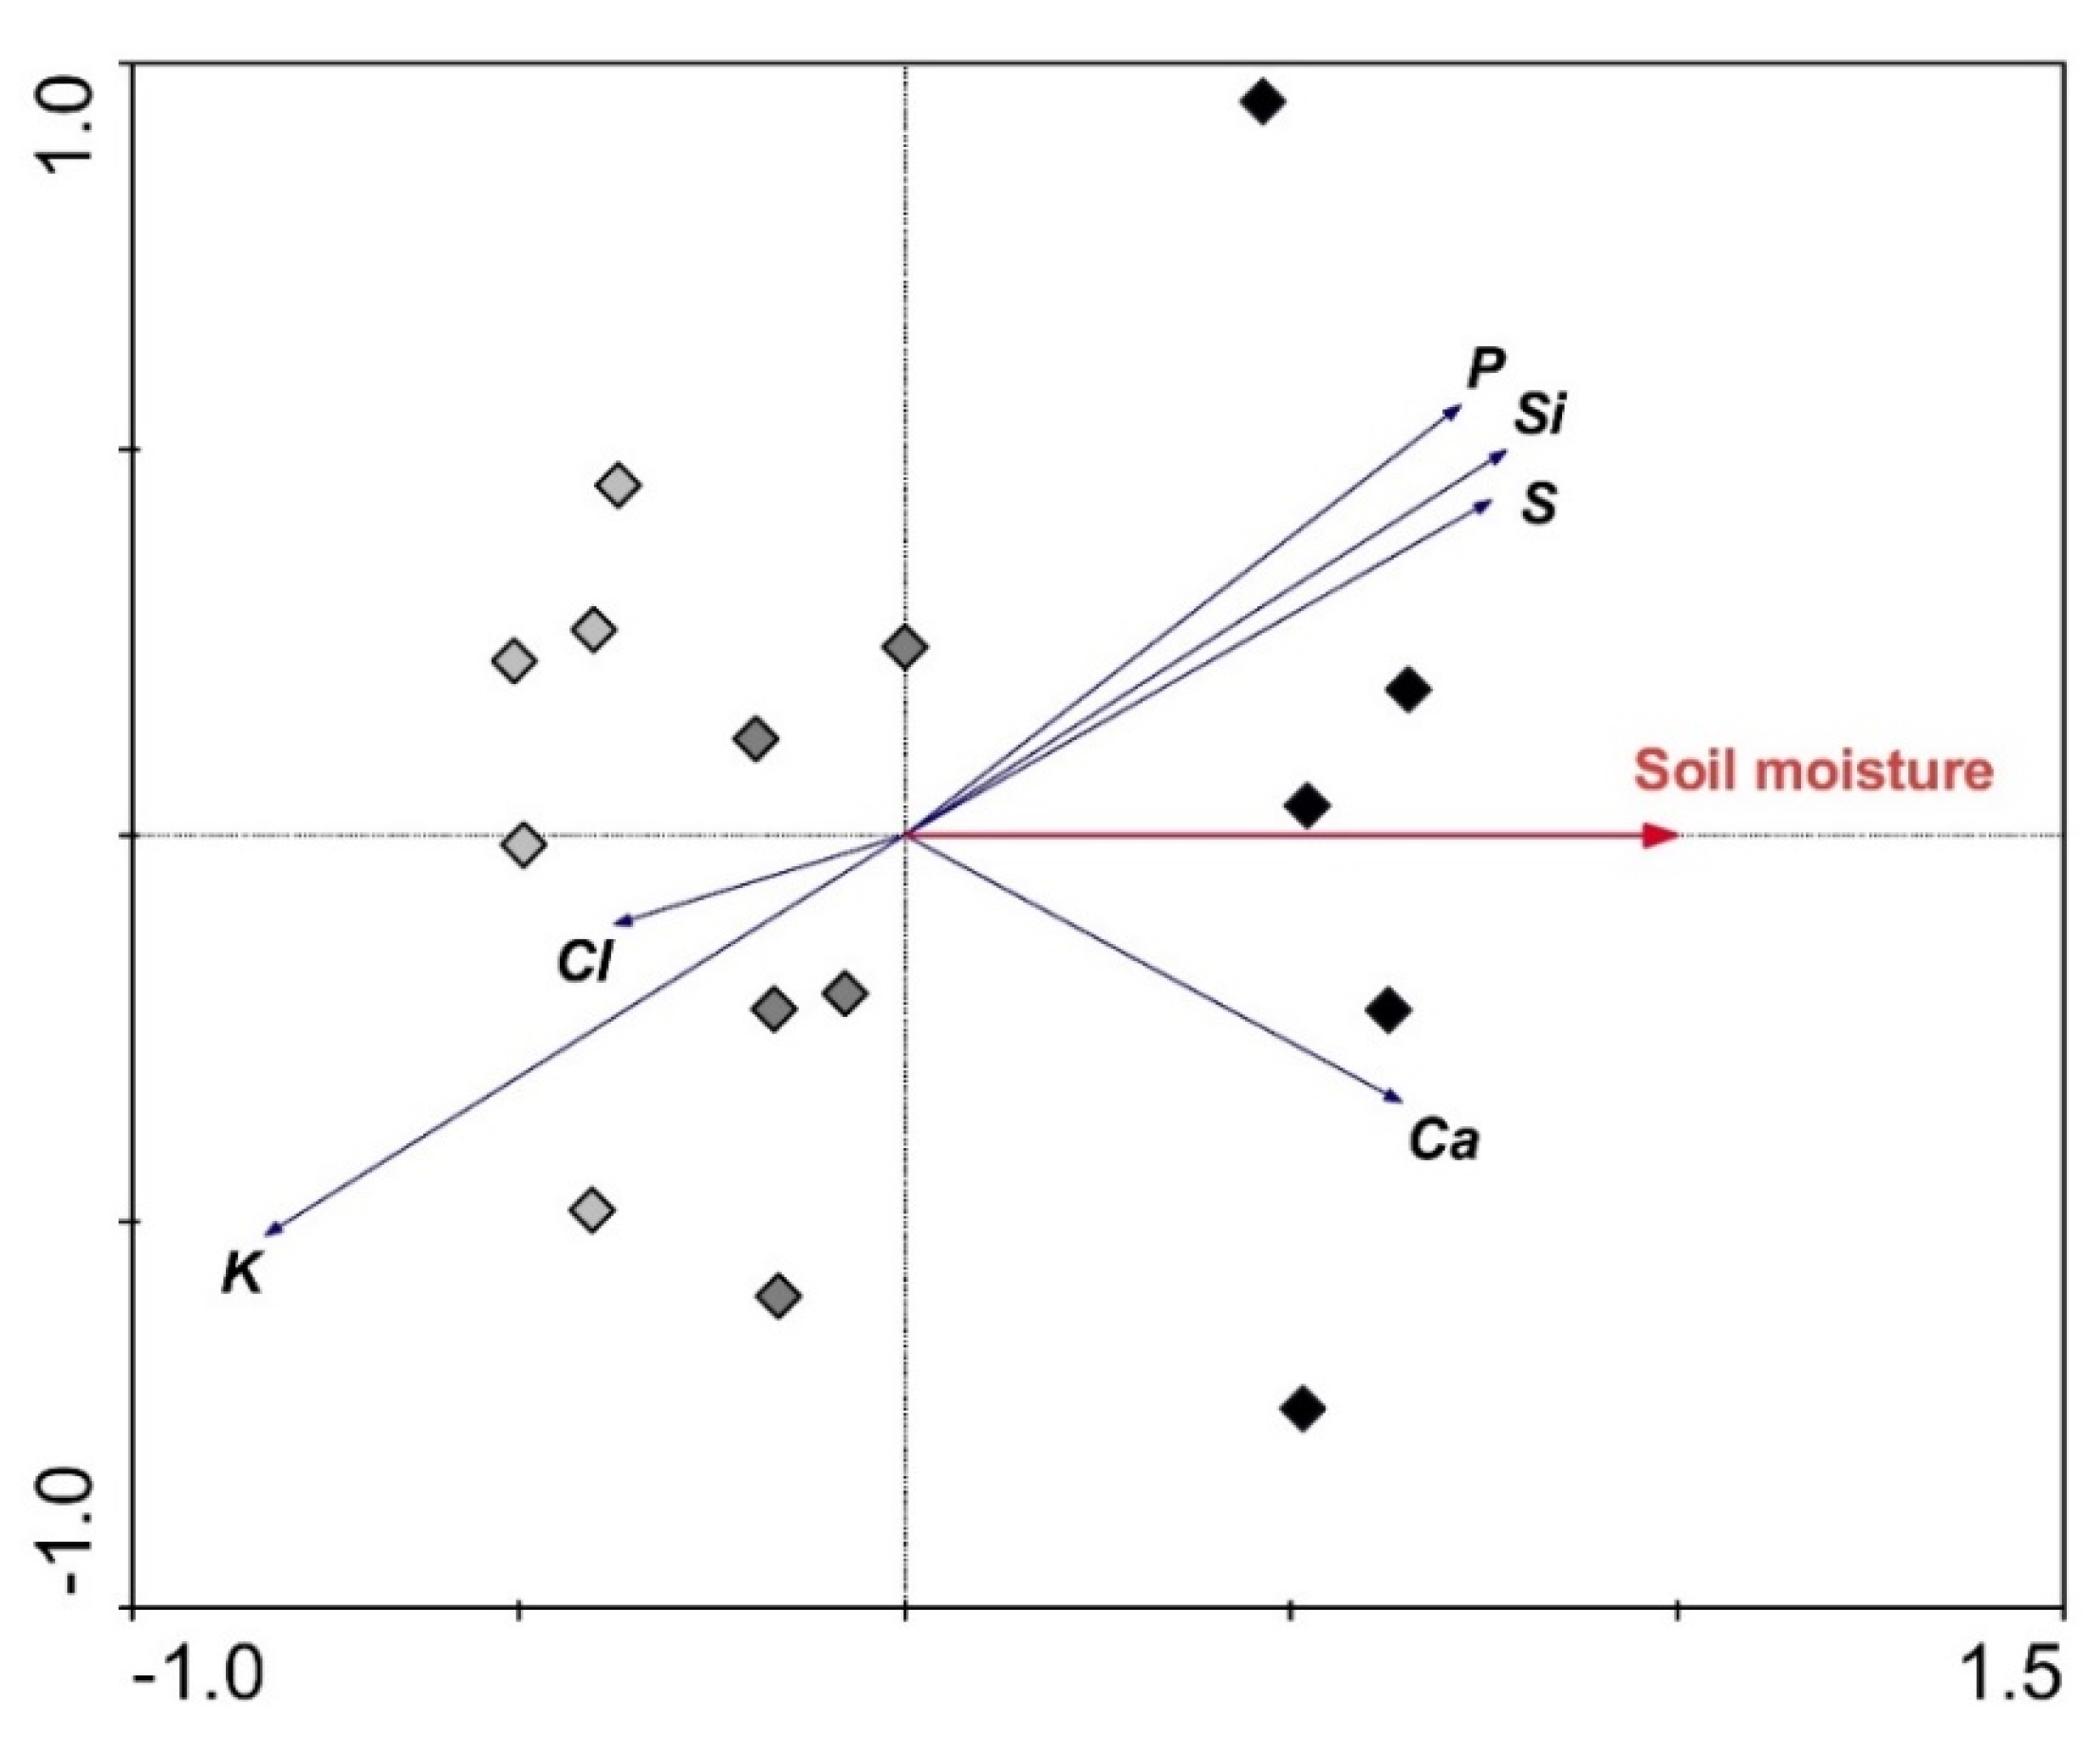
3.3. Relationships between Selected Parameters

Pearson’s correlation analysis showed that the leaf reflectance in the UV region was significantly positively related to the leaf Si, while for the visible part of the spectrum, the leaf reflectance was significantly positively related to the leaf Ca (Table 3).
The redundancy analysis showed the importance of the water-related parameters for the element contents in these proso millet leaves following 32 days of the different water treatments. When taking into account marginal effects, showing the effect of every single considered parameter, soil moisture, stomatal conductance, and leaf relative water content explained 53%, 48%, and 23%, respectively, of the variability of the leaf element contents. However, according to the conditional effects, only the soil moisture was significant, due to the collinearity of these factors, with 54% (p = 0.002) of the variability of the leaf element contents explained. The redundancy analysis plot revealed that the leaf contents of P, Si, S, and Ca showed a positive correlation to the soil moisture, while for Cl and K, this correlation was negative (Figure 7). These samples from the three water treatments showed three distinct groups that corresponded to increasing water availability.
The importance of the water-related parameters for the leaf element contents was also shown by Pearson’s correlation analysis (Table 4). The soil moisture showed significant positive correlations to leaf Si, P, S, and Ca, along with a significant negative correlation to leaf K. Stomatal conductance was significantly positively related to leaf Si and P, and significantly negatively related to leaf K. The leaf relative water content only showed a significant negative correlation to leaf Cl and K.
Stomatal conductance was significantly positively related to the soil moisture (0.815; p ≤ 0.01). In addition, the leaf relative water content was significantly positively related to stomatal conductance (0.553; p ≤ 0.05).
The plant height showed significant positive correlations to both the water-related parameters and the leaf Si (Table 5). These three water-related parameters also showed significant correlations to leaf biomass, which were negative for dead leaf biomass and positive for living leaf biomass. The living leaf biomass was also positively related to leaf Si.

4. Discussion

The majority of the parameters measured here showed little difference between the WW control plants and the MWS and SWS plants that had been subjected to moderate and severe water shortages, respectively, even though the soil moisture levels differed significantly across these treatments. The most pronounced differences among the water treatments were seen for the plant biomass parameters, as especially the biomass of living and dead leaves, and for the leaf stomatal conductance, as a measure of the transpiration rate. However, stomatal conductance shows only short-term plant response, therefore more detailed information about leaf condition would be obtained by measurements of CO2 exchange along with 18O and 13C analyses [59,60]. There were only small changes in the leaf relative water contents. This is the result of the balance between the water supply and the transpiration rate [61]. These relative water contents of leaves from the WW control and the MWS plants were approximately 95%. This is associated with stomata closure and reduction in cell expansion and growth [52], and was also evident in the present study. In addition to the leaf water status, stomatal aperture is also determined by the capacity of the mesophyll tissue to fix carbon [62].
The studies on C3 plants have shown that the decreased leaf relative water content results in a decreased potential rate of photosynthesis [63]. In Triticum aestivum, the activity of ribulose-1,5-bisphosphate carboxylase/oxygenase declined by 12% at a leaf relative water content of 90% [64]. In the SWS treatment here, the relative water content of the leaves was 87%. According to González and González-Vilar [52], the tissue relative water contents in the range of 80% to 90% can result in changes in tissue composition and in photosynthetic and respiration rates, while water contents <80% result in cessation of photosynthesis, and the accumulation of abscisic acid.
It has been well documented that plants reduce their leaf water loss by controlling their transpiration rate and by decreasing their leaf area [15], as drought promotes the senescence process [65]. The experimental plants here that were exposed to the MWS and SWS water shortage conditions produced less living leaf biomass. In spite of this, the remaining assimilation areas of both of these water-deprived plant groups seemed to be sufficient for these MWS and SWS plants to produce the same panicle biomass as plants from the WW control treatment. This could result from the fact that the plants from all the treatments had the same root mass and therefore presumably sufficient root system. Yong et al. [66] showed that the root restriction in cotton reduced photosynthesis, stomatal conductance, and δ18O. According to Larcher [12], in annual plants, 65% of the photosynthetic products from the upper leaves, and 50% to 90% of the P and nitrogen (N) from vegetative organs are used for the development of the plant reproductive organs. However, the number and quality of seeds depend on the environmental conditions prior to the reproductive phase. The leaves from all of the water treatments in this study appeared to be in similar physiological conditions, as shown by the measurements of Fq’/Fm’ and Fv/Fm. These values indicated that all of these plant groups were under stress [52], which was also revealed from relatively low stomatal conductance. The stomatal limitation may also lead to a reduction in photosynthetic CO2 uptake, which is more pronounced in C4 in comparison to C3 species, and causes a lower linear electron flux and a reduction of quantum efficiency of PS II photochemistry [38]. This does not seem to be the case in our study, since Fv/Fm was even somewhat higher in most of the water-deprived plants. The presence of stress in all plant groups may be a consequence of mid-day depression, since the measurements were performed on sunny days around noon. The multiple stress due to high light and temperatures along with low relative humidity [12] possibly affected all of the plants in the experiment, masking the effect of water shortage, as revealed from low values of Fv/Fm. In addition, it is likely that SWS plants were better adapted to these extreme mid-day conditions in comparison to the control group. Our previous study of proso millet revealed that average values of Fv/Fm in control plants ranged from 0.58 to 0.62 [22]. This is somewhat higher than in the present study. In higher plants utilizing the C3 pathway of photosynthesis, Fv/Fm in unstressed leaves ranges from 0.80 to 0.83 [67], while values from 0.74 to 0.81 are reported for different C4 species [38]. The reason for the same or even higher Fv/Fm measured in vital leaves in the SWS group may also be a reduction in assimilation areas, which assures a sufficient amount of resources (elements and water) for the remaining leaves under extreme conditions. In addition, the comparable leaf function in all treatments may be a consequence of changes in the leaf morphology parameters, including the leaf thickness, stomata density, cuticle structure [68], and the shape of leaves [13]. In grass leaves, Si can be deposited right beneath the cuticle, therefore the water loss through the cuticle might also be reduced by this deposition of Si [69].
The reduced water availability generally limits the total uptake of nutrients and diminishes their contents in plant tissues [19]. This is due to a reduced plant nutrient uptake through limitation of the nutrient supply due to disturbed mineralisation, and by the reduction in nutrient diffusion and mass flow in the soil [70]. In the present study, the leaf Si content was significantly affected by the water shortage. However, the differences in leaf Si content between the plants from the moderate MWS and the severe SWS water shortage treatments were not significant. This lack of differences might be related to the specificity of the roots of these proso millet plants, as the root biomass did not differ significantly between the water treatments. According to Atkinson et al. [71], C4 species invest proportionally more in their root systems in comparison to C3 species, although they do not respond to different water regimes in terms of changes in their root biomass [72].
In the MWS and SWS water-deprived plants, there were also significantly lower leaf contents of P, S, and Ca than for the WW control plants, which was also confirmed by the correlation analysis between the soil moisture and leaf contents of these elements. He and Dijkstra [70] showed that drought generally decreases plant N and P contents, but increases the plant N:P ratio. Kostic et al. [73] showed that in acid soils, the uptake of P can be facilitated by the availability of Si, which significantly increases both malate and citrate exudation rates. The Ca distribution in plants is mainly controlled by the transpiration stream, and when it is deposited, Ca can no longer be redistributed within the plant [6]. Ca is a crucial regulator of plant growth and development, and it can help to mitigate the effects of drought stress in plants [74]. Therefore, reduced Ca uptake might negatively affect plant metabolism.
A negative relationship between the soil moisture and leaf element contents was obtained for K and Cl in the present study. However, it has been reported that the availability of K for plants also decreases with decreasing soil water content, due to the decreased mobility of K [75]. However, some studies have reported higher foliar K contents during drier periods, especially in plants that are typical of dry environments [76]. K can mitigate the negative effects of drought through its involvement in the activation of ribulose bisphosphate carboxylase/oxygenase and its regulation of stomatal aperture, and by preventing the generation of reactive oxygen species [77]. Therefore, the higher K content in these proso millet leaves during the SWS severe water shortage treatment might have contributed to the increased resistance of these leaves to drought.
The changes in the element contents affected the optical properties of these proso millet leaves. The major differences in leaf optical properties were obtained in the NIR region. This is possibly a consequence of the decreased water content in the leaves due to the water availability restriction [78]. Strong relationships were obtained between the leaf element contents and different spectral regions. The light reflectance in the UV region was positively related to leaf Si, while the reflectance of the visible light was negatively related to leaf Ca. Klančnik et al. [28] studied the different grass and sedge species, and showed that the reflection in the UV region is due to the different near-surface silicified leaf structures. Ca can be found in the cytoplasm and vacuoles, and partly in the cell walls bound to pectins, but it can also appear as considerable quantities of CaCO3 [79]. Carbonate minerals have uniform reflectance patterns at wavelengths <1600 nm. However, the presence of metal cations such as iron can significantly reduce leaf reflectance at <700 nm [80]. This management of solar energy can benefit plants, as it prevents potential damage due to short-wave UV radiation, and at the same time it assures sufficient amounts of visible light for photosynthesis.

5. Conclusions

In the present study, the leaves from all of the WW, MWS, and SWS plant groups showed similar physiological conditions, in terms of Fq’/Fm’ and Fv/Fm. The differences between the MWS moderate and SWS severe water shortage treatments were also generally smaller than those between the MWS moderate water shortage and the WW control. The most pronounced effects of the water shortage were seen for leaf biomass, stomatal conductance, and element contents. The reduction of leaf biomass possibly contributed to the better condition of the remaining leaves. Since stomatal conductance reflects only the short-term response of a plant, the measurements of CO2 exchange of the leaves along with 18O and 13C analyses are needed to further elucidate these aspects. The water-related parameters positively affected the leaf Cl and K contents, but negatively affected the leaf Si, P, S, and Ca contents. The lack of differences in the leaf Si contents between the MWS and SWS water shortage treatments might have been due to the root/leaf biomass ratio, which was significantly higher for water-deprived plants. The UV leaf reflectance was positively related to leaf Si, while the leaf reflectance of visible light was negatively related to leaf Ca, which might contribute to optimisation of light management in the leaves. These efficient ways of light and water management, the reduction in the leaf biomass, and the unchanged root system across all of these WW, MWS, and SWS treatments appear to be important mechanisms for mitigation of the potential negative effects of drought stress in proso millet.

Author Contributions

Conceptualization, A.G. (Alenka Gaberščik); methodology, M.G., A.G. (Aleksandra Golob), and K.V.-M.; validation, M.G. and A.G. (Alenka Gaberščik); formal analysis, A.G. (Alenka Gaberščik); investigation, M.G.; writing—original draft preparation, M.G. and A.G. (Alenka Gaberščik); writing—review & editing, M.G. and A.G. (Alenka Gaberščik); visualization, M.G. and A.G. (Alenka Gaberščik); supervision, A.G. (Alenka Gaberščik); project administration, A.G. (Alenka Gaberščik); funding acquisition, A.G. (Alenka Gaberščik).

Funding

This research was funded by the Slovenian Research Agency, grant numbers P1-0212 and 39096.

Acknowledgments

The authors are grateful to Klavdija Zupančič, Ana Kugovnik, Mateja Germ, and Dragan Abram for their help with some of the experimental measurements, and to Christopher Berrie for the revision of English language.

Conflicts of Interest

The authors declare no conflicts of interest.

References

  1. Ray, R.L.; Fares, A.; Risch, E. Effects of drought on crop production and cropping areas in Texas. Agric. Environ. Lett. 2018, 3, 170037. [Google Scholar] [CrossRef]
  2. Water Scarcity and Drought in the European Union. Available online: http://ec.europa.eu/environment/pubs/pdf/factsheets/water_scarcity.pdf (accessed on 16 August 2019).
  3. Vanwindekens, F.M.; Gobin, A.; Curnel1, Y.; Planchon, V. New approach for mapping the vulnerability of agroecosystems based on expert knowledge. Math. Geosci. 2018, 50, 679–696. [Google Scholar] [CrossRef]
  4. Boyer, J.S. Plant productivity and environment. Science 1982, 218, 443–448. [Google Scholar] [CrossRef] [PubMed]
  5. Venuprasad, R.; Lafitte, H.; Atlin, G. Response to direct selection for grain yield under drought stress in rice. Crop Sci. 2007, 47, 285–293. [Google Scholar] [CrossRef]
  6. De Freitas, S.T.; Shackel, K.A.; Mitcham, E.J. Abscisic acid triggers whole-plant and fruit-specific mechanisms to increase fruit calcium uptake and prevent blossom end rot development in tomato fruit. J. Exp. Bot. 2011, 62, 2645–2656. [Google Scholar] [CrossRef] [Green Version]
  7. Li, Y.; Ye, W.; Wang, M.; Yan, X. Climate change and drought: A risk assessment of crop-yield impacts. Clim. Res. 2009, 39, 31–46. [Google Scholar] [CrossRef]
  8. Newton, A.C.; Flavell, A.J.; George, T.S.; Leat, P.; Mullholland, B.; Ramsay, L.; Revoredo-Giha, C.; Russell, J.; Steffenson, B.J.; Swanston, J.S.; et al. Crops that feed the world 4. Barley: A resilient crop? Strengths and weaknesses in the context of food security. Food Sec. 2011, 3, 141–178. [Google Scholar] [CrossRef]
  9. Saha, D.; Channabyre Gowda, M.V.; Arya, L.; Verma, M.; Bansal, K.C. Genetic and genomic resources of small millets. Crit. Rev. Plant Sci. 2016, 35, 56–79. [Google Scholar] [CrossRef]
  10. Wang, R.Y.; Wang, H.G.; Liu, X.Y.; Lian, S.; Chen, L.; Qiao, Z.J.; McInerney, C.E.; Wang, L. Drought-induced transcription of resistant and sensitive common millet varieties. J. Anim. Plant Sci. 2017, 27, 1303–1314. [Google Scholar]
  11. Kumar, A.; Tomer, V.; Kaur, A.; Kumar, V.; Gupta, K. Millets: A solution to agrarian and nutritional challenges. Agric. Food Sec. 2018, 7, 31. [Google Scholar] [CrossRef]
  12. Larcher, W. Physiological Plant Ecology: Ecophysiology and Stress Physiology of Functional Groups; Springer: Berlin, Germany, 2003. [Google Scholar]
  13. Petrov, P.; Petrova, A.; Dimitrov, I.; Tashev, T.; Olsovska, K.; Brestic, M.; Misheva, S. Relationships between leaf morpho-anatomy, water status and cell membrane stability in leaves of wheat seedlings subjected to severe soil drought. J. Agron. Crop Sci. 2018, 204, 219–227. [Google Scholar] [CrossRef]
  14. Kang, J.; Zhao, W.; Su, P.; Zhao, M.; Yang, Z. Sodium (Na+) and silicon (Si) coexistence promotes growth and enhances drought resistance of the succulent xerophyte Haloxylon ammodendron. Soil Sci. Plant Nutr. 2014, 60, 659–669. [Google Scholar] [CrossRef]
  15. Chen, D.; Wang, S.; Yin, L.; Deng, X. How does silicon mediate plant water uptake and loss under water deficiency? Front. Plant Sci. 2018, 9, 281. [Google Scholar] [CrossRef]
  16. Lux, A.; Luxová, M.; Hattori, T.; Inanaga, S.; Sugimoto, Y. Silicification in sorghum (Sorghum bicolor) cultivars with different drought tolerance. Physiol. Plant. 2002, 115, 87–92. [Google Scholar] [CrossRef] [PubMed]
  17. Gao, X.; Zou, C.; Wang, L.; Zhang, F. Silicon improves water use efficiency in maize plants. J. Plant Nutr. 2005, 27, 1457–1470. [Google Scholar] [CrossRef]
  18. Hattori, T.; Inanaga, S.; Tanimoto, E.; Lux, A.; Luxová, M.; Sugimoto, Y. Silicon-induced changes in viscoelastic properties of sorghum root cell walls. Plant Cell Physiol. 2003, 44, 743–749. [Google Scholar] [CrossRef] [PubMed]
  19. Saud, S.; Li, X.; Chen, Y.; Zhang, L.; Fahad, S.; Hussain, S.; Sadiq, A.; Chen, Y. Silicon application increases drought tolerance of Kentucky bluegrass by improving plant water relations and morphophysiological functions. Sci. World J. 2014, 2014, 368694. [Google Scholar] [CrossRef] [PubMed]
  20. Ma, J.F.; Takahashi, E. Soil, Fertilizer, and Plant Silicon Research in Japan; Elsevier: Amsterdam, The Netherlands, 2002. [Google Scholar]
  21. Faisal, S.; Callis, K.L.; Slot, M.; Kitajima, K. Transpiration-dependent passive silica accumulation in cucumber (Cucumis sativus) under varying soil silicon availability. Botany 2012, 90, 1058–1064. [Google Scholar] [CrossRef]
  22. Grašič, M.; Malovrh, U.; Golob, A.; Vogel-Mikuš, K.; Gaberščik, A. Effects of water availability and UV radiation on silicon accumulation in the C4 crop proso millet. Photochem. Photobiol. Sci. 2019, 18, 375–386. [Google Scholar] [CrossRef]
  23. Grašič, M.; Dobravc, M.; Golob, A.; Vogel-Mikuš, K.; Gaberščik, A. Water shortage reduces silicon uptake in barley leaves. Agric. Water Manag. 2019, 217, 47–56. [Google Scholar] [CrossRef]
  24. Taylor, S.H.; Ripley, B.S.; Woodward, F.I.; Osborne, C.P. Drought limitation of photosynthesis differs between C3 and C4 grass species in a comparative experiment. Plant. Cell Environ. 2011, 34, 65–75. [Google Scholar] [CrossRef] [PubMed]
  25. Ma, J.F.; Miyake, Y.; Takahashi, E. Silicon as a beneficial element for crop plants. In Silicon in Agriculture; Datnoff, L.E., Snyder, G.H., Korndörfer, G.H., Eds.; Elsevier Science: Amsterdam, The Netherlands, 2001; pp. 17–39. [Google Scholar] [CrossRef]
  26. Kaufman, P.B.; Dayanandan, P.; Franklin, C.I.; Takeoka, Y. Structure and function of silica bodies in the epidermal system of grass shoots. Ann. Bot. 1985, 55, 487–507. [Google Scholar] [CrossRef]
  27. Lanning, F.C.; Eleuterius, L.N. Silica deposition in some C3 and C4 species of grasses, sedges and composites in the USA. Ann. Bot. 1989, 64, 395–410. [Google Scholar] [CrossRef]
  28. Klančnik, K.; Vogel-Mikuš, K.; Gaberščik, A. Silicified structures affect leaf optical properties in grasses and sedge. J. Photochem. Photobiol. B 2014, 130, 1–10. [Google Scholar] [CrossRef] [PubMed]
  29. Klančnik, K.; Vogel-Mikuš, K.; Gaberščik, A. Leaf optical properties are affected by the location and type of deposited biominerals. J. Photochem. Photobiol. B 2014, 140, 276–285. [Google Scholar] [CrossRef]
  30. Ullah, S.; Schlerf, M.; Skidmore, A.K.; Hecker, C. Identifying plant species using mid-wave infrared (2.5–6 μm) and thermal infrared (8–14 μm) emissivity spectra. Remote Sens. Environ. 2012, 118, 95–102. [Google Scholar] [CrossRef]
  31. Noda, H.M.; Motohka, T.; Murakami, K.; Muraoka, H.; Nasahara, K.N. Accurate measurement of optical properties of narrow leaves and conifer needles with a typical integrating sphere and spectroradiometer. Plant Cell Environ. 2008, 36, 1903–1909. [Google Scholar] [CrossRef]
  32. Coops, N.C.; Stone, C. A comparison of field-based and modelled reflectance spectra from damaged Pinus radiata foliage. Aust. J. Bot. 2005, 53, 417–429. [Google Scholar] [CrossRef]
  33. Kovar, M.; Brestic, M.; Sytar, O.; Barek, V.; Hauptvogel, P.; Zivcak, M. Evaluation of Hyperspectral reflectance parameters to assess the leaf water content in soybean. Water 2019, 11, 443. [Google Scholar] [CrossRef]
  34. Castro-Esau, K.L.; Sanchez-Azofeifa, G.A.; Rivard, B.; Wright, S.J.; Quesada, M. Variability in leaf optical properties of Mesoamerican trees and the potential for species classification. Am. J. Bot. 2006, 93, 517–530. [Google Scholar] [CrossRef]
  35. Dim, J.R.; Kajiwara, K.; Honda, Y. Radiometric signature and spatial variability of the vegetation coverage of a boreal forest. Int. J. Remote Sens. 2008, 29, 6851–6871. [Google Scholar] [CrossRef]
  36. Havaux, M.; Lannoye, R. Chlorophyll fluorescence induction: A sensitive indicator of water stress in maize plants. Irrig. Sci. 1983, 4, 147–151. [Google Scholar] [CrossRef]
  37. Banks, J.M. Chlorophyll fluorescence as a tool to identify drought stress in Acer genotypes. Environ. Exp. Bot. 2018, 155, 118–127. [Google Scholar] [CrossRef]
  38. Guidi, L.; Lo Piccolo, E.; Mandi, M. Chlorophyll fluorescence, photoinhibition and abiotic stress: Does it make any difference the fact to be a C3 or C4 species? Front. Plant Sci. 2019, 10, 174. [Google Scholar] [CrossRef]
  39. Iqbal, N.; Hussain, S.; Raza, M.A.; Yang, C.Q.; Safdar, M.E.; Brestic, M.; Aziz, A.; Hayyat, M.S.; Asghar, M.A.; Wang, X.C.; et al. Drought tolerance of soybean (Glycine max L. Merr.) by improved photosynthetic characteristics and an efficient antioxidant enzyme activities under a split-root system. Front. Physiol. 2019, 10, 1–13. [Google Scholar] [CrossRef]
  40. Dąbrowski, P.; Baczewska-Dąbrowska, A.H.; Kalaji, H.M.; Goltsev, V.; Paunov, M.; Rapacz, M.; Wójcik-Jagła, M.; Pawluśkiewicz, B.; Bąba, W.; Brestic, M. Exploration of Chlorophyll a fluorescence and plant gas exchange parameters as indicators of drought tolerance in perennial ryegrass. Sensors 2019, 19, 2736. [Google Scholar] [CrossRef]
  41. Baltensperger, D.D. Progress with proso, pearl and other millets. In Trends in New Crops and New Uses; Janick, J., Whipkey, A., Eds.; ASHS Press: Alexandria, VA, USA, 2002; pp. 100–103. [Google Scholar]
  42. Shahidi, F.; Chandrasekara, A. Millet grain phenolics and their role in disease risk reduction and health promotion: A review. J. Funct. Foods 2013, 5, 570–581. [Google Scholar] [CrossRef]
  43. Kalinova, J.; Moudry, J. Content and quality of protein in proso millet (Panicum miliaceum L.) varieties. Plant Foods Hum. Nutr. 2006, 61, 45–49. [Google Scholar] [CrossRef]
  44. Upadhyaya, H.D.; Sharma, S.; Gowda, C.L.L.; Gopal Reddy, V.; Singh, S. Developing proso millet (Panicum miliaceum L.) core collection using geographic and morpho-agronomic data. Crop Pasture Sci. 2011, 62, 383–389. [Google Scholar] [CrossRef]
  45. Wang, R.; Hunt, H.V.; Qiao, Z.; Wang, L.; Han, Y. Diversity and cultivation of broomcorn millet (Panicum miliaceum L.) in China: A review. Econ. Bot. 2016, 70, 332–342. [Google Scholar] [CrossRef]
  46. Tadele, Z. Drought adaptation in millets. In Abiotic and Biotic Stress in Plants—Recent Advances and Future Perspectives; Shanker, A.K., Shanker, C., Eds.; IntechOpen: London, UK, 2016; pp. 639–662. [Google Scholar] [CrossRef]
  47. Gibson, D.J. Methods in Comparative Plant Population Ecology; Oxford University Press: Oxford, UK, 2015. [Google Scholar]
  48. Lichtenthaler, H.K.; Buschmann, C. Extraction of photosynthetic tissues: Chlorophylls and carotenoids. Curr. Protoc. Food Anal. Chem. 2001, 1, 165–170. [Google Scholar] [CrossRef]
  49. Lichtenthaler, H.K.; Buschmann, C. Chlorophylls and carotenoids: Measurement and characterization by UV-VIS spectroscopy. Curr. Protoc. Food Anal. Chem. 2001, 1, 171–178. [Google Scholar] [CrossRef]
  50. Drumm, H.; Mohr, H. The mode of interaction between blue (UV) light photoreceptor and phytochrome in anthocyanin formation of the Sorghum seedling. Photochem. Photobiol. 1978, 27, 241–248. [Google Scholar] [CrossRef]
  51. Caldwell, M.M. Solar ultraviolet radiation as an ecological factor for alpine plants. Ecol. Monogr. 1968, 38, 243–268. [Google Scholar] [CrossRef]
  52. Schreiber, U.; Kühl, M.; Klimant, I.; Reising, H. Measurement of chlorophyll fluorescence within leaves using a modified PAM fluorometer with a fiber-optic microprobe. Photosynth. Res. 1996, 47, 103–109. [Google Scholar] [CrossRef] [PubMed]
  53. González, L.; González-Vilar, M. Determination of relative water content. In Handbook of Plant Ecophysiology Techniques; Regiosa Roger, M.J., Ed.; Kluwer Academic Publishers: Dordrecht, The Netherlands, 2001; pp. 207–212. [Google Scholar]
  54. Nečemer, M.; Kump, P.; Ščančar, J.; Jaćimović, R.; Simčič, J.; Pelicon, P.; Budnar, M.; Jeran, Z.; Pongrac, P.; Regvar, M.; et al. Application of X-ray fluorescence analytical techniques in phytoremediation and plant biology studies. Spectrochim. Acta Part B At. Spectrosc. 2008, 63, 1240–1247. [Google Scholar] [CrossRef]
  55. Vekemans, B.; Janssens, K.; Vincze, L.; Adams, F.; Vanespen, P. Analysis of X-ray spectra by iterative least squares (AXIL): New developments. X-Ray Spectrom. 1994, 23, 278–285. [Google Scholar] [CrossRef]
  56. Kump, P.; Nečemer, M.; Rupnik, Z.; Pelicon, P.; Ponikvar, D.; Vogel-Mikuš, K.; Regvar, M.; Pongrac, P. Improvement of the XRF quantification and enhancement of the combined applications by EDXRF and micro-PIXE. In Integration of Nuclear Spectrometry Methods as a New Approach to Material Research; IAEA: Vienna, Austria, 2011; pp. 101–109. [Google Scholar]
  57. Korndörfer, G.H.; Coelho, M.N.; Snyder, G.H.; Mizutani, C.T. Evaluation of soil extractants for silicon availability in upland rice. R. Bras. Ci Solo 1999, 23, 101–106. [Google Scholar] [CrossRef]
  58. ter Braak, C.J.F.; Šmilauer, P. CANOCO Reference Manual and CanoDraw for Windows User’s Guide: Software for Canonical Community Ordination (Version 4.5); Microcomputer Power: Ithaca, NY, USA, 2002. [Google Scholar]
  59. Tao, G.-Q.; Letham, D.S.; Yong, J.W.H.; Zhang, K.; John, P.C.L.; Schwartz, O.; Chin Wong, S.; Farquhar, G.D. Promotion of shoot development and tuberisation in potato by expression of a chimaeric cytokinin synthesis gene at normal and elevated CO2 levels. Funct. Plant Biol. 2010, 37, 43–54. [Google Scholar] [CrossRef]
  60. Sharwood, R.E.; Sonawane, B.V.; Ghannoum, O. Photosynthetic flexibility in maize exposed to salinity and shade. J. Exp. Bot. 2014, 65, 3715–3724. [Google Scholar] [CrossRef] [Green Version]
  61. Lugojan, C.; Ciulca, S. Evaluation of relative water content in winter wheat. J. Hortic. Fores. Biotechnol. 2011, 15, 173–177. [Google Scholar]
  62. Wong, S.C.; Cowan, I.R.; Farquhar, G.D. Stomatal conductance correlates with photosynthetic capacity. Nature 1979, 282, 424–426. [Google Scholar] [CrossRef]
  63. Lawlor, D.W.; Cornic, G. Photosynthetic carbon assimilation and associated metabolism in relation to water deficits in higher plants. Plant Cell Environ. 2002, 25, 275–294. [Google Scholar] [CrossRef] [PubMed] [Green Version]
  64. Holaday, A.S.; Ritchie, S.W.; Nguyen, H.T. Effects of water deficit on gas-exchange parameters and ribulose 1,5-bisphosphate carboxylase activation in wheat. Environ. Exp. Bot. 1992, 32, 403–410. [Google Scholar] [CrossRef]
  65. Rivero, R.M.; Kojima, M.; Gepstein, A.; Sakakibara, H.; Mittler, R.; Gepstein, S.; Blumwald, E. Delayed leaf senescence induces extreme drought tolerance in a flowering plant. Proc. Natl. Acad. Sci. USA 2007, 104, 19631–19636. [Google Scholar] [CrossRef] [PubMed] [Green Version]
  66. Yong, J.W.H.; Letham, D.S.; Chin Wong, S.; Farquhar, G.D. Effects of root restriction on growth and associated cytokinin levels in cotton (Gossypium hirsutum). Funct. Plant Biol. 2010, 37, 974–984. [Google Scholar] [CrossRef]
  67. Björkman, O.; Demmig, B. Photon yield of O2 evolution and chlorophyll fluorescence characteristics at 77 K among vascular plants of diverse origins. Planta 1987, 170, 489–504. [Google Scholar] [CrossRef]
  68. Bi, H.; Kovalchuk, N.; Langridge, P.; Tricker, P.J.; Lopato, S.; Borisjuk, N. The impact of drought on wheat leaf cuticle properties. BMC Plant Biol. 2017, 17, 85. [Google Scholar] [CrossRef]
  69. Ma, J.F. Role of silicon in enhancing the resistance of plants to biotic and abiotic stresses. Soil Sci. Plant Nutr. 2004, 50, 11–18. [Google Scholar] [CrossRef]
  70. He, M.; Dijkstra, F.A. Drought effect on plant nitrogen and phosphorus: A meta-analysis. New Phytol. 2014, 204, 924–931. [Google Scholar] [CrossRef]
  71. Atkinson, R.R.L.; Mockford, E.J.; Bennett, C.; Christin, P.-A.; Spriggs, E.L.; Freckleton, R.P.; Thompson, K.; Rees, M.; Osborne, C.P. C4 photosynthesis boosts growth by altering physiology, allocation and size. Nat. Plants 2016, 2, 16038. [Google Scholar] [CrossRef] [PubMed]
  72. Angelo, C.L.; Pau, S. Root biomass and soil δ13C in C3 and C4 grasslands along a precipitation gradient. Plant Ecol. 2015, 216, 615–627. [Google Scholar] [CrossRef]
  73. Kostic, L.; Nikolic, N.; Bosnic, D.; Samardzic, J.; Nikolic, M. Silicon increases phosphorus (P) uptake by wheat under low P acid soil conditions. Plant Soil 2017, 419, 447–455. [Google Scholar] [CrossRef]
  74. Hepler, P.K. Calcium: A central regulator of plant growth and development. Plant Cell 2005, 17, 2142–2155. [Google Scholar] [CrossRef] [PubMed]
  75. Rouphael, Y.; Cardarelli, M.T.; Schwarz, D.; Franken, P.; Colla, G. Effects of drought on nutrient uptake and assimilation in vegetable crops. In Plant Responses to Drought Stress; Aroca, R., Ed.; Springer: Berlin, Germany, 2012; pp. 171–195. [Google Scholar] [CrossRef]
  76. Urbina, I.; Sardans, J.; Beierkuhnlein, C.; Jentsch, A.; Backhaus, S.; Grant, K.; Kreyling, J.; Peñuelasa, J. Shifts in the elemental composition of plants during a very severe drought. Env. Exp. Bot. 2015, 111, 63–73. [Google Scholar] [CrossRef] [PubMed]
  77. Schilling, G.; Eißner, H.; Schmidt, L.; Peiter, E. Yield formation of five crop species under water shortage and differential potassium supply. J. Plant Nutr. Soil Sci. 2016, 179, 234–243. [Google Scholar] [CrossRef]
  78. Ceccato, P.; Flasse, S.; Tarantola, S.; Jacquemoud, S.; Gregoire, J.-M. Detecting vegetation leaf water content using reflectance in the optical domain. Remote Sens. Environ. 2001, 77, 22–33. [Google Scholar] [CrossRef]
  79. Kinzel, H. Calcium in the vacuoles and cell walls of plant tissue. Forms of deposition and their physiological and ecological significance. Flora 1989, 182, 99–125. [Google Scholar] [CrossRef]
  80. Gaffey, S.J. Spectral reflectance of carbonate minerals in the visible and near infrared (0.35–2.55 microns): Calcite, aragonite, and dolomite. Am. Mineral. 1986, 71, 151–162. [Google Scholar]
Figure 1. Proso millet experimental plants on day 17 of the experimental period.
Water 11 02155 g001
Figure 2. Soil moisture content for the three water treatments during the experimental period. The data are means ± SD (n = 30). Different letters indicate significant differences across the treatments within each sampling day (p ≤ 0.05; Duncan tests).
Water 11 02155 g002
Figure 3. Proso millet leaf silicon (Si) content (sampled on day 32) and mean soil moisture (days 6, 12, 17, 24, 32) for the three water treatments. The data are means ± SD (Si, n = 5; soil moisture, n = 25). Different letters indicate significant differences within the Si and soil moisture measures across the treatments (p ≤ 0.05; Duncan tests). DM, dry matter.
Water 11 02155 g003
Figure 4. Effective (a) and maximum (b) quantum efficiency of PS II photochemistry of the proso millet leaves for the three water treatments during the experimental period. The data are means ± SD (n = 25). Different letters indicate significant differences across the treatments within each sampling day (p ≤ 0.05; Duncan tests). a.u., arbitrary units.
Water 11 02155 g004
Figure 5. Proso millet leaf tissue thickness (sampled on day 26) for the three water treatments. The data are means ± SD (n = 5). Different letters indicate significant differences within each tissue type across the treatments (p ≤ 0.05; Duncan tests).
Water 11 02155 g005
Figure 6. Dry root, stem, dead leaf, living leaf, and panicle biomass (sampled on day 31) for proso millet plants grown under the three water treatments. The data are means ± SD (n = 5). Different letters indicate significant differences within each plant part across the treatments (p ≤ 0.05; Duncan tests).
Water 11 02155 g006
Figure 7. The redundancy analysis plot showing the strengths of the associations between soil moisture and leaf element contents. Black diamonds, WW; dark grey diamonds, MWS; light grey diamonds, SWS.
Water 11 02155 g007
Table 1. The proso millet leaf and plant parameters recorded under the different water treatments in this study.
TraitSample DaysParameterUnitsTreatment
WWMWSSWS–
Morphological26Leaf thicknessµm171 ± 21 b155 ± 16 a159 ± 17 a
Specific leaf areacm2 mg–10.306 ± 0.092 a0.305 ± 0.040 a0.302 ± 0.068 a
Upper surface stomata densitymm–2105 ± 14 a115 ± 18 b110 ± 15 ab
Upper surface stomata lengthµm31.1 ± 3.1 a31.2 ± 3.3 a31.3 ± 2.8 a
Lower surface stomata densitymm−287 ± 13 a91 ± 14 a89 ± 11 a
Lower surface stomata lengthµm33.6 ± 3.3 a33.5 ± 2.7 a34.8 ± 3.2 a
Biochemical26Chlorophyll amg g–19.97 ± 3.23 a9.07 ± 1.81 a9.73 ± 1.88 a
Chlorophyll bmg g–15.33 ± 1.96 a5.90 ± 2.27 a5.42 ± 1.75 a
Carotenoidsmg g–13.07 ± 1.05 a2.30 ± 0.53 a2.85 ± 0.50 a
Anthocyaninsa.u. g–1179 ± 54 a239 ± 69 a188 ± 63 a
UV-B–absorbing compoundsa.u. g–1493 ± 166 a479 ± 88 a534 ± 141 a
UV-A–absorbing compoundsa.u. g–1738 ± 248 a702 ± 120 a770 ± 220 a
# Physiological6, 12, 17, 24/25Effective quantum efficiencya.u.0.30 ± 0.07 a0.31 ± 0.06 a0.32 ± 0.10 a
Maximum quantum efficiencya.u.0.45 ± 0.07 a0.51 ± 0.06 b0.53 ± 0.08 b
Stomatal conductancemmol m–2 s–161 ± 28 c45 ± 21 b31 ± 15 a
Optical26UV-B%10.45 ± 1.56 b8.33 ± 1.49 a8.39 ± 1.48 a
reflectance UV-A%7.85 ± 1.23 b6.88 ± 0.93 a6.80 ± 0.94 a
Violet%6.59 ± 0.45 ab6.34 ± 0.39 a6.80 ± 0.35 b
Blue%6.53 ± 0.38 a6.54 ± 0.32 a7.02 ± 0.32 b
Green%12.05 ± 2.82 a12.54 ± 2.77 a13.72 ± 3.25 a
Yellow%10.42 ± 1.21 a10.93 ± 0.93 a,b11.99 ± 1.34 b
Red%8.05 ± 1.31 a8.46 ± 1.31 a,b9.07 ± 1.62 b
Near infrared%31.64 ± 4.94 a32.10 ± 4.77 a34.19 ± 5.74 a
Optical26UV-B%0.21 ± 0.49 b0.03 ± 0.41 a0.15 ± 0.45 b
transmittance UV-A%0.63 ± 0.87 a0.58 ± 0.88 a0.81 ± 1.16 a
Violet%4.31 ± 0.77 a4.17 ± 0.73 a5.56 ± 1.07 b
Blue%6.22 ± 0.82 a6.15 ± 0.82 a7.83 ± 1.24 b
Green%22.05 ± 6.75 a21.97 ± 6.46 a22.72 ± 6.23 a
Yellow%19.76 ± 2.33 a19.53 ± 1.87 a20.90 ± 2.59 a
Red%12.40 ± 4.08 a12.58 ± 4.18 a14.09 ± 4.30 a
Near infrared%65.31 ± 12.00 b63.92 ± 11.58 a,b60.45 ± 10.43 a
Element analysis32P% of dry matter0.59 ± 0.14 b0.40 ± 0.08 a0.43 ± 0.07 a
S% of dry matter0.24 ± 0.05 b0.17 ± 0.04 a0.17 ± 0.01 a
Cl% of dry matter0.63 ± 0.06 a,b0.60 ± 0.06 a0.81 ± 0.22 b
K% of dry matter3.70 ± 0.27 a3.76 ± 0.15 a4.18 ± 0.29 b
Ca% of dry matter0.55 ± 0.08 b0.52 ± 0.06 a,b0.45 ± 0.04 a
Other27Leaf relative water content%94.8 ± 2.9 b94.8 ± 0.9 b87.4 ± 8.4 a
31Plant heightcm94.5 ± 8.2 c85.9 ± 9.1 b74.3 ± 5.4 a
31Lodged plants%66.6 ± 12.0 b50.1 ± 2.9 a55.1 ± 14.3 a,b
The data are means ± SD (n = 5 for each, except for physiological measurements with n = 20). Different superscript letters within each row indicate significant differences (p ≤ 0.05; Duncan tests). # Means from measurements conducted between 21 June (day 6) and 9 July (day 24), 2018, for effective and maximum quantum efficiency of PS II photochemistry, and between 21 June (day 6) and 10 July (day 25), 2018, for stomatal conductance.
Table 2. Total Si and Ca levels in the soil before and after the experimental period.
ElementSample DaysUnitsBeforeAfter
Total Si−1, 32% of DM6.65 ± 0.666.45 ± 0.78
Total Ca3.70 ± 0.393.77 ± 0.23
The data are means ± SD (n = 5).
Table 3. Pearson correlations between proso millet leaf reflectance, and leaf silicon and calcium contents.
ElementLeaf Reflectance
UV-BUV-AVioletBlueGreenYellowRedNear Infrared
Si0.666 **0.614 *0.030−0.093−0.031−0.032−0.0890.016
Ca0.3000.214−0.715 **−0.848 **−0.612 *−0.663 **−0.775 **−0.371
*, p ≤ 0.05; **, p ≤ 0.01.
Table 4. Pearson correlations between proso millet leaf element contents and water-related parameters.
Water-Related ParametersLeaf Element Contents
SiPSClKCa
Soil moisture0.691 **0.648 **0.654 **−0.429−0.516 *0.580 *
Stomatal conductance0.549 *0.567 *0.484−0.487−0.715 **0.341
Leaf relative water content0.2900.3000.284−0.740 **−0.757 **0.229
*, p ≤ 0.05, **, p ≤ 0.01.
Table 5. Pearson correlations between specific parameters for the proso millet.
ParametersPlant HeightLiving Leaf BiomassDead Leaf Biomass
Soil moisture0.834 **0.603 *−0.770 **
Stomatal conductance0.660 **0.429−0.612 *
Leaf relative water content0.623 *0.517 *−0.627 *
Leaf Si content0.539 *0.743 **−0.449
*, p ≤ 0.05; **, p ≤ 0.01.

