Spatial Variability of Soil Moisture in Newly Implemented Agricultural Bench Terraces in the Ethiopian Plateau

 , ,
, , 

Abstract
1. Introduction
2. Materials and Methods
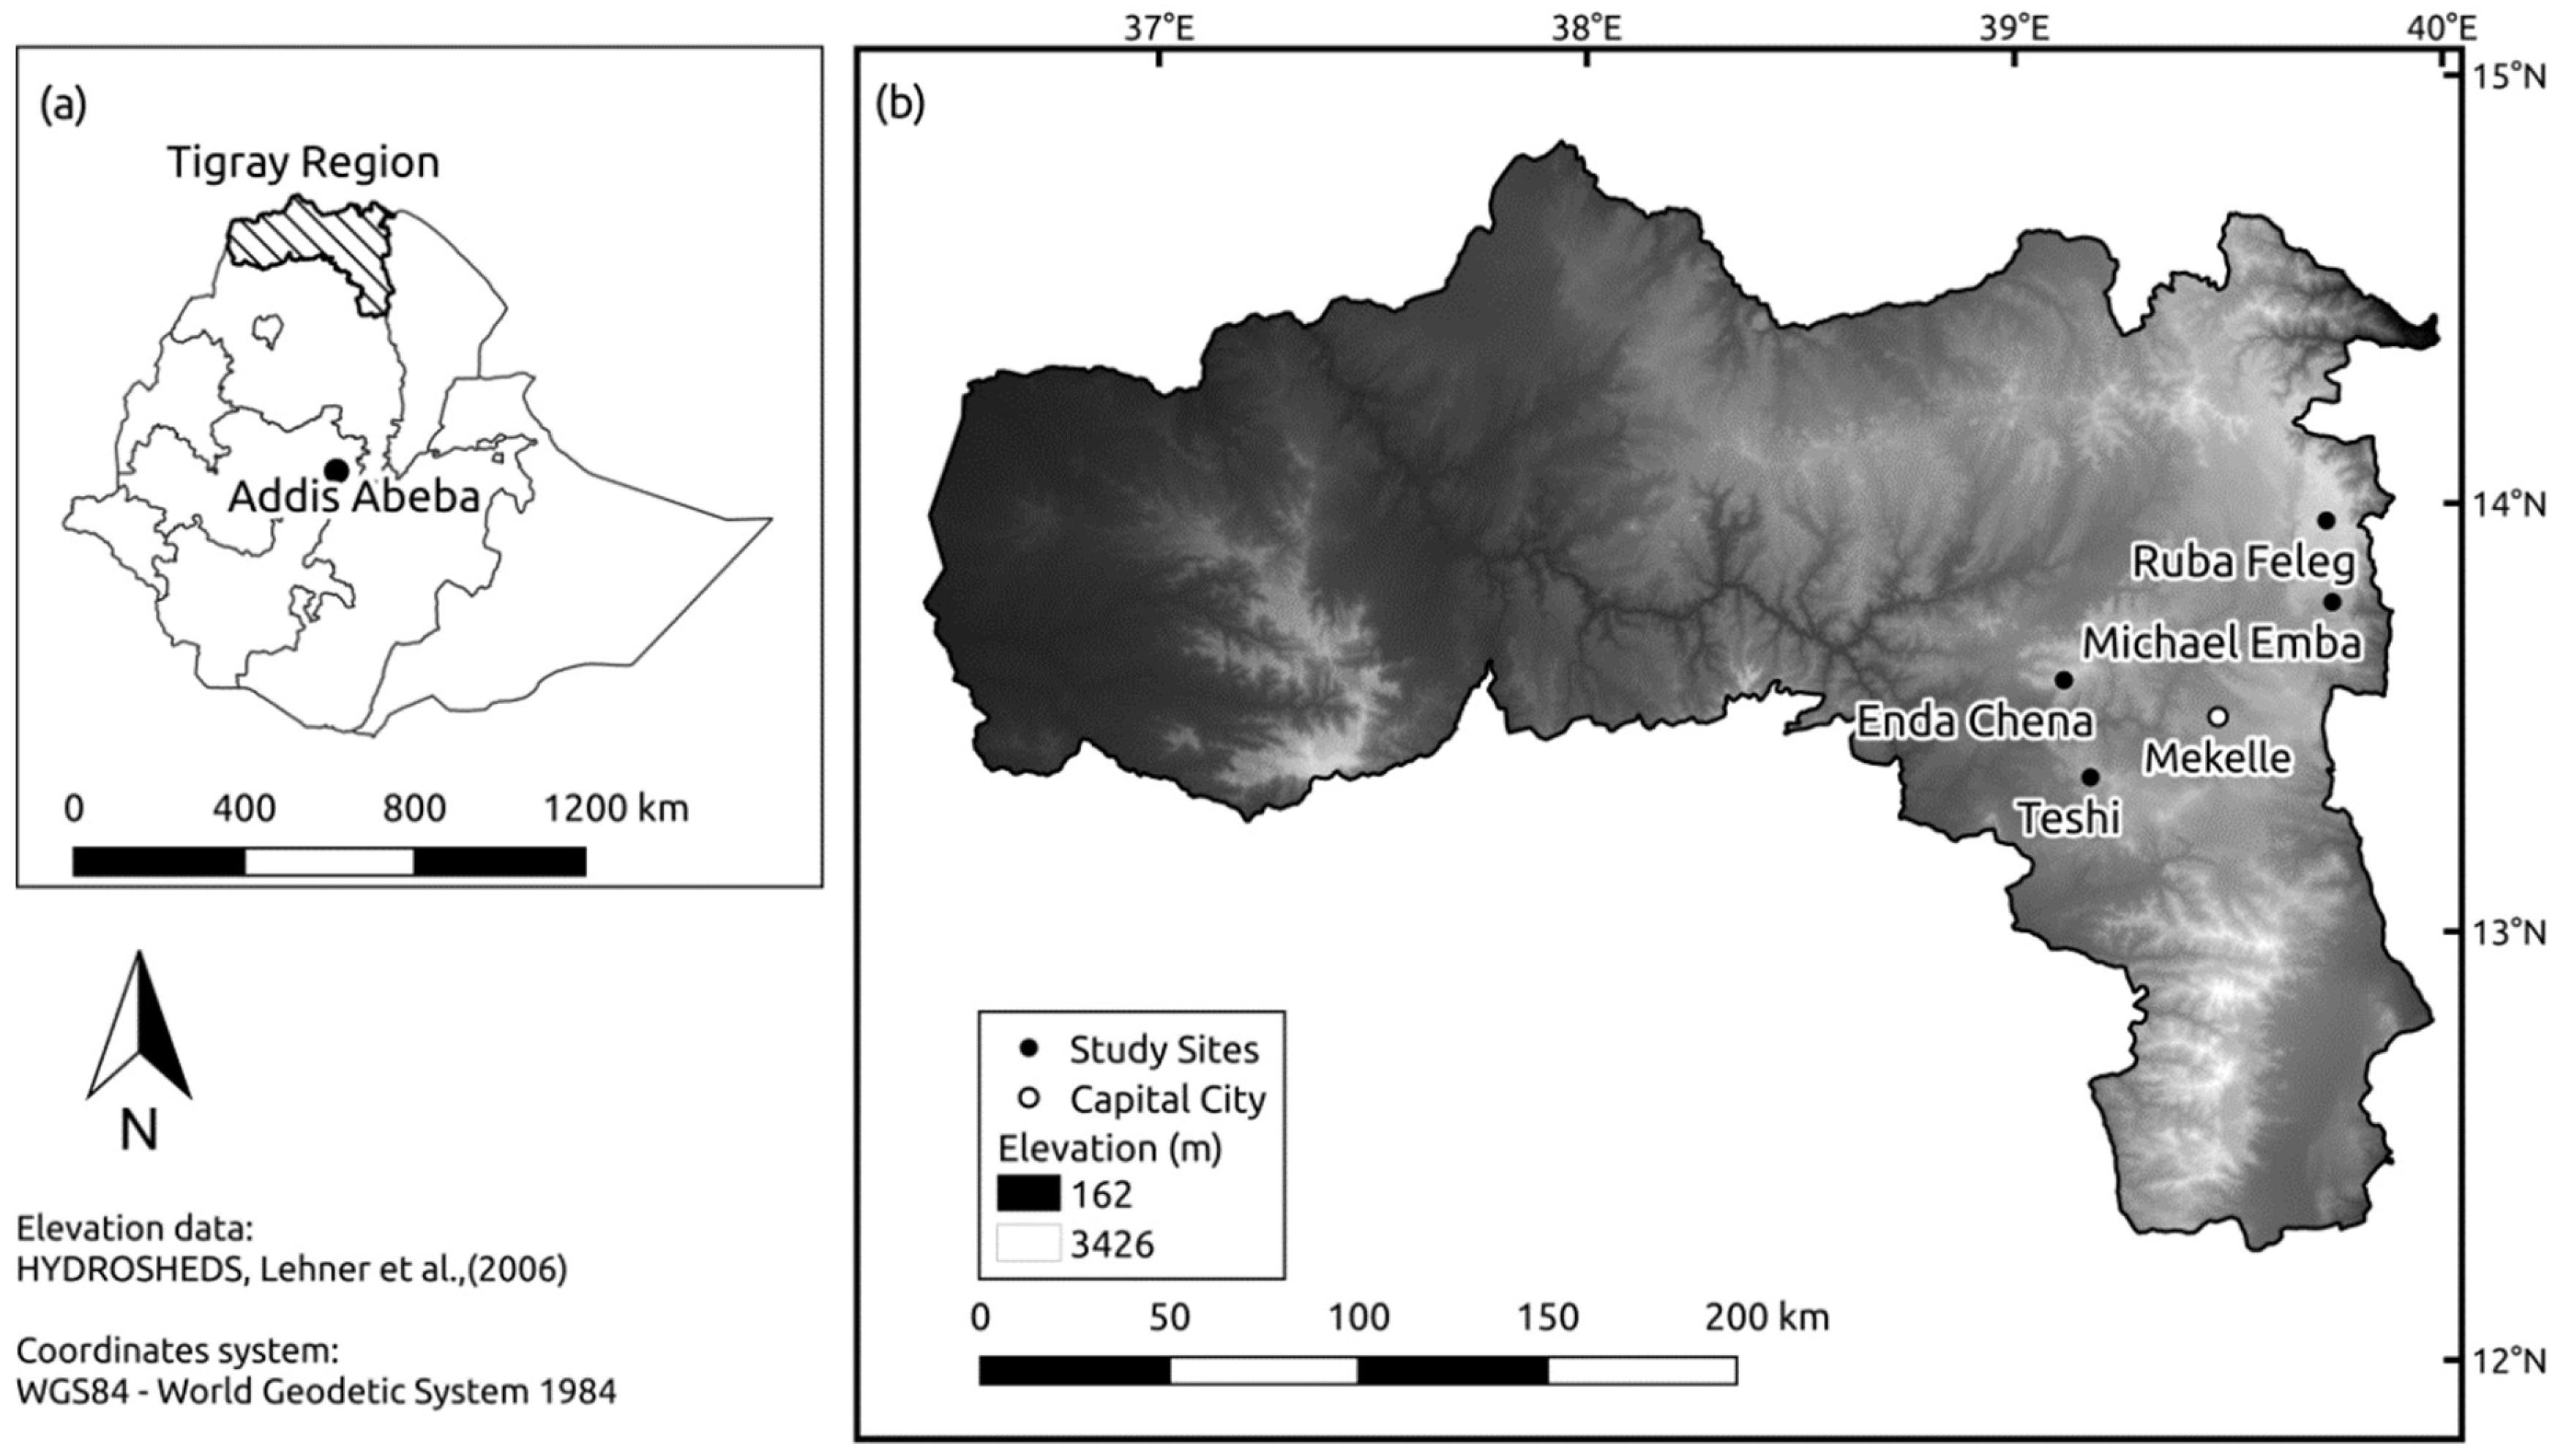
2.1. Study Area
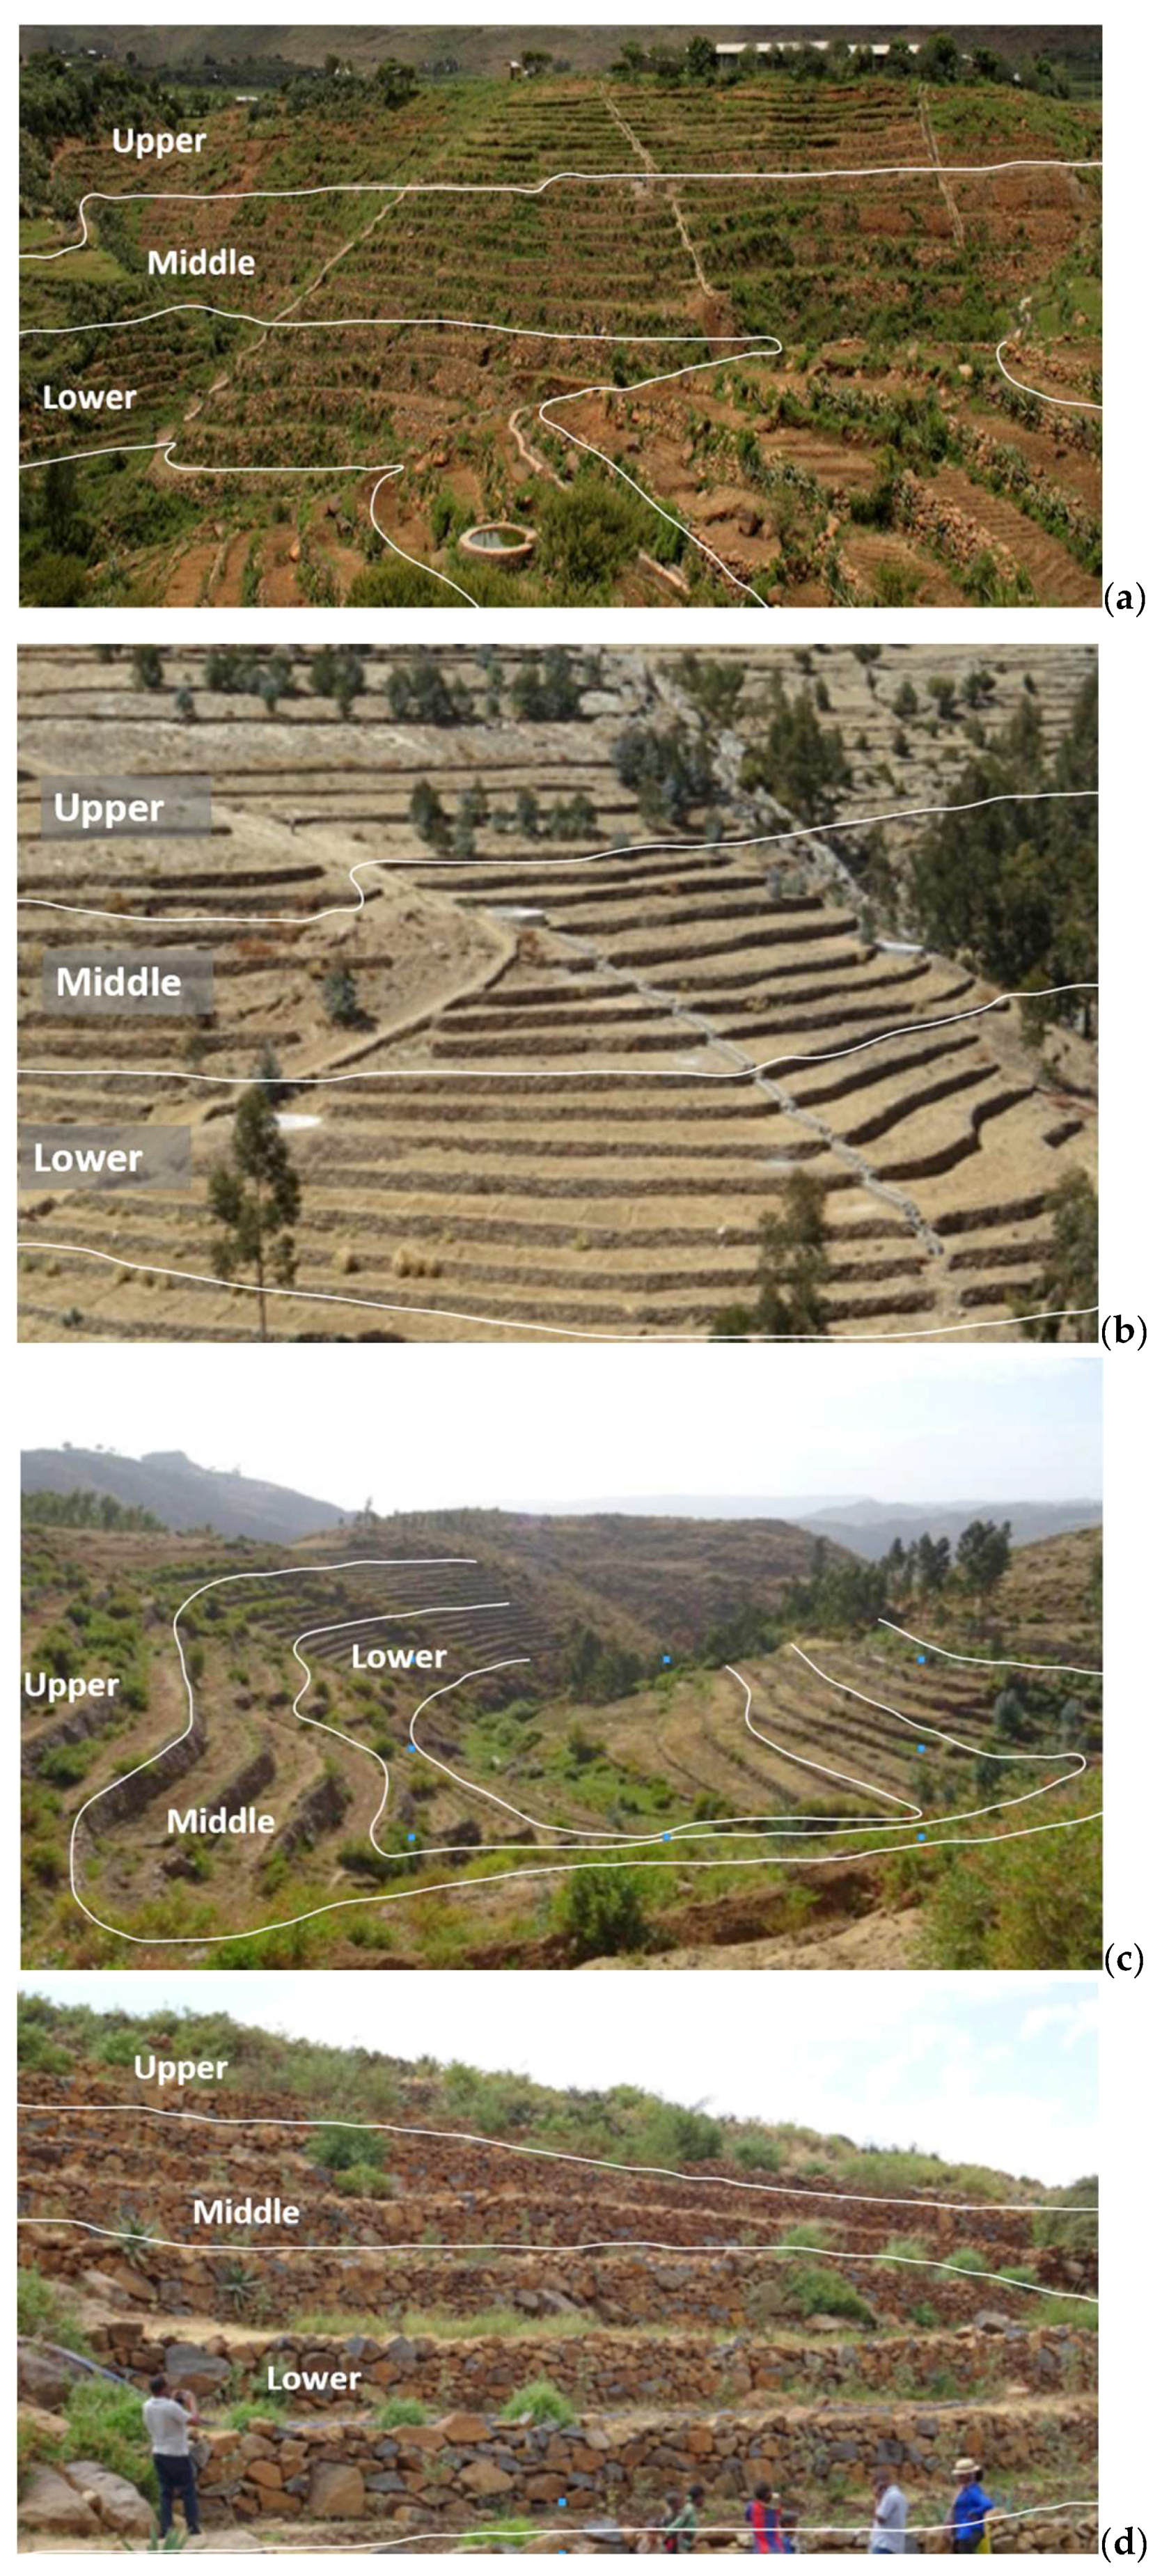
2.2. Experimental Setting, Soil Sampling, and Soil Moisture Estimation
2.3. Data Analysis
2.3.1. Statistical Analysis of Soil Moisture Data
2.3.2. Multiple Linear Regression
2.4. Rainfall Data of 2016–2017 Season
3. Results
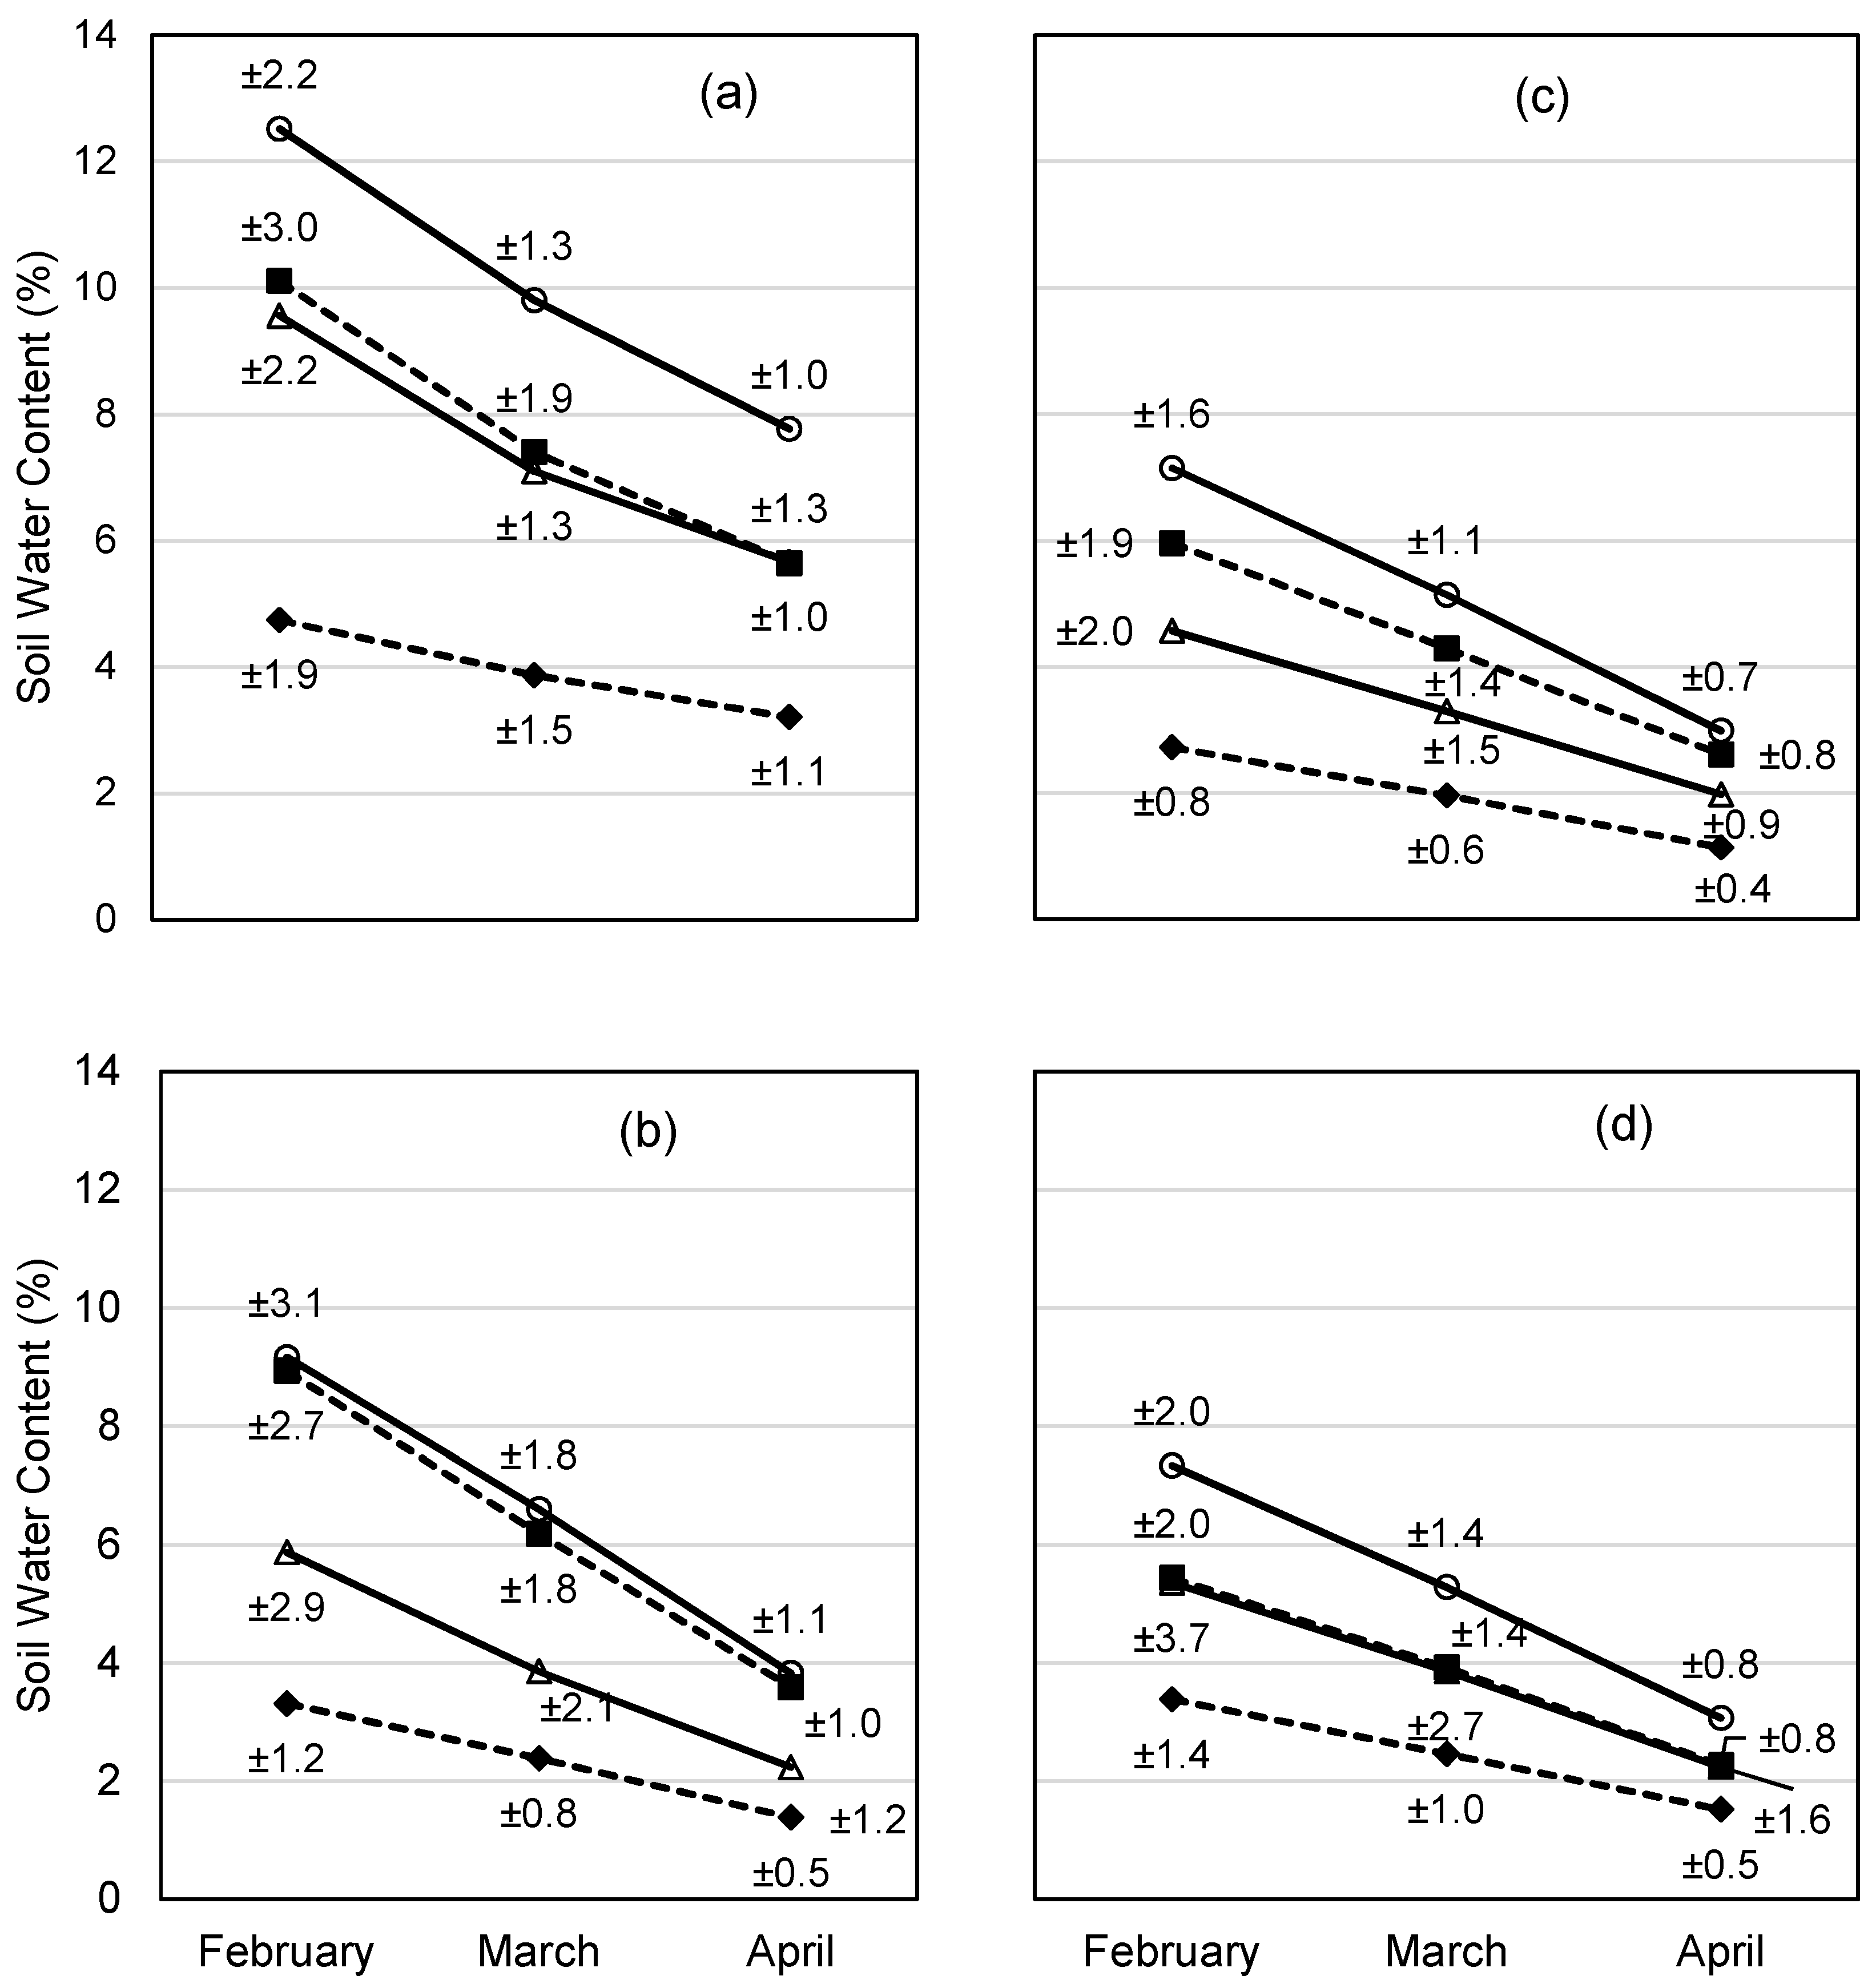
3.1. Statistical Analysis
3.2. MLR Results
3.3. Rainfall Data of 2016–2017 Season
4. Discussion
4.1. SWC Increase Induced by Terracing
4.2. SWC Patterns Within Terraced Hillslopes
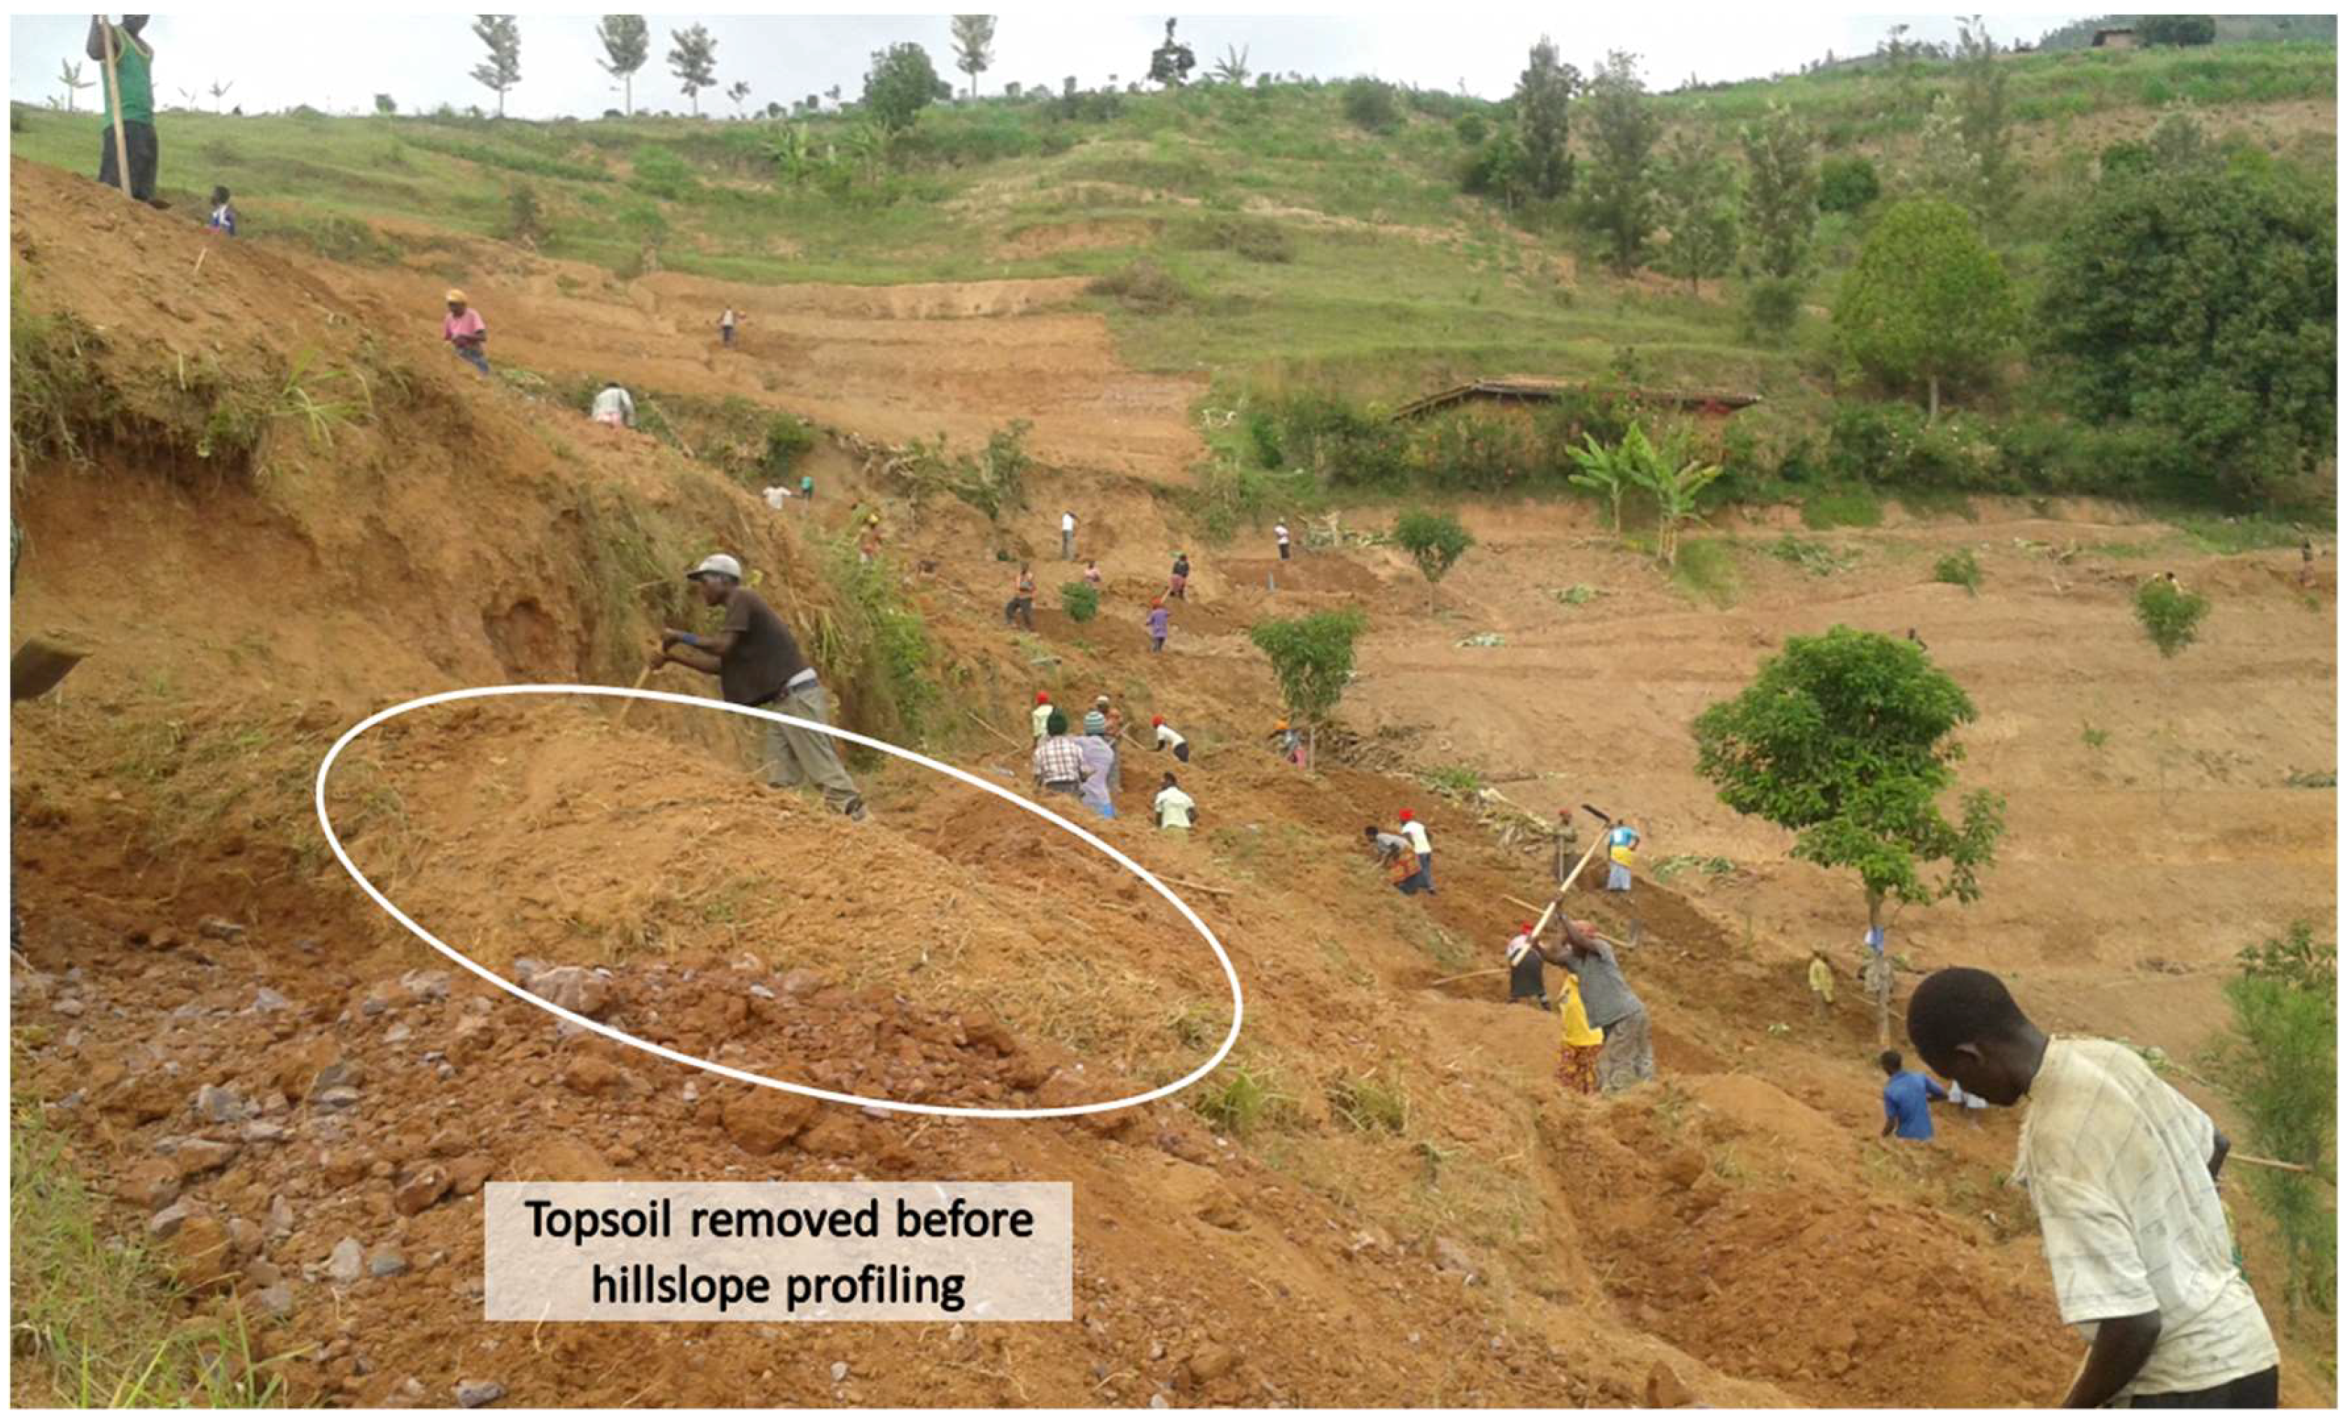
4.3. Impact of Terracing Implementation on SWC
5. Conclusions
Author Contributions
Funding
Acknowledgments
Conflicts of Interest
References
- Rockstrom, J.; Falkenmark, M. Increase water harvesting in Africa. Nature 2015, 519, 283–295. [Google Scholar] [CrossRef] [PubMed]
- Liniger, H.; Studer, R.M.; Hauert, C.; Gurtner, M. Sustainable Land Management in Practice: Guidelines and Best Practices for Sub-Saharan Africa; FAO: Rome, Italy, 2011. [Google Scholar]
- Liniger, H.; Critchley, W.; Gurtner, M.; Schwilch, G.; Studer, R.M. Where the Land is Greener: Case Studies and Analysis of Soil and Water Conservation Initiatives Worldwide; World Overview of Conservation Approaches and Technologies (WOCAT): Bern, Switzerland, 2007; ISBN 9290813393. [Google Scholar]
- UNCCD-United Nations Convention to Combat Desertification. The Global Land Outlook, 1st ed.; UNCCD: Bonn, Germany, 2017. [Google Scholar]
- Posthumus, H.; Stroosnijder, L. To terrace or not: The short-term impact of bench terraces on soil properties and crop response in the Peruvian Andes. Environ. Dev. Sustain. 2010, 12, 263–276. [Google Scholar] [CrossRef]
- Pimentel, D. Soil erosion: A food and environmental threat. Environ. Dev. Sustain. 2006, 8, 119–137. [Google Scholar] [CrossRef]
- Wei, W.; Chen, D.; Wang, L.; Daryanto, S.; Chen, L.; Yu, Y.; Lu, Y.; Sun, G.; Feng, T. Global synthesis of the classifications, distributions, benefits and issues of terracing. Earth Sci. Rev. 2016, 159, 388–403. [Google Scholar] [CrossRef]
- Zhang, H.; Wei, W.; Chen, L.; Wang, L. Effects of terracing on soil water and canopy transpiration of Chinese pine plantation in the Loess Plateau, China. Hydrol. Earth Syst. Sci. Discuss 2016, 2016. [Google Scholar] [CrossRef]
- Gill, J.C.; Malamud, B.D. Anthropogenic processes, natural hazards, and interactions in a multi-hazard framework. Earth Sci. Rev. 2017, 166, 246–269. [Google Scholar] [CrossRef]
- Caloiero, T. Hydrological hazard: Analysis and prevention. Geosciences 2018, 8, 389. [Google Scholar] [CrossRef]
- El Atta, H.A.; Aref, I. Effect of terracing on rainwater harvesting and growth of Juniperus procera Hochst. ex Endlicher. Int. J. Environ. Sci. Technol. 2010, 7, 59–66. [Google Scholar] [CrossRef]
- Lü, H.; Zhu, Y.; Skaggs, T.H.; Yu, Z. Comparison of measured and simulated water storage in dryland terraces of the Loess Plateau, China. Agric. Water Manag. 2009, 96, 299–306. [Google Scholar] [CrossRef]
- Schiettecatte, W.; Ouessar, M.; Gabriels, D.; Tanghe, S. Impact of water harvesting techniques on soil and water conservation: A case study on a micro catchment in southeastern Tunisia. J. Arid Environ. 2005, 61, 297–313. [Google Scholar] [CrossRef]
- Chow, T.L.; Rees, H.W.; Daigle, J.L. Effectiveness of terraces/grassed waterway systems for soil and water conservation: A field evaluation. J. Soil Water Conserv. 1999, 54, 577–583. [Google Scholar]
- Wei, W.; Feng, X.; Yang, L.; Chen, L.; Feng, T.; Chen, D. The effects of terracing and vegetation on soil moisture retention in a dry hilly catchment in China. Sci. Total Environ. 2019, 647, 1323–1332. [Google Scholar] [CrossRef] [PubMed]
- Saiz, G.; Wandera, F.M.; Pelster, D.E.; Ngetich, W.; Okalebo, J.R.; Rufino, M.C.; Butterbach-Bahl, K. Long-term assessment of soil and water conservation measures (Fanya-juu terraces) on soil organic matter in south eastern Kenya. Geoderma 2016, 274, 1–9. [Google Scholar] [CrossRef]
- Tripathi, R.P.; Ogbazghi, W. Watershed management to enhance rainwater conservation and crop yields in semiarid environments—A case study at Hamelmalo Agricultural College, Anseba region of Eritrea. Agric. Water Manag. 2016, 168, 1–10. [Google Scholar] [CrossRef]
- Tarolli, P.; Preti, F.; Romano, N. Terraced landscapes: From an old best practice to a potential hazard for soil degradation due to land abandonment. Anthropocene 2014, 6, 10–25. [Google Scholar] [CrossRef]
- Bizoza, A.R.; de Graaff, J. Financial cost-benefit analysis of bench terraces in Rwanda. Land Degrad. Dev. 2012, 23, 103–115. [Google Scholar] [CrossRef]
- McConchie, J.A.; Huan-cheng, M.A. A discussion of the risks and benefits of using rock terracing to limit soil erosion in Guizhou Province. J. For. Res. 2002, 13, 41–47. [Google Scholar] [CrossRef]
- Kagabo, D.M.; Stroosnijder, L.; Visser, S.M.; Moore, D. Soil erosion, soil fertility and crop yield on slow-forming terraces in the highlands of Buberuka, Rwanda. Soil Tillage Res. 2013, 128, 23–29. [Google Scholar] [CrossRef]
- Bekele-Tesemma, A. Illustrated Supervision Checklist for Assessment of the Quality of Comprehensive Land-Husbandry Works at LWH Project Sites; Ministry of Agriculture and Animal Resources of Rwanda: Kigali, Rwanda, 2011.
- Siriri, D.; Tenywa, M.M.; Raussen, T.; Zake, J.K. Crop and soil variability on terraces in the highlands of SW Uganda. Land Degrad. Dev. 2005, 16, 569–579. [Google Scholar] [CrossRef]
- Liu, Y.; Gao, M.; Wu, W.; Tanveer, S.K.; Wen, X.; Liao, Y. The effects of conservation tillage practices on the soil water-holding capacity of a non-irrigated apple orchard in the Loess Plateau, China. Soil Tillage Res. 2013, 130, 7–12. [Google Scholar] [CrossRef]
- Moraru, P.I.; Rusu, T. Soil tillage conservation and its effect on soil organic matter, water management and carbon sequestration. J. Food Agric. Environ. 2010, 8, 309–312. [Google Scholar]
- Biamah, E.K.; Gichuki, F.N.; Kaumbutho, P.G. Tillage methods and soil and water conservation in eastern Africa. Soil Tillage Res. 1993, 27, 105–123. [Google Scholar] [CrossRef]
- Xu, Y.; Wang, J.; Cai, S.; Zhou, M. Spatial variability of soil moisture in horizontal terrace on slightly sloping land. NongyeGongchengXuebao/Trans. Chin. Soc. Agric. Eng. 2008, 24, 16–19. [Google Scholar]
- Martínez-Hernández, C.; Rodrigo-Comino, J.; Romero-Díaz, A. Impact of lithology and soil properties on abandoned dryland terraces during the early stages of soil erosion by water in south-east Spain. Hydrol. Process. 2017, 31, 3095–3109. [Google Scholar] [CrossRef]
- Adimassu, Z.; Langan, S.; Barron, J. Highlights of Soil and Water Conservation Investments in Ethiopia; International Water Management Institute (IWMI): Colombo, Sri Lanka, 2018; ISBN 9789290908678. [Google Scholar]
- Haftom, H.; Haftu, A.; Goitom, K.; Meseret, H. Agro-climatic zonation of Tigray region of Ethiopia based on aridity index and traditional agro-climatic zones. J. Agrometeorol. 2019, 21, 176–181. [Google Scholar]
- Gebremicael, T.G.; Mohamed, Y.A.; van Der Zaag, P.; Hagos, E.Y. Quantifying longitudinal land use change from land degradation to rehabilitation in the headwaters of Tekeze-Atbara Basin, Ethiopia. Sci. Total Environ. 2018, 622, 1581–1589. [Google Scholar] [CrossRef]
- Nyssen, J.; Frankl, A.; Haile, M.; Hurni, H.; Descheemaeker, K.; Crummey, D.; Ritler, A.; Portner, B.; Nievergelt, B.; Moeyersons, J.; et al. Environmental conditions and human drivers for changes to north Ethiopian mountain landscapes over 145 years. Sci. Total Environ. 2014, 485–486, 164–179. [Google Scholar] [CrossRef]
- Gebremeskel, G.; Gebremicael, T.G.; Girmay, A. Economic and environmental rehabilitation through soil and water conservation, the case of Tigray in northern Ethiopia. J. Arid Environ. 2018, 151, 113–124. [Google Scholar] [CrossRef]
- Amare, T.; Terefe, A.; Selassie, Y.G.; Yitaferu, B.; Wolfgramm, B.; Hurni, H. Soil properties and crop yields along the terraces and toposequece of Anjeni watershed, Central highlands of Ethiopia. J. Agric. Sci. 2013, 5, 134–144. [Google Scholar] [CrossRef]
- Mesfin, S.; Taye, G.; Desta, Y.; Sibhatu, B.; Muruts, H. Short-term effects of bench terraces on selected soil physical and chemical properties: Landscape improvement for hillside farming in semi-arid areas of northern Ethiopia. Environ. Earth Sci. 2018, 77, 1–14. [Google Scholar] [CrossRef]
- Abi, M.; Kessler, A.; Oosterveer, P.; Tolossa, D. Understanding the spontaneous spreading of stone bunds in Ethiopia: Implications for sustainable land management. Sustainability 2018, 10, 2666. [Google Scholar] [CrossRef]
- Klik, A.; Schürz, C.; Strohmeier, S.; Demelash Melaku, N.; Ziadat, F.; Schwen, A.; Zucca, C. Impact of stone bunds on temporal and spatial variability of soil physical properties: A field study from northern Ethiopia. Land Degrad. Dev. 2018, 29, 585–595. [Google Scholar] [CrossRef]
- Tadesse, B.; Mesfin, S.; Tesfay, G.; Abay, F. Effect of integrated soil bunds on key soil properties and soil carbon stock in semi-arid areas of northern Ethiopia. S. Afr. J. Plant Soil 2016, 33, 297–302. [Google Scholar] [CrossRef]
- Vancampenhout, K.; Nyssen, J.; Gebremichael, D.; Deckers, J.; Poesen, J.; Haile, M.; Moeyersons, J. Stone bunds for soil conservation in the northern Ethiopian highlands: Impacts on soil fertility and crop yield. Soil Tillage Res. 2006, 90, 1–15. [Google Scholar] [CrossRef]
- Kosmowski, F. Soil water management practices (terraces) helped to mitigate the 2015 drought in Ethiopia. Agric. Water Manag. 2018, 204, 11–16. [Google Scholar] [CrossRef]
- Amsalu, A.; de Graaff, J. Determinants of adoption and continued use of stone terraces for soil and water conservation in an Ethiopian highland watershed. Ecol. Econ. 2007, 61, 294–302. [Google Scholar] [CrossRef]
- Gebremedhin, B.; Swinton, S.; Tilahun, Y. Effects of stone terraces on crop yields and farm profitability: Results of on-farm research in Tigray, northern Ethiopia. J. Soil Water Conserv. 1999, 54, 568–573. [Google Scholar]
- Castelli, G.; Bresci, E. Integrating landsat 7 and CHIRPS datasets in Google Earth Engine platform. Rend. Online Soc. Geol. Ital. 2019, 48, 47–53. [Google Scholar]
- Castelli, G.; Castelli, F.; Bresci, E. Mesoclimate regulation induced by landscape restoration and water harvesting in agroecosystems of the horn of Africa. Agric. Ecosyst. Environ. 2019, 275, 54–64. [Google Scholar] [CrossRef]
- Haregeweyn, N.; Berhe, A.; Tsunekawa, A.; Tsubo, M.; Meshesha, D.T. Integrated watershed management as an effective approach to curb land degradation: A case study of the enabered watershed in northern Ethiopia. Environ. Manag. 2012, 50, 1219–1233. [Google Scholar] [CrossRef]
- CSA (Central Statistical Agency, & ICF International). Ethiopia: Demographic and Health Survey 2011; Central Statistical Agency, Addis Ababa, Ethiopia and ICF International: Clayton, MD, USA, 2012.
- Lehner, B.; Verdin, K.; Jarvis, A. HydroSHEDS Technical Documentation; World Wildlife Fund US: Washington, DC, USA, 2006. Available online: http://hydrosheds.cr.usgs.gov (accessed on 22 August 2019).
- FAO. GIEWS-Global Information and Early Warning System. Ethiopia Country Profile. Available online: http://www.fao.org/giews/countrybrief/country.jsp?code=ETH (accessed on 21 September 2019).
- Xia, J.; Zhao, Z.; Fang, Y. Soil hydro-physical characteristics and water retention function of typical shrubbery stands in the Yellow River Delta of China. Catena 2017, 156, 315–324. [Google Scholar] [CrossRef]
- Funk, C.; Verdin, A.; Michaelsen, J.; Peterson, P.; Pedreros, D.; Husak, G. A global satellite assisted precipitation climatology. Earth Syst. Sci. Data Discuss 2015, 7, 1–13. [Google Scholar]
- Gorelick, N.; Hancher, M.; Dixon, M.; Ilyushchenko, S.; Thau, D.; Moore, R. Remote sensing of environment Google Earth Engine: Planetary-scale geospatial analysis for everyone. Remote Sens. Environ. 2017, 202, 18–27. [Google Scholar] [CrossRef]
- Dinku, T.; Funk, C.; Peterson, P.; Maidment, R.; Tadesse, T.; Gadain, H.; Ceccato, P. Validation of the CHIRPS satellite rainfall estimates over eastern Africa. Q. J. R. Meteorol. Soc. 2018, 144, 292–312. [Google Scholar] [CrossRef]
- Zuazo, V.H.D.; Pleguezuelo, C.R.R.; Peinado, F.J.M.; de Graaff, J.; Martínez, J.R.F.; Flanagan, D.C. Environmental impact of introducing plant covers in the taluses of terraces: Implications for mitigating agricultural soil erosion and runoff. Catena 2011, 84, 79–88. [Google Scholar] [CrossRef]
- Kumar, M.; Singh, K.P.; Srinivas, K.; Reddy, K.S. In-situ water conservation in upland paddy field to improve productivity in north-west Himalayan region of India. Paddy Water Environ. 2014, 12, 181–191. [Google Scholar] [CrossRef]


| Parameter | Unit | Terrace Position and Control | Teshi | Ruba Feleg | Michael Emba | Enda Chena |
|---|---|---|---|---|---|---|
| Elevation | m a.s.l. | - | 2261 | 2803 | 2359 | 2607 |
| Mean Rainfall | mm | - | 558 | 745 | 715 | 726 |
| Average Temperature | °C | - | 23 | 16 | 16 | 17 |
| Bench width | m | Upper | 2.8 | 6.3 | 3.6 | 4.7 |
| Middle | 3.7 | 5.4 | 4.7 | 5.9 | ||
| Lower | 3.7 | 4.6 | 4.9 | 4.9 | ||
| Wall height | m | Upper | 1.4 | 0.7 | 1.8 | 1.4 |
| Middle | 2.0 | 1.2 | 2.3 | 1.3 | ||
| Lower | 3.5 | 1.1 | 1.9 | 1.5 | ||
| Slope | % | Upper | 61.3 | 35.5 | 44.3 | 33.0 |
| Middle | 53 | 25.4 | 40.7 | 31.3 | ||
| Lower | 46 | 23.3 | 36.6 | 23.3 | ||
| Control | 51.3 | 27.6 | 39.4 | 32.2 | ||
| Bulk density | g cm−3 | Upper | 1.23 | 1.34 | 1.19 | 1.09 |
| Middle | 1.23 | 1.35 | 1.21 | 1.11 | ||
| Lower | 1.24 | 1.36 | 1.21 | 1.10 | ||
| Control | 1.34 | 1.24 | 1.23 | 1.19 | ||
| Water stable aggregates | % | Upper | 42.5 | 38.3 | 33.0 | 22.0 |
| Middle | 46.3 | 45.6 | 42.0 | 24.0 | ||
| Lower | 52.7 | 46.0 | 43.7 | 31.0 | ||
| Control | 39.4 | 38.9 | 48.0 | 31.0 | ||
| Soilorganic carbon | % | Upper | 1.73 | 1.28 | 2.04 | 1.48 |
| Middle | 1.60 | 1.21 | 2.00 | 1.78 | ||
| Lower | 1.48 | 1.06 | 1.81 | 1.94 | ||
| Control | 1.80 | 0.72 | 1.23 | 1.13 | ||
| Soil nitrogen | % | Upper | 0.09 | 0.08 | 0.13 | 0.12 |
| Middle | 0.08 | 0.07 | 0.11 | 0.12 | ||
| Lower | 0.07 | 0.06 | 0.09 | 0.12 | ||
| Control | 0.10 | 0.12 | 0.08 | 0.10 | ||
| Soil available phosphorous | ppm | Upper | 4.50 | 3.02 | 1.57 | 1.99 |
| Middle | 5.20 | 2.01 | 4.22 | 2.70 | ||
| Lower | 6.78 | 1.15 | 7.31 | 3.59 | ||
| Control | 22.30 | 0.91 | 1.19 | 1.14 | ||
| Exchangeable potassium | ppm | Upper | 9.00 | 0.73 | 3.45 | 4.05 |
| Middle | 6.57 | 0.95 | 2.75 | 4.25 | ||
| Lower | 4.40 | 1.15 | 2.25 | 4.45 | ||
| Control | 4.90 | 17.95 | 4.05 | 3.55 | ||
| Geology | type | - | LSD | PMSAS | AS | VR |
| Soil type | type | - | L&C | L&R | L,R&C | L,R&C |
| Soil texture * | type | Upper | SL | SL | L | SCL |
| Middle | SL | SL | L | SCL | ||
| Lower | SL | SL | L | SCL | ||
| Control | SL | SL | SL | SL |
| Factor | Levels |
|---|---|
| Position | Upper |
| Middle | |
| Lower | |
| Control | |
| Sites | Teshi |
| Ruba Feleg | |
| Michael Emba | |
| Enda Chena | |
| Date | February |
| March | |
| April |
| Parameter | Original Value | Normalised Value |
|---|---|---|
| Position (Pos_n) | Control | 0.000 |
| Upper | 0.333 | |
| Middle | 0.667 | |
| Lower | 1.000 | |
| Date (Date_n) | 15/02/2017 | 0.000 |
| 15/03/2017 | 0.500 | |
| 15/04/2017 | 1.000 |
| Position | Sites | |||||||
|---|---|---|---|---|---|---|---|---|
| Teshi | Ruba Feleg | Michael Emba | Enda Chena | |||||
| Upper | 7.44 ± 2.81 | bA | 3.99 ± 2.58 | bB | 3.28 ± 1.57 | bB | 3.82 ± 1.91 | aB |
| Middle | 7.72 ± 2.82 | bA | 6.24 ± 2.92 | aAB | 4.28 ± 1.95 | abBC | 3.87 ± 1.95 | aC |
| Lower | 10.03 ± 2.50 | aA | 6.53 ± 3.03 | aB | 5.09 ± 2.27 | aB | 5.23 ± 3.22 | aB |
| Control | 3.94 ± 1.59 | cA | 2.36 ± 1.16 | cB | 1.94 ± 0.9 | cB | 2.45 ± 1.28 | bB |
| Position | Date | |||||
|---|---|---|---|---|---|---|
| February | March | April | ||||
| Upper | 6.34 ± 3.05 | Ac | 4.52 ± 2.28 | Bc | 3.03 ± 1.88 | Cc |
| Middle | 7.61 ± 3.07 | Ab | 5.45 ± 2.12 | Bb | 3.53 ± 1.65 | Cb |
| Lower | 9.04 ± 3.45 | Aa | 6.71 ± 2.66 | Ba | 4.41 ± 2.29 | Ca |
| Control | 3.54 ± 1.51 | Ad | 2.67 ± 1.24 | Bd | 1.81 ± 1.04 | Cd |
| Coefficients | Standard Error | t-Statistic | p-Value | Lower 95% | Upper 95% | |
|---|---|---|---|---|---|---|
| Intercept | 0.163 | 0.069 | 2.372 | 0.022 * | 0.024 | 0.302 |
| Pos_n | 0.293 | 0.056 | 5.249 | 0.000 * | 0.181 | 0.406 |
| Date_n | −0.306 | 0.045 | −6.794 | 0.000 * | −0.396 | −0.215 |
| WSA_n | 0.273 | 0.073 | 3.712 | 0.001 * | 0.125 | 0.421 |
| SOC_n | 0.030 | 0.074 | 0.406 | 0.687 | −0.119 | 0.179 |
| r2 | 0.716 | |||||
| Adjusted r2 | 0.690 | |||||
| Standard Error | 0.129 | |||||
| Period | Teshi | Ruba Feleg | Michel Emba | Enda Chena |
|---|---|---|---|---|
| 15/11/2016–14/04/2017 | 20 | 39 | 26 | 11 |
| 15/04/2016–14/04/2017 | 786 | 547 | 566 | 874 |
| February | March | April | 3-month Average | |
|---|---|---|---|---|
| Teshi | 126% (2.26) | 109% (2.09) | 98% (1.98) | 111% (2.11) |
| Ruba Feleg | 141% (2.41) | 133% (2.33) | 133% (2.33) | 136% (2.36) |
| Michael Emba | 116% (2.16) | 116% (2.16) | 122% (2.22) | 118% (2.18) |
| Enda Chena | 79% (1.79) | 77% (1.77) | 66% (1.66) | 74% (1.74) |
| 4-site Average | 116% (2.16) | 109% (2.09) | 105% (2.05) | 110% (2.10) |
© 2019 by the authors. Licensee MDPI, Basel, Switzerland. This article is an open access article distributed under the terms and conditions of the Creative Commons Attribution (CC BY) license (http://creativecommons.org/licenses/by/4.0/).
Share and Cite
Mesfin, S.; Almeida Oliveira, L.A.; Yazew, E.; Bresci, E.; Castelli, G. Spatial Variability of Soil Moisture in Newly Implemented Agricultural Bench Terraces in the Ethiopian Plateau. Water 2019, 11, 2134. https://doi.org/10.3390/w11102134
Mesfin S, Almeida Oliveira LA, Yazew E, Bresci E, Castelli G. Spatial Variability of Soil Moisture in Newly Implemented Agricultural Bench Terraces in the Ethiopian Plateau. Water. 2019; 11(10):2134. https://doi.org/10.3390/w11102134
Chicago/Turabian StyleMesfin, Shimbahri, Lucas Allan Almeida Oliveira, Eyasu Yazew, Elena Bresci, and Giulio Castelli. 2019. "Spatial Variability of Soil Moisture in Newly Implemented Agricultural Bench Terraces in the Ethiopian Plateau" Water 11, no. 10: 2134. https://doi.org/10.3390/w11102134
APA StyleMesfin, S., Almeida Oliveira, L. A., Yazew, E., Bresci, E., & Castelli, G. (2019). Spatial Variability of Soil Moisture in Newly Implemented Agricultural Bench Terraces in the Ethiopian Plateau. Water, 11(10), 2134. https://doi.org/10.3390/w11102134