1. Introduction
Uncertainty analysis is important when simulating runoff because it is difficult for hydrological models to reflect the hydrological process perfectly. Outputs of the Global Climate Models (GCMs) are the most effective data to represent future climate conditions and are widely used to study future hydrological responses to the impact of climate change [
1,
2,
3]. Generally, hydrological models are driven by future climate data from GCMs, and then the projected future runoff is compared with historically measured runoff to analyze the runoff’s response to climate change. The GCMs output with a low-resolution and need to be downscaled to a regional scale, which is suitable for hydrological modeling [
4,
5,
6,
7]. Existing downscaling technology includes statistical and dynamical downscaling methods [
5,
8,
9]. The uncertainties of climate change (including the choice of GCMs and emission scenarios) and the uncertainties of downscaling methods are regarded as the main uncertainties of the hydrological model inputs in studies on climate change’s impact on runoff [
10].
Some previous studies that consider the climate factors of both temperature and precipitation have analyzed the uncertainty of runoff with various hydrological models, such as TOPMODEL, XAJ-RR model, and Soil and Water Assessment Tool (SWAT) (Ouyang et al. [
7], Chang et al. [
11] and Du et al. [
12]). The Soil and Water Assessment Tool (SWAT) is widely used in watershed-scale models because of its preferable performance in simulating runoff in complicated large watersheds for a long period [
13]. Based on the calibrated SWAT model, future runoff can be simulated.
Several studies have analyzed the impact of different uncertainty sources on future runoff projections. Teng et al. [
14] used five rainfall-runoff models and 15 GCMs to compare the uncertainty impact from GCMs with that from hydrological models. The uncertainty of climate change impact on runoff was evaluated by the differences between the minimum and maximum runoff results, and they came to the conclusion that different GCMs caused larger uncertainty than different hydrological models in southeast Australia. Several other studies draw similar conclusions—that GCMs causes larger uncertainty than the other sources—including emission scenarios and hydrological models, such as Kay et al. [
15], Chen et al. [
16], Qi et al. [
17], Hao et al. [
18], Alder and Hostetler [
19], and Sharma et al. [
20]. Other studies have focused on the uncertainty impacts of emissions scenarios from those of the climate models on runoff. For example, Vicuna et al. [
21] evaluated the impact of two GCMs under two emission scenarios on water supply and reservoir storage and demonstrated that it was important to consider the various climate change impacts under different future climate projections and water utilization systems. Das et al. [
22] and Bastola et al. [
23] both found that the uncertainty caused by GCM is much larger than the uncertainty caused by the emission scenario.
The uncertainty caused by downscaling methods cannot be neglected when coupling the GCM outputs and hydrological model inputs. Several comparative studies evaluate the uncertainty impact caused by the downscaling method [
16,
24,
25]. Different downscaling methods can cause a significant uncertainty impact on runoff because different results can be provided even when there is only a small fluctuation in precipitation [
7,
26]. Frost et al. [
27] compared simulated precipitation using six downscaling methods to data for 30 precipitation stations in South-Eastern Australia, and San-Martín et al. [
28] compared the applicability of an ensemble of 12 statistical downscaling methods and found that the impacts of downscaling methods on the simulated future runoff can be significant but less significant than the impact of GCMs.
Most studies generally consider GCMs to contribute most of the uncertainty in future projections. However, accounting for the uncertainty impact caused by downscaling methods can make the assessment more reliable [
29]. Some articles have studied the uncertainty impact caused by downscaling, and more methods are involved than in previous studies [
16]. However, they did not quantify and compare the impacts of climate change and downscaling methods.
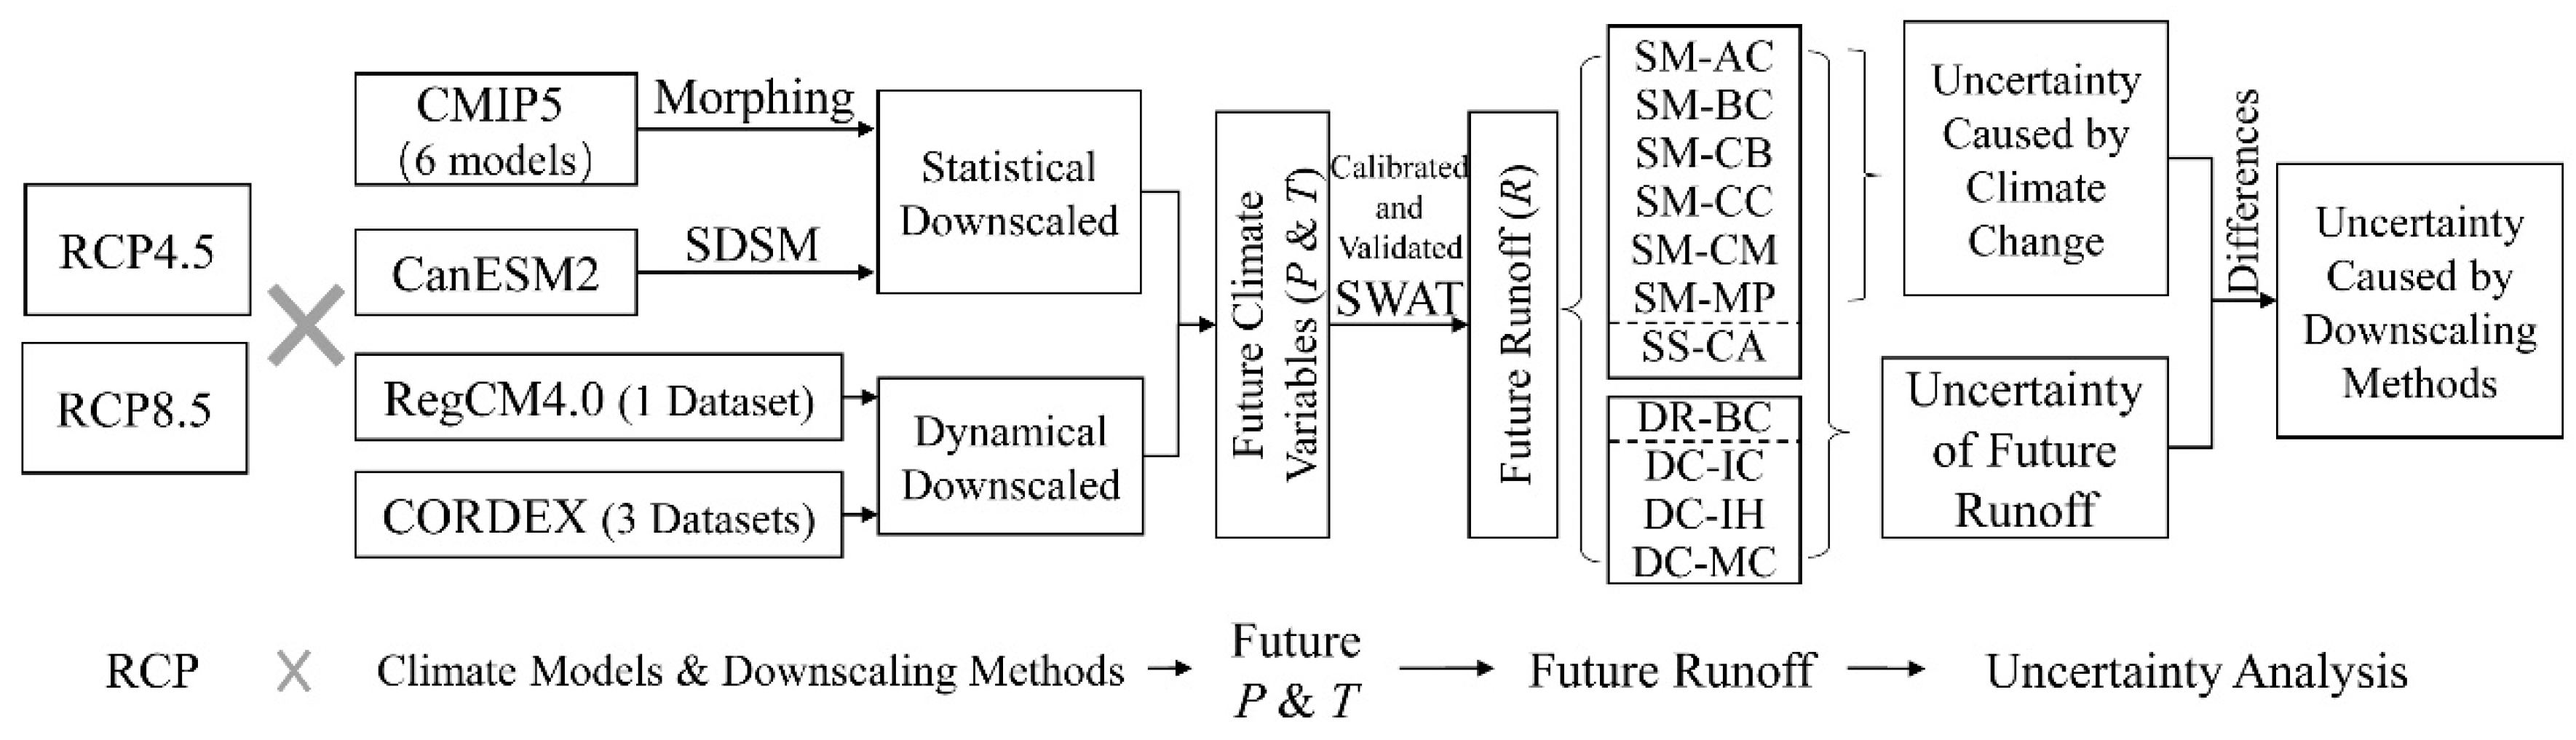
This article attempts to evaluate the contribution of the uncertainty impacts of climate change and downscaling methods on future runoff projections over the Biliu River basin. Both dynamic and statistical downscaling methods are utilized. In this work, the future precipitation, temperature, and runoff are based on 11 GCMs outputs for RCP4.5 and RCP8.5. The uncertainty range of future runoffs under all the considered scenarios is considered as the combined uncertainty caused by climate change and downscaling methods. The uncertainty range of future runoff using the same downscaling method is considered to be caused by climate change. The differences in the two uncertainty ranges are considered as the uncertainty caused by downscaling methods. This study will provide new ideas for future researchers to analyze different uncertainty sources. This article is organized as follows.
Section 2 presents the downscaling methods and proposes the methodologies to quantify the uncertainties of future runoff;
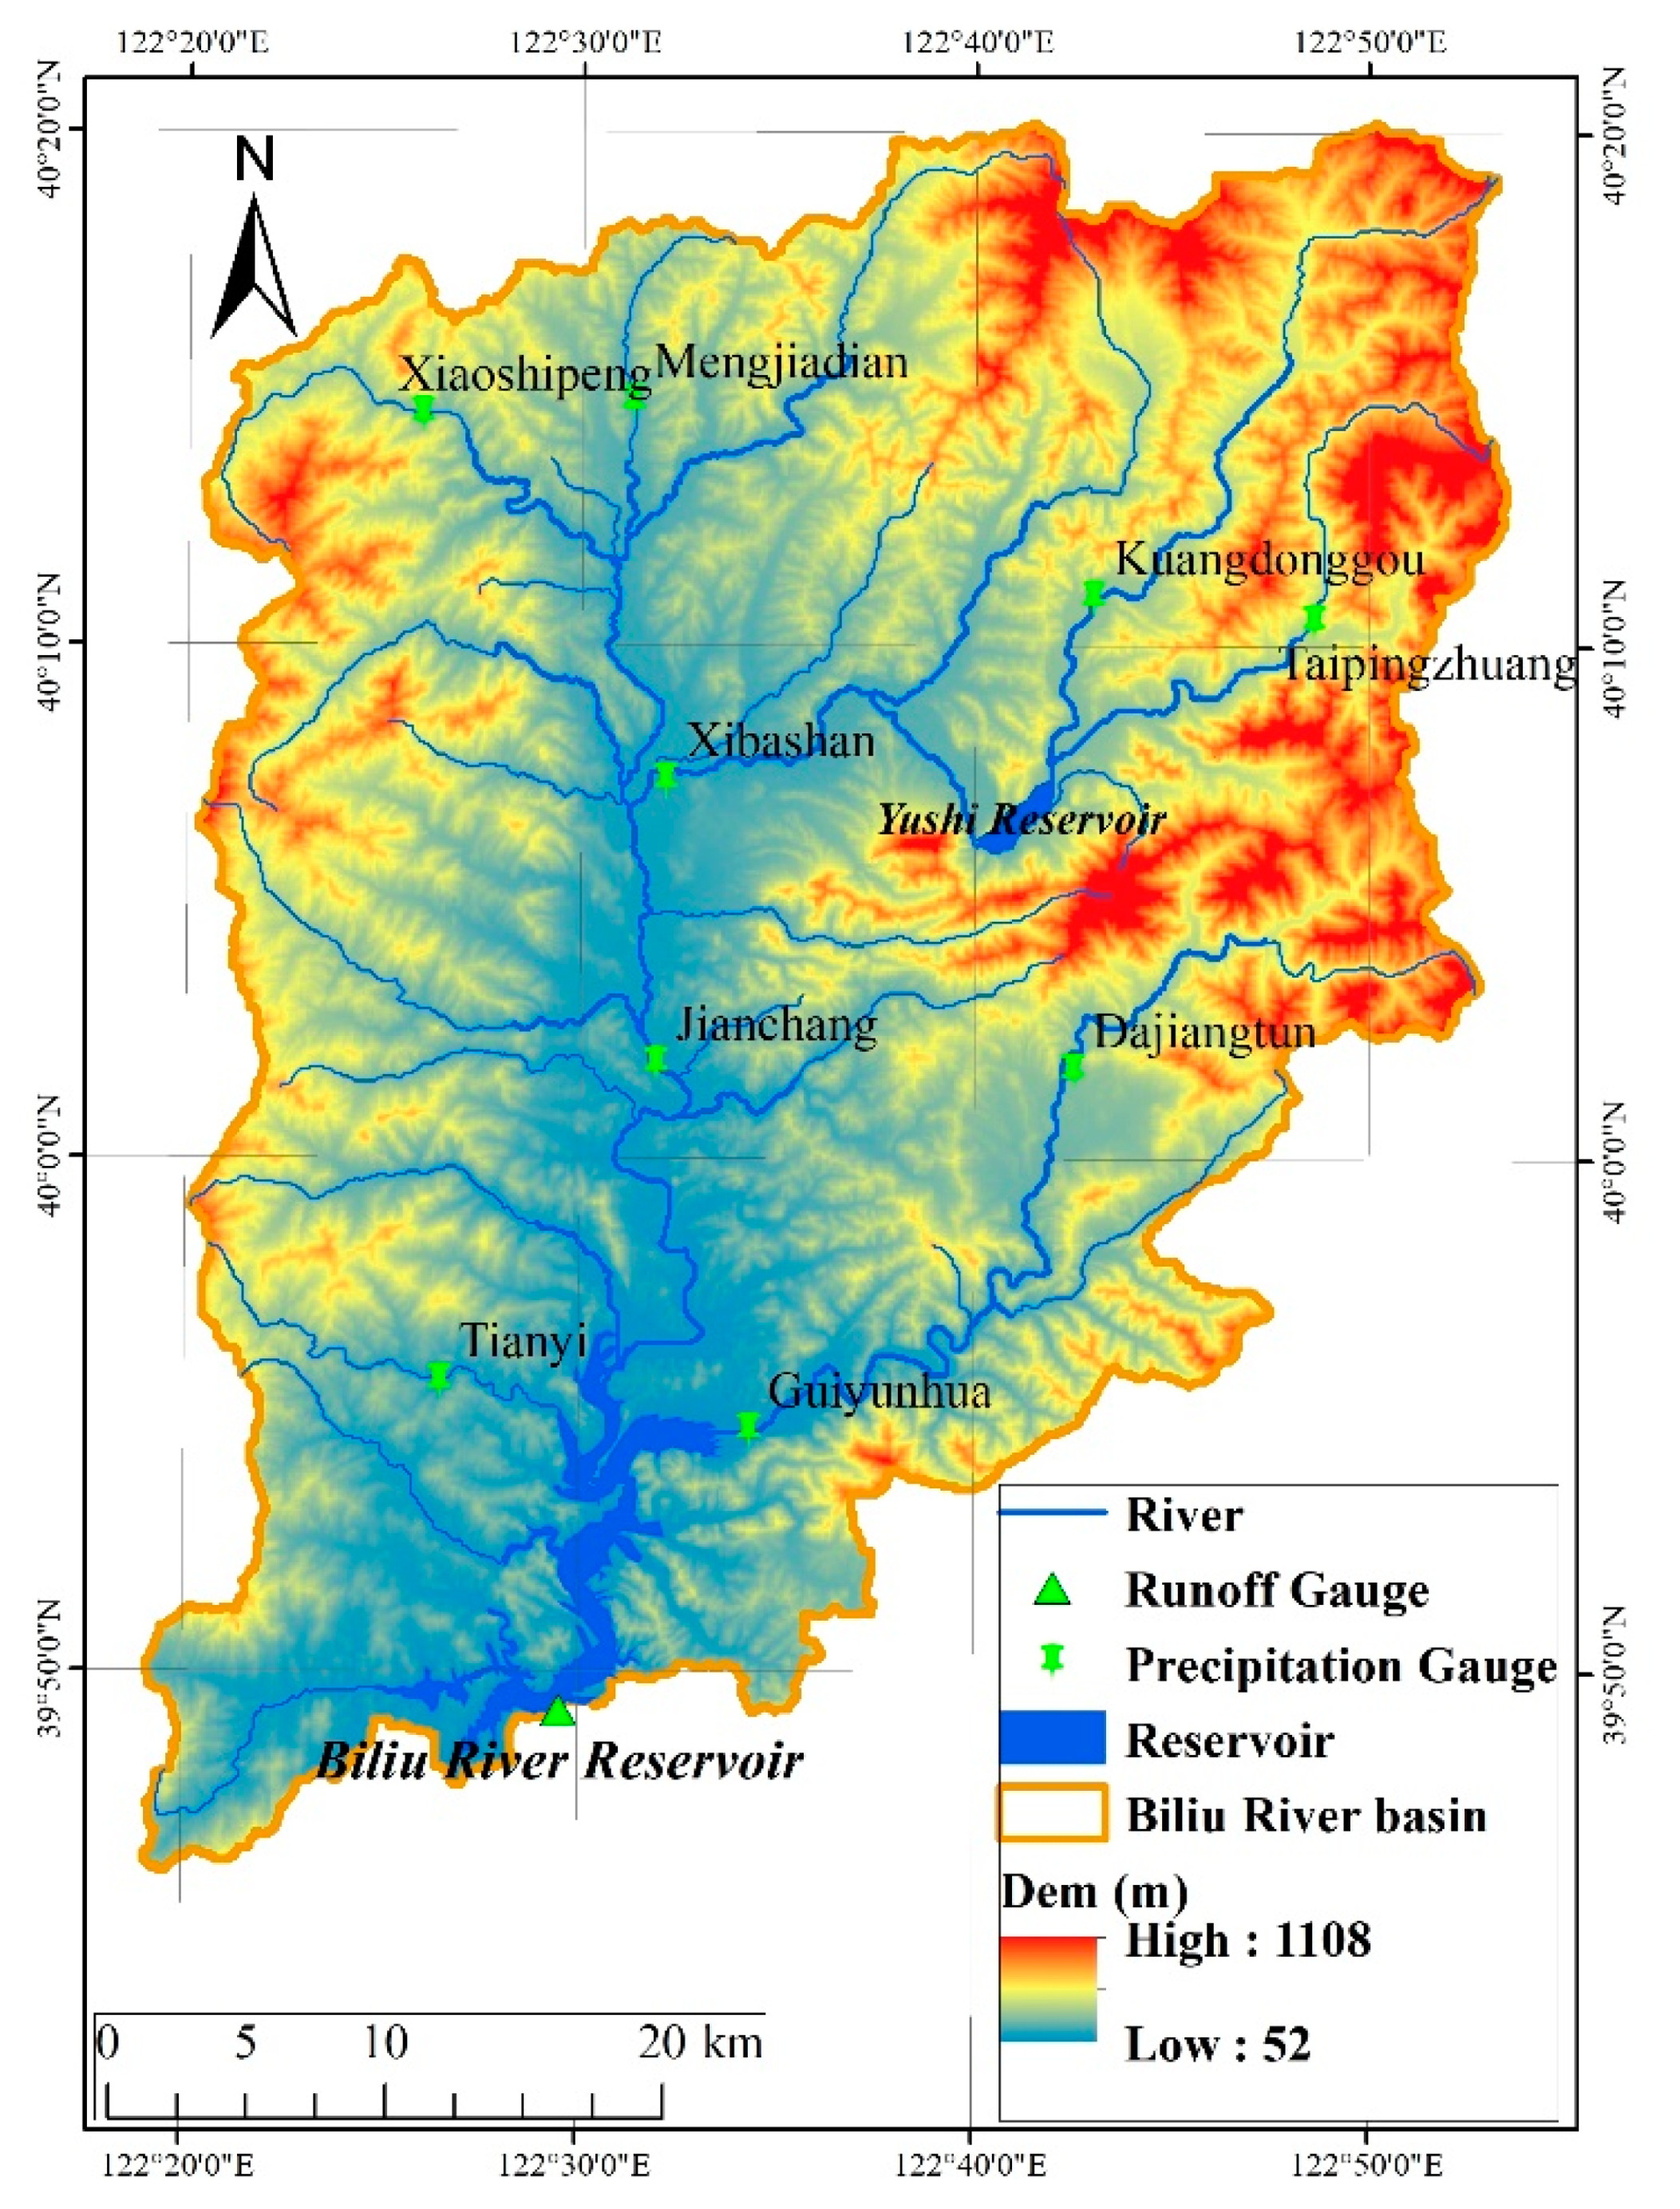
Section 3 describes the study area and the climate, hydrological, and spatial information data;
Section 4 analyzes the results of future climate conditions, future runoff, and the uncertainty impacts caused by different sources;
Section 5 presents discussions; and
Section 6 provides summaries with the results.
2. Methodology
In the author’s previous study [
30], the future climate change and runoff response based on both CMIP3 and CMIP5 data in the Biliu River basin were compared and analyzed on the basis of one statistical downscaling method, the Morphing method. This paper uses another statistical downscaling method, the Statistical DownScaling Model (SDSM) method, and four dynamic downscaling outputs of GCMs, including Regional Climate Models Version 4.0 (RegCM4.0) and three Coordinated Regional Climate Downscaling Experiment (CORDEX) datasets to analyze the variation of the future climate variables. The precipitation and temperature changes are analyzed in this article because they are the two main climate variables considered in previous studies on runoff simulation. Future runoffs are projected by driving the hydrological model SWAT using future climate data. Based on the projected future runoff, the contribution of the uncertainty impacts of climate change and downscaling methods on future runoff projections are evaluated.
2.1. Statistical Downscaling Methods
2.1.1. Morphing
Morphing [
31] mainly involves an operation of shift or stretch to the variables that need to be downscaled. A shift and a combined shift and stretch are applied to downscale the temperature and precipitation, respectively. Shift morphing is used to produce downscaled temperature by
T =
T0 + Δ
Tm on the basis of the present-day temperature
T0, where Δ
Tm represents the absolute changes of the monthly mean temperature in month
m between the future and historical periods from the GCM outputs. Combined shift and stretch morphing are applied to the present-day precipitation
P0 by
P =
P0 +
αm ×
P0, in which
αm is the proportion change of the monthly mean precipitation in month
m between the future and historical periods from the GCM outputs. As the specific downscaling method utilized to estimate the uncertainty impact caused by climate change in this article, Morphing is applied to the downscale outputs of six GCMs from CMIP5 (shown in
Table 1) under RCP4.5 and RCP8.5.
2.1.2. SDSM
SDSM can be used to establish the statistical relationship between local climate elements (predictand) and large-scale climate conditions (predictors) based on several years’ observation data. The established statistical relationship is calibrated and validated using independent observation data before it is used to downscale the large-scale climate information of the GCMs outputs.
The output of the CanESM2 model is downscaled by the SDSM here because it has been proven to be effective in predicting future climate conditions in China [
11,
32]. The data of the CanESM2 has been processed to be directly applied to the SDSM model by the Canadian Climate Scenario Center. The main procedures of using the SDSM are as follows:
- (1)
Establish empirical relationships. The Precipitation and the maximum and minimum temperatures are the chosen predictands in the four meteorological stations of the Biliu River. Partial correlation analysis is utilized to establish the empirical relationships between the three predictands and the NCEP gridded climate variables, which includes the mean sea level pressure, surface wind direction, 850 hPa specific humidity, and 23 other predictors, refer to Wilby et al. [
33].
- (2)
Selection of predictors. Select the appropriate downscaling predictor variables by the three supporting tasks for the Screen Variables operation: seasonal correlation analysis, partial correlation analysis, and scatterplots. Generally, variables with high correlation are selected.
- (3)
Calibration and Validation of the SDSM model. The Calibrate Model operation for the SDSM is used to calibrate the model. This model takes the specified predictands along with a set of predictor variables and computes the parameters of multiple regression equations via an optimisation algorithm [
33]. The steps mainly include: first, selecting the three predictions mentioned above; second, setting up the output parameter files and the period of calibration; third, inputting the predictor factors that were chosen in step (2); and finally, specifying whether the process is unconditional or conditional.
2.2. Dynamical Downscaled Datasets
Four dynamical downscaled datasets, including one RegCM4.0 and three CORDEX outputs, are used in this article. These datasets have higher resolution and are produced from GCM outputs by considering the lateral boundary conditions.
2.2.1. RegCM4.0 Dataset
On the basis of the RegCM4.0 climate data provided by the National Climate Center (Available online:
https://www.ncc-cma.net/cn/), the changes of the future temperature and precipitation were analyzed, and then the data were utilized to drive the SWAT model to project future runoff.
2.2.2. CORDEX Datasets
CORDEX datasets are the latest achievement of the WCRP (World Climate Research Programme), among which several global models can obtain high-precision climate model data under different dynamic downscaling models. According to the current data provided by CORDEX for different regions in the world, the study area belongs to East Asia (code EAS-44). The outputs of the two global models (ICHEC-EC-EARTH and MPI-M-MPI-ESM-LR) driven by two regional models (CCLM-5-0-2 and HIRHAM5) are selected to construct three analysis scenarios (shown in
Table 1). The climate datasets under RCP4.5 and RCP8.5 are obtained by three analysis scenarios.
For each of the four dynamical downscaled datasets, the accuracy of the simulated temperature and precipitation was verified according to the historical measured data. The deviation between the observed and simulated data during the historical period were used to correct the simulated results. Then, the corrected outputs were further utilized to project future runoff under the regional climate model.
2.3. Analysis Scenarios
In order to evaluate the changes and uncertainties of hydrological factors in the future period (2020–2065), 22 analysis scenarios are constructed in this article, involving two statistical downscaling methods, four dynamical downscaled datasets, eleven global climate models, and two representative concentration pathways. Details of the analysis scenarios are shown in
Table 1, and all the scenarios listed in the table are analyzed under RCP4.5 and RCP8.5, respectively.
2.4. Runoff Simulation
The latest version of Soil and Water Assessment Tool (SWAT 2012) [
13] is utilized to simulate runoff in this article. SWAT is a semi-distributed hydrological model and has been widely used in water cycle simulation and regional water resource assessment [
34,
35]. The accuracy of SWAT simulated runoff can be evaluated by the Nash-Sutcliffe model efficiency (E
NS), the average relative error (R
e), and the coefficient of determination (R
2). Their equations are shown as follows:
where
N is the total number of calculated periods;
Qot represents the observed flow of period
t;
Qst represents the simulated flow of period
t; and
Qoavg and
Qsavg represent the average values of
Qot and
Qst.
2.5. Runoff Uncertainty Analysis
Future downscaled climate outputs are used to drive SWAT to project future runoff. In this paper, the uncertainty variation range of future runoff under all considered scenarios is considered as the combined uncertainty impact caused by climate change and the downscaling methods. Meanwhile, the uncertainty variation range of future runoff under the scenarios using the Morphing method is regarded as the uncertainty impact caused by climate change. Then, the difference between the two variation ranges is regarded as the uncertainty impact caused by the downscaling methods. As a result, the contribution of the uncertainty impacts of climate change scenarios and downscaling methods on future runoff projection can be separated.
The framework of the methodology is shown in
Figure 1.
4. Results
4.1. Calibration and Validation of the Hydrological Model
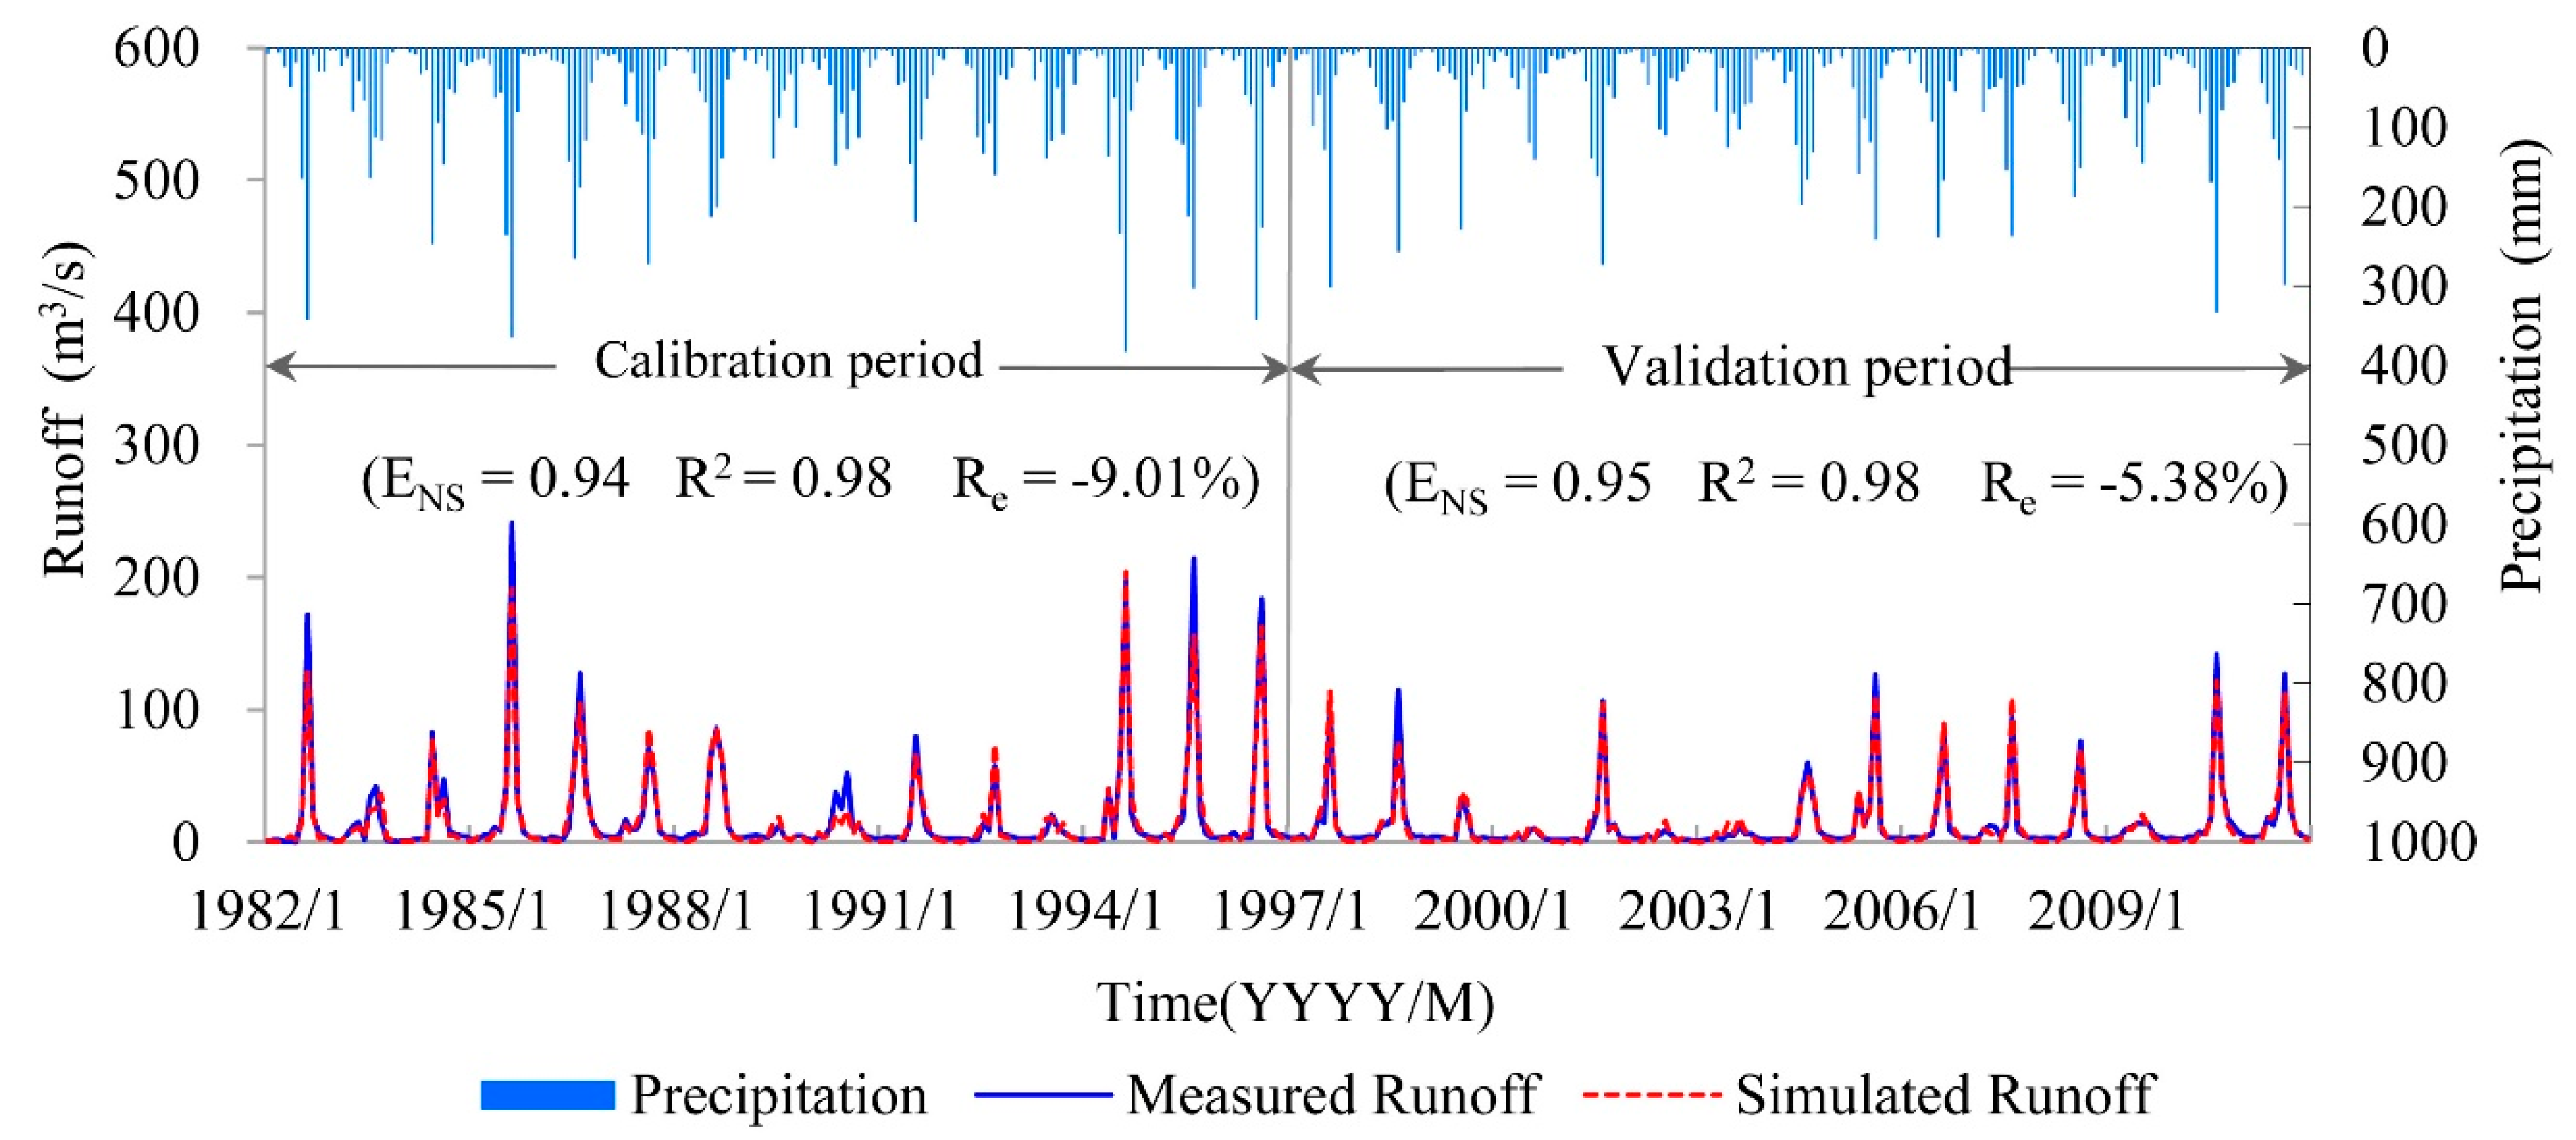
The hydrological model, SWAT, is constructed based on daily historical meteorological data and the spatial data of the study area. The hydrological model needs to be calibrated and validated before being used to project future runoff. According to the changing trends of precipitation and runoff in the study area, the calibration period (1982–1996) and the validation period (1997–2011) are divided. The simulated results of the SWAT model were evaluated according to the observed runoff. More details of the simulation processes are available in Zhu et al. [
30]. As the model software was updated and data from 2005 to 2011 were extended, the simulation results during the calibration and validation periods were slightly improved compared to Zhu et al. [
30]. Moreover, the three performance metrics, E
NS, R
e and R
2, during the calibration and validation periods are shown in
Figure 3.
4.2. Future Climate Change
4.2.1. Future Temperatures
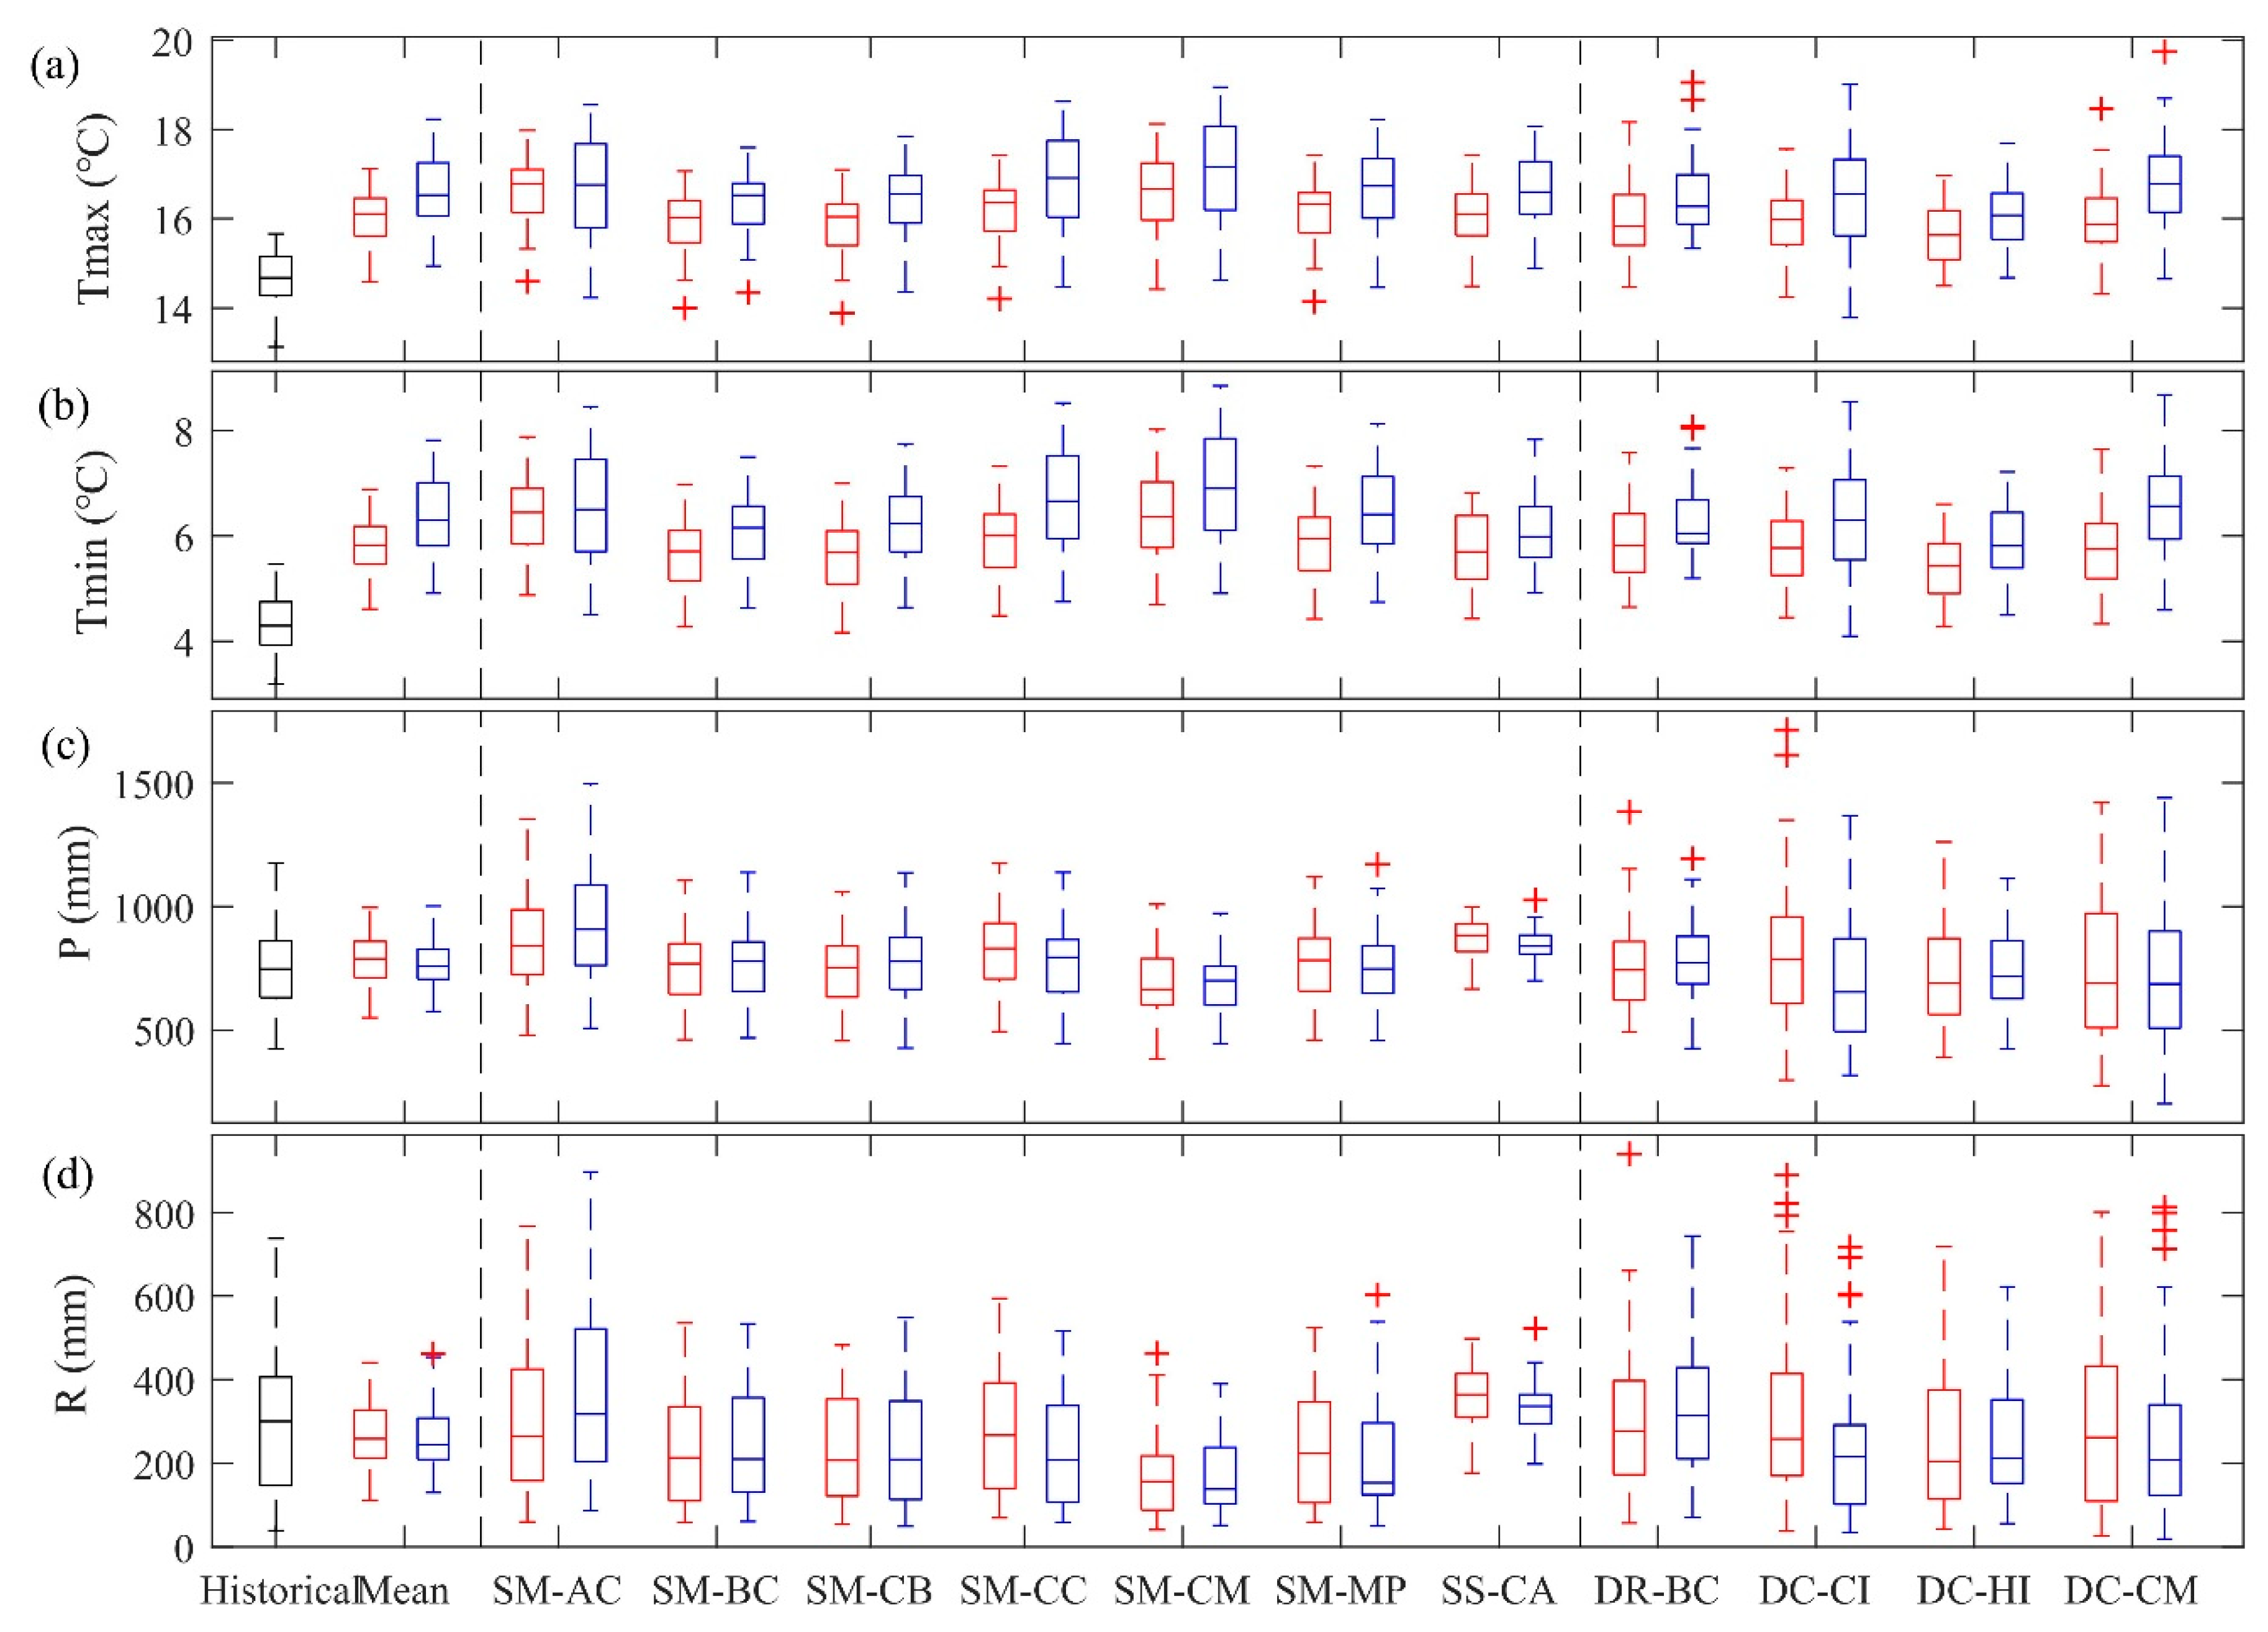
The maximum and minimum temperature of the 22 scenarios are compared with the historical temperatures. The interannual variation ranges are compared in
Figure 4a,b. The future maximum and minimum temperatures increase without exception.
As shown in
Figure 4a,b, not only is the average of the future projected temperature higher than the historical temperature, but also the interannual variation range of the future temperature is larger than historical temperature. In addition, the interannual variation range for RCP8.5 is larger than that of RCP4.5. This indicates that the uncertainty changes of the future temperature will be more significant than the historical temperatures, and would be more significant for RCP8.5 than RCP4.5.
For the 12 scenarios using Morphing, the maximum and minimum temperatures increase 1.20~2.00 °C and 1.27~2.08 °C, respectively, under RCP4.5, and increase 1.68~2.54 °C and 1.76~2.62 °C, respectively, under RCP8.5. For the two scenarios using SDSM, the maximum and minimum temperatures increase 1.45 and 1.42 °C, respectively, under RCP4.5, and increase 1.93 and 1.74 °C, respectively, under RCP8.5. For the two scenarios using RegCM4.0 outputs, the maximum and minimum temperatures increase 1.31 and 1.57 °C, respectively, under RCP4.5, and increase 1.84 and 1.98 °C, respectively, under RCP8.5. For the six scenarios using the CORDEX datasets, the maximum and minimum temperatures increase 0.98~1.26 °C and 1.06~1.43 °C, respectively, under RCP4.5, and increase 1.47~2.17 °C and 1.53~2.25 °C, respectively, under RCP8.5.
The average maximum and minimum temperatures increase more under RCP8.5 than RCP4.5 in all scenarios, which indicates that the temperature variations have a significant relationship with emission scenarios. In addition, the increase in the minimum temperature was slightly higher than that of the maximum temperature in all scenarios, except for the SS-CA, which used SDSM.
4.2.2. Future Precipitation
The future precipitation outputs of the 22 scenarios are compared with historical annual precipitation. As shown in
Figure 4c, the interannual variation range of the future precipitation is probably similar to or larger than the historical range, except for the two scenarios under SS-CA, which implies a rather small variation range. The variation ranges are also similar for RCP8.5 and RCP4.5. The variation range of future precipitation is apparently larger under dynamical downscaling scenarios than under statistical downscaling scenarios. Dynamical downscaling methods were better than statistical downscaling methods when describing the uncertainty of future precipitation since the uncertainty variation range of future precipitation used dynamical downscaling methods is larger than that used statistical downscaling methods. Furthermore, the variation range would be much reduced under the mean condition, which weighted the projected precipitation under all the scenarios by equal weight. This indicates that the uncertain changes in future precipitation will be underestimated when weighting the results of various scenarios.
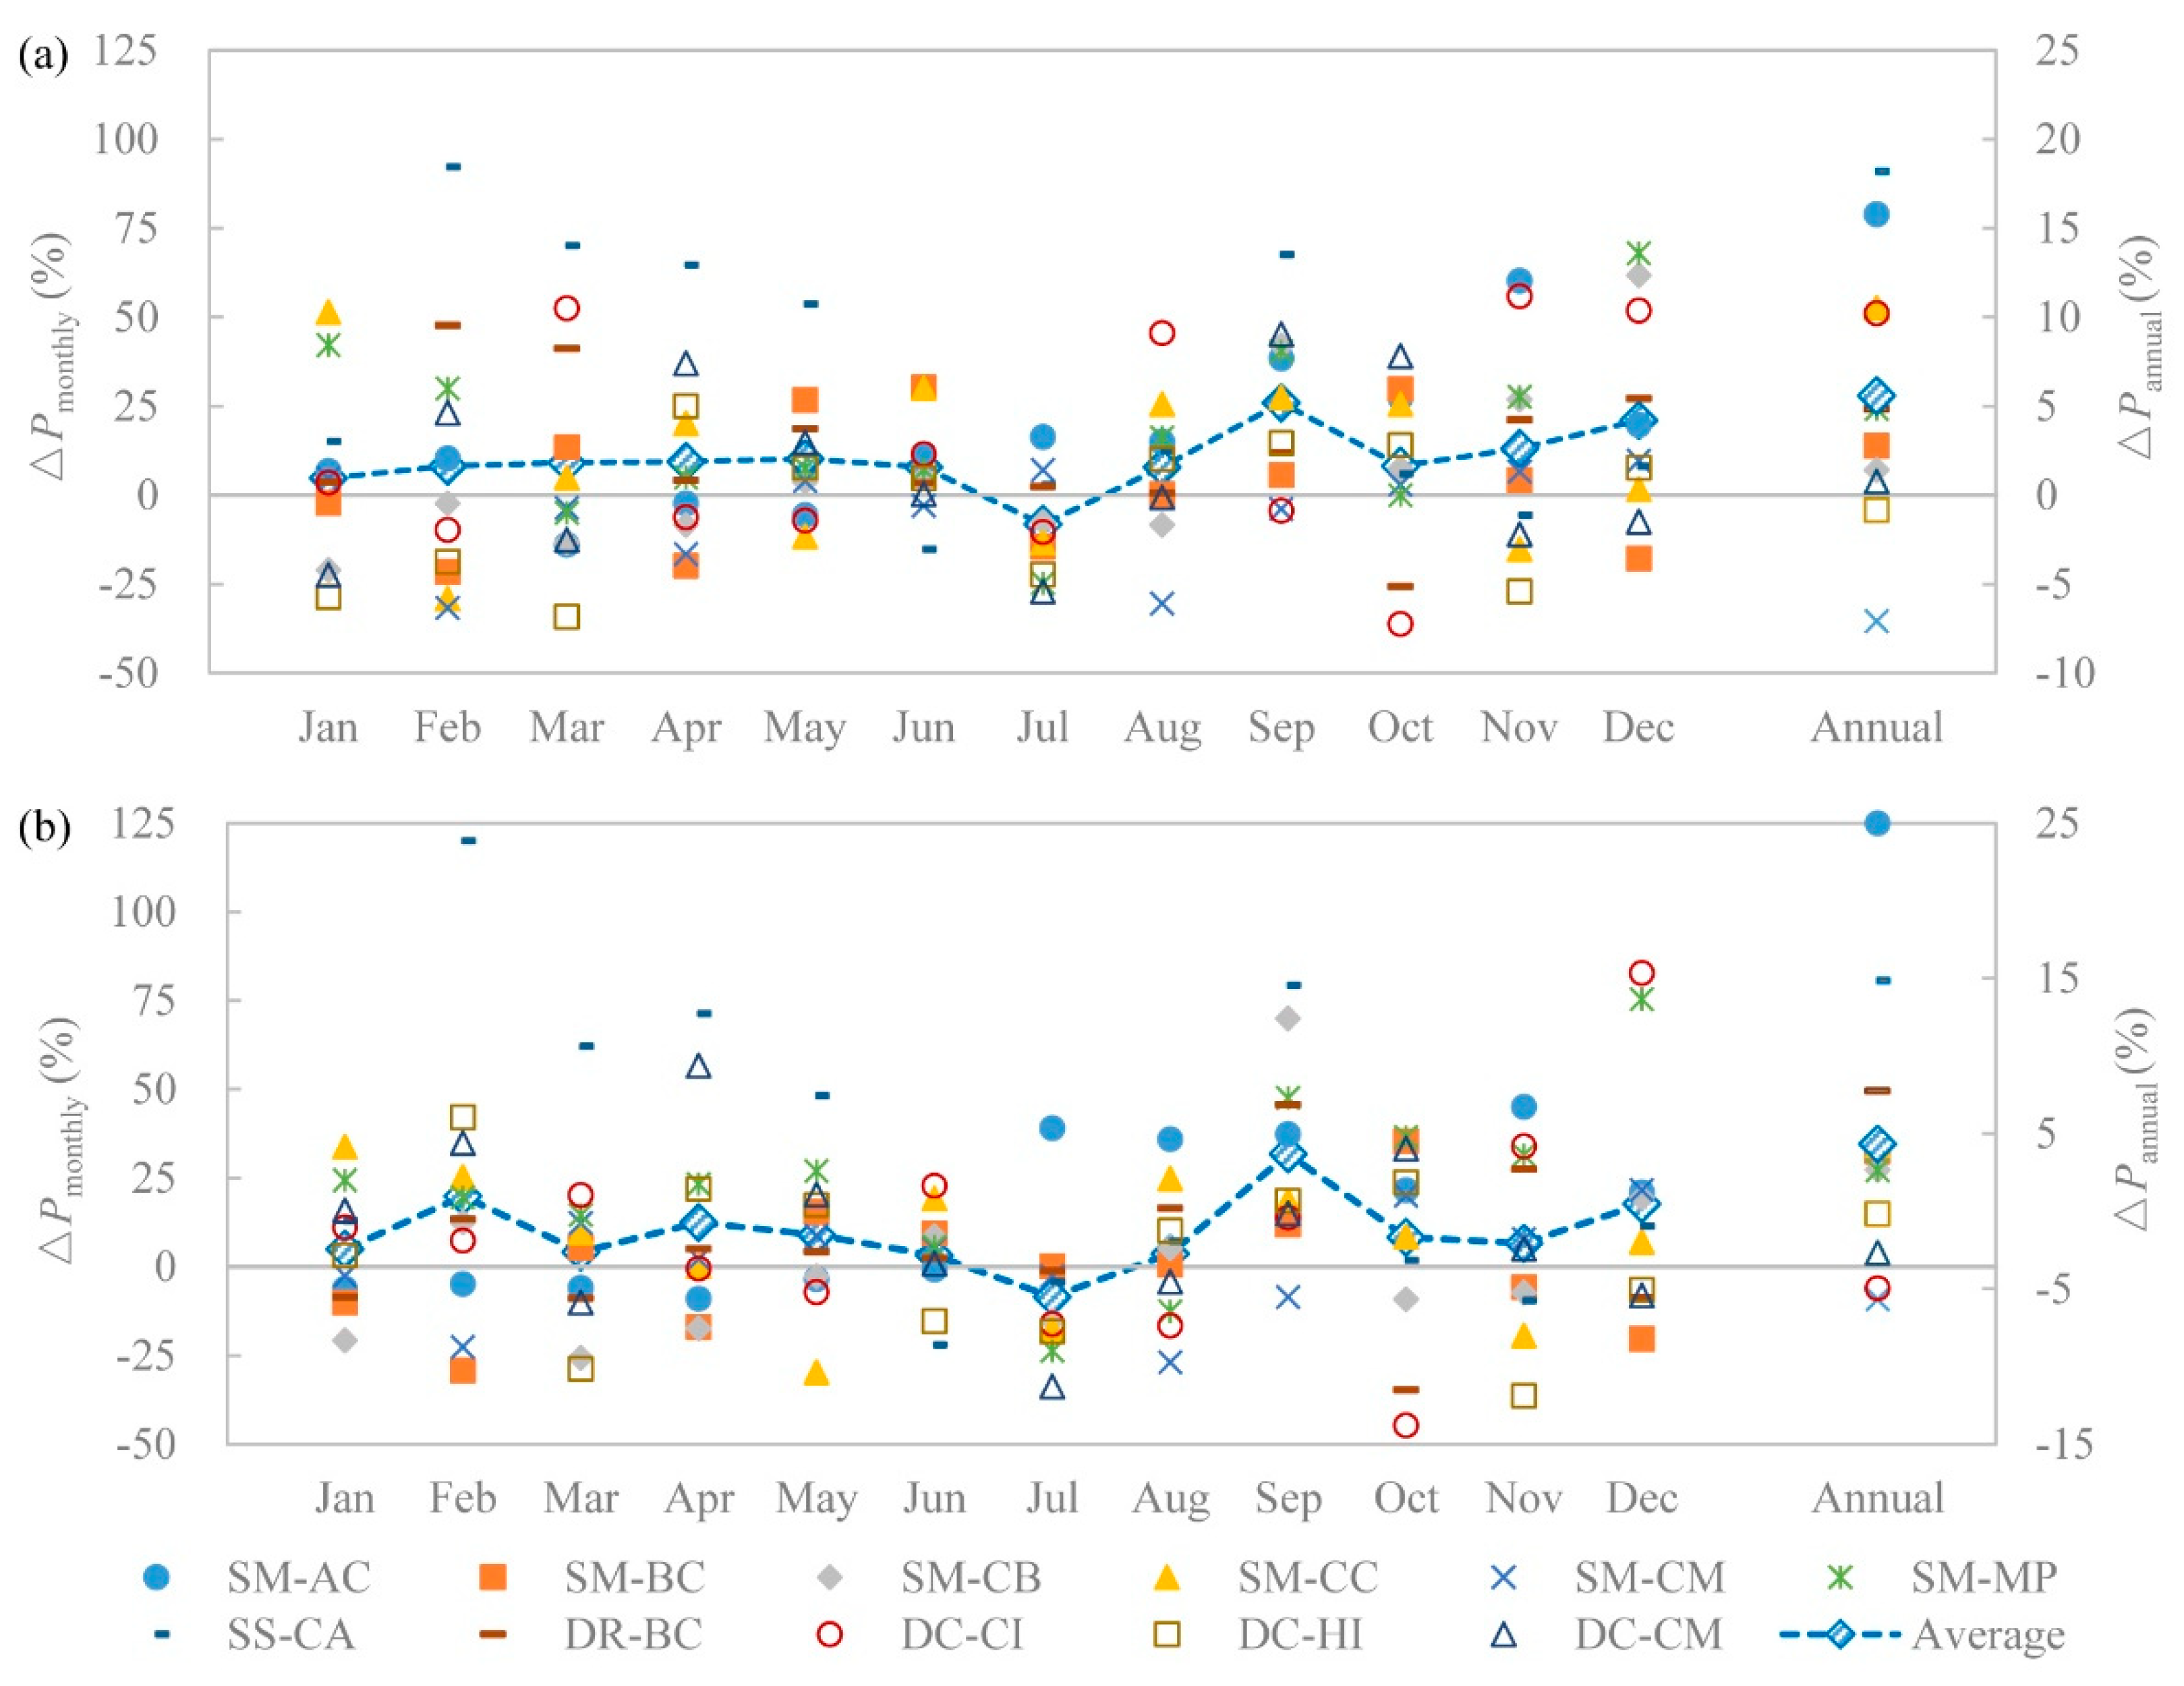
Projected changes in the monthly and annual precipitation from the 22 scenarios with respect to the historical precipitation are shown in
Figure 5. The projected changes in monthly precipitation under different scenarios are significantly different. The maximum change ratios are 92.24% (RCP4.5) and 120.09% (RCP8.5) (both occurred in February under SS-CA), and the minimum ones are −36.11% (RCP4.5) and −44.62% (RCP8.5) (both occurred in October under DC-CI). The projected precipitation increases under more scenarios than it decreases in most of the months, except for February, March and July under RCP4.5 and July under RCP8.5. In addition, the absolute values of the increase ratios are larger than the decrease ratios. The only month in which precipitation decreases under an average condition is July for both RCPs. The variation of the projected precipitation is different under different RCPs. The absolute differences of the monthly change ratios between RCP4.5 and RCP8.5 under the same scenario vary from 0.04% to 62.14%, which indicates that the precipitation variation has little relation with emission scenarios.
For the twelve scenarios using the statistical downscaling method of Morphing, the decrease in precipitation only shows in SM-CM, where it decreases by 7.09% (RCP4.5) and 5.65% (RCP8.5). The precipitation increases under all the other scenarios, and the maximum increase appears in SM-AC, while the other scenarios show slight increases. For the two scenarios under SS-CA using the statistical downscaling method SDSM, the future precipitation increases 18.19% (RCP4.5) and 14.85% (RCP8.5). For the two scenarios under DR-BC using RegCM4.0 outputs, the future precipitation slightly increases 4.85% (RCP4.5) and 7.78% (RCP8.5). For the six scenarios using CORDEX datasets, among DC-IC, DC-IH, and DC-MC, future precipitation increases 10.22% and 0.77% for RCP4.5 under DC-IC and DC-MC, respectively, and decreases under the other four scenarios.
Above all, for RCP4.5, the annual future precipitation decreases under two scenarios and increases under nine scenarios. For RCP8.5, future precipitation decreases under four scenarios and increases under seven scenarios. The decrease in precipitation mainly shows in CORDEX datasets.
4.3. Future Runoff Projection
Based on the calibrated SWAT model, future precipitation and temperature data from each scenario under different climate changes and downscaling methods are used as inputs to simulate the water cycle. Future runoff for the 22 scenarios is compared with the historical annual runoff in
Figure 4d. The interannual variation range of the future runoff is not smaller than that of the historical period, except for the four scenarios under SM-CM and SS-CA. The variation ranges are similar for RCP8.5 and RCP4.5, although the median values differ from each other. The variation range of the future runoff is much reduced under the mean condition, which weights the projected runoff under all the scenarios by equal weight.
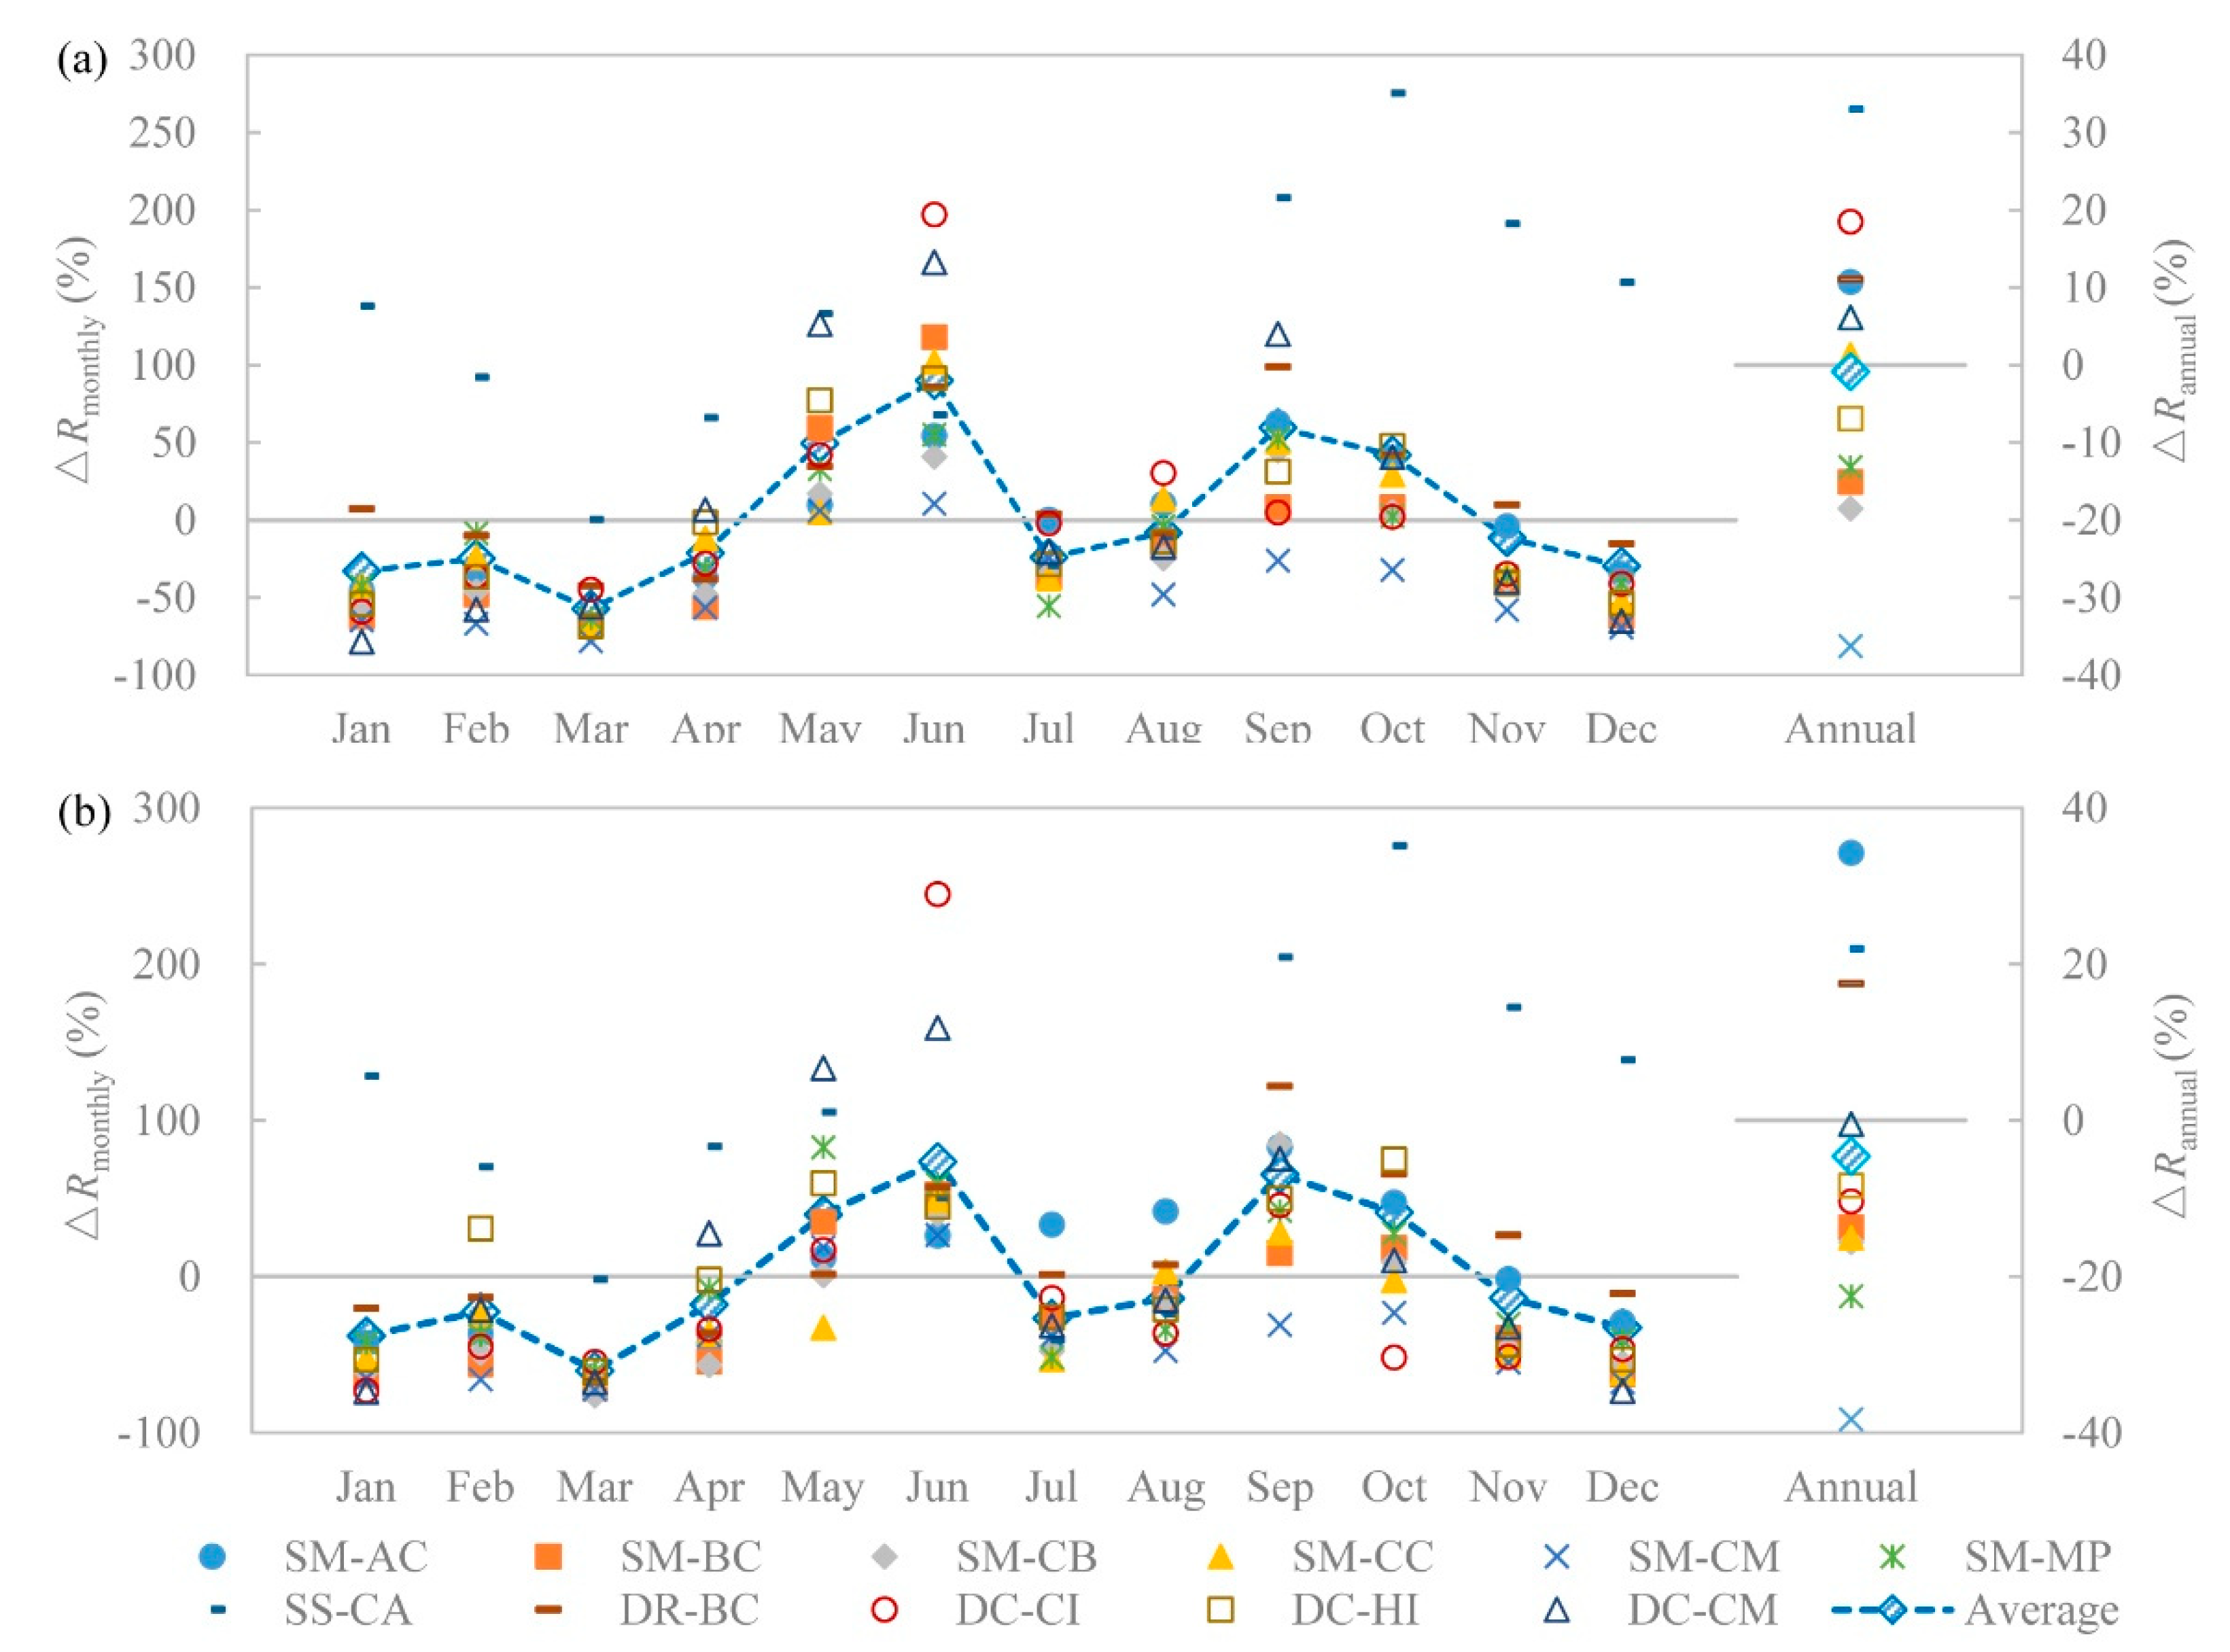
Projected changes in the monthly and annual runoff from the 22 scenarios with respect to historical runoff are shown in
Figure 6. Projected changes in monthly runoff under different scenarios are significantly different. The maximum change ratios are 275.51% (RCP4.5) and 275.92% (RCP8.5) (both occurred in October under the SS-CA) and the minimum ones are −78.30% (RCP4.5) and −75.98% (RCP8.5) (which occurred in January under DC-DM and in March under SM-CB). For both RCP4.5 and RCP8.5, the projected monthly runoff increases for May, June, September, and October and decreases for the other months under almost all the considered scenarios. The absolute values of the increase ratios under some scenarios (especially SS-CA) are larger than the decrease ratios. The variation of the projected runoff is different under different RCPs. The absolute differences of the monthly change ratios between the RCP4.5 and RCP8.5 under the same scenario vary from 0.10% to 67.55%, which is similar to the results of precipitation.
Annual runoff decreases under 13 scenarios (five scenarios for RCP4.5 and eight scenarios for RCP8.5). For the twelve scenarios using Morphing, runoff decreases under nine scenarios and increases under three scenarios. Runoff increases only 10.52% (RCP4.5) and 33.98% (RCP8.5) under SM-AC and increases 1.11% (RCP4.5) under SM-CC. The maximum decrease appears under SM-CM (−36.36% (RCP4.5) and −38.38% (RCP8.5)). SM-CM is the only scenario with a maximum precipitation decrease and temperature increase. This indicates that the decrease of precipitation and the increase in temperature leads to a decrease in runoff. For the two scenarios using SDSM, future runoff under SS-CA increases 32.60% (RCP4.5) and 21.60% (RCP8.5). For the two scenarios using RegCM4.0 outputs, future runoff under DR-BC increases 10.78% (RCP4.5) and 17.17% (RCP8.5). For the six scenarios using CORDEX datasets, future runoff decreases under most of the scenarios. All the decrease ratios using CORDEX datasets are less than 11%.
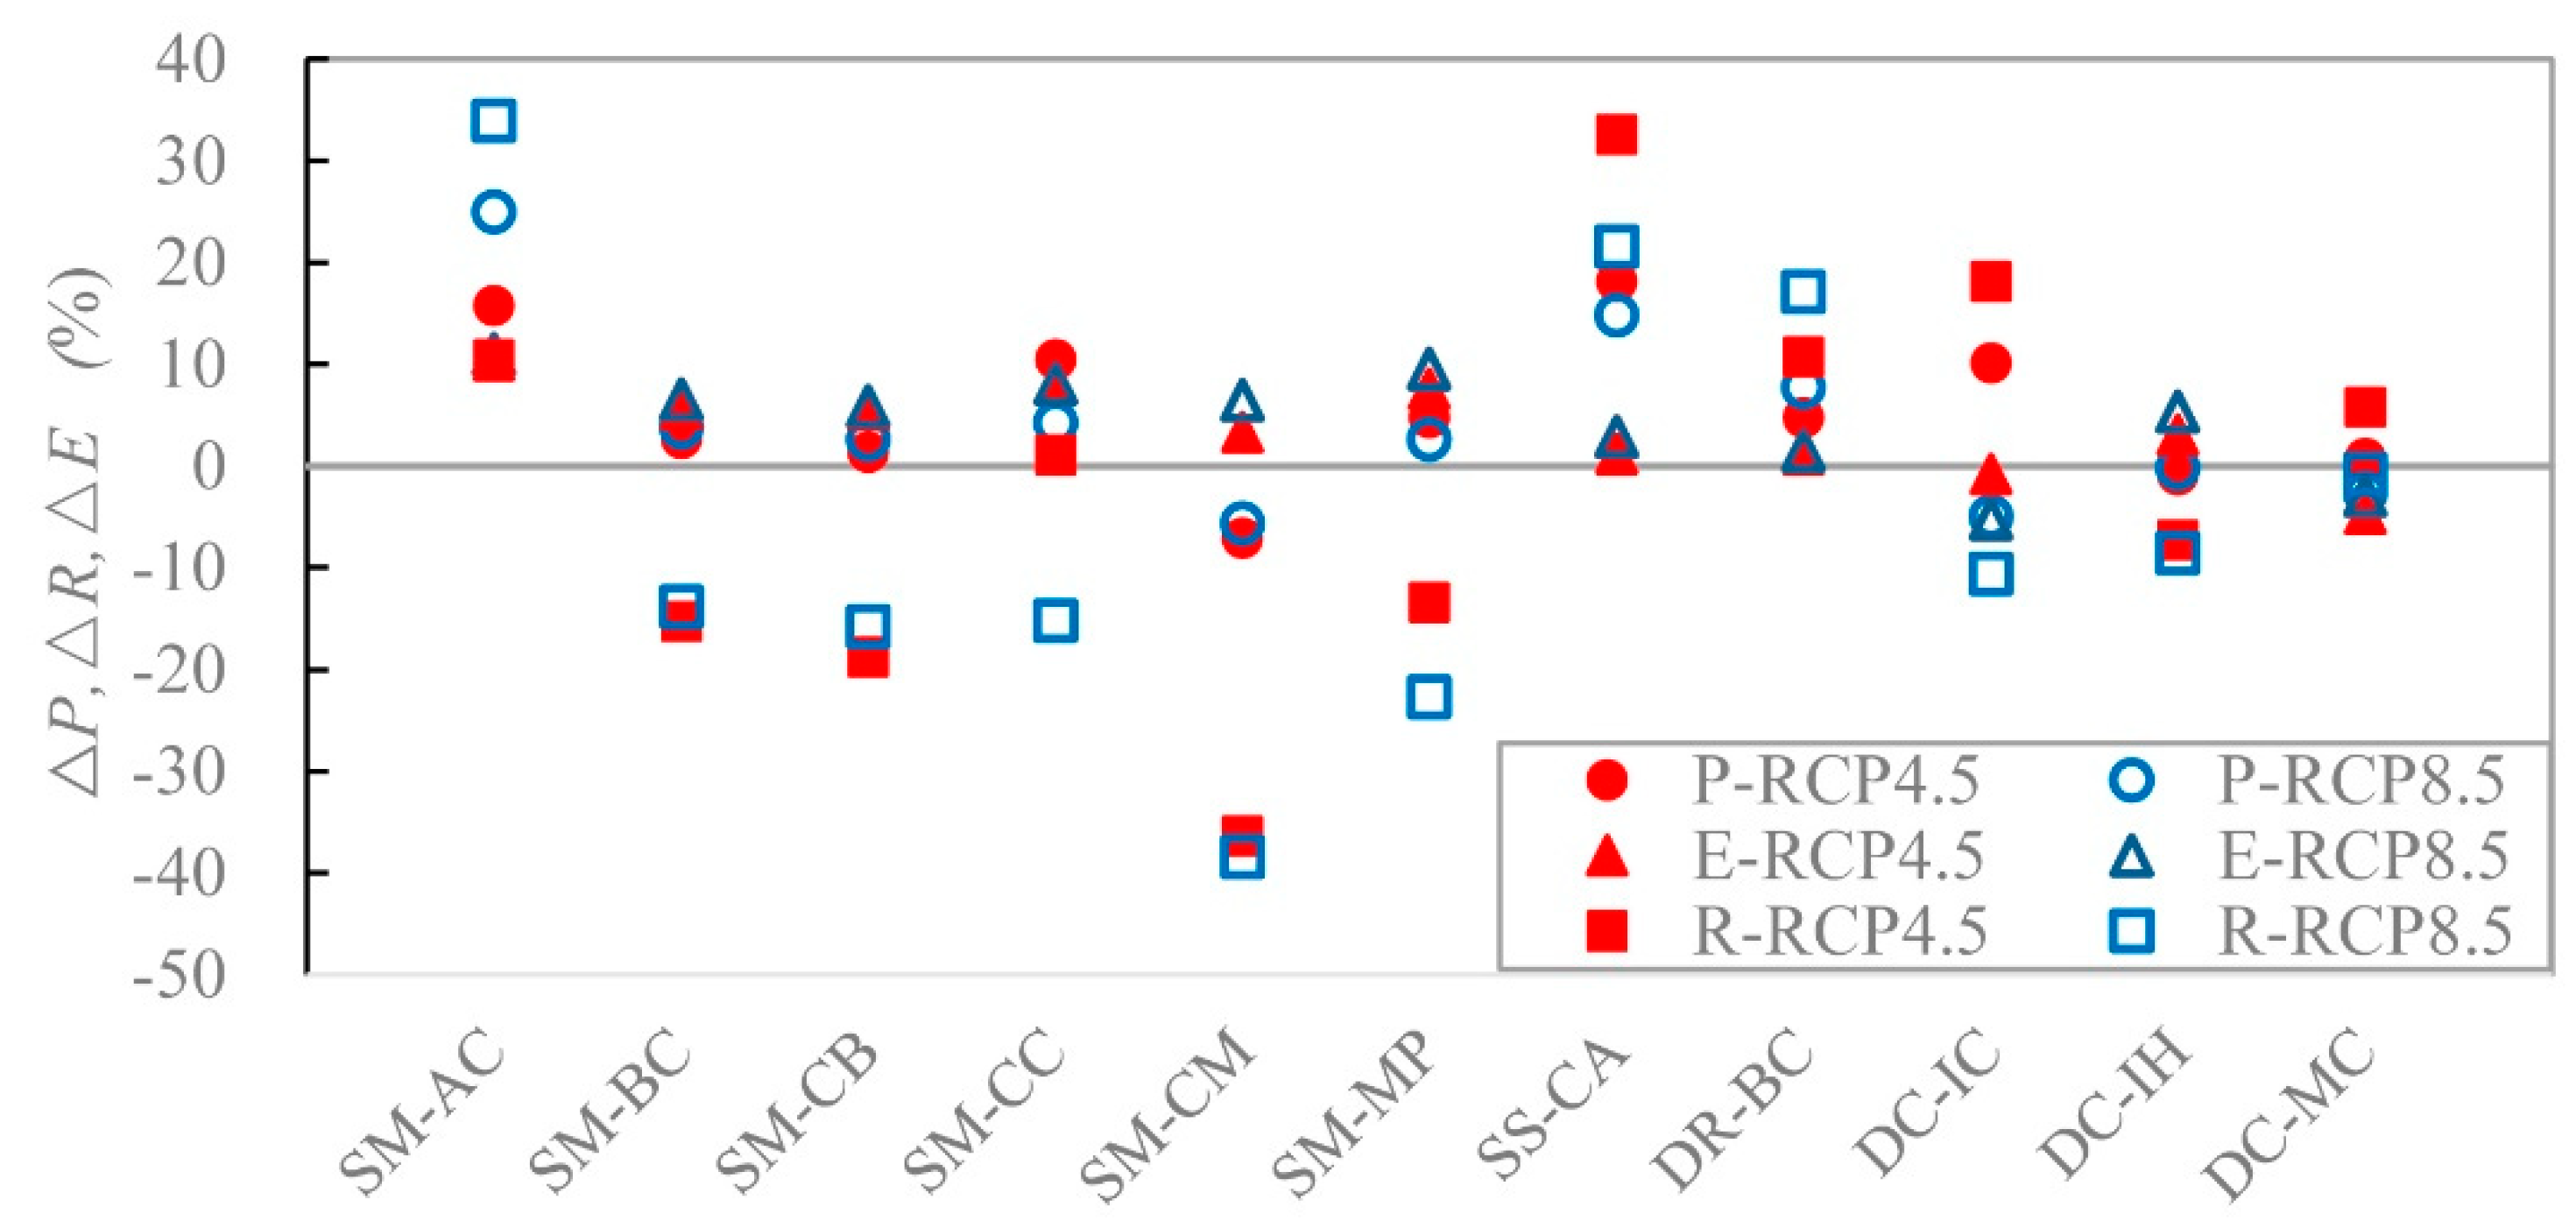
The comparison of the projected changes in average annual precipitation, evaporation, and runoff is further presented in
Figure 7. Recall that the future maximum and minimum temperatures increase under all the considered analysis scenarios, which results in a future evaporation increase under 18 scenarios and a slight decrease under four CORDEX datasets (i.e., DC-IC and DC-MC for both RCP4.5 and RCP8.5). For the 18 evaporation increase scenarios, future runoff increases when the increase proportion of precipitation is larger than that of evaporation (seven scenarios including SM-AC, SS-CA and DR-BC for both RCPs and SM-CC for RCP4.5). Otherwise, future runoff decreases when the increase proportion of precipitation is smaller than that of the evaporation (seven scenarios including SM-BC, SM-CB, and SM-MP for both RCPs and SM-CC for RCP8.5) or the precipitation decrease (four scenarios including SM-CM and DC-IH for both RCPs). For the four evaporation decrease scenarios, future runoff increases when the precipitation increases (two scenarios, DC-IC and DC-MC, for RCP4.5) and future runoff decrease when the precipitation decreases (two scenarios, DC-IC and DC-MC, for RCP8.5). Meanwhile, because the increase in temperature under RCP8.5 is higher than RCP4.5, future evaporation is larger for RCP8.5 than for RCP4.5, which leads to smaller future runoff for RCP8.5 than RCP4.5.
In sum, the results of the 22 scenarios show that future runoff decreases under five scenarios and increases under six scenarios for RCP4.5 and decreases under eight scenarios and increases under the three scenarios for RCP8.5. The annual mean runoff change ranges from −38.38% to 33.98%. The future temperature increases under all scenarios, which makes the future evaporation increase under 18 out of 22 scenarios. Six scenarios with decreased precipitation show decreased runoff, no matter whether evaporation increases or decreases. Eight scenarios with increased precipitation (more than 4.5%) show increased runoff, whereas the other eight scenarios with increased precipitation (less than 4.5%) show decreased runoff (except DC-MC for RCP4.5). Therefore, the runoff could decrease if future precipitation increases less than 4.5% or decreases.
4.4. Uncertainty Impacts of Climate Change and Downscaling Methods
The runoff uncertainty results from the comprehensive impacts of climate change and downscaling methods. In order to separate their contribution, the uncertainty variation range of future runoff based on the scenarios using Morphing is assumed to be caused by climate change. The uncertainty caused by climate change is removed from the comprehensive impacts to obtain the impact of the downscaling methods. Therefore, the contributions of the two uncertainty impacts are separated.
4.4.1. Uncertainty of Future Runoff
The box plots of future annual runoff under different downscaling methods are shown in
Figure 8. Although the two statistical downscaling methods are simpler than the dynamical downscaling methods, they do not cause larger annual fluctuation of runoff. Among most of the selected scenarios, the range of the projected runoff under Morphing is similar to that under the two dynamical downscaling methods, but the mean runoff of the latter is higher than that of the former. The variation range of the simulated runoff under the SDSM is the smallest, which is also much smaller than that of the historical period. This indicates that SDSM may reduce the interannual difference of precipitation, which results in a small difference in the annual runoff. This is probably due to the fact that we only use CanESM under SDSM in this study.
The impact differences of the downscaling methods on runoff are not obvious. For the two statistical downscaling methods, the mean annual runoff under Morphing is smaller than that of the historical values for RCP4.5 and RCP8.5, while the runoff under SDSM increases for both RCPs. For the two dynamical downscaling methods, the mean annual runoff under RegCM4.0 increases for both RCPs, while runoff under CORDEX increases in RCP4.5 and decreases in RCP8.5.
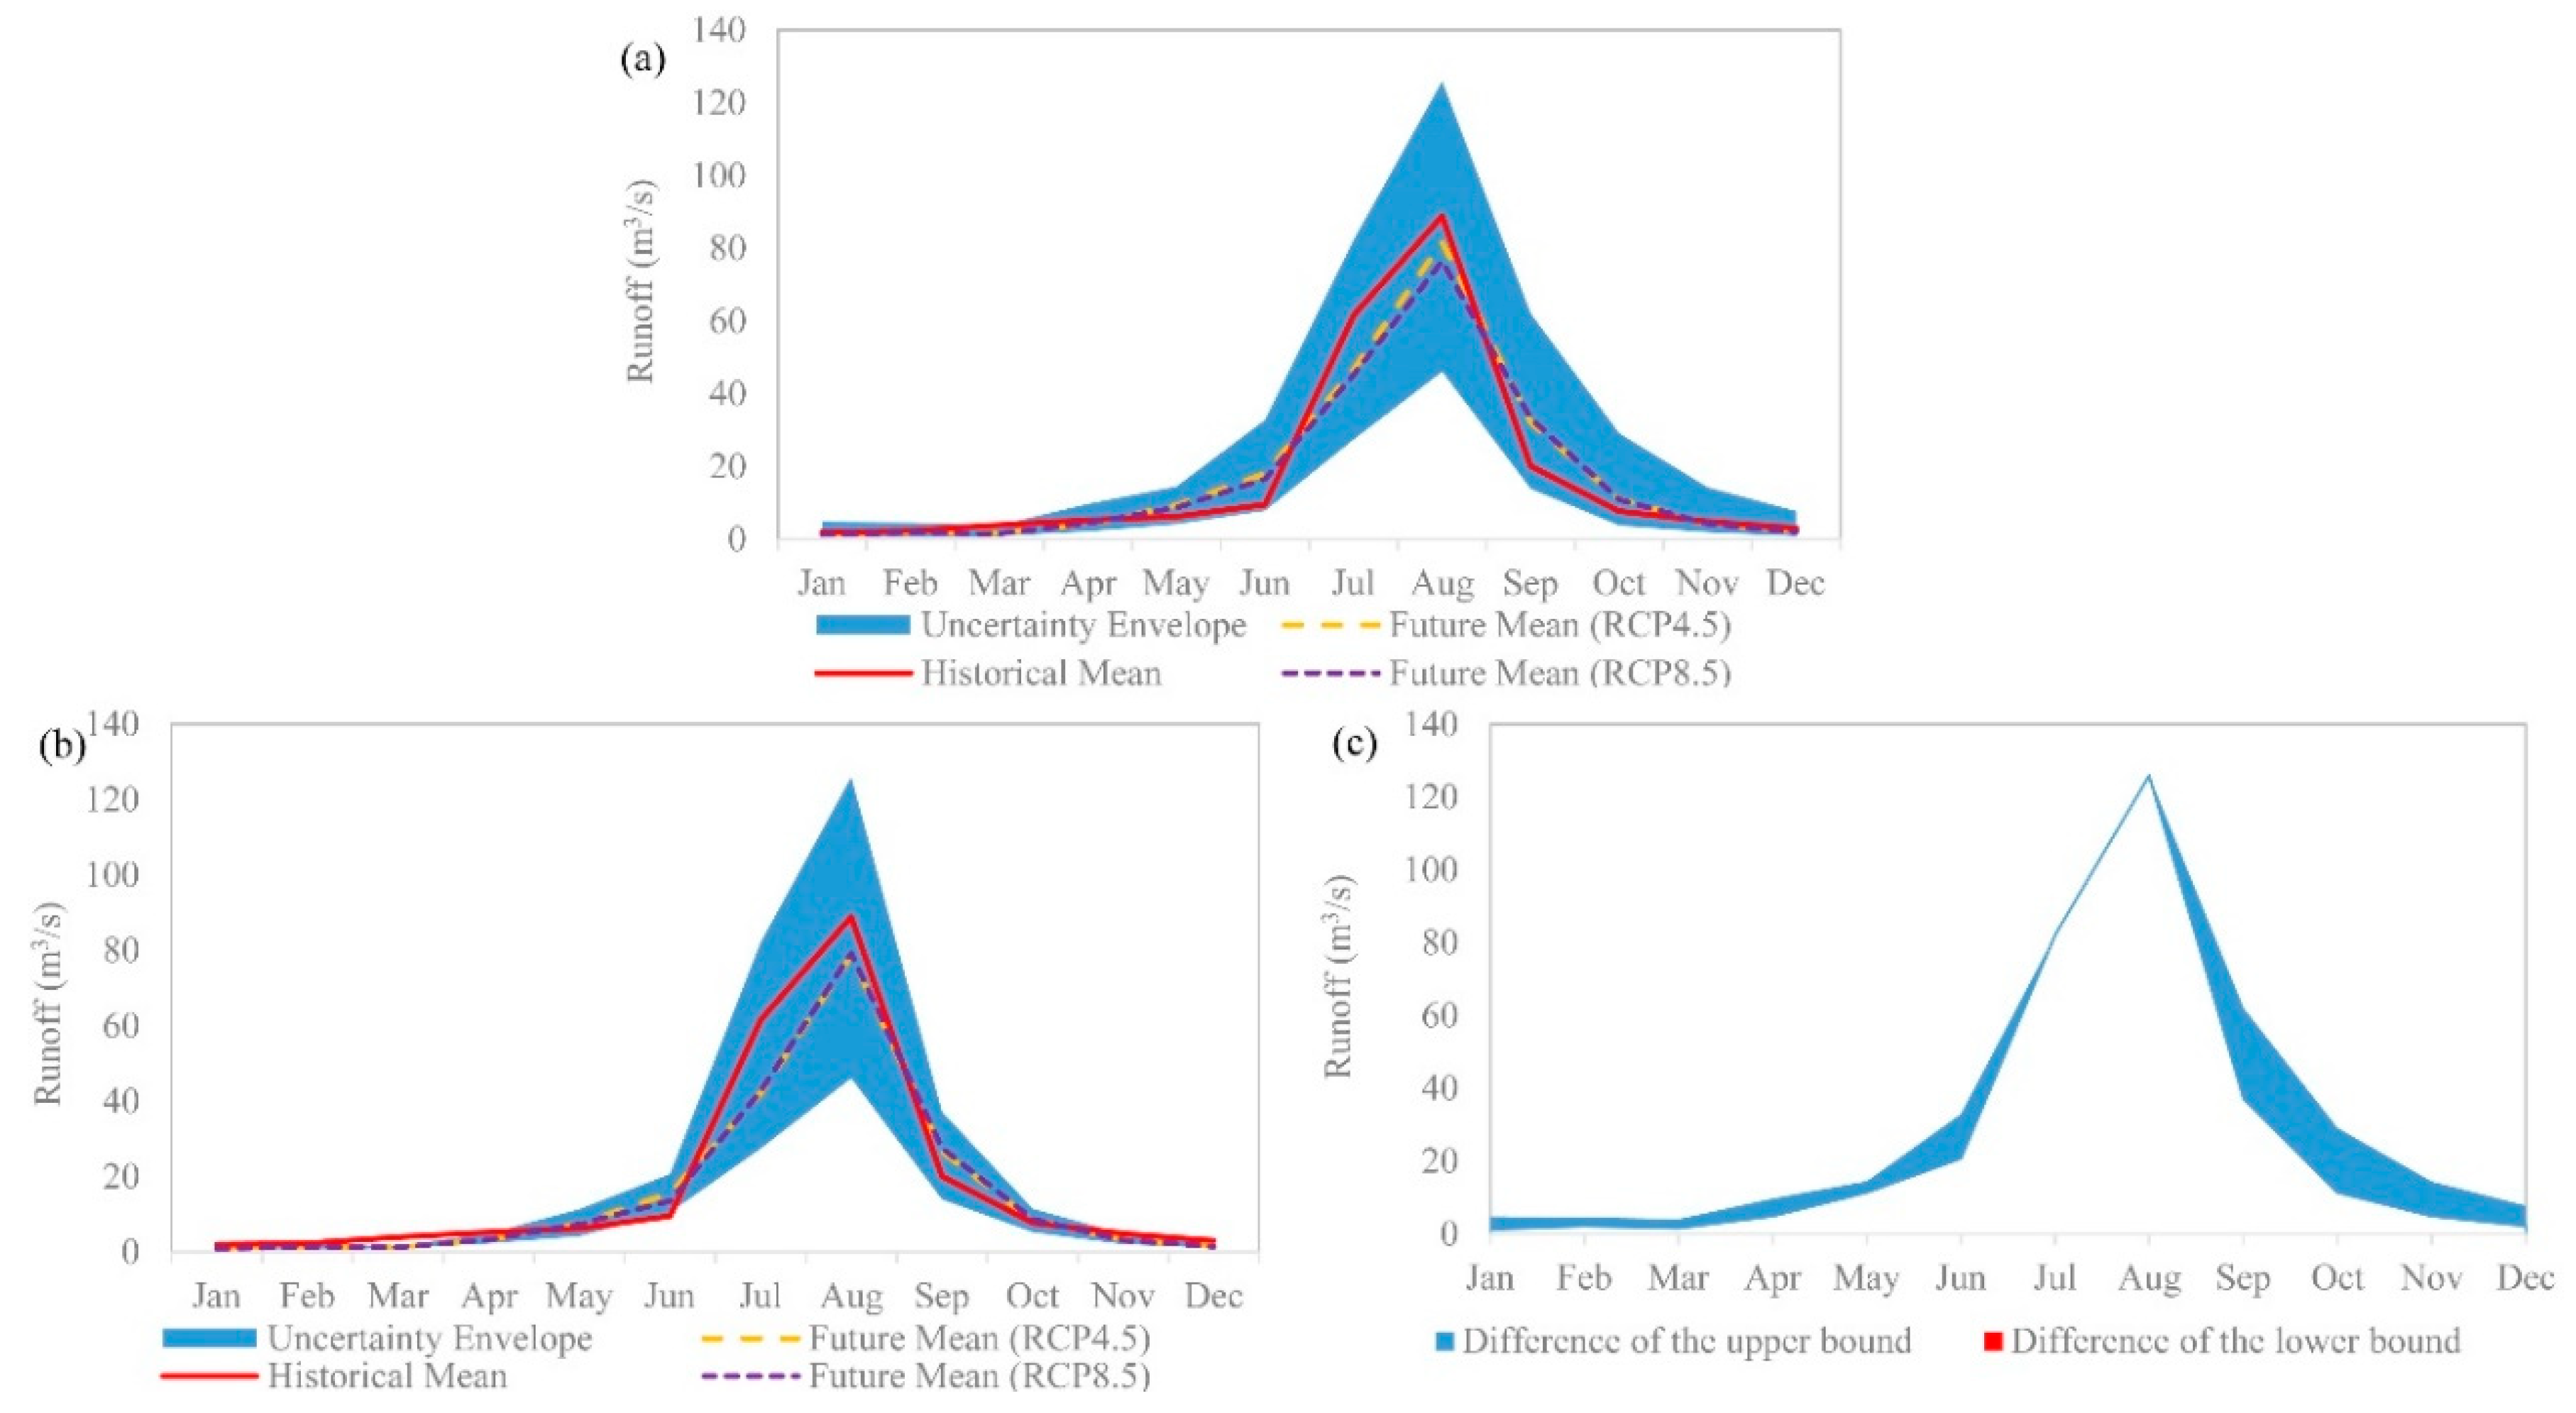
The uncertainty of runoff was evaluated by the variation range between the minimum and maximum runoff results. The uncertainty variation ranges of the future projected monthly runoff under the combined impact of climate change and downscaling methods is shown in
Figure 9a, in which the vertical axis represents the absolute value of historical and future projected runoff. This indicates that the uncertainty range of runoff is narrow from January to March but is wide in other months and varies most significantly from July to August.
4.4.2. Uncertainty Caused by Climate Change
According to the statistics for the uncertainty variation range of the mean monthly runoff under the 12 scenarios (
Figure 9b), the uncertainty range of the runoff is narrow in the non-flood period, but wide in the flood season, especially in July and August. The upper limit of the runoff is deeply impacted by SM-AC (RCP8.5). If the specific scenario is not taken into account, the uncertainty range of the runoff will narrow by about 35% in July and August.
The runoff uncertainty caused by climate change considered here includes both the uncertainty impact of GCMs and the emissions scenarios. Therefore, we further analyze the impact of RCPs on the upper and lower bounds of the runoff uncertainty envelope. The absolute differences between the RCPs are regarded as the impacts of the emissions scenarios. It was found that RCPs contribute about 50% of the total uncertainty range in June and less than 30% in all 11 other months on the upper bounds of the envelope. Meanwhile, the RCPs contribute about 30% of the total range in May and less than 15% in all other months on the lower bound of the envelope. This demonstrates that GCMs contribute much more than the emission scenarios in future runoff uncertainty.
4.4.3. Uncertainty Caused by Downscaling Methods
A further comparison between the comprehensive impact range (
Figure 9a) and the impact range of climate change (
Figure 9b) is analyzed. The difference between them is regarded as the uncertainty impact range of the downscaling methods (
Figure 9c). As shown in the figure, different downscaling methods have no impact on the lower limit of the runoff. These methods mainly impact the upper limit of the runoff. It also can be seen that the downscaling methods barely impact the upper limit of the runoff in July and August, but greatly impact the upper limit during the other months. The impact of the downscaling methods account for 63–83% of the range of the comprehensive impact from January to April and October to December, and the impact accounts for about 50% in June and September, while the impact is smaller in May.
In sum, the runoff uncertainty is mainly caused by the uncertainty of climate change in May, July, and August, while the impacts of climate change and the downscaling method are similar in June and September. In the other months, the runoff uncertainty is mainly caused by downscaling methods.
5. Discussion
Eleven GCMs, two statistical downscaling methods, and four dynamical downscaling datasets are involved in constructing the 22 scenarios to analyze the uncertainty variation of the runoff and to estimate the uncertainty sources in the Biliu River basin. The chosen GCMs and downscaling methods are widely used across the globe, and the selected models and methods are effective to forecast future runoff and uncertainty variations.
To use the sensibility of precipitation and temperature variability has been a common method in studying climate change on runoff [
36]. This study also compared variations of the annual precipitation, maximum, and minimum temperatures and the future runoff between the future and historical periods. Consistent with IPCC’s [
37] conclusion about global warming and several previous studies, such as those by Chen et al. [
16] and Ouyang et al. [
7], future temperatures will increase in the future, and increase more for RCP8.5 than RCP4.5. Most of the considered scenarios suggest increases in future precipitation. Several other regions also show an increase in precipitation in the future, such as the major upstream river basins in the Tibetan Plateau [
1]. Nevertheless, precipitation decreases mainly occurred in CORDEX datasets in this research, possibly because CORDEX, on average, produces smaller trends in precipitation, as suggested by Guo et al. [
38]. As indicated by
Figure 4, larger uncertainties occurred in future precipitation than in temperature, which is also visible in other basins [
1]. The precipitation changes from declining to substantially (annually greater than 20% on average) increasing [
39]. The variation of the future precipitation and temperature discussed in
Section 4.2 indicates that the precipitation downscaled by SDSM may reduce the annual range, thereby resulting in a small difference of the annual runoff. Chen et al. [
16] also argued that the SDSM method should be used with caution.
Since all the scenarios show an increase in temperature, if future precipitation increases less than 4.5% or decreases, the runoff is more likely to decrease; otherwise, runoff increases. Future monthly runoff decreases in the dry season (from November to April), which implies that the reservoir needs to further enhance its capacity for water storage in the future. Future runoff increases during the late flood period (September and October) and the water storage in this period can be increased to meet the demand of the dry season. In addition, future runoff increases in May and June and decreases in July and August, which implies that the flood control pressure will likely move forward in the future.
The uncertainty impact of downscaling methods has been given much less attention [
16]. This article attempted to propose a method to separate the contribution of climate change and downscaling methods. The uncertainty variation of the runoff caused by climate change (evaluated in
Section 4.4.2) is removed from the comprehensive impacts of climate change and downscaling methods (discussed in
Section 4.4.1) to capture the impact of downscaling methods (discussed in
Section 4.4.3).
Figure 8 shows the uncertainty envelope of the runoff derived from two sources in the historical and future periods. The width of the downscaling methods envelope first increase and then decrease. Importantly, the uncertainty derived from climate change is much greater than that derived from downscaling methods. Consistently, Sharma et al. quantified the contributions from downscaling techniques, GCMs, and their combination (taken as the total uncertainties) and came to a similar conclusion. Furthermore, Bastola et al. [
23] evaluated the total uncertainty envelope derived from the four hydrological models and found that multiple hydrological models have a great effect on the uncertainty envelopes of the runoff, and more hydrological models should be considered in future studies.
It was found that the impact of climate change can be regarded as the main source of the runoff uncertainty during the flood period (from May to September), while the impact of the downscaling methods can be regarded as the main source during the non-flood season (from October to April). Compared with previous studies, this article further quantifies the contribution of the impact of the two uncertainty sources. Therefore, it makes a contribution to lay a certain foundation for separating the uncertainty impact of different factors.
6. Conclusions
This study estimated the uncertainty impacts of climate change and downscaling methods on future runoff in the Biliu River basin. We found that the temperature increases under all 22 scenarios and increases more under RCP8.5 than RCP4.5. In addition, 16 out of the 22 scenarios suggest increases in future precipitation. We also found that future runoff tends to decrease under 13 out of the 22 scenarios. For all the scenarios featuring an increase in temperature, if future precipitation increases less than 4.5% or decreases, the runoff is more likely to decrease.
Uncertainty impacts future runoff, and the main sources are also analyzed. We found that the mean runoff changes range from −38.38% to 33.98%. Different downscaling methods have no impact on the lower envelope of runoff and mainly impact the upper envelope of the runoff. We also found that the impact of climate change can be regarded as the main source of runoff uncertainty during the flood period (from May to September), while the impact of the downscaling methods can be regarded as the main source during the non-flood season (from October to April).
The decrease in annual runoff and the changes in the distribution of monthly runoff during the year may deteriorate the water shortages of the nearby big city. The results in this study could provide very important information for water resource management in this region and make a contribution to separate the uncertainty impact of different factors.


 ,
, 


