Conservation Agriculture Saves Irrigation Water in the Dry Monsoon Phase in the Ethiopian Highlands

 , ,
, ,  , and
, and
Abstract
1. Introduction
2. Materials and Methods
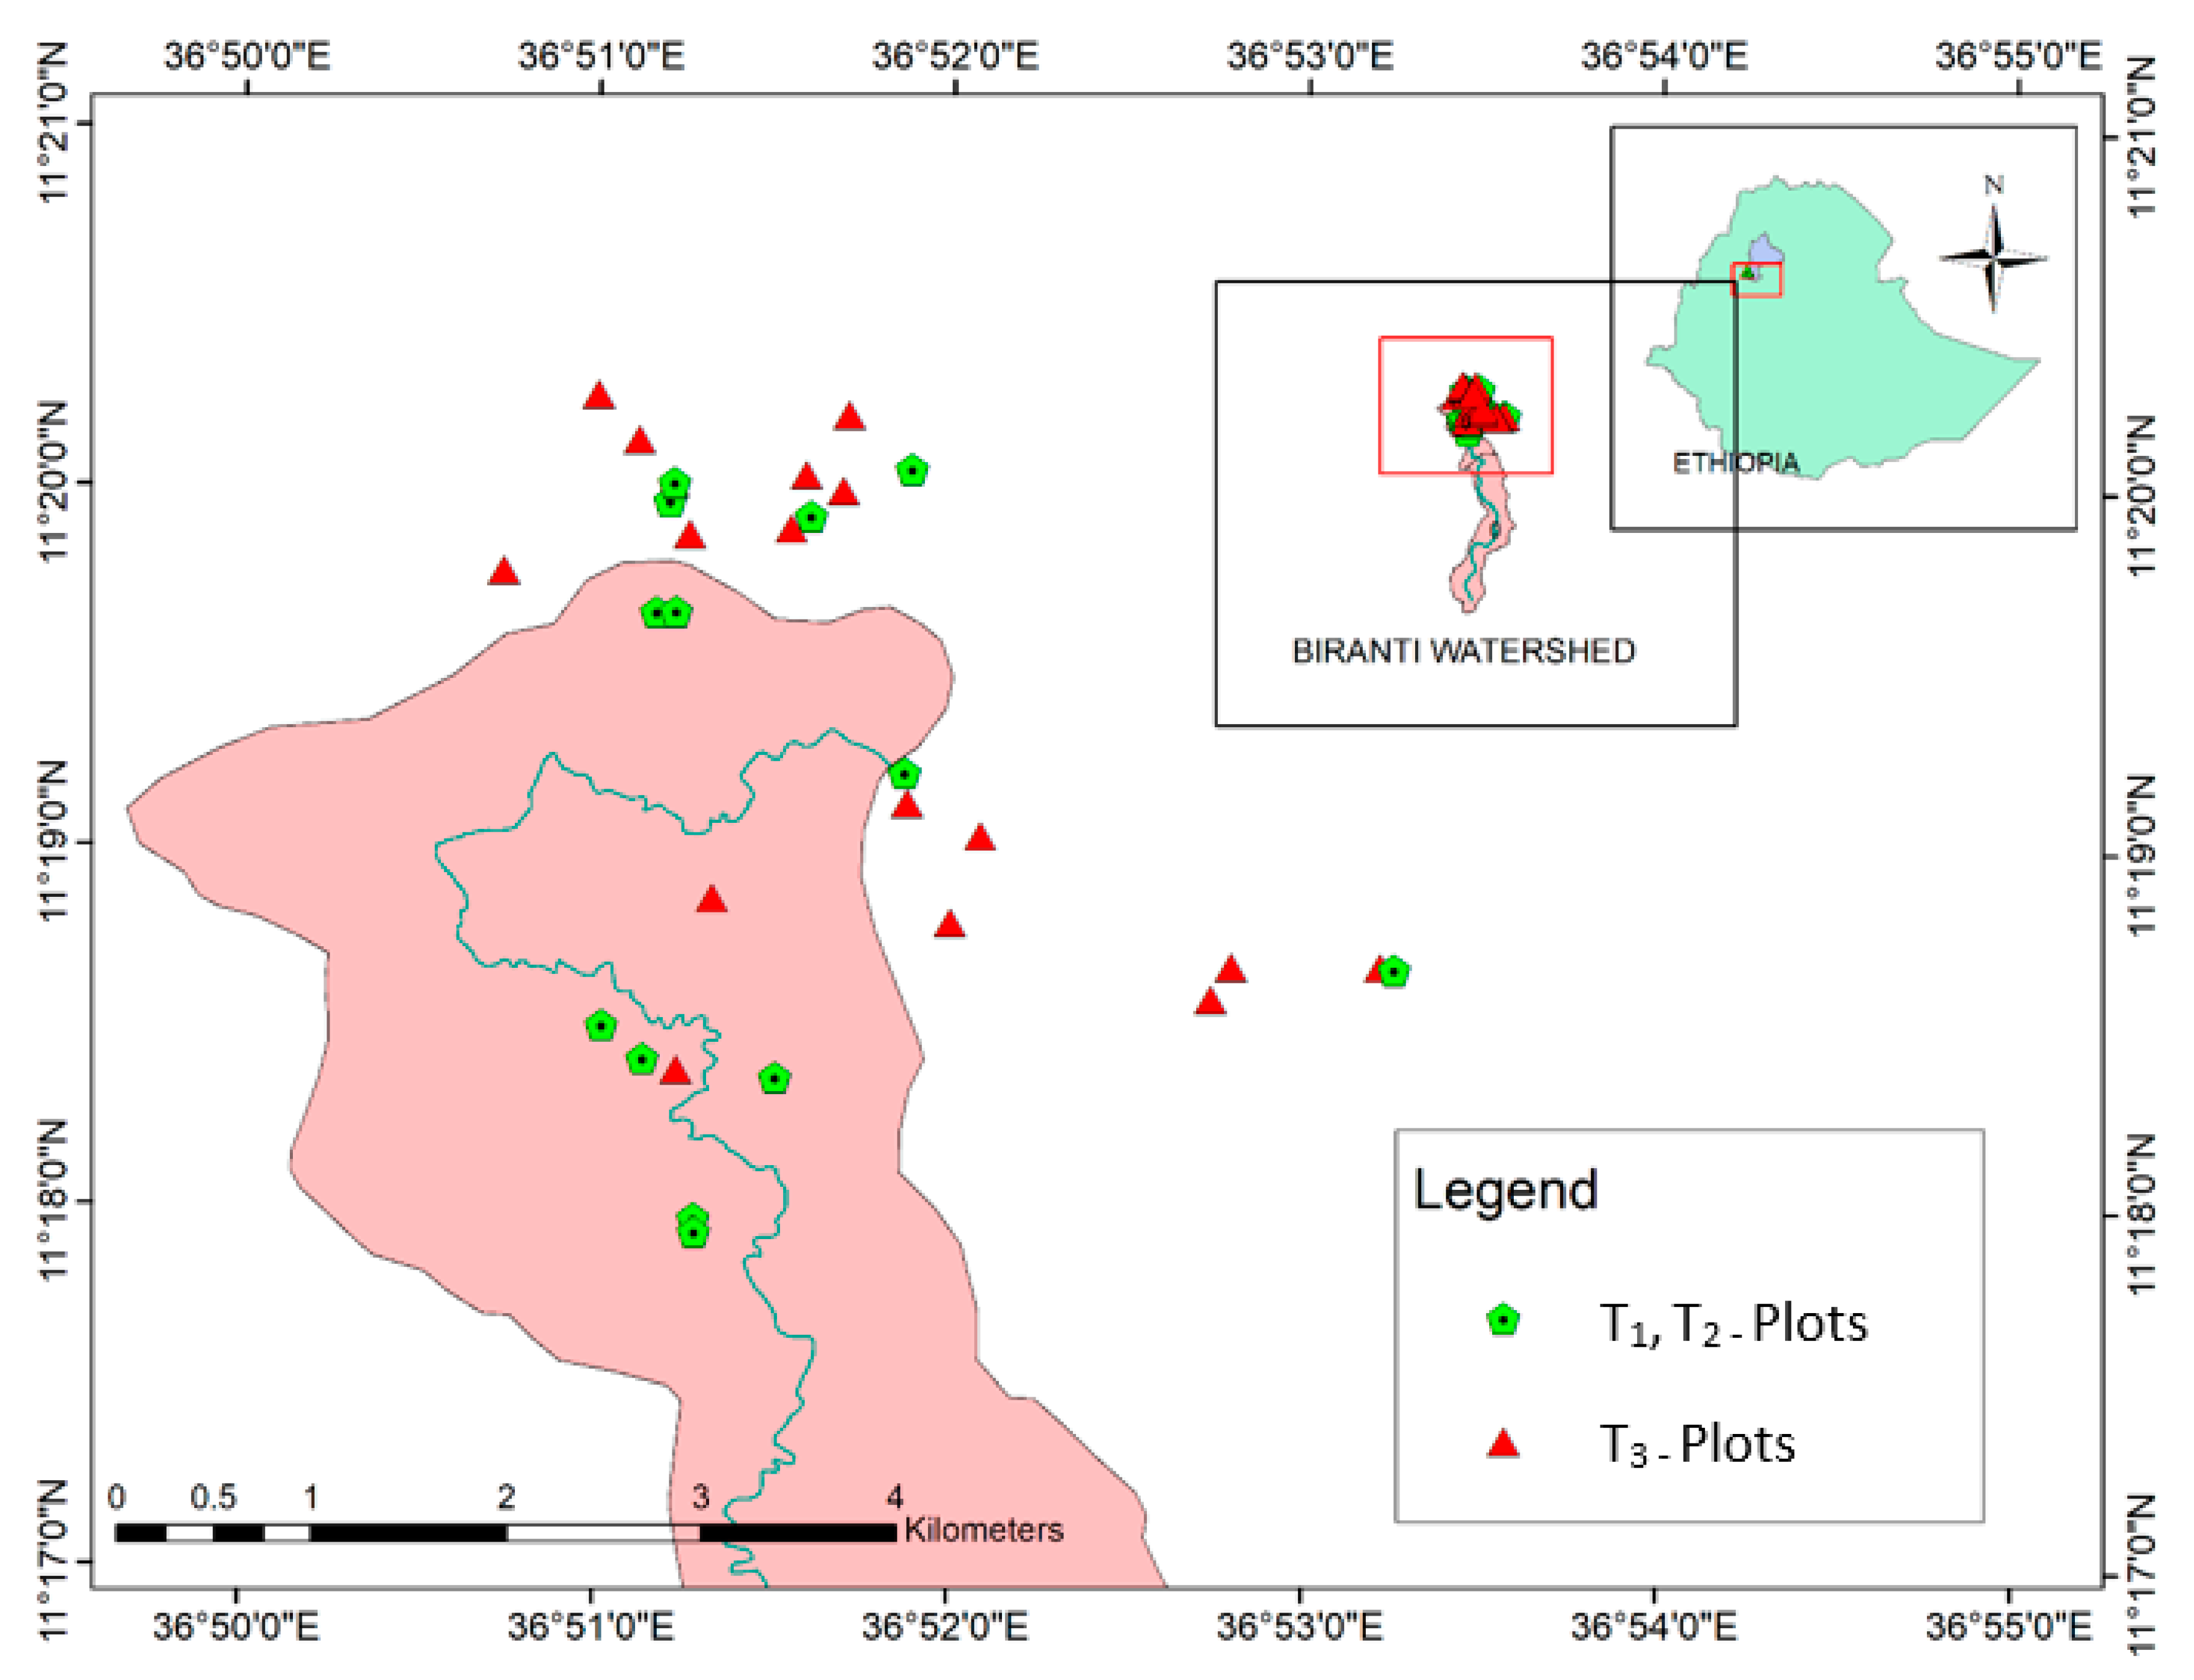
2.1. Site Description and Experiment Features
2.2. Experimental Design
2.3. Crop Variety and Management Information
2.4. Soil Moisture Data
2.5. Data Analysis
3. Results and Discussion
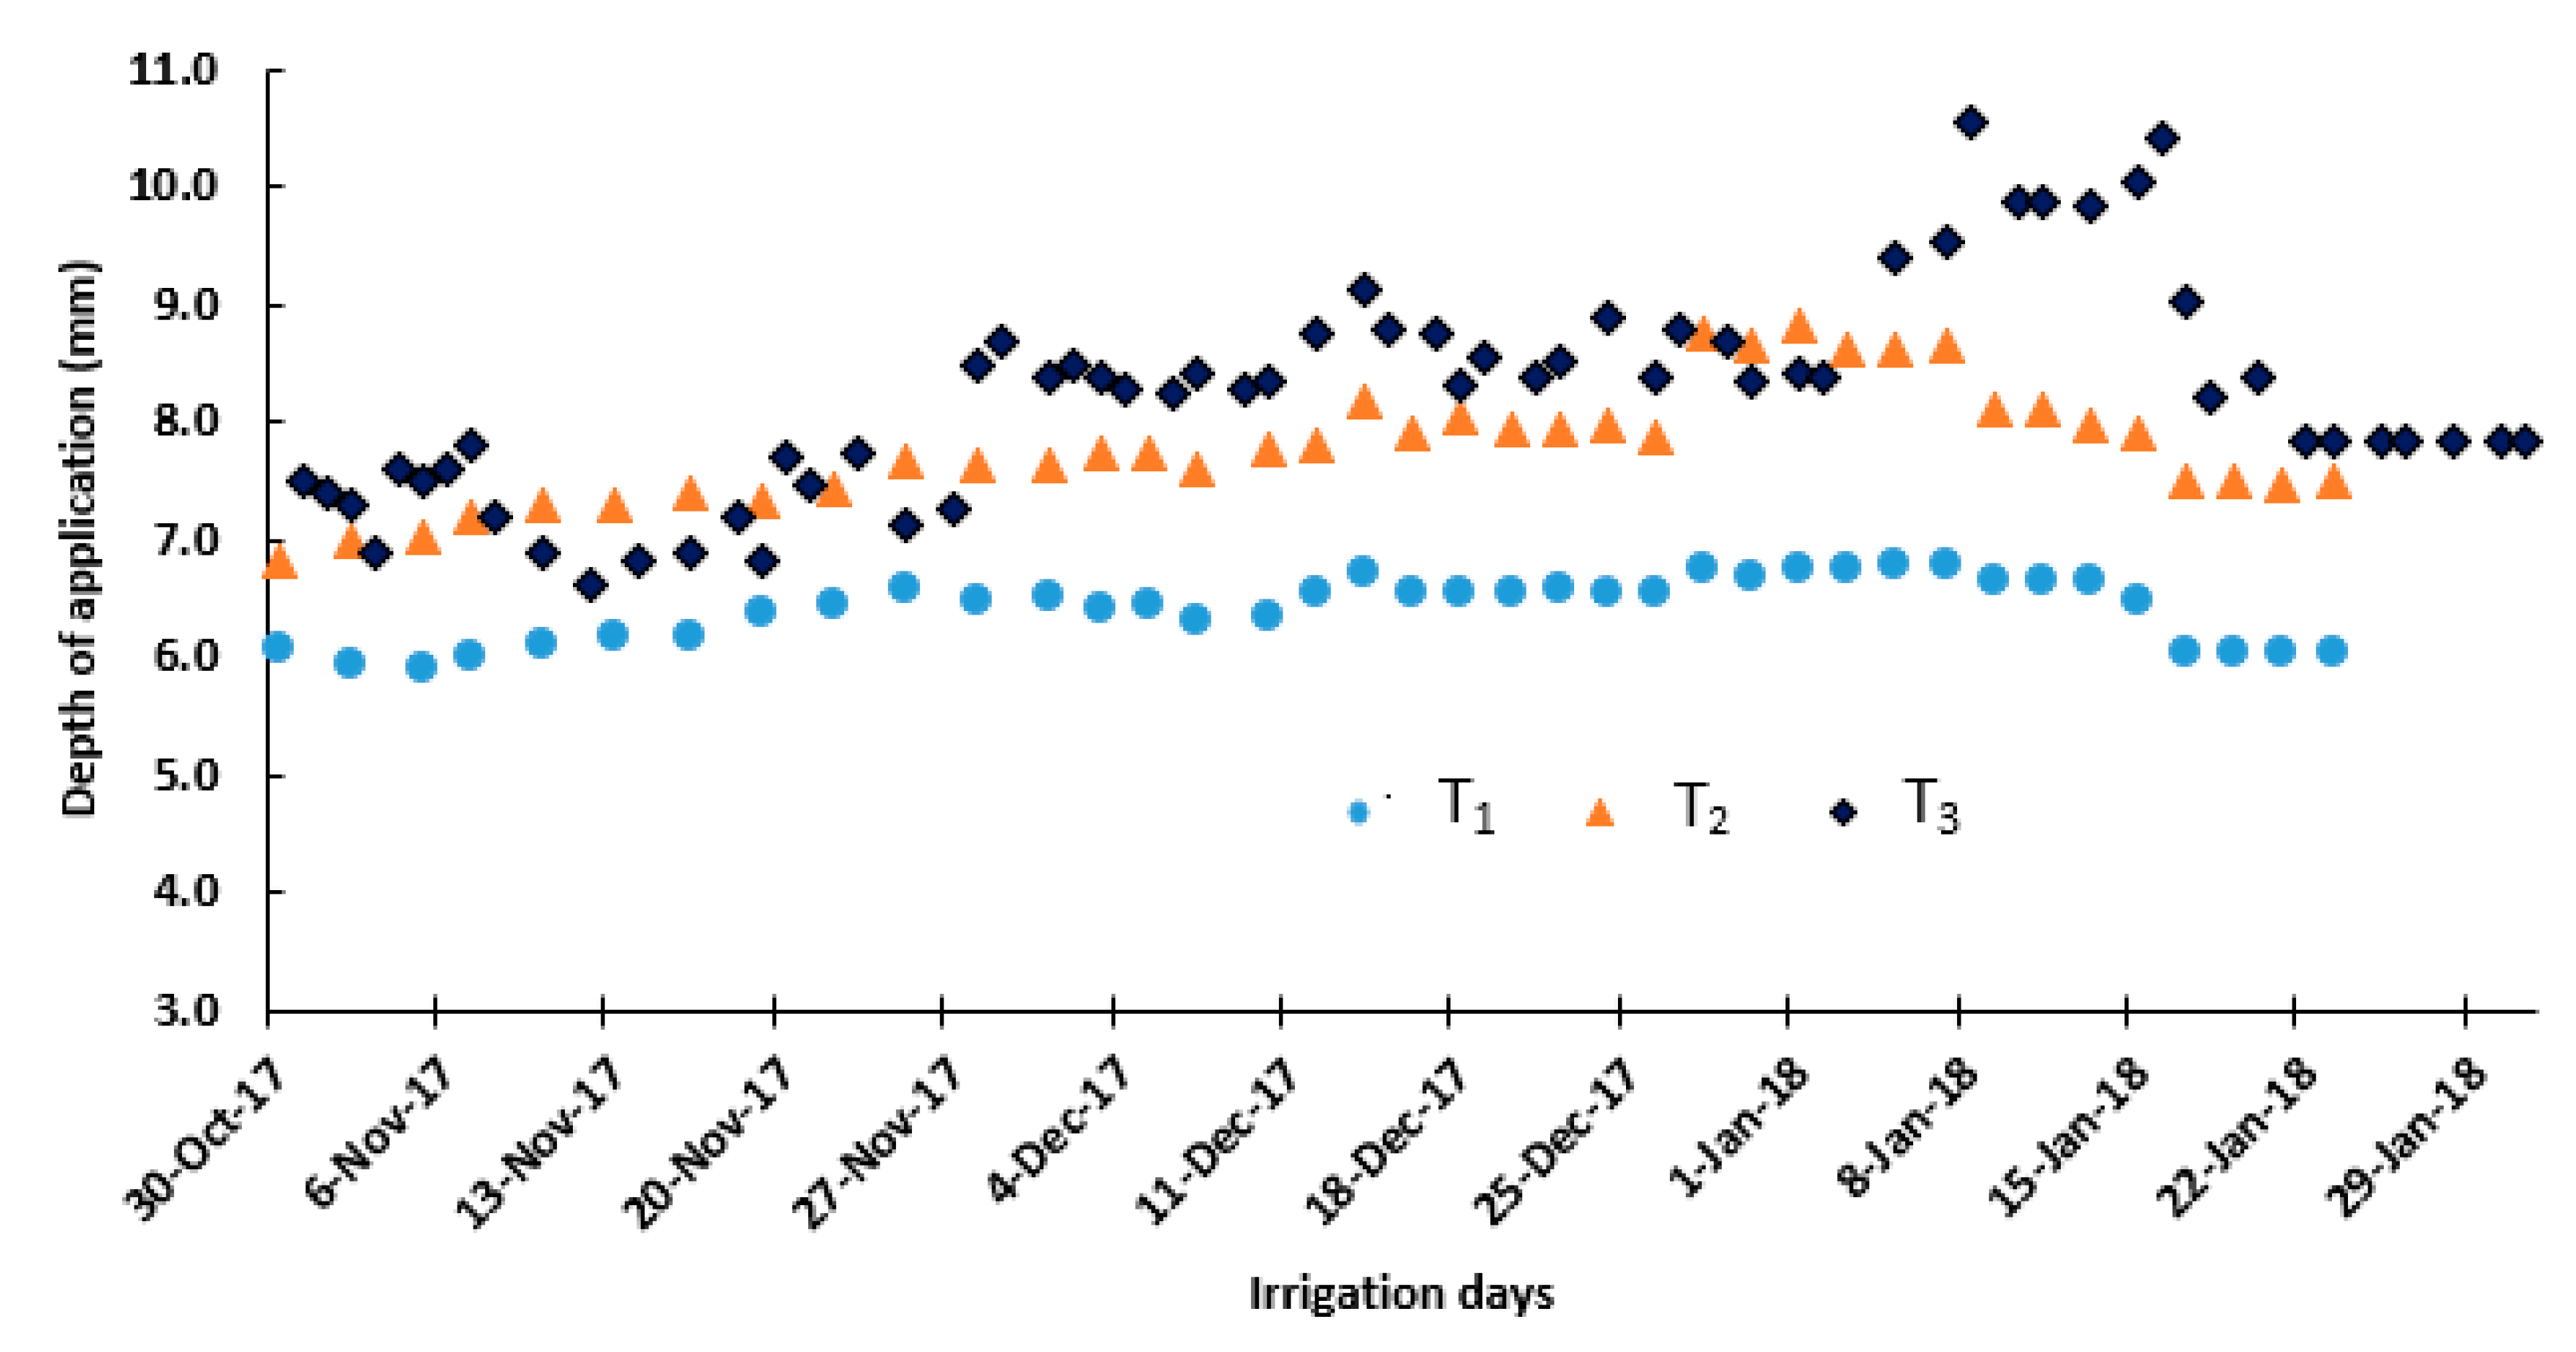
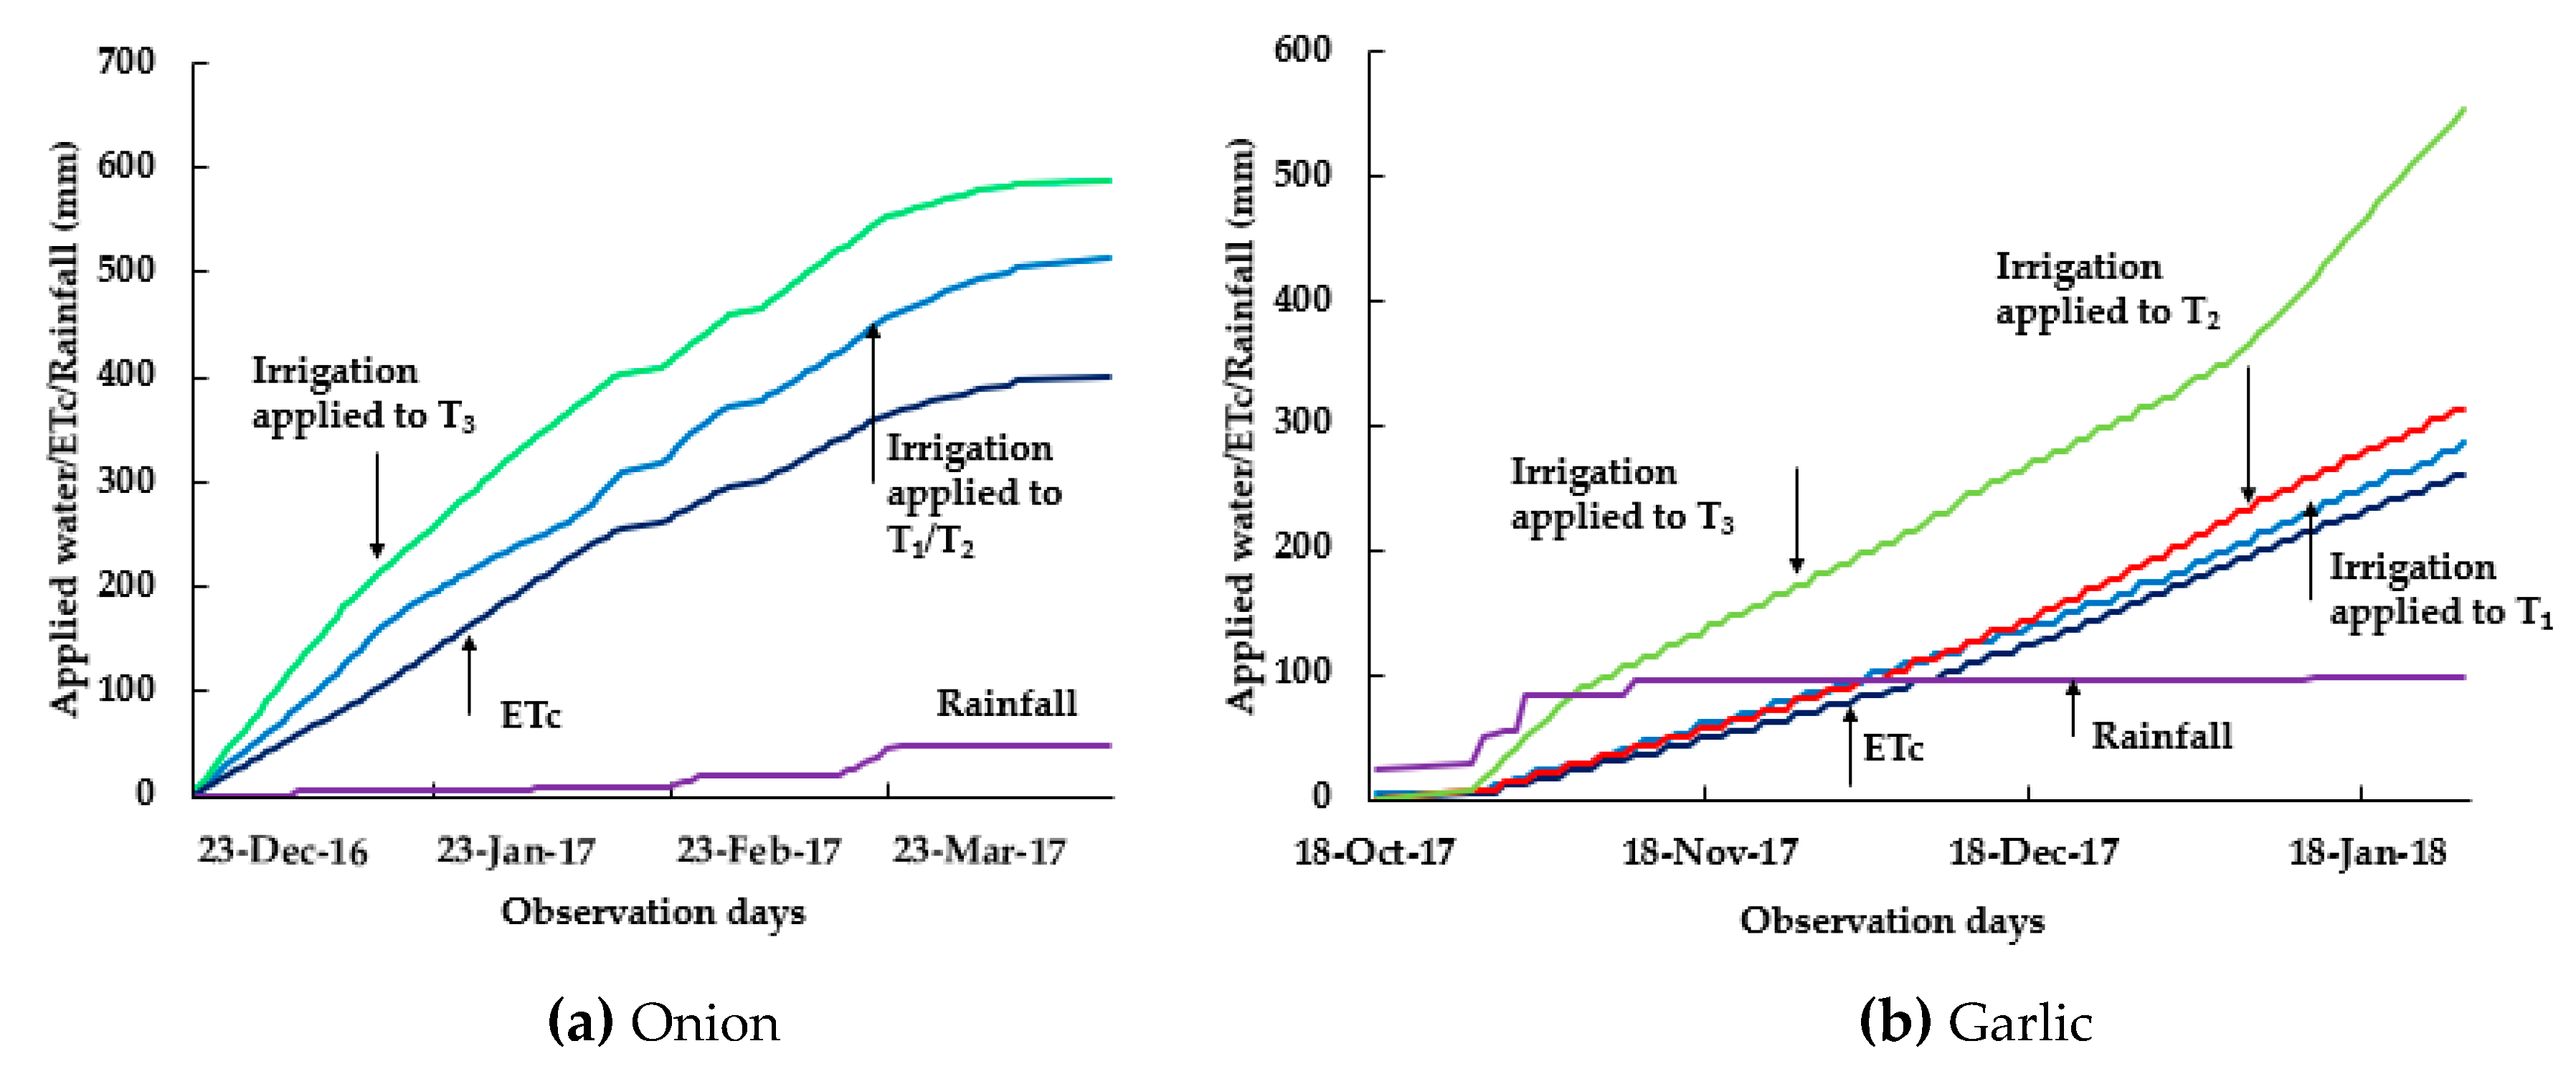
3.1. Irrigation Water Applied
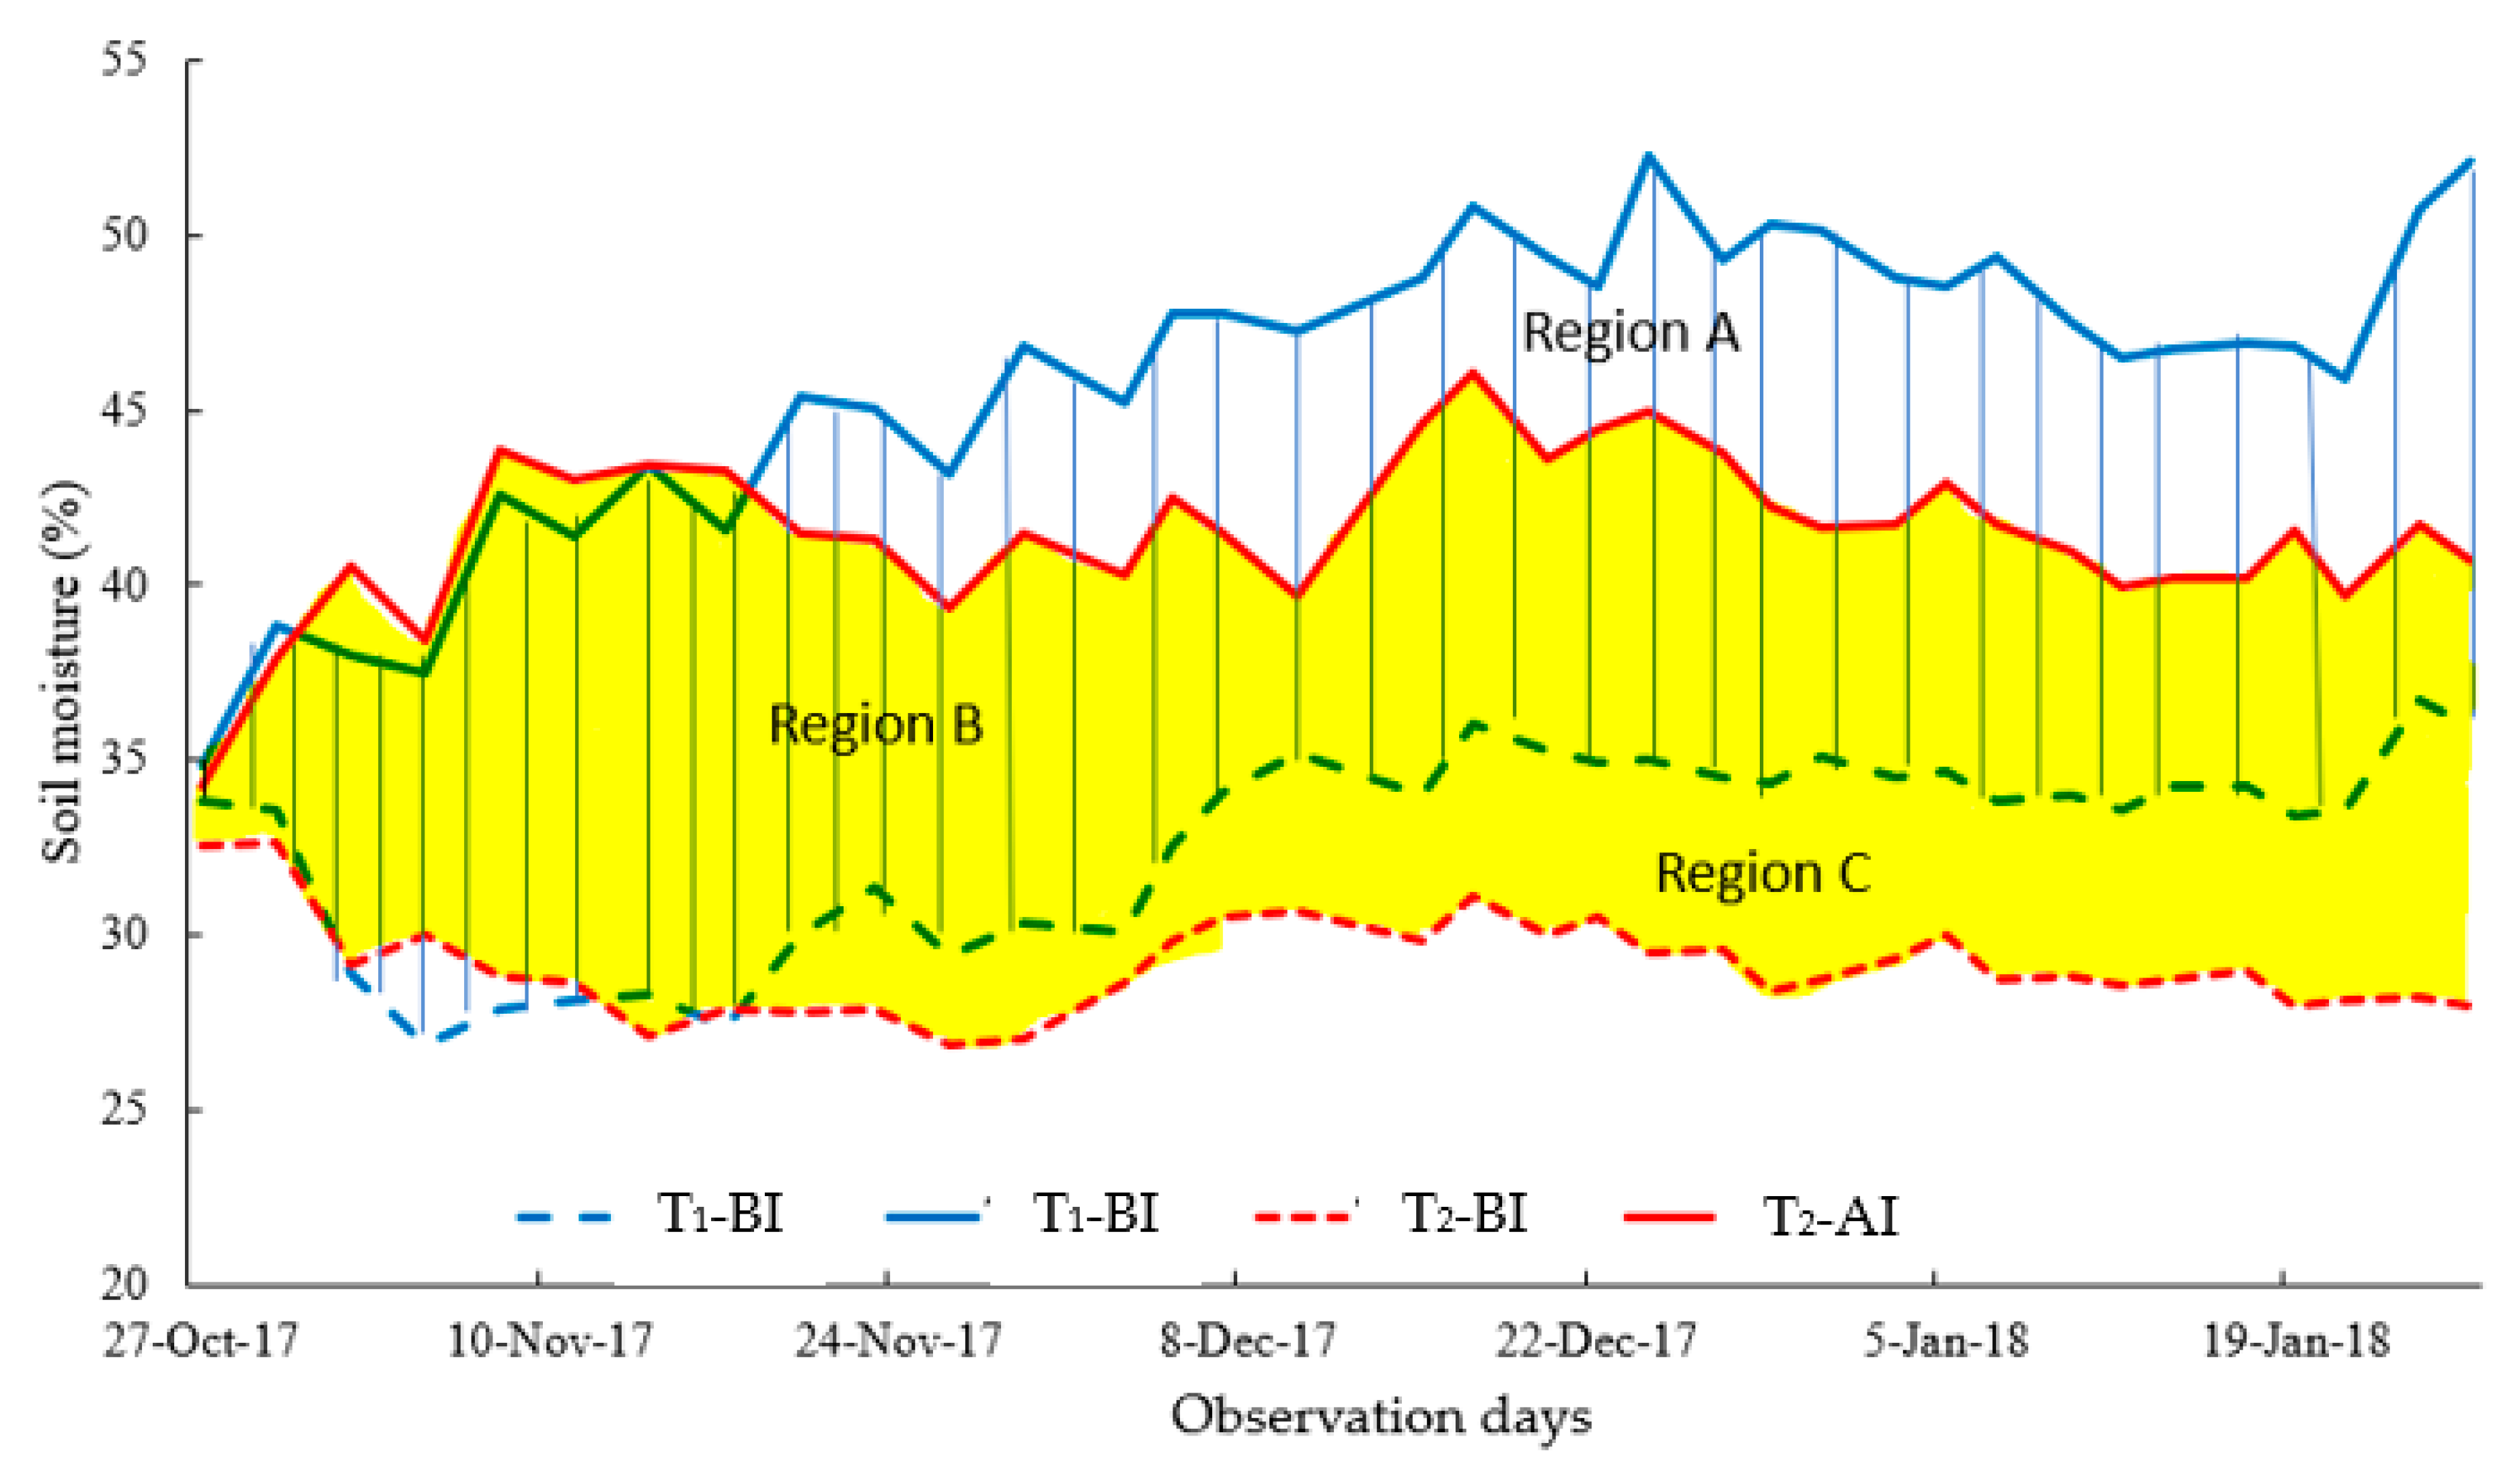
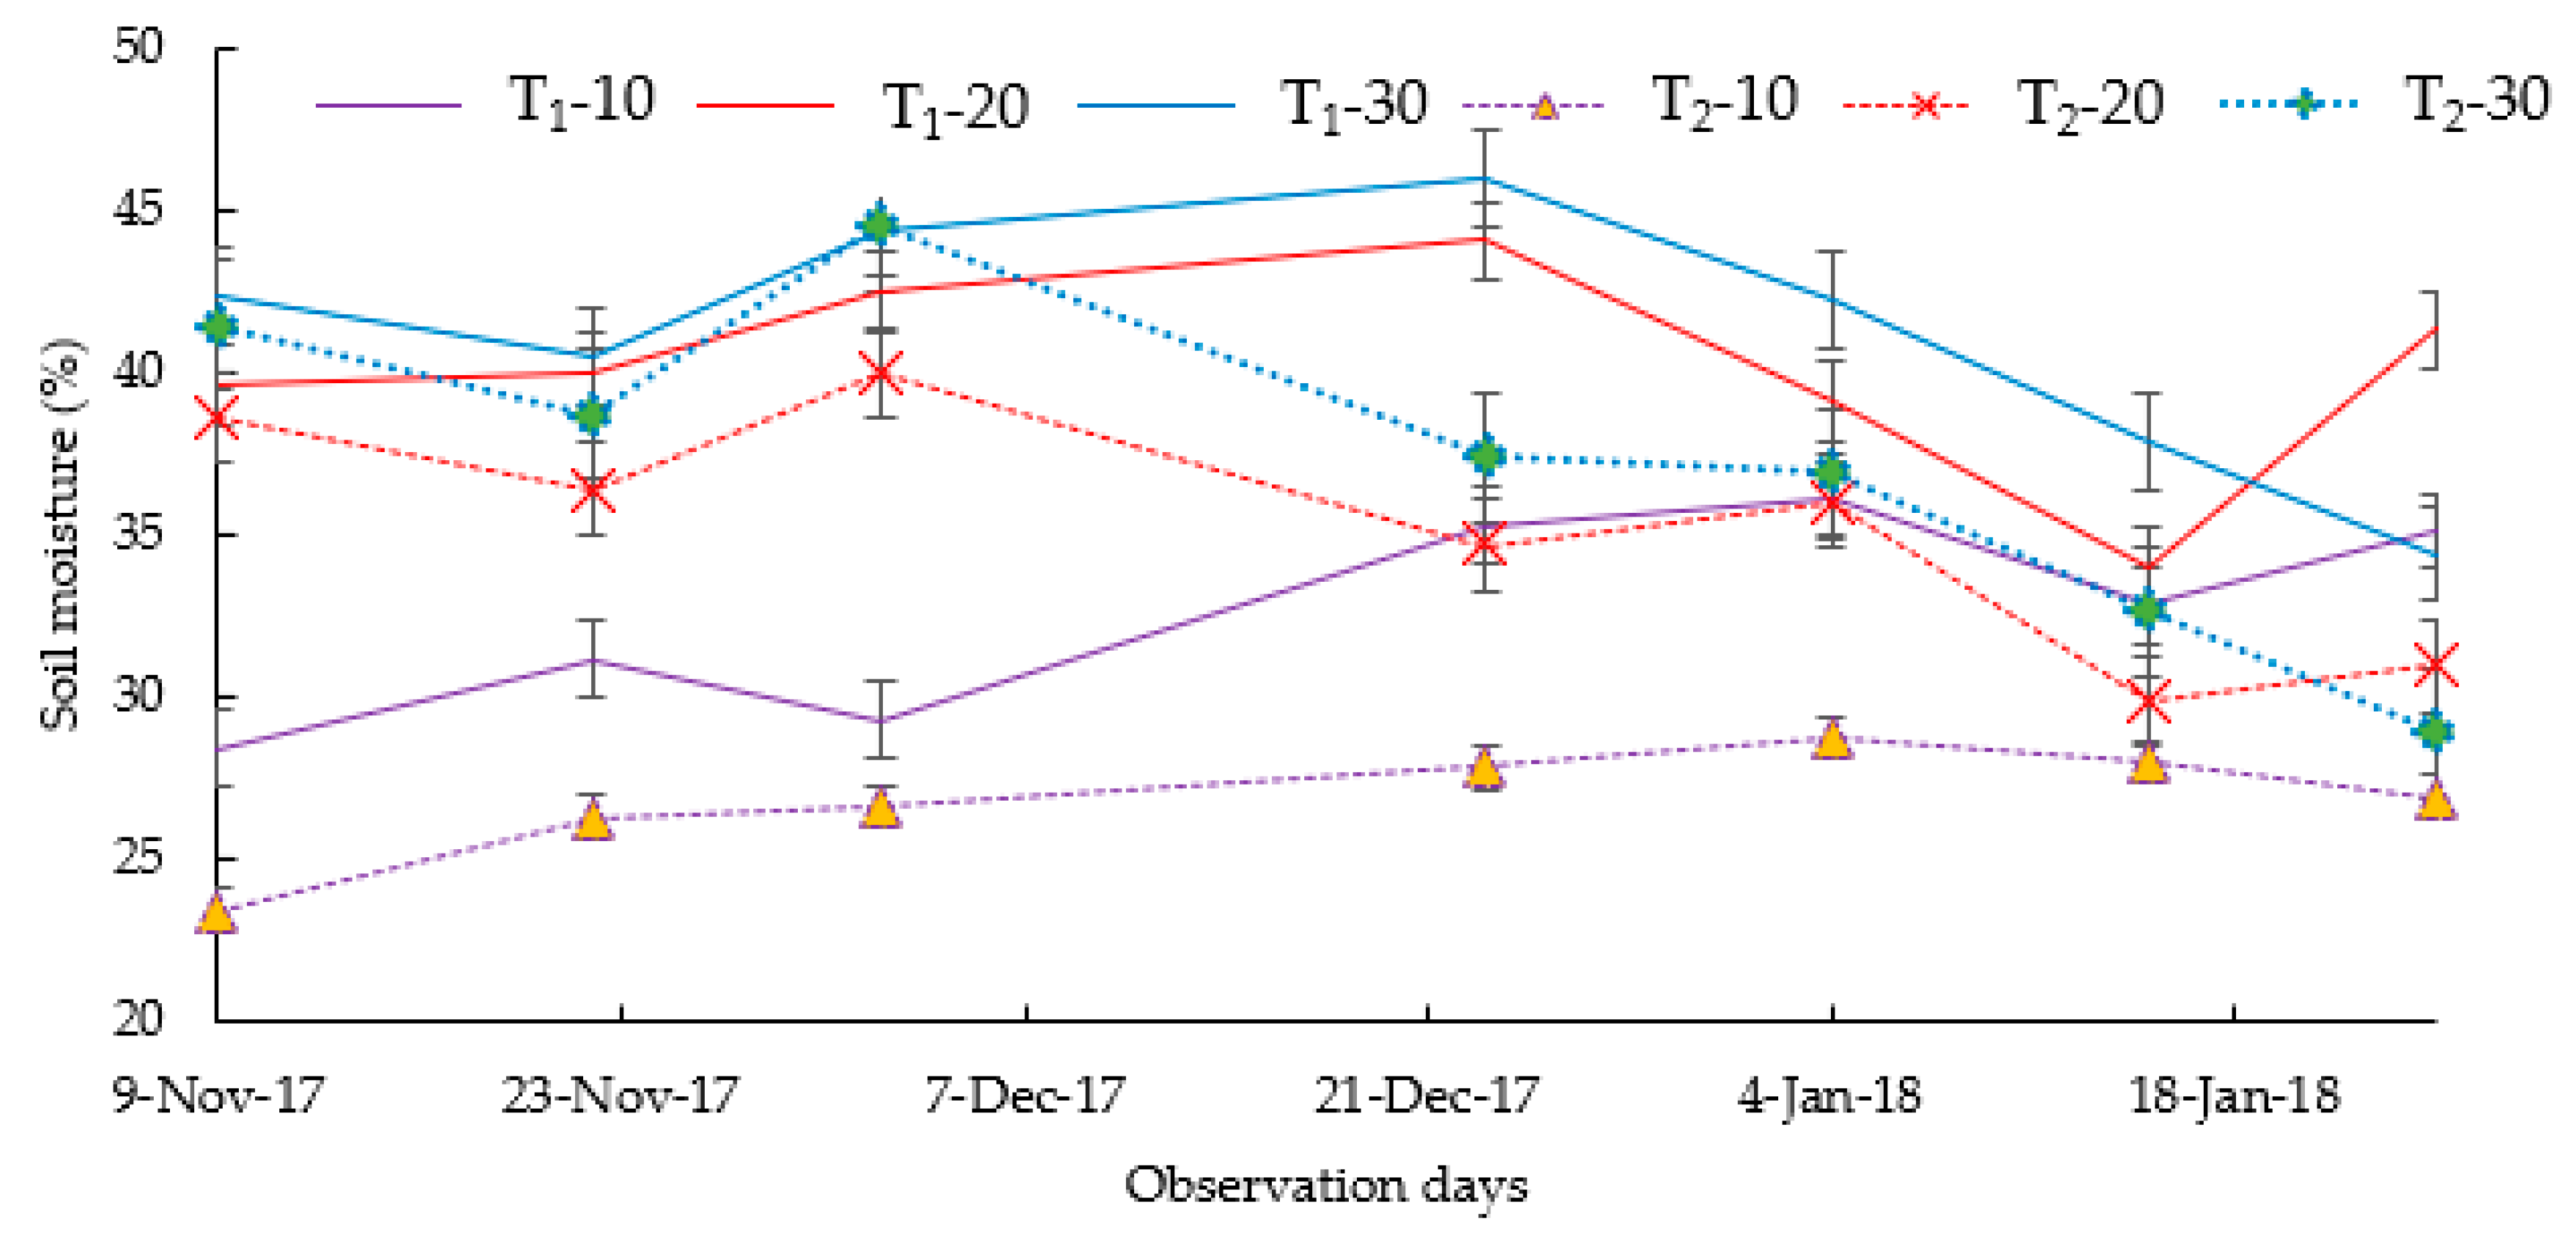
3.2. Soil Moisture Dynamics Responses
3.3. Yield and Productivity
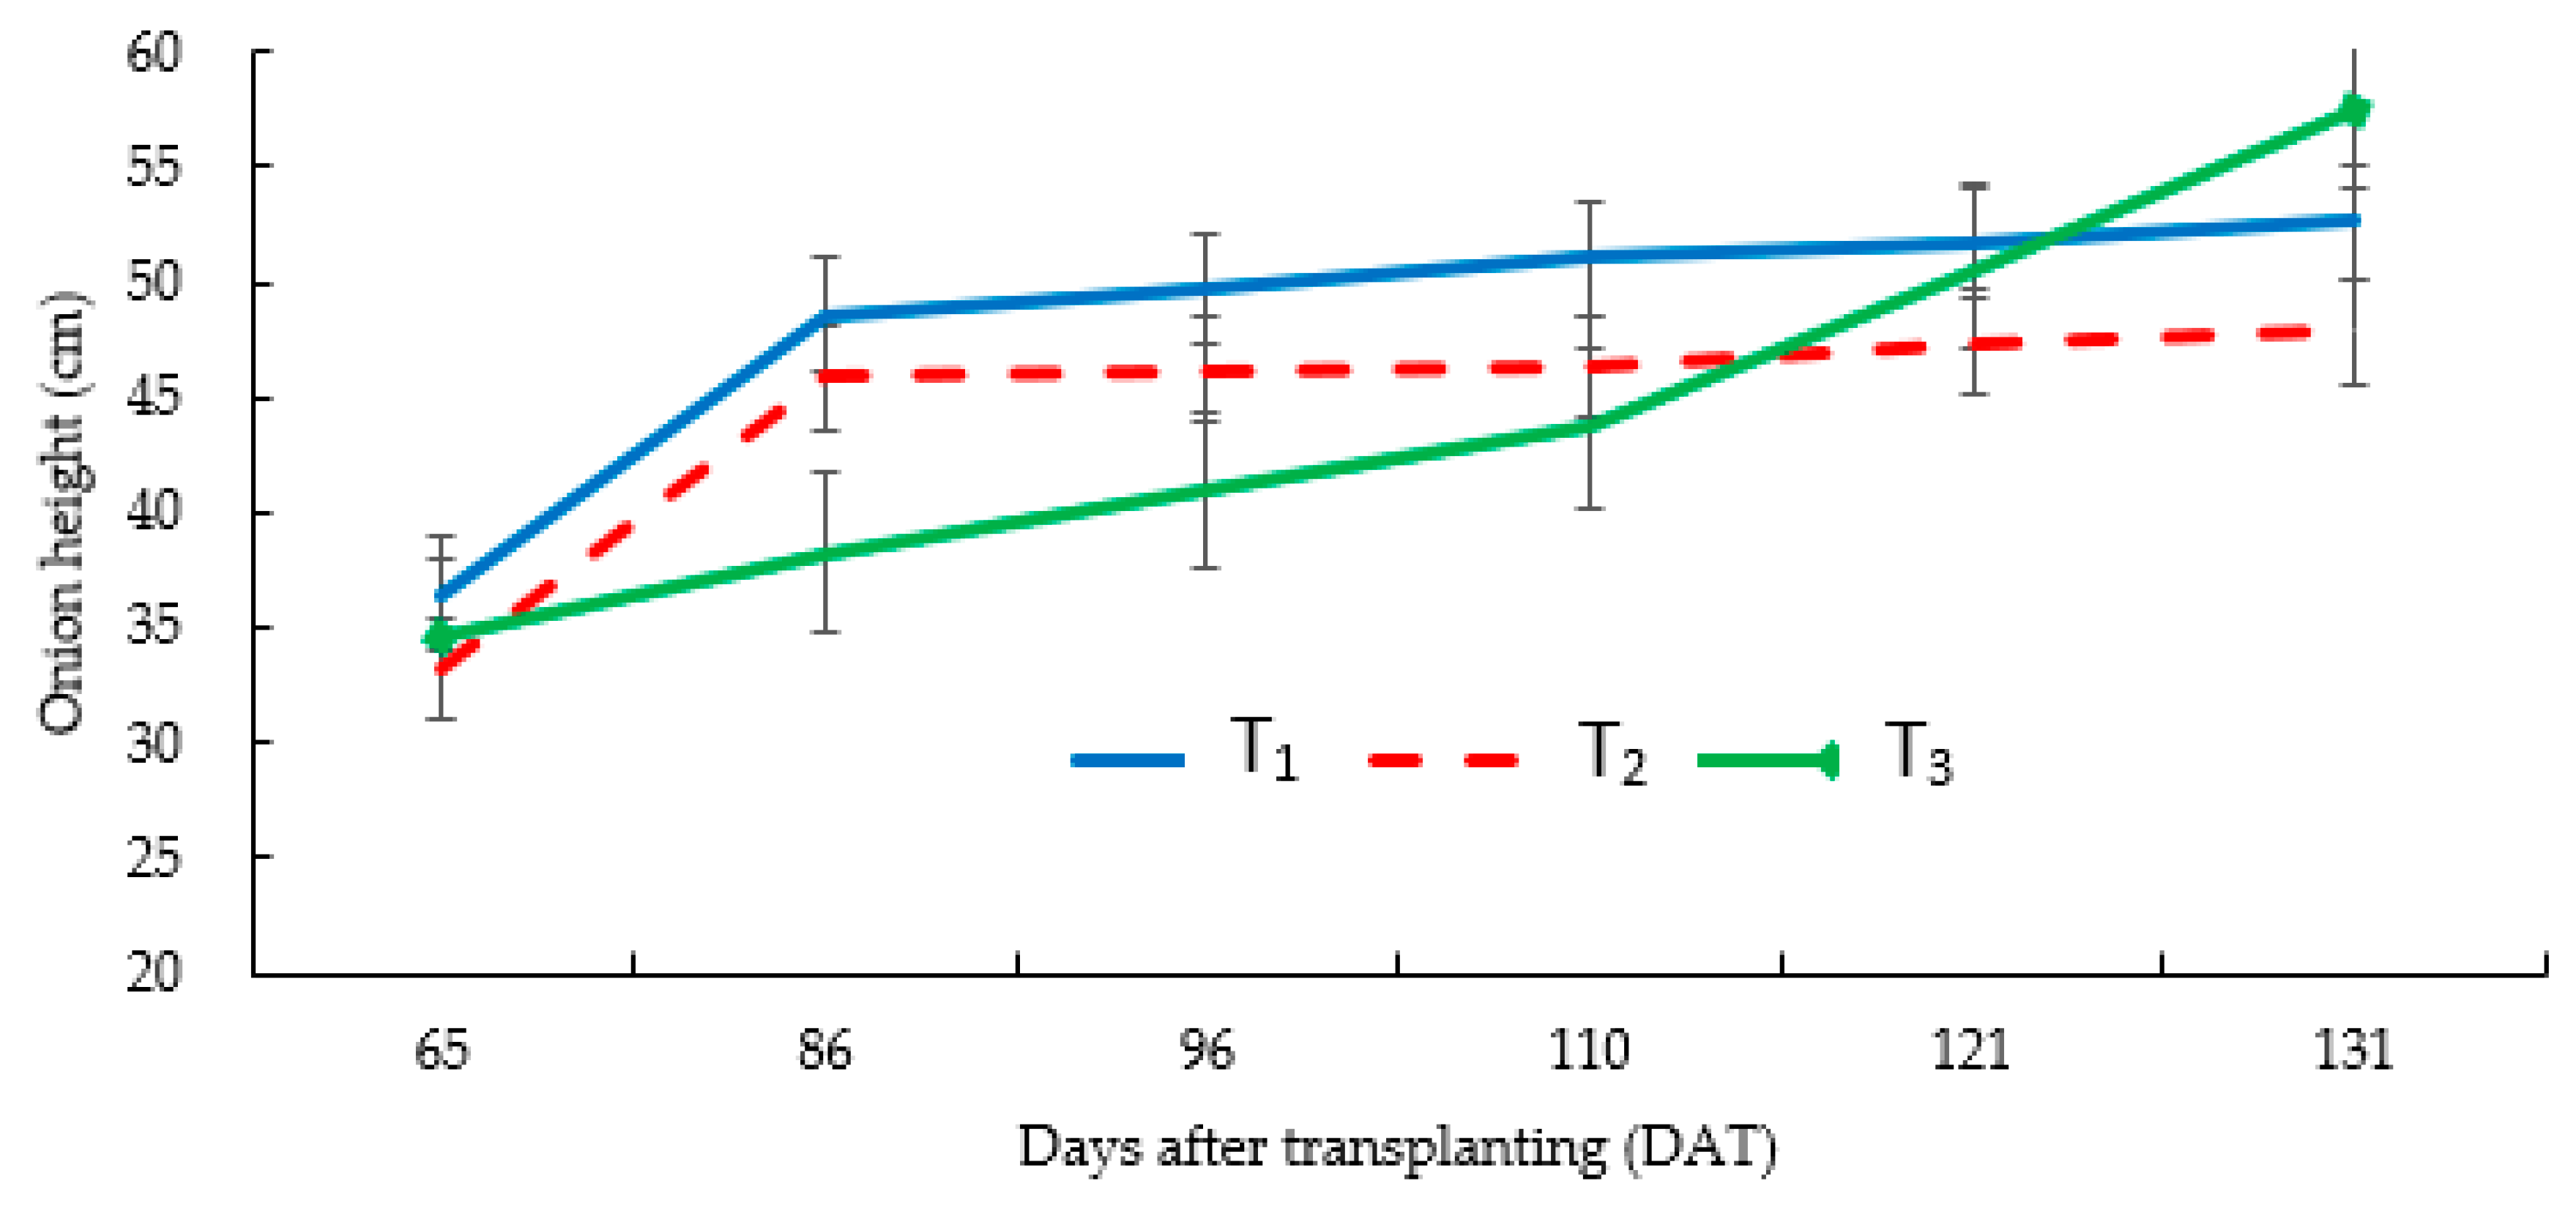
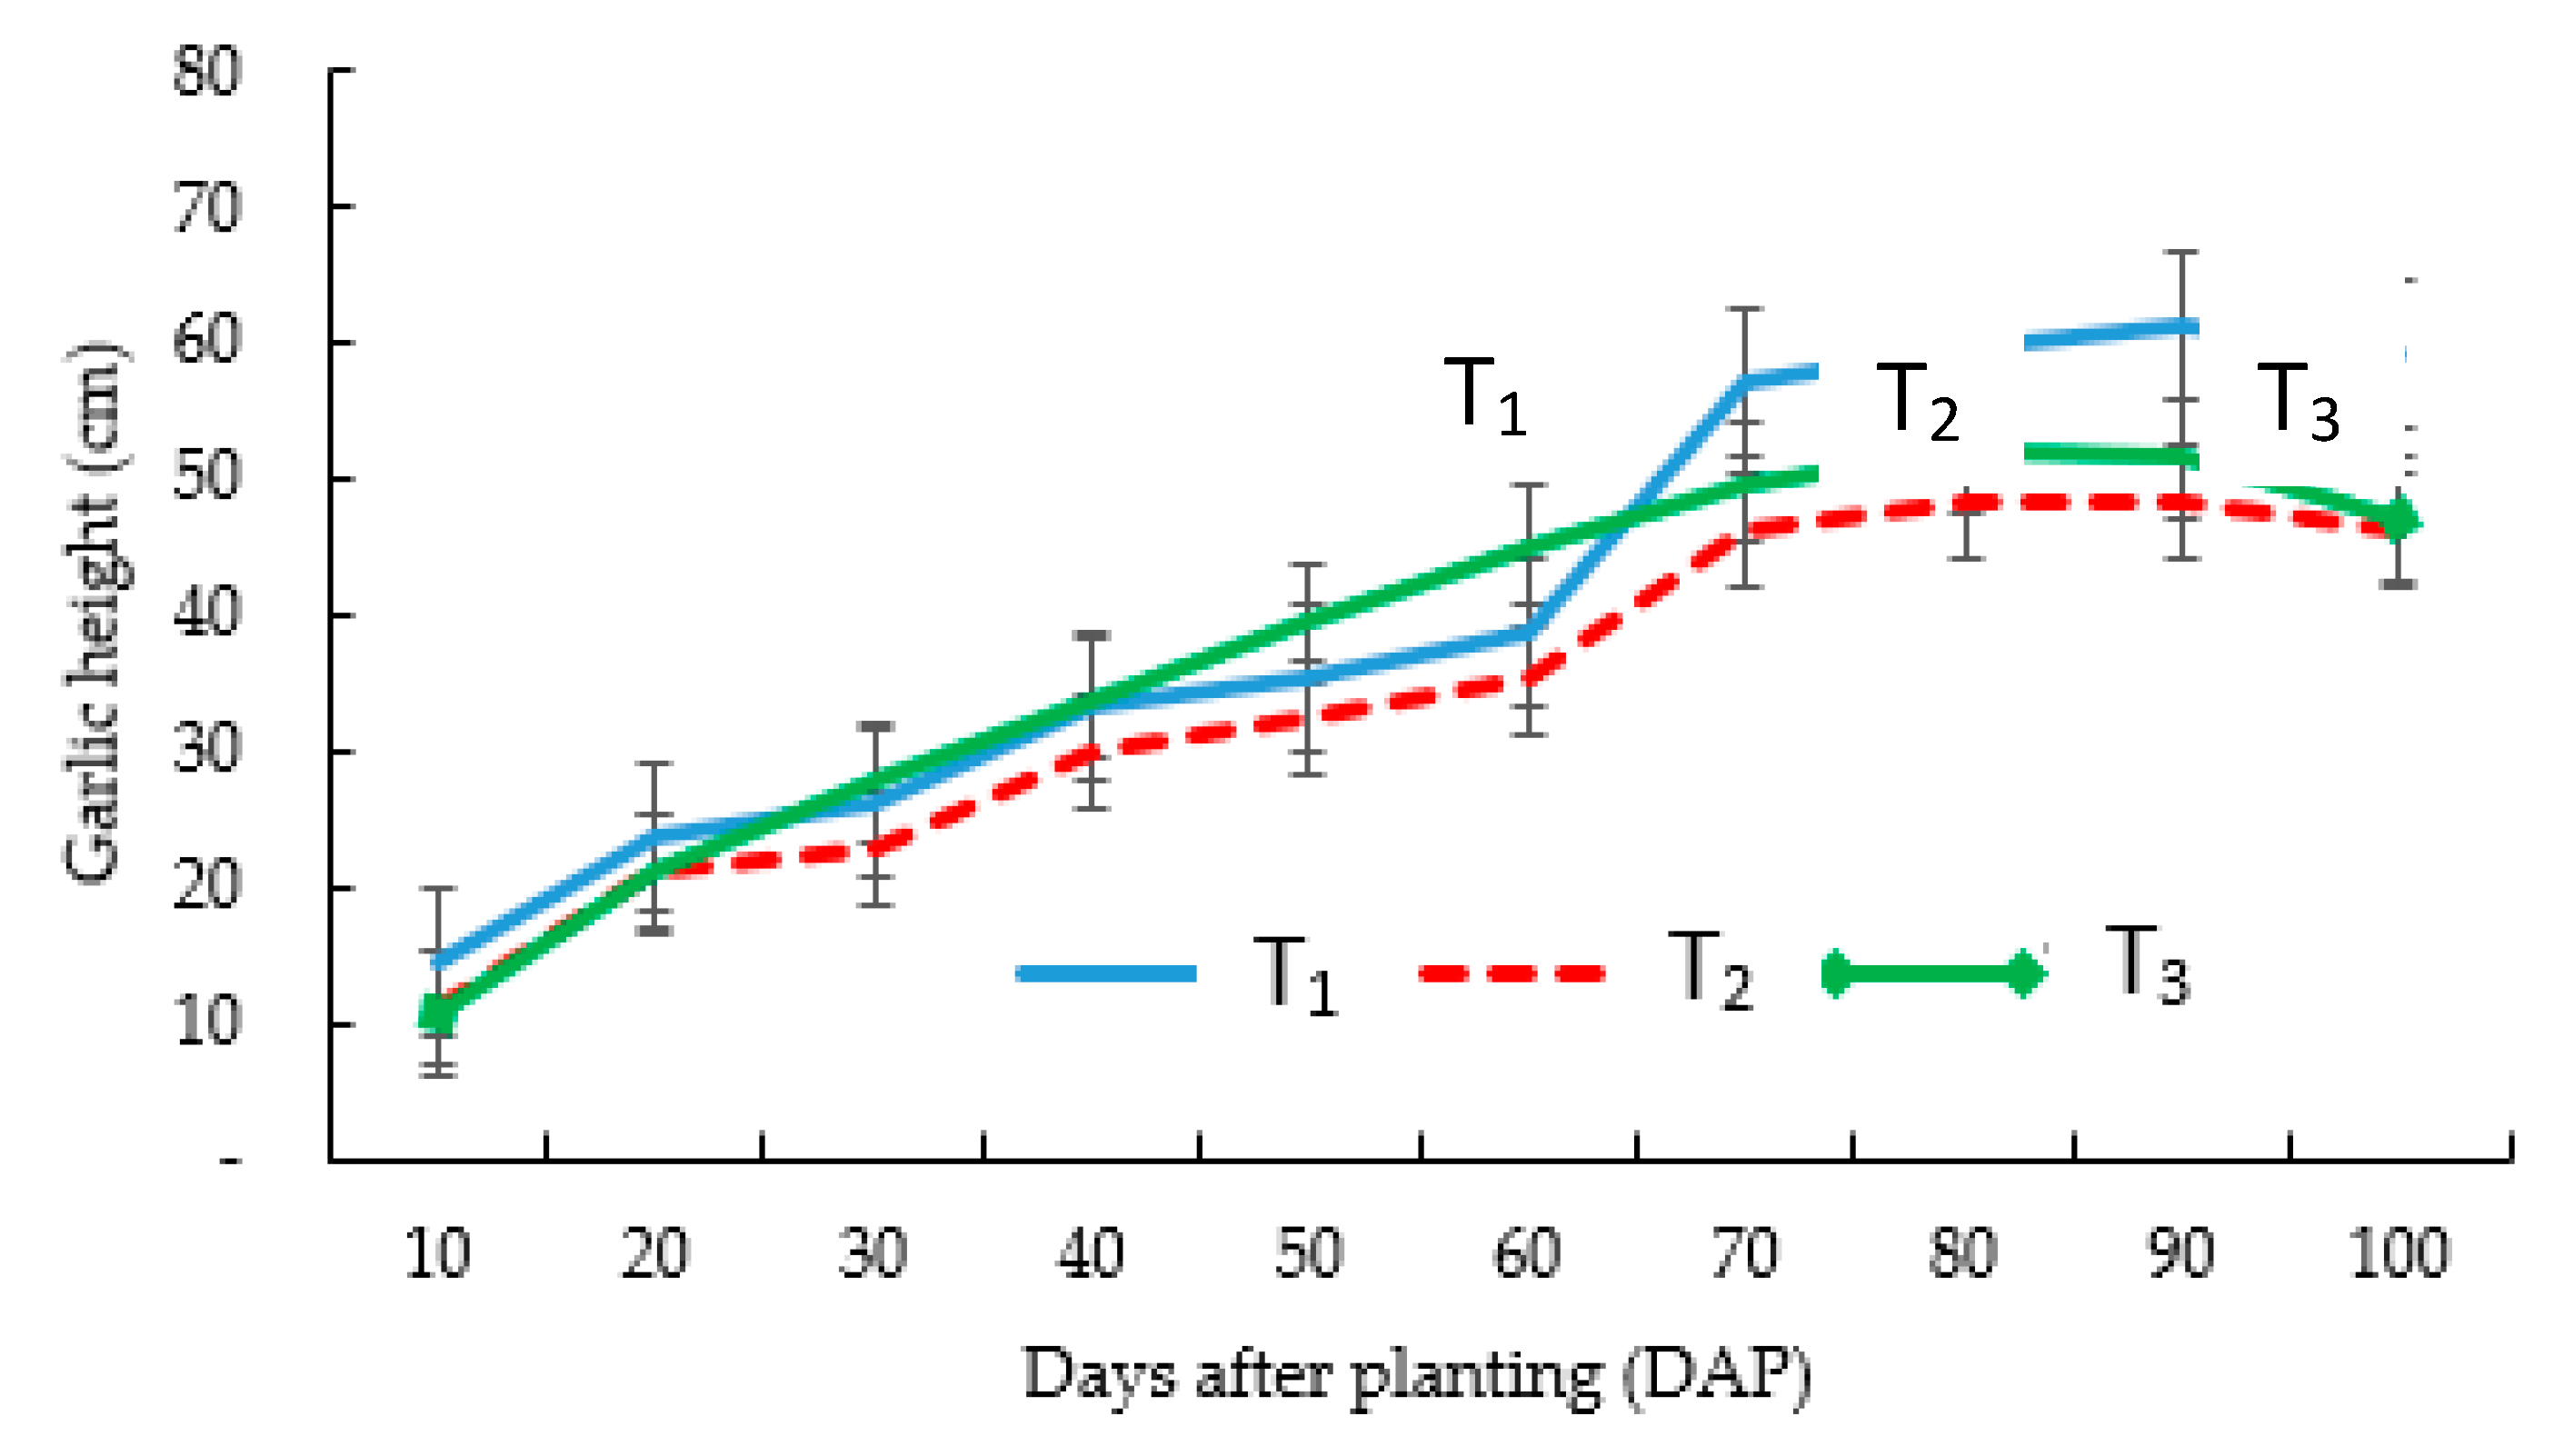
3.4. Crop Growth Dynamics and Responses
3.5. Irrigation Water Use Efficiency (IWUE)
4. Conclusions
Author Contributions
Funding
Acknowledgments
Conflicts of Interest
References
- Postel, S.L.; Daily, G.C.; Ehrlich, P.R. Human appropriation of renewable freshwater. Science 1996, 271, 785–788. [Google Scholar] [CrossRef]
- Wallace, J. Increasing agricultural water use efficiency to meet future food production. Agric. Ecosyst. Environ. 2000, 82, 105–119. [Google Scholar] [CrossRef]
- Morison, J.; Baker, N.; Mullineaux, P.; Davies, W. Improving water use in crop production. Philos. Trans. R. Soc. B Biol. Sci. 2007, 363, 639–658. [Google Scholar] [CrossRef] [PubMed]
- Bekele, S.; Tilahun, K. Regulated deficit irrigation scheduling of onion in a semiarid region of Ethiopia. Agric. Water Manag. 2007, 89, 148–152. [Google Scholar] [CrossRef]
- Enciso, J.; Jifon, J.; Wiedenfeld, B. Subsurface drip irrigation of onions: Effects of drip tape emitter spacing on yield and quality. Agric. Water Manag. 2007, 92, 126–130. [Google Scholar] [CrossRef]
- Pretty, J.; Toulmin, C.; Williams, S. Sustainable intensification in African agriculture. Int. J. Agric. Sustain. 2011, 9, 5–24. [Google Scholar] [CrossRef]
- Nyborg, M.; Solberg, E.; Izaurralde, R.; Malhi, S.; Molina-Ayala, M. Influence of long-term tillage, straw and N fertilizer on barley yield, plant-N uptake and soil-N balance. Soil Tillage Res. 1995, 36, 165–174. [Google Scholar] [CrossRef]
- Limon-Ortega, A.; Sayre, K.D.; Francis, C.A. Wheat nitrogen use efficiency in a bed planting system in northwest Mexico. Agron. J. 2000, 92, 303–308. [Google Scholar] [CrossRef]
- Giller, K.E.; Corbeels, M.; Nyamangara, J.; Triomphe, B.; Affholder, F.; Scopel, E.; Tittonell, P. A research agenda to explore the role of conservation agriculture in African smallholder farming systems. Field Crop. Res. 2011, 124, 468–472. [Google Scholar] [CrossRef]
- Friedrich, T.; Kassam, A.; Taher, F. Adoption of Conservation Agriculture and the role of policy and institutional support. Presented at the International Consultation on No-Till with Soil Cover and Crop Rotation: A Basis for Policy Support to Conservation Agriculture for Sustainable Production Intensification, Astana-Shortandy, Kazakhstan, 8–10 July 2009. [Google Scholar]
- Giller, K.E.; Witter, E.; Corbeels, M.; Tittonell, P. Conservation agriculture and smallholder farming in Africa: The heretics’ view. Field Crop. Res. 2009, 114, 23–34. [Google Scholar] [CrossRef]
- Jat, M.L.; Gathala, M.K.; Saharawat, Y.S.; Tetarwal, J.P.; Gupta, R.; Yadvinder, S. Double no-till and permanent raised beds in maize–wheat rotation of north-western Indo-Gangetic plains of India: Effects on crop yields, water productivity, profitability and soil physical properties. Field Crop. Res. 2013, 149, 291–299. [Google Scholar] [CrossRef]
- Shock, C.; Jensen, L.; Hobson, J.; Seddigh, M.; Shock, B.; Saunders, L.; Stieber, T. Improving onion yield and market grade by mechanical straw application to irrigation furrows. HortTechnology 1999, 9, 251–253. [Google Scholar] [CrossRef]
- Serra, A.-D.B.; Currah, L. Agronomy of onions. In Allium Crop Science: Recent Advances; CABI: Wallingford, UK, 2002; pp. 187–232. [Google Scholar]
- Ward, F.A.; Pulido-Velazquez, M. Water conservation in irrigation can increase water use. Proc. Natl. Acad. Sci. USA 2008, 105, 18215–18220. [Google Scholar] [CrossRef] [PubMed]
- Govaerts, B.; Sayre, K.D.; Goudeseune, B.; De Corte, P.; Lichter, K.; Dendooven, L.; Deckers, J. Conservation agriculture as a sustainable option for the central Mexican highlands. Soil Tillage Res. 2009, 103, 222–230. [Google Scholar] [CrossRef]
- Corbeels, M.; Thierfelder, C.; Rusinamhodzi, L. Conservation agriculture in sub-Saharan Africa. In Conservation Agriculture; Springer: Berlin, Germany, 2015; pp. 443–476. [Google Scholar]
- Berihun, B. Effect of mulching and amount of water on the yield of tomato under drip irrigation. J. Hortic. For. 2011, 3, 200–206. [Google Scholar]
- Moges, G.; Hengsdijk, H.; Jansen, H. Review and quantitative assessment of ex situ household rainwater harvesting systems in Ethiopia. Agric. Water Manag. 2011, 98, 1215–1227. [Google Scholar] [CrossRef]
- Levidow, L.; Zaccaria, D.; Maia, R.; Vivas, E.; Todorovic, M.; Scardigno, A. Improving water-efficient irrigation: Prospects and difficulties of innovative practices. Agric. Water Manag. 2014, 146, 84–94. [Google Scholar] [CrossRef]
- Assefa, T.; Jha, M.; Reyes, M.; Worqlul, A. Modeling the Impacts of Conservation Agriculture with a Drip Irrigation System on the Hydrology and Water Management in Sub-Saharan Africa. Sustainability 2018, 10, 4763. [Google Scholar] [CrossRef]
- Walter, I.A.; Allen, R.G.; Elliott, R.; Jensen, M.; Itenfisu, D.; Mecham, B.; Howell, T.; Snyder, R.; Brown, P.; Echings, S. ASCE’s standardized reference evapotranspiration equation. In Proceedings of the Watershed management and operations management 2000, Fort Collins, CO, USA, 20–24 June 2000; pp. 1–11. [Google Scholar]
- Allen, R.G.; Pereira, L.S.; Raes, D.; Smith, M. Crop evapotranspiration-Guidelines for computing crop water requirements-FAO Irrigation and drainage paper 56. FaoRome 1998, 300, D05109. [Google Scholar]
- Fatideh, M.M.; Asil, M.H. Onion yield, quality and storability as affected with different soil moisture and nitrogen regimes. South Western J. Hortic. Biol. Environ. 2012, 3, 145–165. [Google Scholar]
- Belay, S.; Mideksa, D.; Gebrezgiabher, S.; Seifu, W. Yield Components of Adama Red Onion (Allium cepa L.) Cultivar as Affected by Intra-row Spacing Under Irrigation in Fiche Condition. Sci. Publ. Group 2015, 3, 75–79. [Google Scholar] [CrossRef]
- Fabeiro, C.C.; Martn, d.S.O.F.; Lopez, U.R. Production of garlic (Allium sativum L.) under controlled deficit irrigation in a semi-arid climate. Agric. Water Manag. 2003, 59, 155–167. [Google Scholar] [CrossRef]
- Kumar, S.; Imtiyaz, M.; Kumar, A. Effect of differential soil moisture and nutrient regimes on postharvest attributes of onion (Allium cepa L.). Sci. Hortic. 2007, 112, 121–129. [Google Scholar] [CrossRef]
- Huang, J.; Xu, C.-c.; Ridoutt, B.G.; Wang, X.-c.; Ren, P.-a. Nitrogen and phosphorus losses and eutrophication potential associated with fertilizer application to cropland in China. J. Clean. Prod. 2017, 159, 171–179. [Google Scholar] [CrossRef]
- Kabir, M.; Rahim, M.; Majumder, D.; Iqbal, T. Effect of mulching and tillage on yield and keeping quality of Garlic (Allium sativum L.). Bangladesh J. Agric. Res. 2013, 38, 115–125. [Google Scholar] [CrossRef]
- Awulachew, S.B.; Merrey, D.; Van Koopen, B.; Kamara, A. Roles, constraints and opportunities of small-scale irrigation and water harvesting in Ethiopian agricultural development: Assessment of existing situation. In Proceedings of the ILRI workshop, Morogoro, Tanzania, 7–9 March 2005; pp. 14–16. [Google Scholar]
- Patel, N.; Rajput, T. Effect of deficit irrigation on crop growth, yield and quality of onion in subsurface drip irrigation. Int. J. Plant Prod. 2013, 7, 417–436. [Google Scholar]
- Shock, C.C.; Feibert, E.B.; Saunders, L.D. Onion storage decomposition unaffected by late-season irrigation reduction. HortTechnology 2000, 10, 176–178. [Google Scholar] [CrossRef]
- Awulachew, S.B.; Lemperiere, P.; Tulu, T. Training Manual on Agricultural Water Management; International Livestock Research Institute: Nairobi, Kenya, 2009. [Google Scholar]
- Adekpe, D.; Shebayan, J.; Chiezey, U.; Miko, S. Yield responses of garlic (Allium sativum L.) to oxadiazon, date of planting and intra-row spacing under irrigation at Kadawa, Nigeria. Crop Prot. 2007, 26, 1785–1789. [Google Scholar] [CrossRef]
- Abrha, H.; Gebremedhin, Y. Evaluating local garlic (Allium sativum L.) accessions using multivariate analysis based on agro-morphological characters in Southern Tigray, Ethiopia. J. Nat. Sci. Res. 2015, 5, 211–215. [Google Scholar]
- Yeshiwas, Y.; Negash, B.; Walle, T.; Gelaye, Y.; Melke, A.; Yissa, K. Collection and characterization of garlic (Allium sativm L.) germplasm for growth and bulb yield at Debre Markos, Ethiopia. J. Hortic. For. 2018, 10, 17–26. [Google Scholar]
- Ayalew, A.; Tadesse, D.; Medhin, Z.G.; Fantaw, S. Evaluation of Garlic (Allium sativum L.) Varieties for Bulb Yield and Growth at Dabat, Northwestern Ethiopia. Open Access Libr. J. 2015, 2, 1. [Google Scholar] [CrossRef]
- Ahmed, I.; Khan, M.A.; Khan, N.; Ahmed, N.; Waheed, A.; Saleem, F.Y.; Khan, S.; Aslam, S. Impact of plant spacing on garlic rust (Puccinia allii), bulb yield and yield component of garlic (Allium sativum). Pak. J. Agric. Res. 2017, 30, 380–385. [Google Scholar]
- Woldetsadik, K.; Gertsson, U.; Ascard, J. Shallot yield, quality and storability as affected by irrigation and nitrogen. J. Hortic. Sci. Biotechnol. 2003, 78, 549–553. [Google Scholar] [CrossRef]
- Faradonbeh, M.M.; Mashhadi, A.A.; Bakhshandeh, A.; Jalal-abadi, A.L. Evaluation of the effects of different mulch material on quantity and quality yield of garlic populations (Allium sativum L.). Int. J. Agric. Crop Sci. 2013, 5, 2660. [Google Scholar]
- Doorenbos, J.; Kassam, A. Yield response to water. Irrig. Drain. Pap. 1979, 33, 257. [Google Scholar]
- Al-Jamal, M.; Ball, S.; Sammis, T. Comparison of sprinkler, trickle and furrow irrigation efficiencies for onion production. Agric. Water Manag. 2001, 46, 253–266. [Google Scholar] [CrossRef]
- Enciso, J.; Jifon, J.; Anciso, J.; Ribera, L. Productivity of Onions Using Subsurface Drip Irrigation versus Furrow Irrigation Systems with an Internet Based Irrigation Scheduling Program. Int. J. Agron. 2015, 2015, 1–6. [Google Scholar] [CrossRef]
- Kadayifci, A.; Tuylu, G.İ.; Ucar, Y.; Cakmak, B. Crop water use of onion (Allium cepa L.) in Turkey. Agric. Water Manag. 2005, 72, 59–68. [Google Scholar] [CrossRef]
- Enchalew, B.; Gebre, S.; Rabo, M.; Hindaye, B.; Kedir, M. Effect of Deficit Irrigation on Water Productivity of Onion (Allium cepal.) under Drip Irrigation. Irrig. Drain. Sys. Eng. 2016, 5, 2. [Google Scholar]
- Enciso, J.; Wiedenfeld, B.; Jifon, J.; Nelson, S. Onion yield and quality response to two irrigation scheduling strategies. Sci. Hortic. 2009, 120, 301–305. [Google Scholar] [CrossRef]
- Ells, J.; McSay, A.; Soltanpour, P.; Schweissing, F.; Bartolo, M.; Kruse, E. Onion irrigation and nitrogen leaching in the Arkansas Valley of Colorado 1990–1991. HortTechnology 1993, 3, 184–187. [Google Scholar] [CrossRef]
- Hanson, B.; May, D.; Voss, R.; Cantwell, M.; Rice, R. Response of garlic to irrigation water. Agric. Water Manag. 2003, 58, 29–43. [Google Scholar] [CrossRef]
- Sankar, V.; Lawande, K.; Tripathi, P. Effect of micro-irrigation practices on growth and yield of garlic (Allium sativum L.) var. G. 41. J. Spices Aromat. Crop. 2008, 17, 230–234. [Google Scholar]


| Soil Parameter | Soil Depth | |
|---|---|---|
| 0–30 cm | 30–60 cm | |
| pH (H2O) 1:2.5 | 6.0 ± 0.7 | 5.7 ± 0.7 |
| Cation Exchange Capacity CEC, cmol kg−1 | 25.0 ± 4.7 | 24.0 ± 4.7 |
| Available phosphorus P, mg kg−1 | 20.0 ± 14.1 | 6.9 ± 3.0 |
| Available potassium K, g kg−1 | 1.0 ± 0.6 | 0.7 ± 0.4 |
| Total Nitrogen, TN, g kg−1 | 0.2 ± 0.1 | 0.2 ± 0.1 |
| Field Capacity FC, cm3 cm−3 | 31.0 ± 3.5 | 28.0 ± 1.4 |
| Permanent wilting point PWP, cm3 cm−3 | 22.0 ± 4.2 | 21.5 ± 2.3 |
| Clay, g kg−1 | 39.0 ± 18.0 | 16.3 ± 4.4 |
| Silt, g kg−1 | 25.0 ± 4.9 | 23.3 ± 3.1 |
| Sand, g kg−1 | 36.0 ± 19.0 | 60.3 ± 6.1 |
| Bulk Density, g cm−3 | 1.1 ± 0.1 | 1.1 ± 0.2 |
| Year | Crop Type | Crop Parameters | Growth Stages | |||
|---|---|---|---|---|---|---|
| Initial | Development | Mid-Season | End | |||
| 2017 | Onion | Length of growth (days) | 20 | 45 | 35 | 20 |
| Crop coefficient (Kc) | 0.7 | 0.7–1.05 | 1.05 | 0.7 | ||
| 2018 | Garlic | Length of growth (days) | 20 | 50 | 30 | 20 |
| Crop coefficient (Kc) | 0.7 | 0.7–0.95 | 0.95 | 0.7 | ||
| Year | Crop | Activities | Date (Day/Month/Year) | Method |
|---|---|---|---|---|
| 2016/2017 | Adama Red Onion (Allium cepa L.) | Seedling | 2/11/2016 | Manual |
| Tillage * | 25/9/2016–30/3/2016 | Oxen and Manual | ||
| Transplanting | 20/12/2016 | Manual | ||
| Mulch application ** | 1/5/2017 | Manual | ||
| Irrigation | 20/12/2017–20/3/2017 | watering-Can | ||
| weeding/hoeing * | 20/1/2017, 29/2/2017, 16/3/2017 | Manual | ||
| Harvesting | 22/3/2018–25/3/2017 | Manual | ||
| 2017/2018 | Local garlic (Allium Sativium L.) | Tillage * | 9/10/2017–14/10/2017 | Oxen and Manual |
| Planting | 18/10/2017 | Manual | ||
| Mulch application ** | 27/10/2017 | Manual | ||
| Irrigation | 27/10/2017–26/1/2018 | watering-Can | ||
| weeding/hoeing * | 27/11/2017, 29/12/2017, 16/1/2018 | Manual | ||
| Harvesting | 26/2/2018 | Manual |
| Treatment * | Crop Stages | ||||
|---|---|---|---|---|---|
| Initial | Development | Mid-Season | End | Total | |
| Onion in 2016/2017 | |||||
| T1 | 136 a* | 219 a** | 122 a | 42 a | 520 a |
| T2 | 136 a | 219 a | 122 a | 42 a | 520 a |
| T3 | 157 b | 213 a | 141 b | 36 a | 548 a |
| P-value | 0.04 | 0.80 | 0.09 | 0.50 | 0.40 |
| LSD(α = 0.05) | 20.80 s | 35.4 ns | 23.0 ns | 19.2 ns | 66.8 ns |
| Garlic in 2017/2018 | |||||
| T1 | 48 a | 120 a | 59 a | 33 a | 260 a |
| T2 | 55 ab | 142 ab | 73 ab | 39 ab | 309 ab |
| T3 | 70 b | 194 c | 86 bc | 50 bc | 420 c |
| P-value | 0.0025 | 0.0004 | 0.017 | 0.015 | 0.00095 |
| LSD(α = 0.05) | 15.14 | 43.6 15.14 | 22.52 | 15.91 | 87.72 |
| Treatment | Irrigation Interval (days) | Irrigation Depth per Application (mm) | Number of Irrigations |
|---|---|---|---|
| Onion—2016/2017 | |||
| T1 * | 2 | 5–8 | 80–70 |
| T2 | 2 | 5–8 | 80–70 |
| T3 | 1–4 | 4–10 | 90–60 |
| Garlic—2017/2018 | |||
| T1 | 3 | 6–8 | 40 |
| T2 | 3 | 8–10 | 40 |
| T3 | 2–4 | 5–13 | 50 |
| Treatments | Applied Water (mm) | Yield (kg) | Yield (t ha−1) | IWUE (kg m−3) |
|---|---|---|---|---|
| Onion 2016/2017 | ||||
| T1 | 520 a | 54.7 a | 24.3 a | 4.42 a |
| T2 | 520 a | 40.1 b | 17.9 b | 3.24 b |
| T3 | 548 a | 65.1 c | 14.9 b | 2.40 b |
| P-value | 0.4 | <0.01 | 0.12 | 0.00004 |
| LSD (0.05) | 66.8 | 8.5 | 3.4 | 0.77 |
| Garlic 2017/2018 | ||||
| T1 | 260 a | 15.2 a | 5.3 a | 1.9 a |
| T2 | 309 ab | 11.0 bc | 3.8 a | 1.2 bc |
| T3 | 420 c | 12.6 ac | 3.8 a | 1.3 c |
| P-value | 0.00095 | <0.01 | 0.187 | 0.006 |
| LSD (0.05) | 87.7 | 3.1 | 1.7 | 0.5 |
| References | Location | Type of Experiment | Experimental Crop | Treatment Type | Irrigation Method | Applied Water (mm) | Yield (t ha−1) | IWUE (kg m−3) |
|---|---|---|---|---|---|---|---|---|
| [46] | Los Ebanos, Texas, USA | commercial | onion | irrigation methods | surface drip | 359 | 62.9 | 17.5 |
| [46] | Los Ebanos, Texas, USA | commercial | onion | irrigation methods | furrow | 677 | 28.7 | 4.2 |
| [47] | Arkansas, USA | commercial | onion | irrigation methods | furrow | 640 | 35.0 | 5.5 |
| [4] * | Sekota, Ethiopia | station | onion | irrigation scheduling | Drip | 278 | 25.0 | 9.0 |
| [27] | Abohar, Punjab, India | station | onion | deficit irrigation | Micro-sprinkler | 275 | 19.0 | 6.9 |
| [27] | Abohar, Punjab, India | station | onion | deficit irrigation | Micro-sprinkler | 467 | 36.0 | 7.7 |
| [31] | India | station | onion | deficit irrigation | Subsurface | 563 | 44.4 | 7.9 |
| [31] | India | station | onion | deficit irrigation | Subsurface drip | 328 | 28.1 | 8.6 |
| [46] | Los Ebanos, Texas, USA | station | onion | deficit irrigation | Subsurface drip | 389 | 42.0 | 10.8 |
| [46] | Los Ebanos, Texas, USA | station | onion | deficit irrigation | Subsurface drip | 292 | 39.0 | 13.4 |
| [44] | Turkey | GH pot 1 | onion | deficit irrigation | sprinkler | 190–680 | 4.4–27 | 2.2–5.6 |
| [45] | Jima, Ethiopia | On-farm | onion | Variety | Drip | 315 | 6.9 | 2.2 |
| [48] | California, USA | On-farm | Garlic | Irrigation Interval | 1 week | 350 | 21.3 | 6.1 |
| [48] | California, USA | On-farm | Garlic | irrigation interval | 1.5 week | 300 | 19.1 | 6.4 |
| [29] | Mymensingh, Bangladesh | station | Garlic | CA | drip | 446 | 7.8 | 1.7 |
| [29] | Mymensingh, Bangladesh | station | Garlic | CA | drip | 546 | 6.8 | 1.2 |
| [34] | Kadawa, Nigeria | station | Garlic | planting spacing | drip | 425 | 15.3 | 3.6 |
| [49] | Pune, India | station | Garlic | Deficit irrigation | Micro sprinkler | 249 | 7.5 | 3.0 |
| [49] | Pune, India | station | Garlic | Deficit irrigation | Micro sprinkler | 374 | 10.8 | 2.9 |
| [49] | Pune, India | station | Garlic | Deficit irrigation | Micro sprinkler | 498 | 12.9 | 2.6 |
© 2019 by the authors. Licensee MDPI, Basel, Switzerland. This article is an open access article distributed under the terms and conditions of the Creative Commons Attribution (CC BY) license (http://creativecommons.org/licenses/by/4.0/).
Share and Cite
Belay, S.A.; Schmitter, P.; Worqlul, A.W.; Steenhuis, T.S.; Reyes, M.R.; Tilahun, S.A. Conservation Agriculture Saves Irrigation Water in the Dry Monsoon Phase in the Ethiopian Highlands. Water 2019, 11, 2103. https://doi.org/10.3390/w11102103
Belay SA, Schmitter P, Worqlul AW, Steenhuis TS, Reyes MR, Tilahun SA. Conservation Agriculture Saves Irrigation Water in the Dry Monsoon Phase in the Ethiopian Highlands. Water. 2019; 11(10):2103. https://doi.org/10.3390/w11102103
Chicago/Turabian StyleBelay, Sisay A., Petra Schmitter, Abeyou W. Worqlul, Tammo S. Steenhuis, Manuel R. Reyes, and Seifu A. Tilahun. 2019. "Conservation Agriculture Saves Irrigation Water in the Dry Monsoon Phase in the Ethiopian Highlands" Water 11, no. 10: 2103. https://doi.org/10.3390/w11102103
APA StyleBelay, S. A., Schmitter, P., Worqlul, A. W., Steenhuis, T. S., Reyes, M. R., & Tilahun, S. A. (2019). Conservation Agriculture Saves Irrigation Water in the Dry Monsoon Phase in the Ethiopian Highlands. Water, 11(10), 2103. https://doi.org/10.3390/w11102103