Article

Laboratory Experimental Investigation on the Hydrodynamic Responses of an Extra-Large Electrical Platform in Wave and Storm Conditions

1
Power China Huadong Engineering Corporation Limited, Hangzhou 310014, China
2
Offshore Wind Power R&D Center of Power China Huadong, Hangzhou 310014, China
3
State Key Laboratory of Coastal and Offshore Engineering, Dalian University of Technology, Dalian 116024, China
*
Author to whom correspondence should be addressed.
Water 2019, 11(10), 2042; https://doi.org/10.3390/w11102042
Submission received: 8 September 2019 / Revised: 27 September 2019 / Accepted: 28 September 2019 / Published: 29 September 2019
(This article belongs to the Special Issue Interaction between Waves and Maritime Structures)

Abstract

:
The application of electrical platform for converter station in offshore wind farm is highly forward-looking and strategic. The offshore electrical platform is complicated in structure, bulky in volume, and expensive in cost. In addition, the built-in electrical equipment is very sensitive to the acceleration response. Therefore, it is very important to study the hydrodynamic response of the electrical platform exposed in the open sea. Based on the elastic similarity, Froude similarity, as well as the flexural-stiffness similarity of the cross-section, the hydroelastic similarity was derived to guide the model test of a 10,000-ton offshore electrical platform in wind, wave, and current. The hydrodynamic responses including strain and acceleration at key positions of the structure were obtained for different incident angles of external environmental loads. The experimental results showed the increase of water depth can cause more than 10 times increase of strain and acceleration response of the platform. The attack angle of external environmental loads had no definite relationship with strain response of the structure. Therefore, the most dangerous attack angle cannot be determined. The strain of the structure under the combined action of wind, wave, and flow was significantly larger than that under wave load only.

1. Introduction

The wind power is clean renewable energy. The development of wind power, especially offshore wind power, plays a decisive role in accelerating the green energy transformation in coastal areas. In view of the trend of large capacity and long distance of offshore wind farm, the application of electrical platform for offshore converter station is highly forward-looking and strategic. The offshore electrical platform is complicated in structure, bulky in volume, and expensive in cost. In addition, as the load-bearing structure of the electrical equipment in the offshore wind farm, the offshore electrical platform, which is a typical top-heavy structure, is characterized by a large number of electrical equipment arranged on the deck. The dynamic effect of the superstructure will aggravate the vibration of the structure, which will lead to fatigue and even failure of the jacket structure. Therefore, it needs to ensure its own safety exposed in the external environment load in open sea. Wave load is one of the most common environmental loads of offshore electrical platform structure, which is directly related to the selection and design of offshore electrical platform. Especially when the natural vibration frequency of the structure is close to the frequency of dynamic load of wave, it is easy to cause structural damage or collapse. Resonance will aggravate the stress and deformation of the structure and seriously threaten the safety and reliability of offshore electrical platform. Therefore, it is very important to accurately estimate the wave load and the response of the electrical platform structure in waves.
The main supporting structure of the offshore electrical platform is jacket foundation. There have been systematic researches on the dynamic characteristics of jacket foundation. Elshafey et al. [1] studied the dynamic response characteristics of a jacket platform in air and water by combining physical model test with theoretical analysis and focused on the impact of platform weight and wave load on the pile foundation. Dong et al. [2] calculated the dynamic response of the jacket support structure under wind and wave loads using a decoupled procedure and performed long-term fatigue analysis of welded multiplanar tubular joints for a fixed jacket offshore wind turbine. Park et al. [3] used the finite element method and Morison equation to analyze the hydrodynamic response of a jacket platform under wave and current action. The displacement response of the offshore platform under random wave action was analyzed with NEWMARK algorithm. Taylor et al. [4] and Santo et al. [5,6] conducted systematic studies on the shielding effect of the jacket platform and its influence characteristics on the drag force on the platform. Saha et al. [7] obtained short-term extreme values for the dynamic responses of offshore fixed wind turbines by using the aerodynamic software HAWC2 and the hydrodynamic software USFOS. Raheem et al. [8] and Zadeh et al. [9] investigated the effect of geometric nonlinearity and wave nonlinearity on the motion response of the jacket offshore platform, respectively.
Besides the offshore oil platform, the jacket structure is also commonly used as the foundation for the offshore wind turbine. Devaney et al. [10] conducted mathematical modeling of linear and nonlinear waves combined with the Morison equation to check the breaking wave loads and stress analysis of jacket structures supporting offshore wind turbines. Dezvareh et al. [11] suppressed wind/wave-induced vibrations of jacket-type offshore wind turbines by placing a passive vibration absorber. Wang et al. [12] conducted model test and numerical analysis of an offshore wind turbine under seismic, wind, wave, and current loads. Wei et al. [13] studied the effect of structural dynamics on the response of an offshore wind turbine supported by a jacket and subjected to wave loads. Gho et al. [14] presented an eccentric jacket substructure for offshore wind turbines to better withstand intense environmental forces and to replace conventional X-braced jackets in seismically active areas. Liu et al. [15] developed a novel frequency-domain transient response estimation method to obtain reliable estimations of the dynamic responses of offshore wind turbines with obvious nonzero initial conditions.
At present, the research on the dynamic characteristics of jacket structure under wave load tend to be systematic; however, there are few relevant researches on the dynamic characteristics of electrical platform under complex sea conditions. Due to the top-heavy characteristic of the offshore electrical platform, the superstructure may cause significant dynamic amplification effect. Therefore, it is necessary to systematically study the dynamic characteristics of the electrical platform in waves and storm condition.

2. Materials and Methods

2.1. Experimental Model Similarity

Considering the dimensions of the electrical platform, marine hydrological parameters, and laboratory conditions, the geometric scale of this test model was 1:60. The model similarity criterion is the key to this research. Besides, the structural vibration should satisfy the elastic similarity as follows [16]:
λρ·λA·λ3·λu·λt−2 = λI·λE·λu·λ−3,
where λρ is density scale, λ is geometric scale, λu is deformation scale, λE is elastic modulus, λt is time scale, λA is sectional area scale, and λI is sectional moment of inertia scale.
For a structure dominated by bending vibration, the elastic similarity law can be rewritten as follows:
λt2 = λ4·λρ·λE−1·λr−2,
where λr is radius of inertia scale.
Froude number similarity is expressed as follows [17]:
λv = λ0.5,
where λv is speed scale.
Considering acceleration scale is λg = 1, thus,
λt = λ0.5,
Combining the Equations (2) and (4), and simultaneously satisfy elastic similarity and Froude number similarity, the hydroelastic similarity can be given as follow:
λ3·λr−2 = λE,
This hydroelastic similarity is the main criterion for the design of the experimental model.

2.2. Mechanical Test of the Experimental Material

Based on the hydroelastic similarity and the previous experience on physical model test, plexiglass was selected as the material for the experimental model of the electrical platform. To obtain the basic material parameters of plexiglass, the mechanical test was carried out for the selected plexiglass which was used to make the platform model.
Cuboid specimens with a length of 200 mm, a width of 25 mm, and a thickness of 2 mm, 3 mm, 3.6 mm, and 5 mm were produced. Two pieces of each specimen were duplicated. The density of the specimen was calculated according to the mass and geometric size of the specimen, and the average value of all specimens was taken as the density of the plexiglass. The average density of organic glass materials was 1201.2 kg/m3. Standard specimens with thickness of 3 mm, 4 mm, 5 mm, and 10 mm were produced with 4 duplicates for each specimen. A universal testing machine was used to determine the static elastic modulus and Poisson ratio of plexiglass by uniaxial tensile test. The average values of static modulus and Poisson ratio of all specimens were taken as the material parameters of plexiglass. The static elastic modulus and Poisson ratio of plexiglass were 2.62 GPa and 0.42, respectively. For the dynamic model test of the electrical platform in this study, the dynamic elasticity modulus of the material should also be considered. The dynamic elasticity modulus can be calculated by measuring the fundamental frequency of a cantilever beam with rectangular section according to the formula as follow.
E’ = 4π2ρAL4f2/(3.5152I),
where E’ is radius of inertia scale, ρ is the material density, A is the sectional area, L is the length of the cantilever specimen, I is the cross-sectional moment of inertia, and f is the fundamental frequency of the specimen. Rectangular specimen with thickness of 3 mm, 4 mm, 5 mm, 7 mm, and 9 mm were prepared. One end of the specimen was fixed and restrained, and an impact load was applied to the top of the other end of the specimen. The time history of strain response of the specimen was collected, and the fundamental frequency of the specimen was obtained by frequency domain analysis. The dynamic elasticity modulus of plexiglass was 3.91 GPa.

2.3. Experimental Model Design

The prototype structural material is steel with elastic modulus of 206 GPa. The dynamic elastic modulus of plexiglass for the experimental model is 3.91 GPa. Therefore, the elastic modulus scale is 52.69 and the ratio of section radius of inertia is 64.027. The similarity relations of other parameters are summarized in Table 1. Some of the similarities relations related to section are taken platform leg as an example.
The geometric dimensions of each component of the platform model are determined according to the geometric scale and the inertia radius scale. Schematic diagram of the electrical platform is shown in Figure 1. The parameters of the superstructure model are shown in Table 2. The jacket structure mainly consists of cylindrical steel pipes. Both the length and outer diameter of the members and the pile legs are scaled by the geometric scale of 1:60; therefore, the hydrodynamic characteristics of the platform can be simulated accurately. The pipe section of the pile leg was calculated according to the area scale to achieve the accurate simulation of the elastic response of the structure (see Table 3).
Due to the material difference between the prototype and model platform, the weight distribution on the platform is different. Thus, in this study, lead is used to balance each component of the model structure. For the structural mass of the model component, the weight is scaled according to the mass scale. For the nonstructural mass, such as the weight of the equipment, it is scaled as force. In this way, both gravity similarity and hydroelastic similarity are satisfied. Finally, the balance weight was 274.4 kg for the superstructure and 142.83 kg for the jacket model. The total weight of the platform model was 502.5 kg.
In this study, the foundation of the electrical platform consisted of piles. However, in the laboratory test, the soil data is difficult to be determined. Therefore, it is necessary to adopt a simplified approach instead. The equivalent pile method was used to simulate the pile–soil interaction of converter station [18]. Firstly, the finite element model was established to simulate the nonlinear characteristics between pile and soil based on the p-y method. Then, taking the structural basic frequency as the constraint condition, the relationship between the equivalent pile length and pile diameter was determined by adjusting the equivalent pile length. In this study, the equivalent pile length of the electrical platform model is determined to be 5.82 times the pile diameter.

2.4. Experimental Set-Up

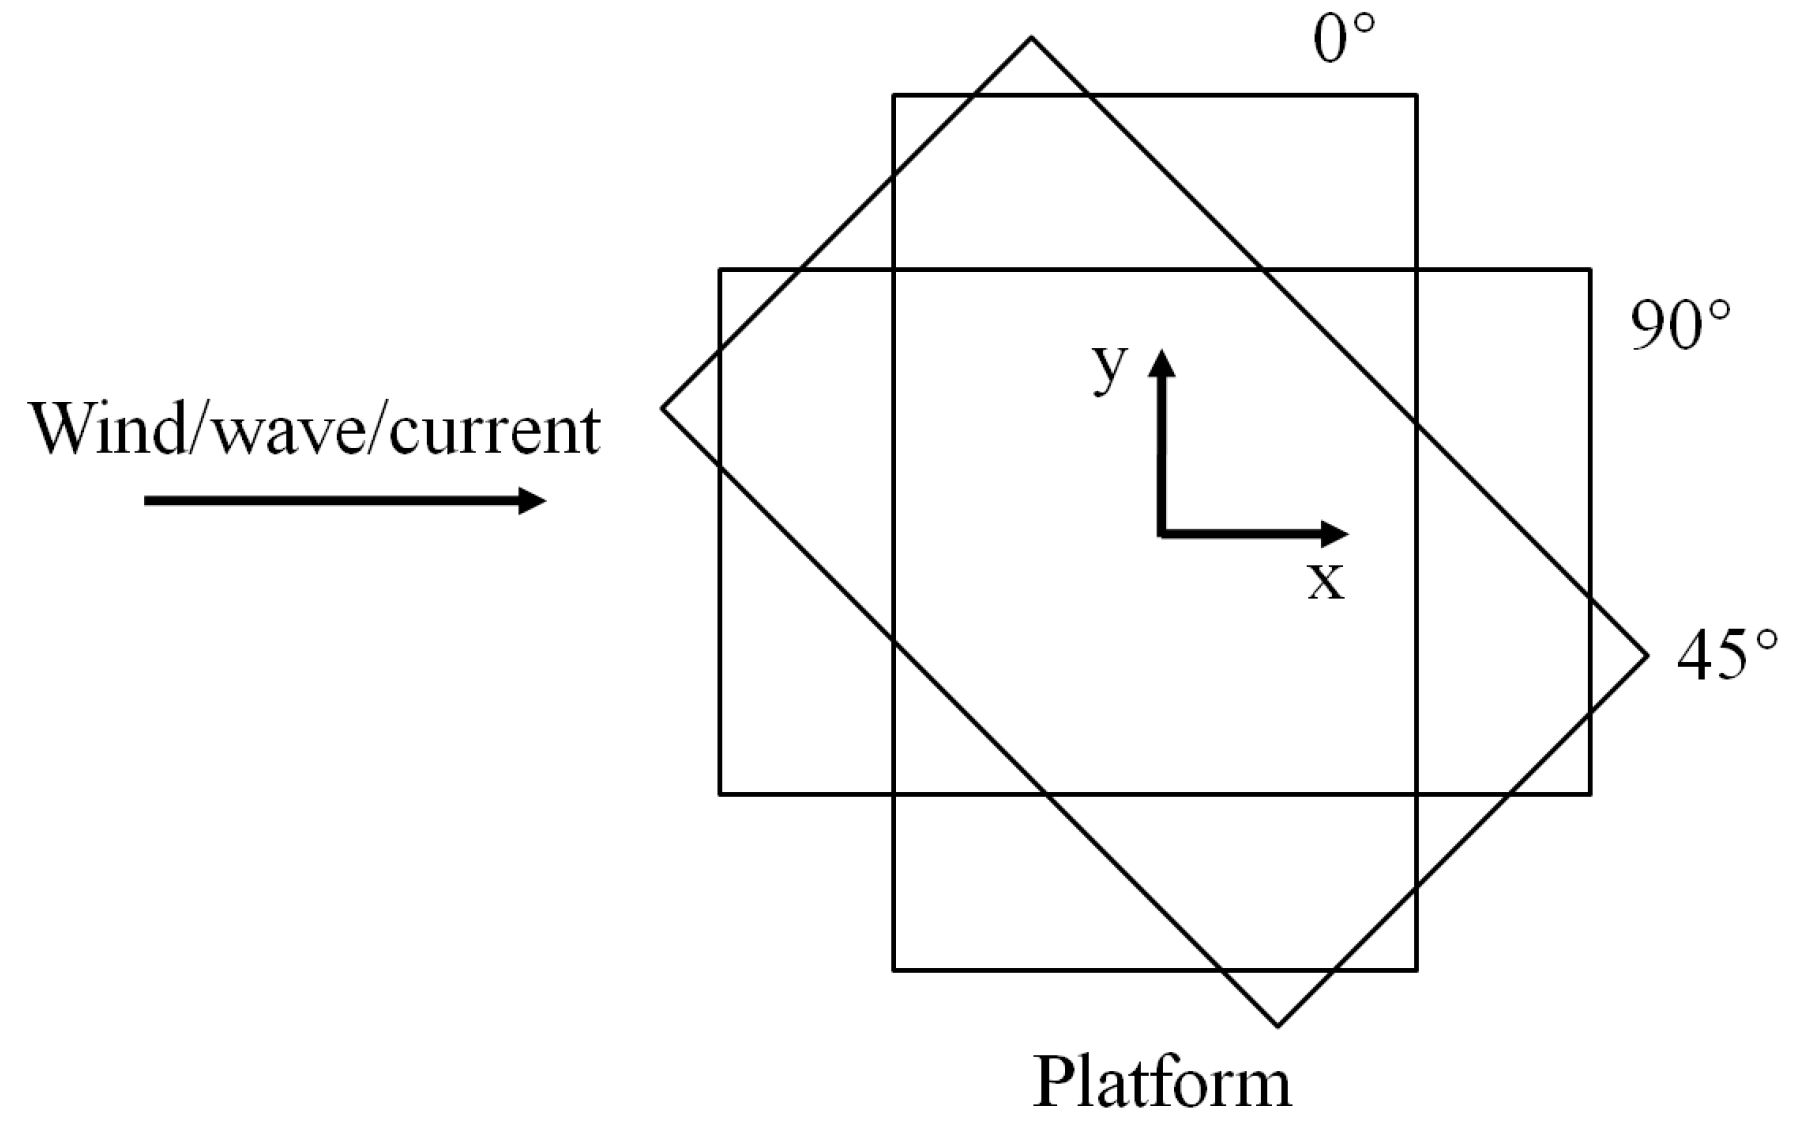
The laboratory experiments were conducted in a wave and current flume at the State Key Laboratory of Coastal and Offshore Engineering (SLCOE), Dalian University of Technology, Dalian, China. The flume is 60 m long, 4.0 m wide, and 2.5 m deep. The flume is equipped with wind, current, and wave systems. In the actual sea area, the electrical platform may be subjected to wave, current, and wind from various directions, resulting in the electrical platform being subjected to loads in different directions. In this test, three incident directions of external loads, namely 0°, 45°, and 90°, are adopted to analyze the hydrodynamic response of the electrical platform (see Figure 2). The electrical platform model and its layout in wave flume are shown in Figure 3.
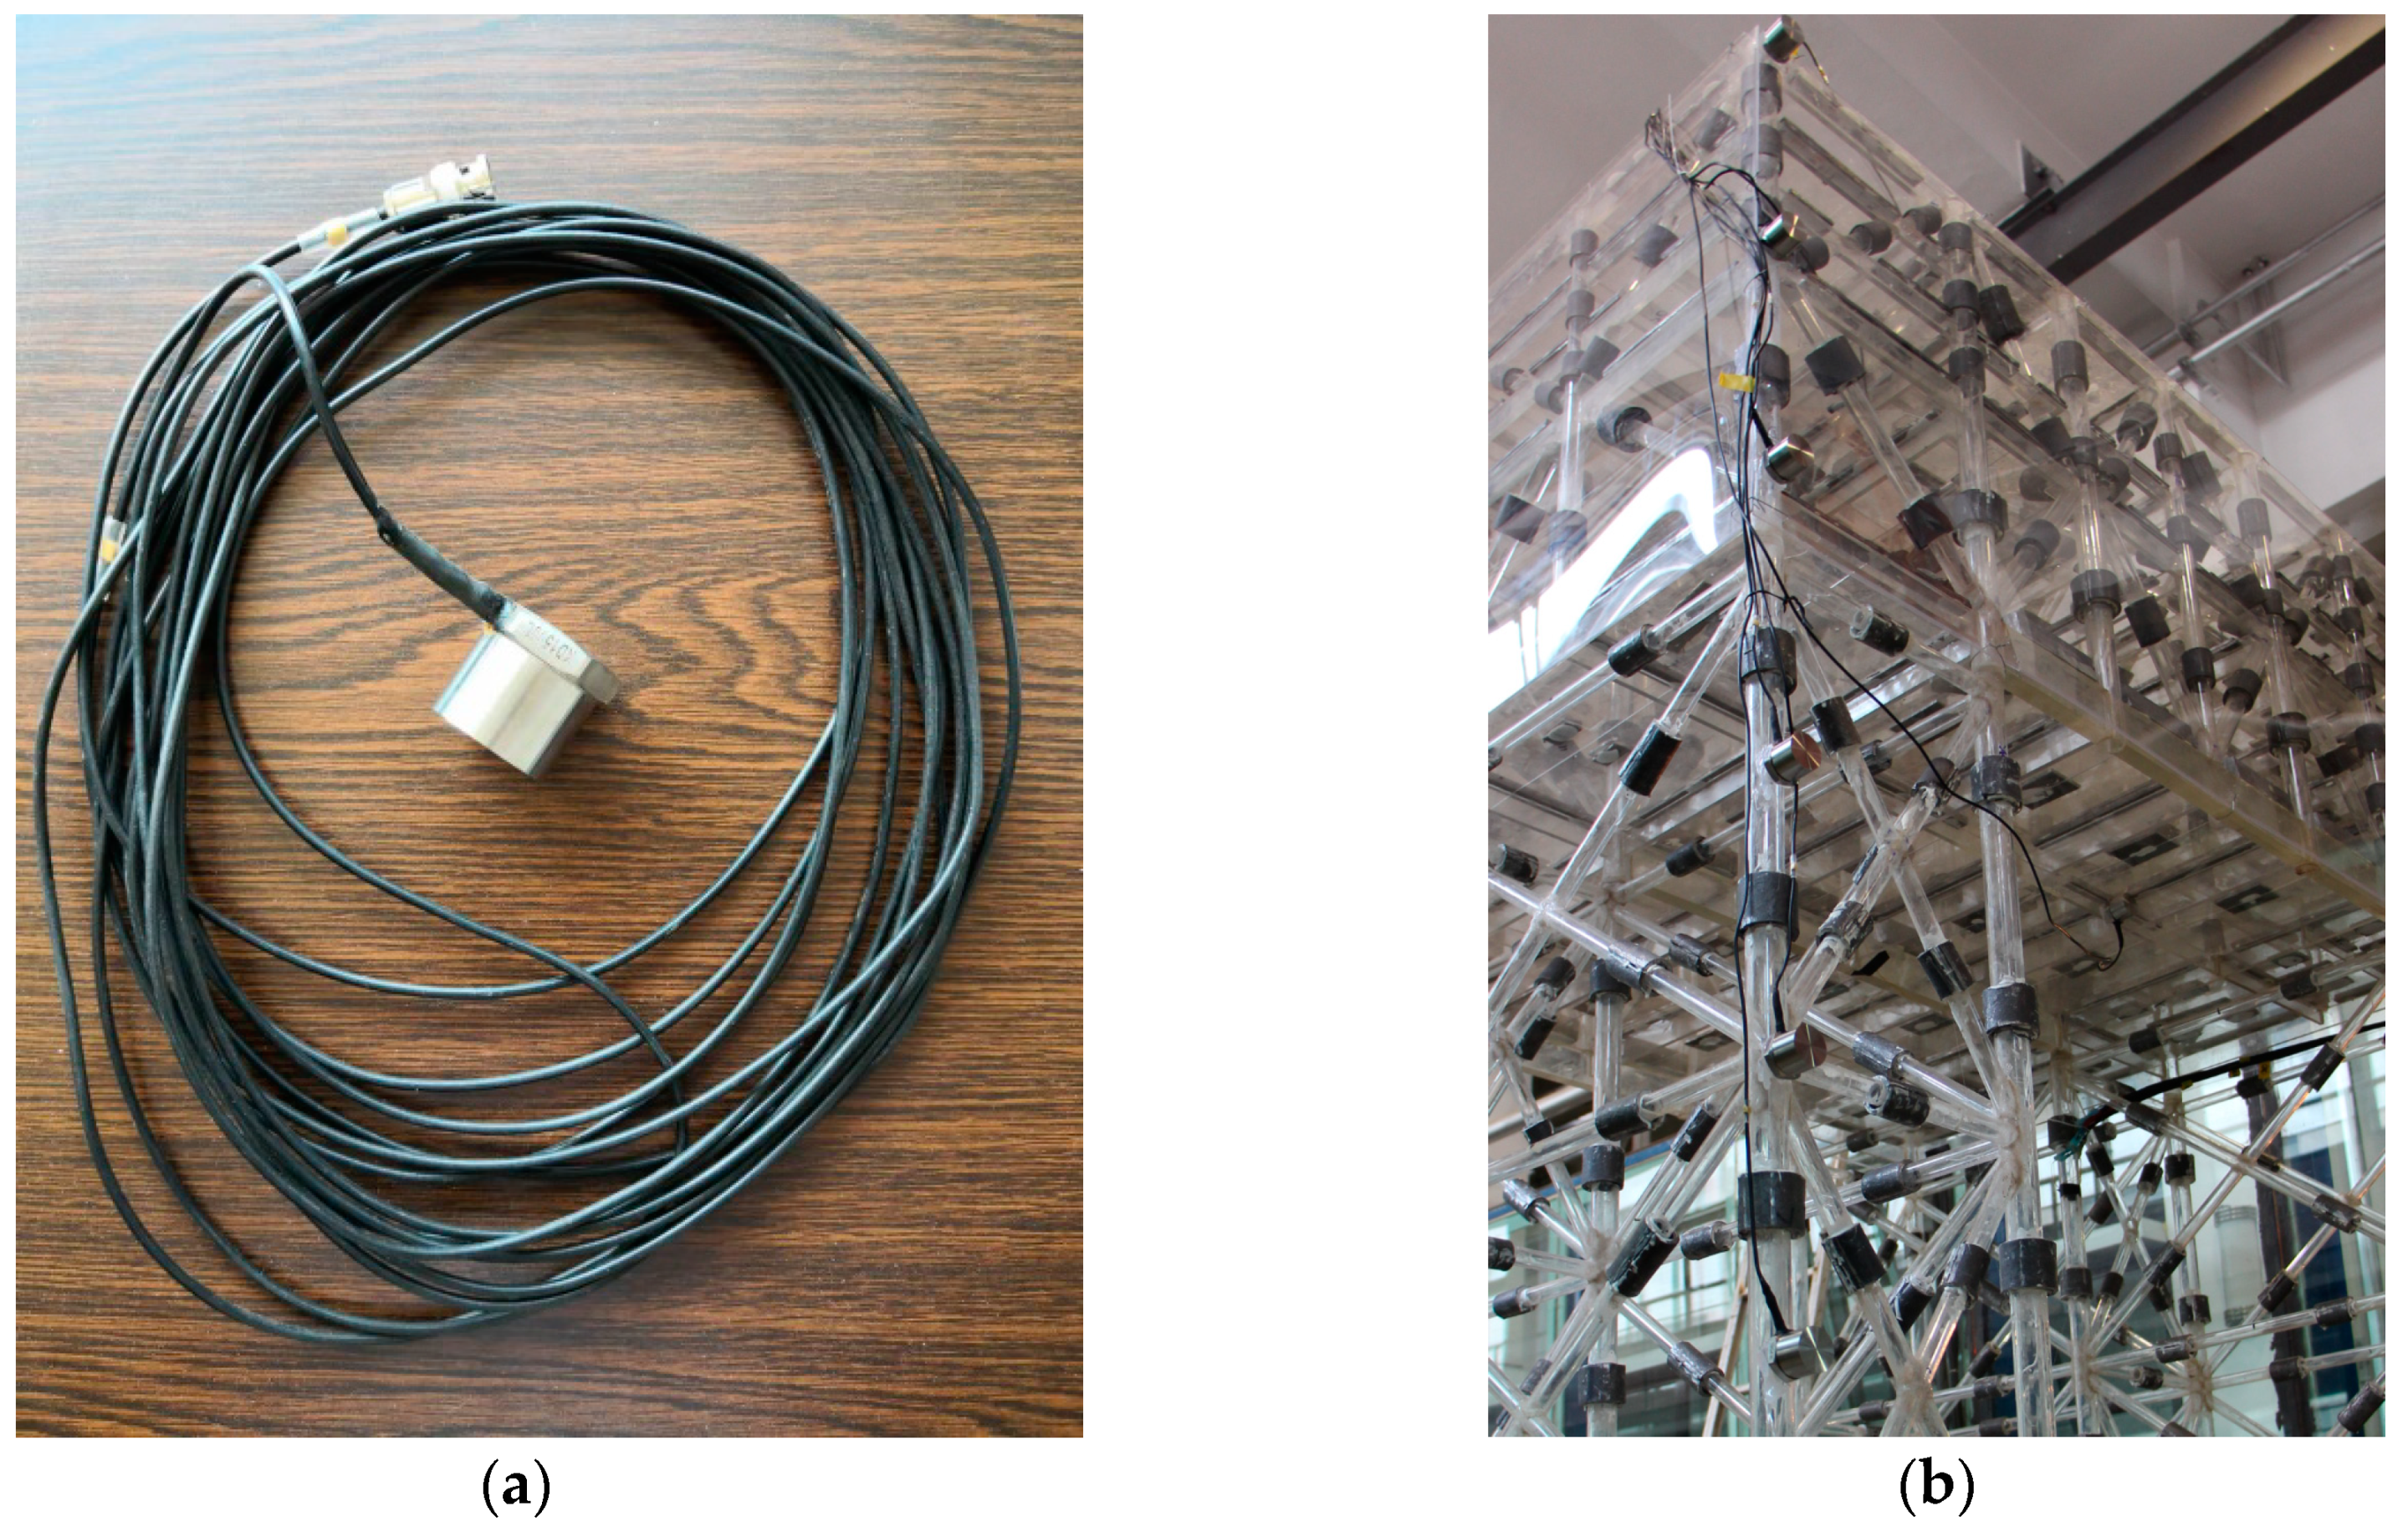
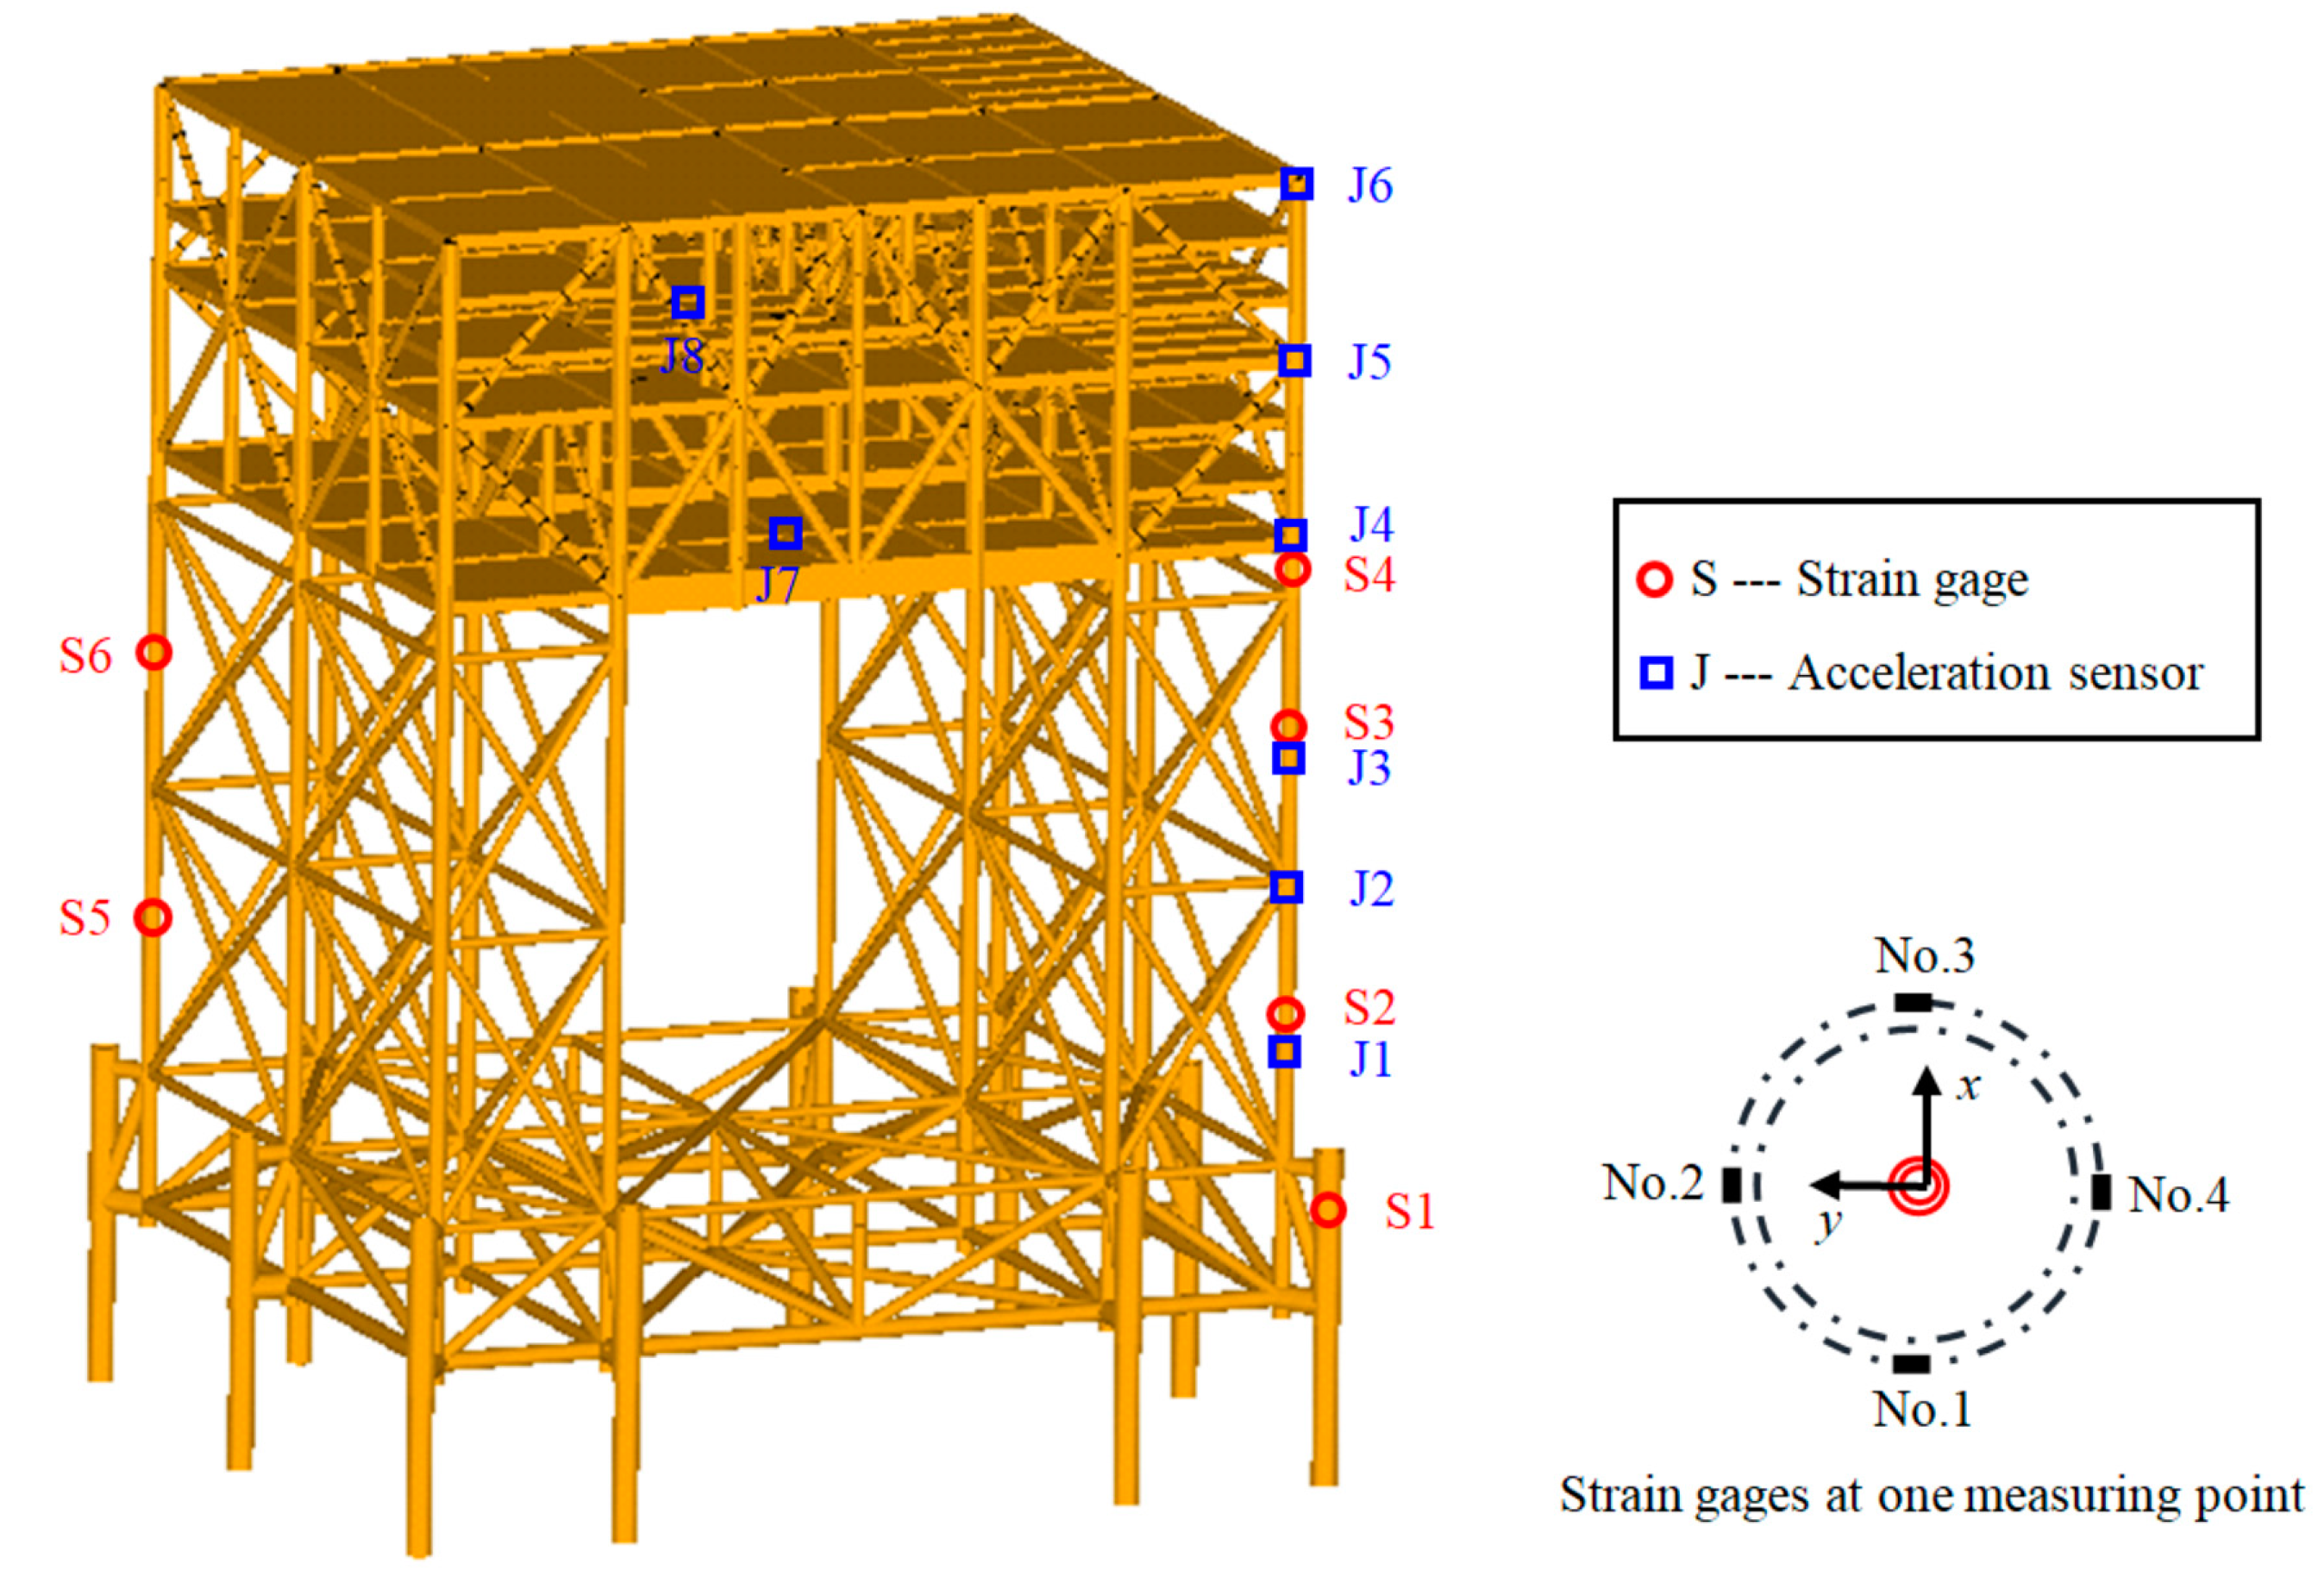
In the physical model test, wave parameters were measured by capacitive wave gauge with a measuring range of 35 cm and a relative error of 0.5%. Wave height and period can be collected and calculated automatically with the wave height acquisition system. The ADV current meter of Nortek company was used for velocity collection. The sampling rate of this instrument was 200 Hz, the measuring range was 1 m/s, and the measured accuracy was 0.5%. The laboratory adopts blowers to generate wind, and the measurement of wind speed is carried out by a thermal anemometer. The measuring range is 0.3~30 m/s, and the measuring precision can be controlled within 1%. A NI (National instruments) data acquisition instrument was used to collect strain data at key positions of the structure in combination with strain gauge. The waterproof acceleration sensor is adopted to measure the acceleration response of key positions at the platform structure (see Figure 4). The measuring range of the acceleration sensor is 1.0 g and the accuracy is approximately 0.3%. The measuring frequency is up to 1000 Hz, which has high stability and anti-interference ability. The arrangement of measuring points in physical model test is very important for obtaining effective data. The data of measuring points can reflect the load on the weak position of the electrical platform. If the measuring points are not arranged reasonably, the validity and reference value of the data will be reduced. This study determined key nodes and positions of the electrical platform using the finite element analysis. The strain gauge and the acceleration sensor were arranged as shown in Figure 5.

2.5. Experimental Conditions

The normal water depth of the electrical platform is 52 m, corresponding to the water depth during the model experiment of 0.87 m. Considering the length of the equivalent pile and the thickness of the fixed bottom plate, the actual water depth is set as 1.17 m in the experiment. In order to obtain the hydrodynamic responses of the electrical platform under storm condition, a test water depth of 1.45 m, corresponding to the extreme depth of 68.8 m, was added to carry out the storm condition test.
To analyze the hydrodynamic characteristics of the electrical platform, a series of regular waves were designed in the test, as shown in Table 4. The waves include five different wave heights and five different wave periods. The storm condition was modeled using combined action of wind, current, and irregular wave (see Table 5) with deeper water depth. In this way, the hydrodynamic characteristics of the electrical platform under extreme load can be considered. This experiment was conducted with the three kinds of environmental loads acting in the same direction, which was considered as most dangerous condition for the platform structure. The wind speed, current speed, significant wave height, and wave period for an irregular wave are shown in Table 6. During the test, the current was generated first using the circulation flow system. After the current speed reached a stable level, the wind was generated. Finally, wave was generated.

3. Results

3.1. Strain Response of Electrical Platform

3.1.1. The Electrical Platform in Regular Waves

Under the water depth of operating condition, the dynamic responses of the electrical platform in regular waves are studied. Strain gauges were used to collect the strain response of structural piles. Taking the measurement results of four strain gauges at measuring point S5 at 0° angle of attack as an example, the time-history curves of structural strain response measured by different strain gauges along the circumference of a pile leg are shown in Figure 6. It can be seen from the experimental results that the strain-response value of strain gauge No. 1 at the measuring point S5 is greater than that of the other three strain gauges at the same measurement position. Similarly, the strain response of strain gauge No. 1 at position S6 is greater than that of other strain gauges. The strain response of strain gauge No. 3 at positions S1, S2, S3, and S4 is larger than that of other strain gauges. This is mainly due to the relative position of the measuring points. Measuring points S1, S2, S3, and S4 are on the wave side of the platform, while S5 and S6 are on the leeward side of the structure.
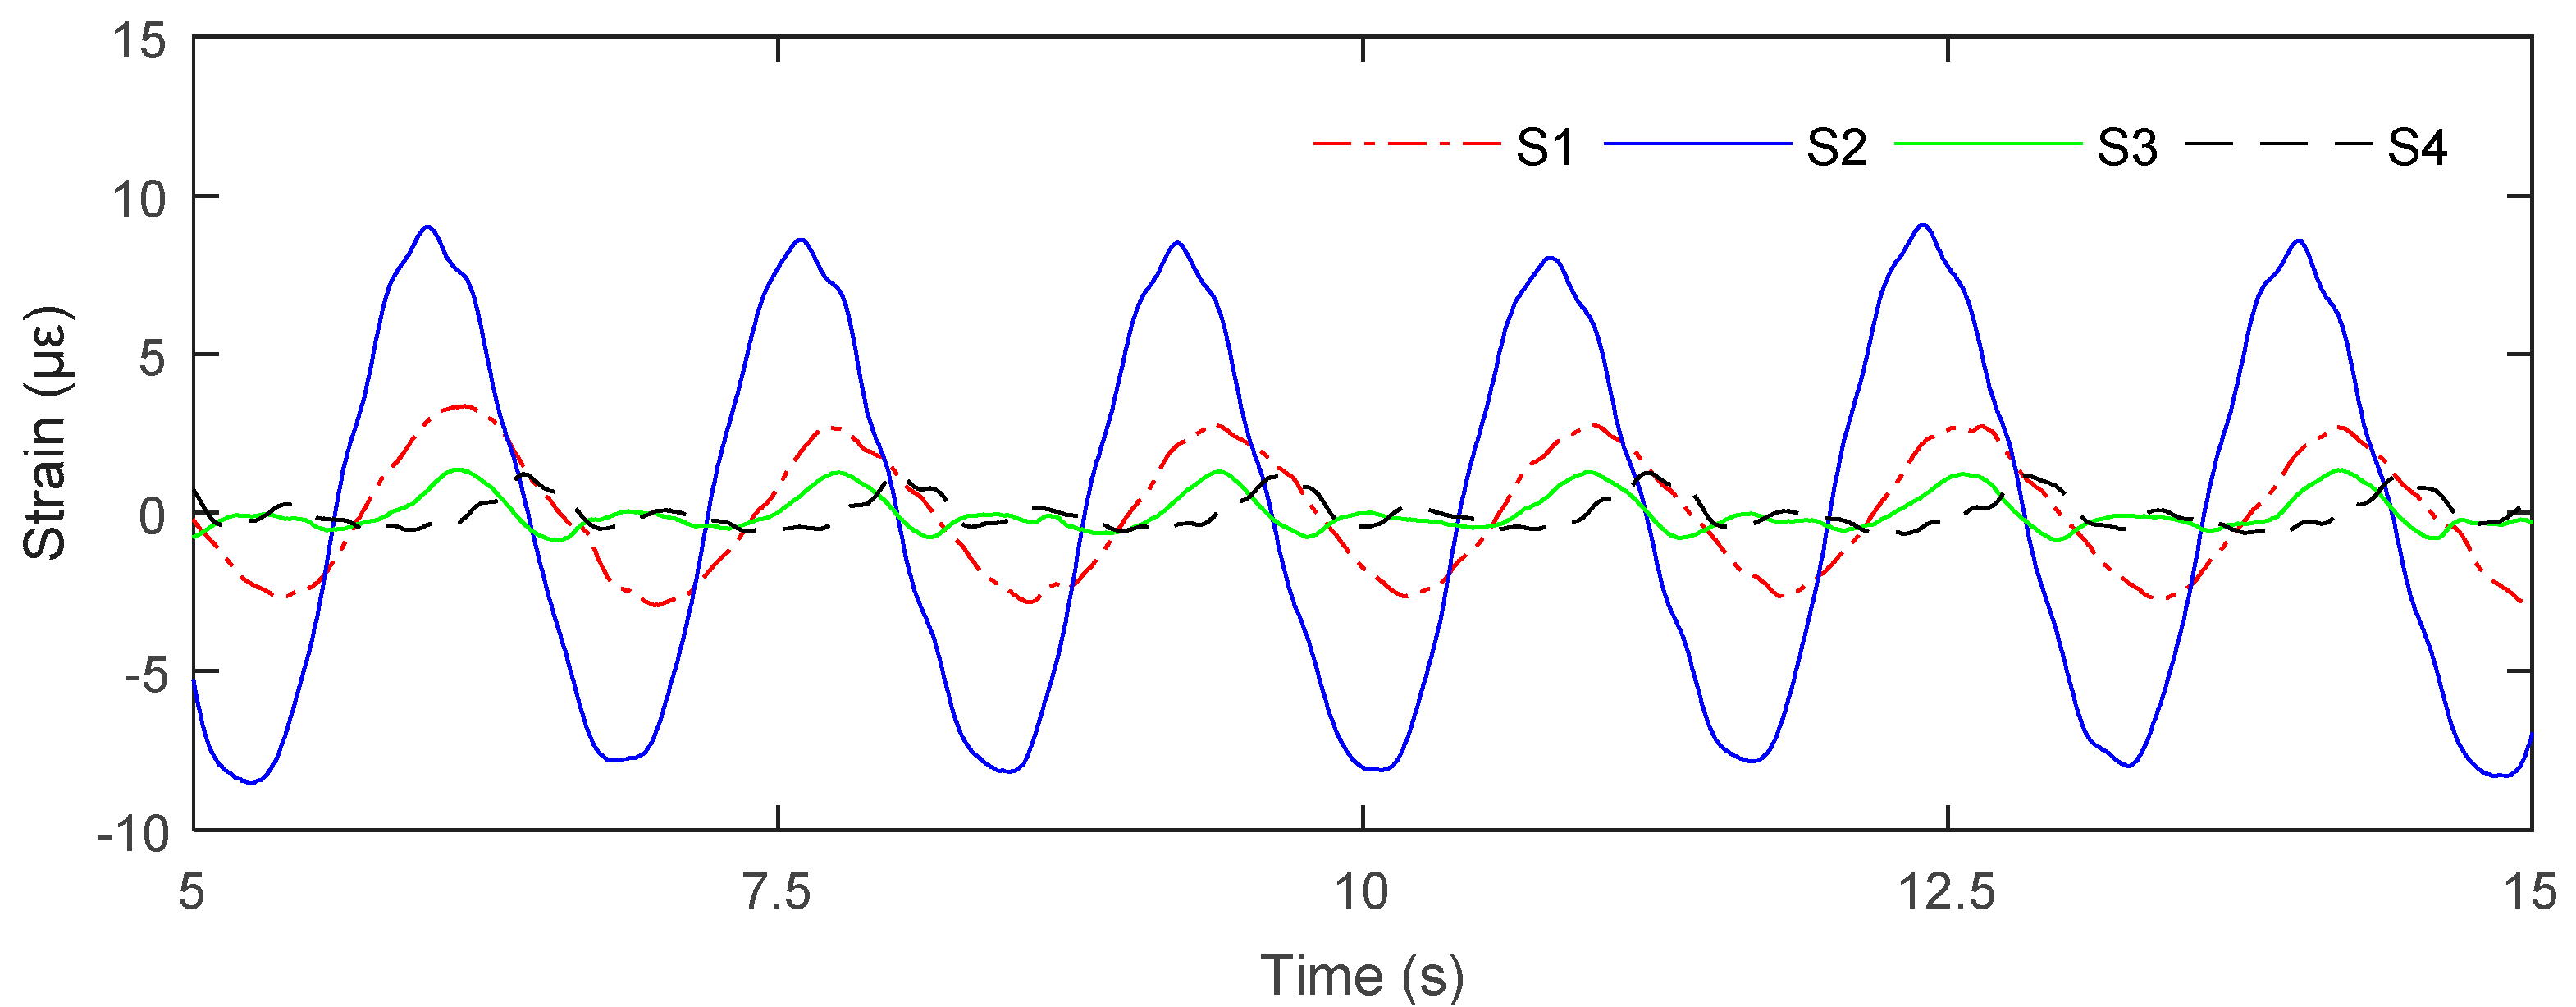
The time-history responses of strain at different positions on the pile leg of the electrical platform are shown in Figure 7. The maximum value of strain at measuring points S2, S3, and S4 decreases along with the height of the structure. The maximum strain at measuring point S1 is less than that at S2. Take the maximum value of strain peaks of four strain gauges at the same measuring point as the peak value of strain response at a measurement position. The experimental results show that the strain-response values at the measuring points 2, 3, and 4 on the same pile leg gradually decrease with the increase of the height (see Table 7).
Taking the test conditions with a period of 1.6 s as an example, the maximum strain at measuring points 1, 2, 3, and 4 changes with wave height, as shown in Figure 8a. Within the range of wave height of 0.25 m, the structural strain response increases with increasing wave height. For wave height of 0.15 m, the results of maximum strain at measuring points 1, 2, 3, and 4 are shown in Figure 8b. Overall, the strain value of the structure increases with the increase of wave height. The experimental results show that the strain response at the measuring points 1 and 2 increases with the increase of the wave period from 1.0 to 1.8 s. However, the strain response at measuring points 3 and 4 is not sensitive to the wave period.

3.1.2. The Electrical Platform in Storm Condition

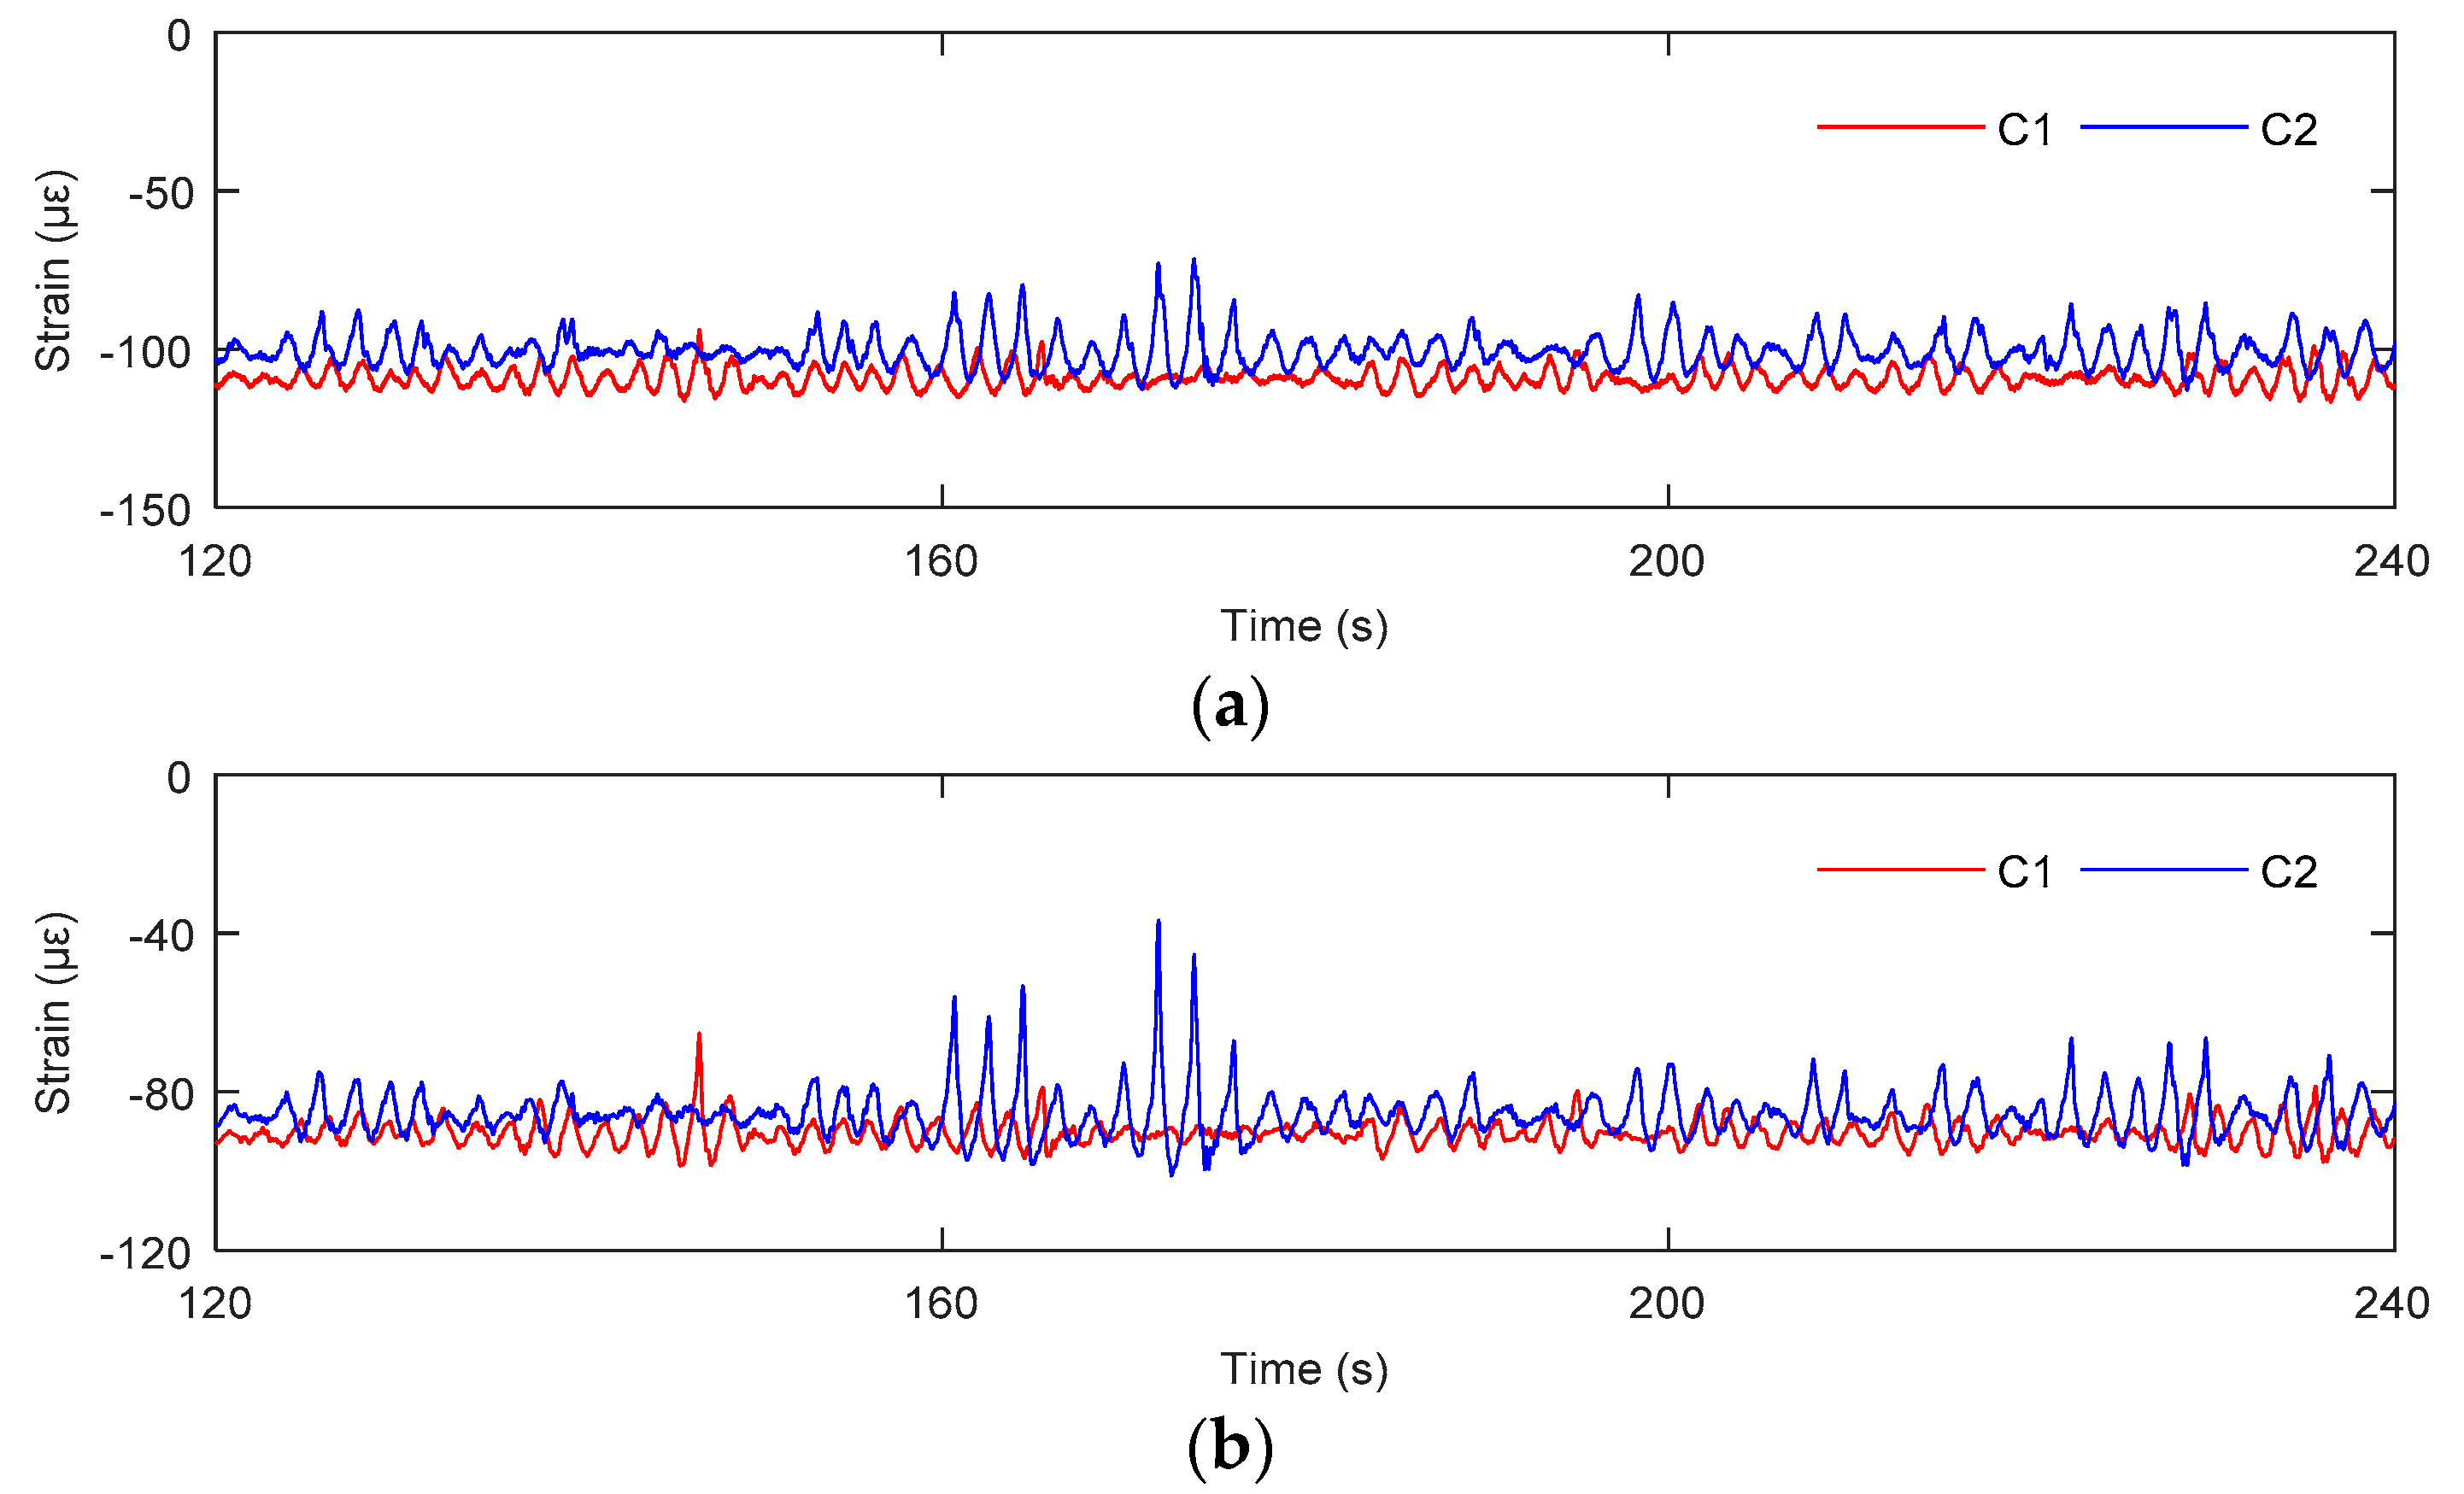
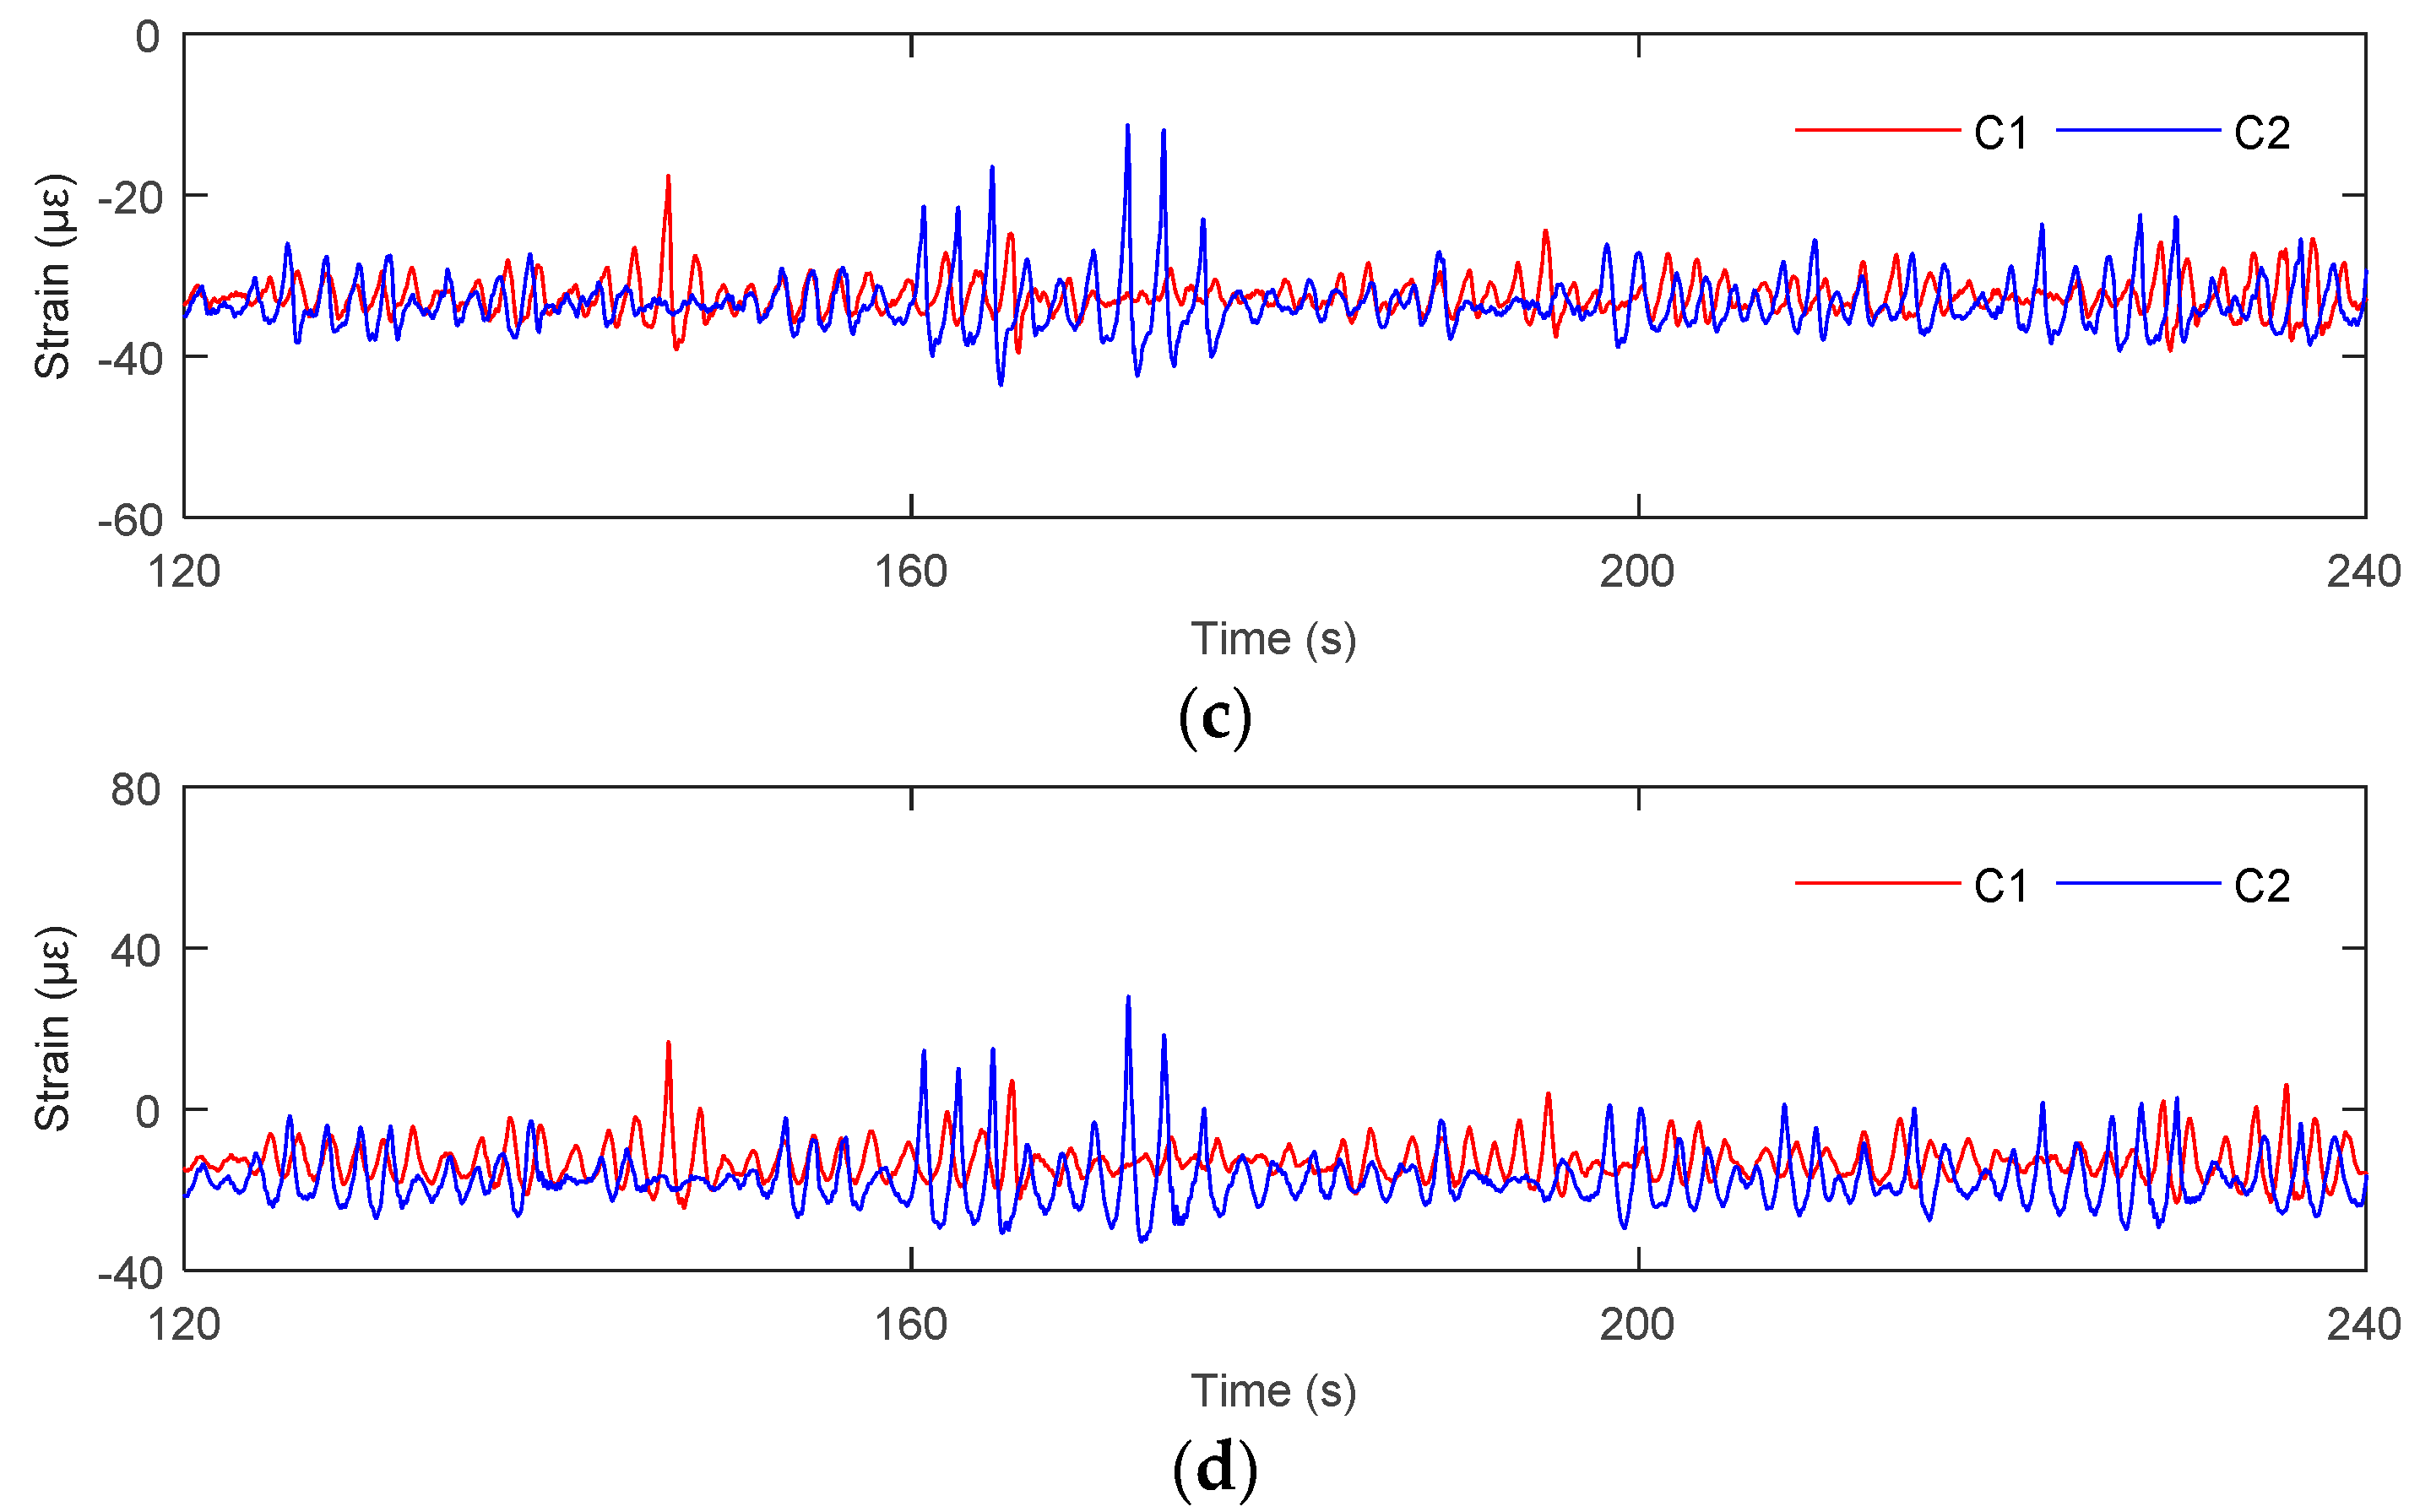
The dynamic response test of the electrical platform is carried out under the combined actions of wind, wave, and current and considering a storm surge elevation. The structural strain response of the electrical platform under three different attack angles, 0°, 45°, and 90°, was simulated under storm condition. Taking the platform with an attack angle of 90° as an example, the time-history curves of structural strain response at the four strain gauges around the measurement point S1 on the pile leg under storm condition C2 are shown in Figure 9. By analyzing the measured results of four strain gauges around the circumference of the pile leg at different positions, the results show that the measured results of the strain gauge at the outside of the platform structure are larger than those of the other three strain gauges.
The strain response of the pile leg was analyzed under storm conditions of C1 and C2. The comparison results of the time history of strain response at different measuring points are shown in Figure 9. According to the analysis results, the strain at different measuring points in storm condition C2 is significantly larger than that in C1. Under the same environmental load, the strain values of strain gauges No. 2 and No. 4 were very large, followed by strain gauge No. 1, and strain gauge No. 3 had a minimum strain.

3.2. Acceleration Response of Electrical Platform

3.2.1. The Electrical Platform in Regular Waves

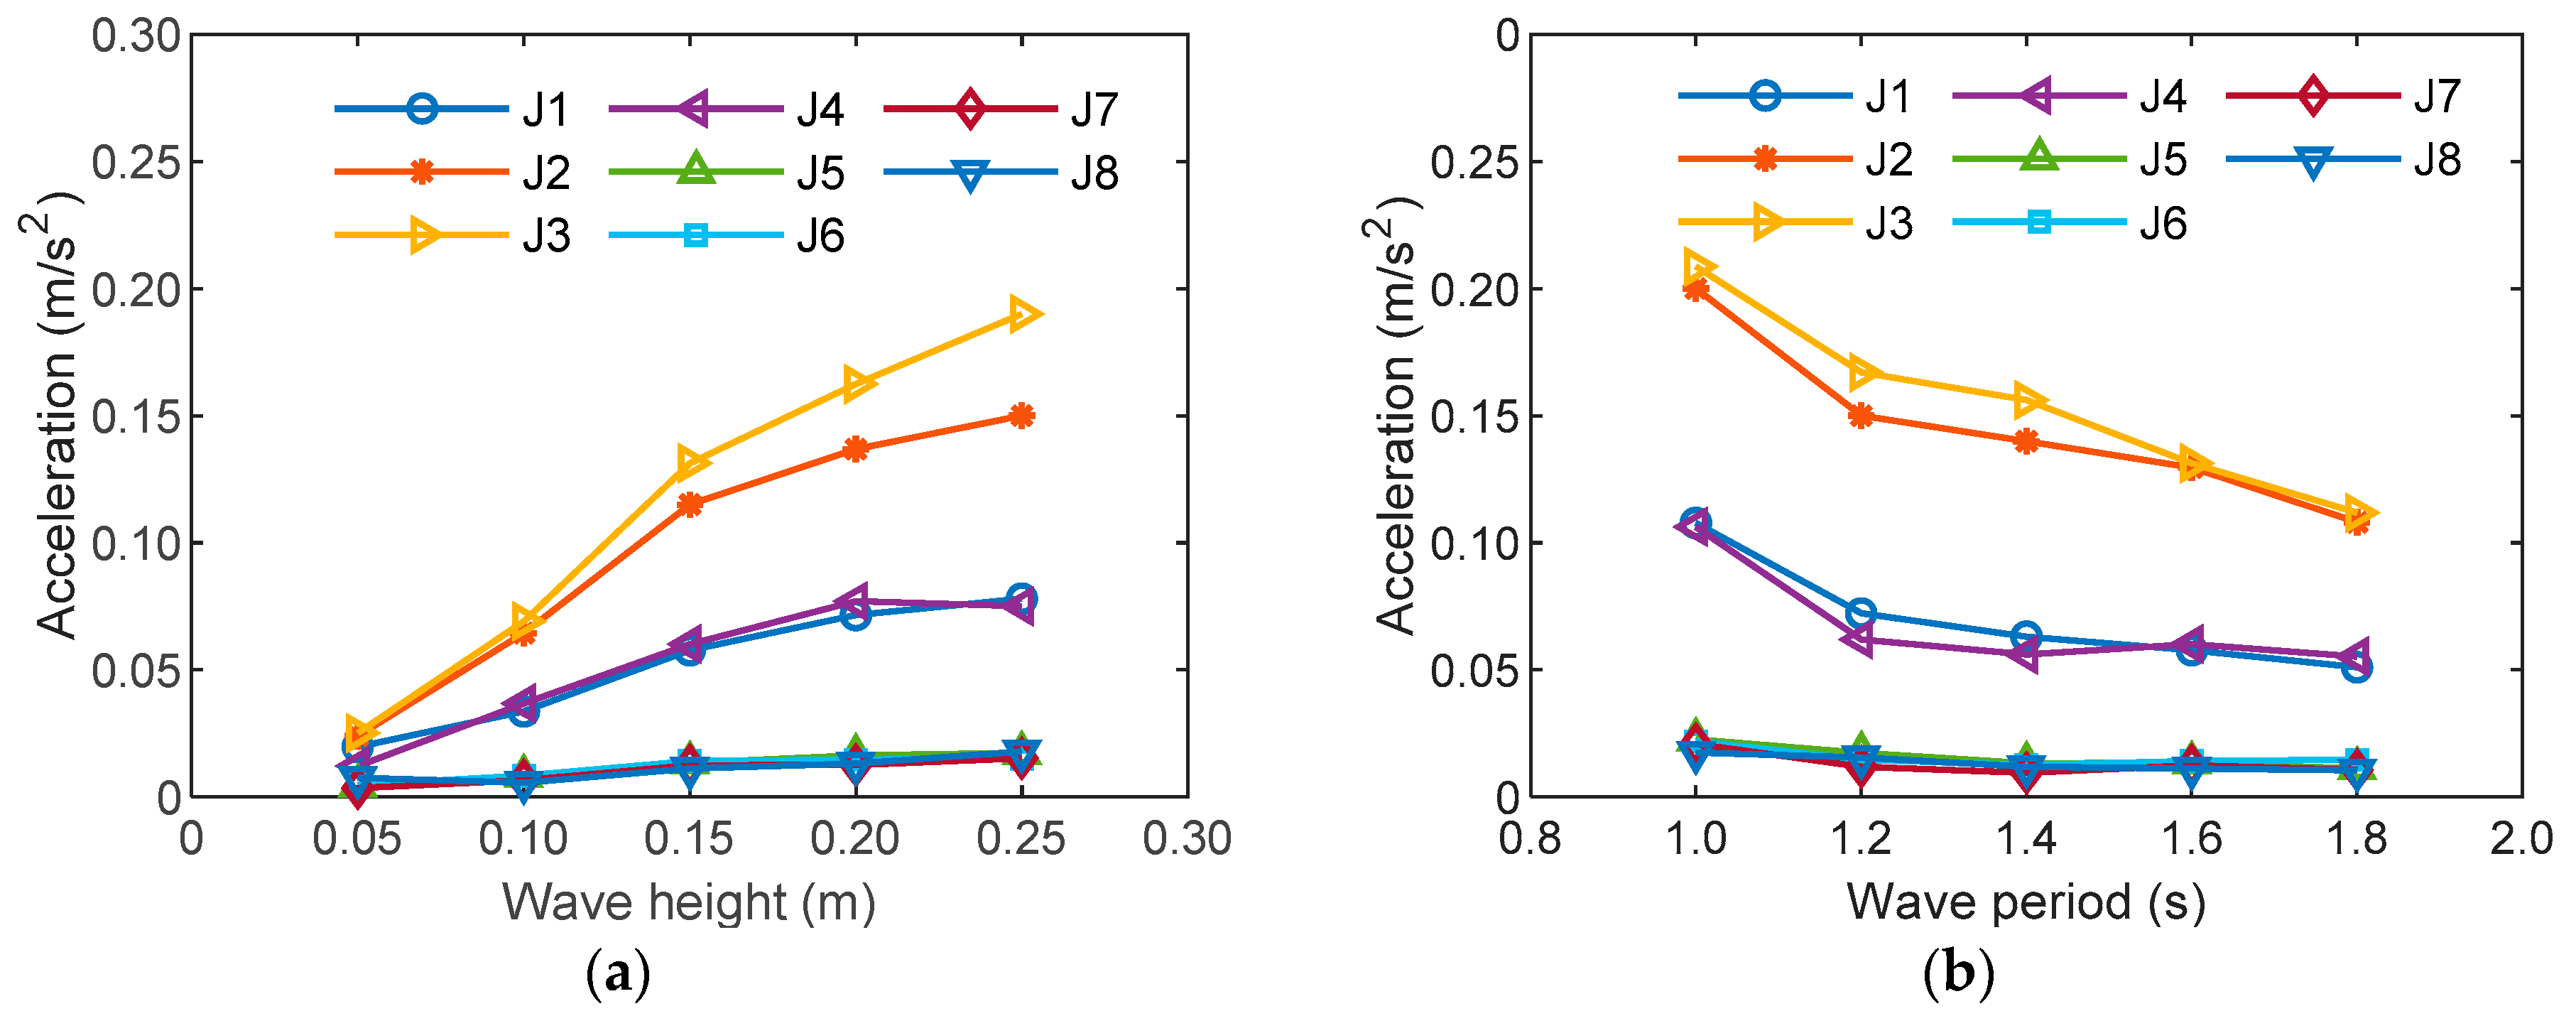
In this study, the peak value of the acceleration response of the structure is taken as the key index to reflect the motion response of the electrical platform. Under the action of different regular waves, the acceleration response of the structure at different positions is shown in Table 8. Figure 10 shows the variation of the peak value of acceleration response with wave height and wave period at various measurement points of the structure. It is indicated that when the wave period is constant, the acceleration response of the measurement point of the structure increases with the increase of wave height. While the wave height is constant, the acceleration response of the measuring point decreases with the increase of the period. Overall, the peak value of acceleration response at measuring point J3 is the largest under different wave conditions. However, the acceleration response at measuring points J5, J6, J7, and J8 is not sensitive to the changes of wave height and period.
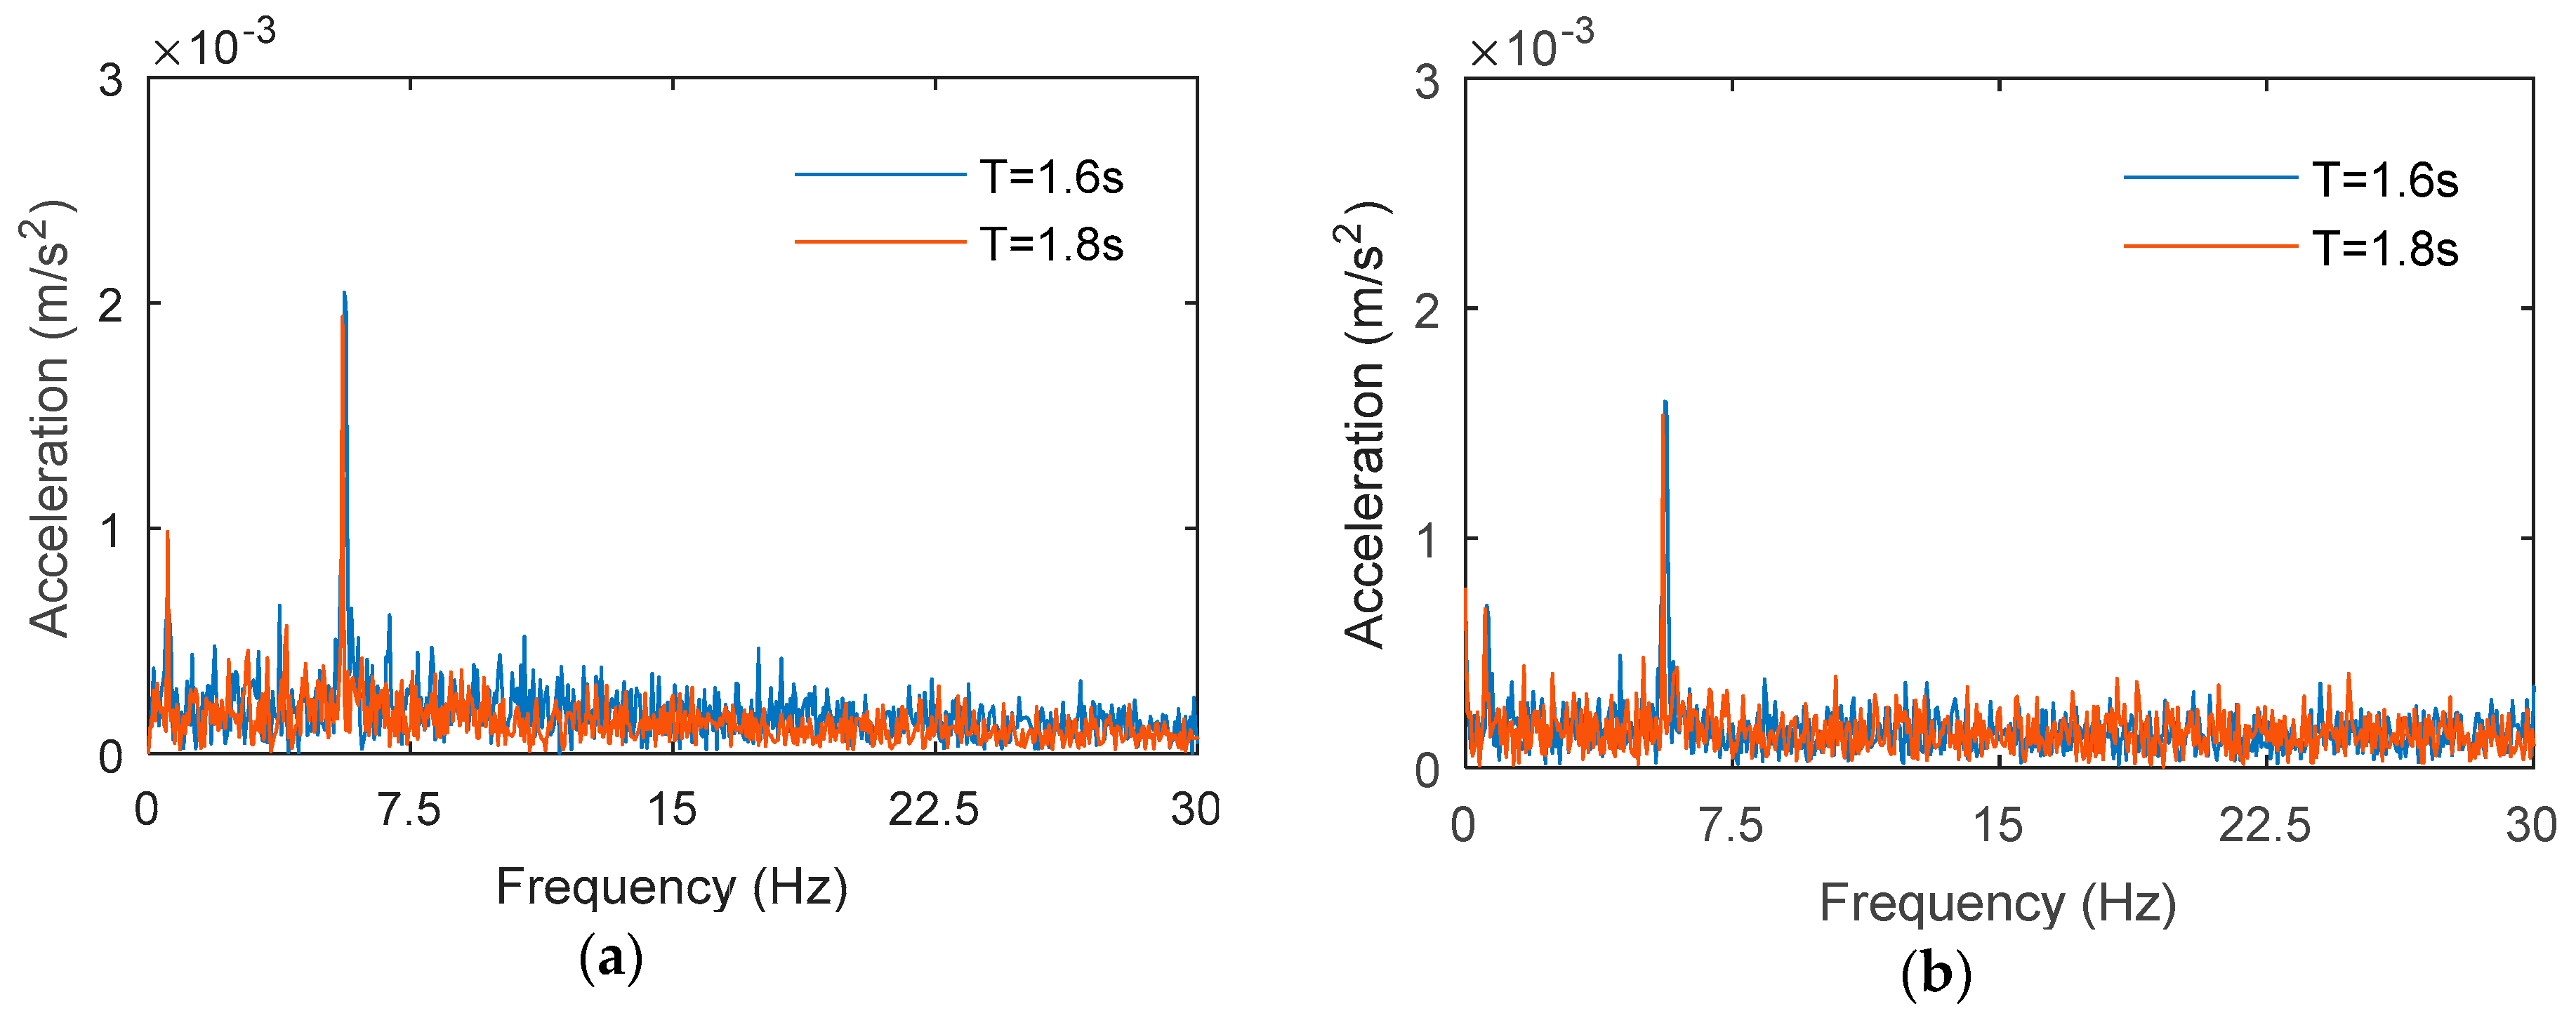
Through frequency domain analysis of acceleration time-history curve, the corresponding frequency-domain curves of various measuring points are obtained. The peak value of frequency domain curve appears at 5.6 Hz which is approximately the frequency of the first-order mode in the normal direction of the platform (see Figure 11).
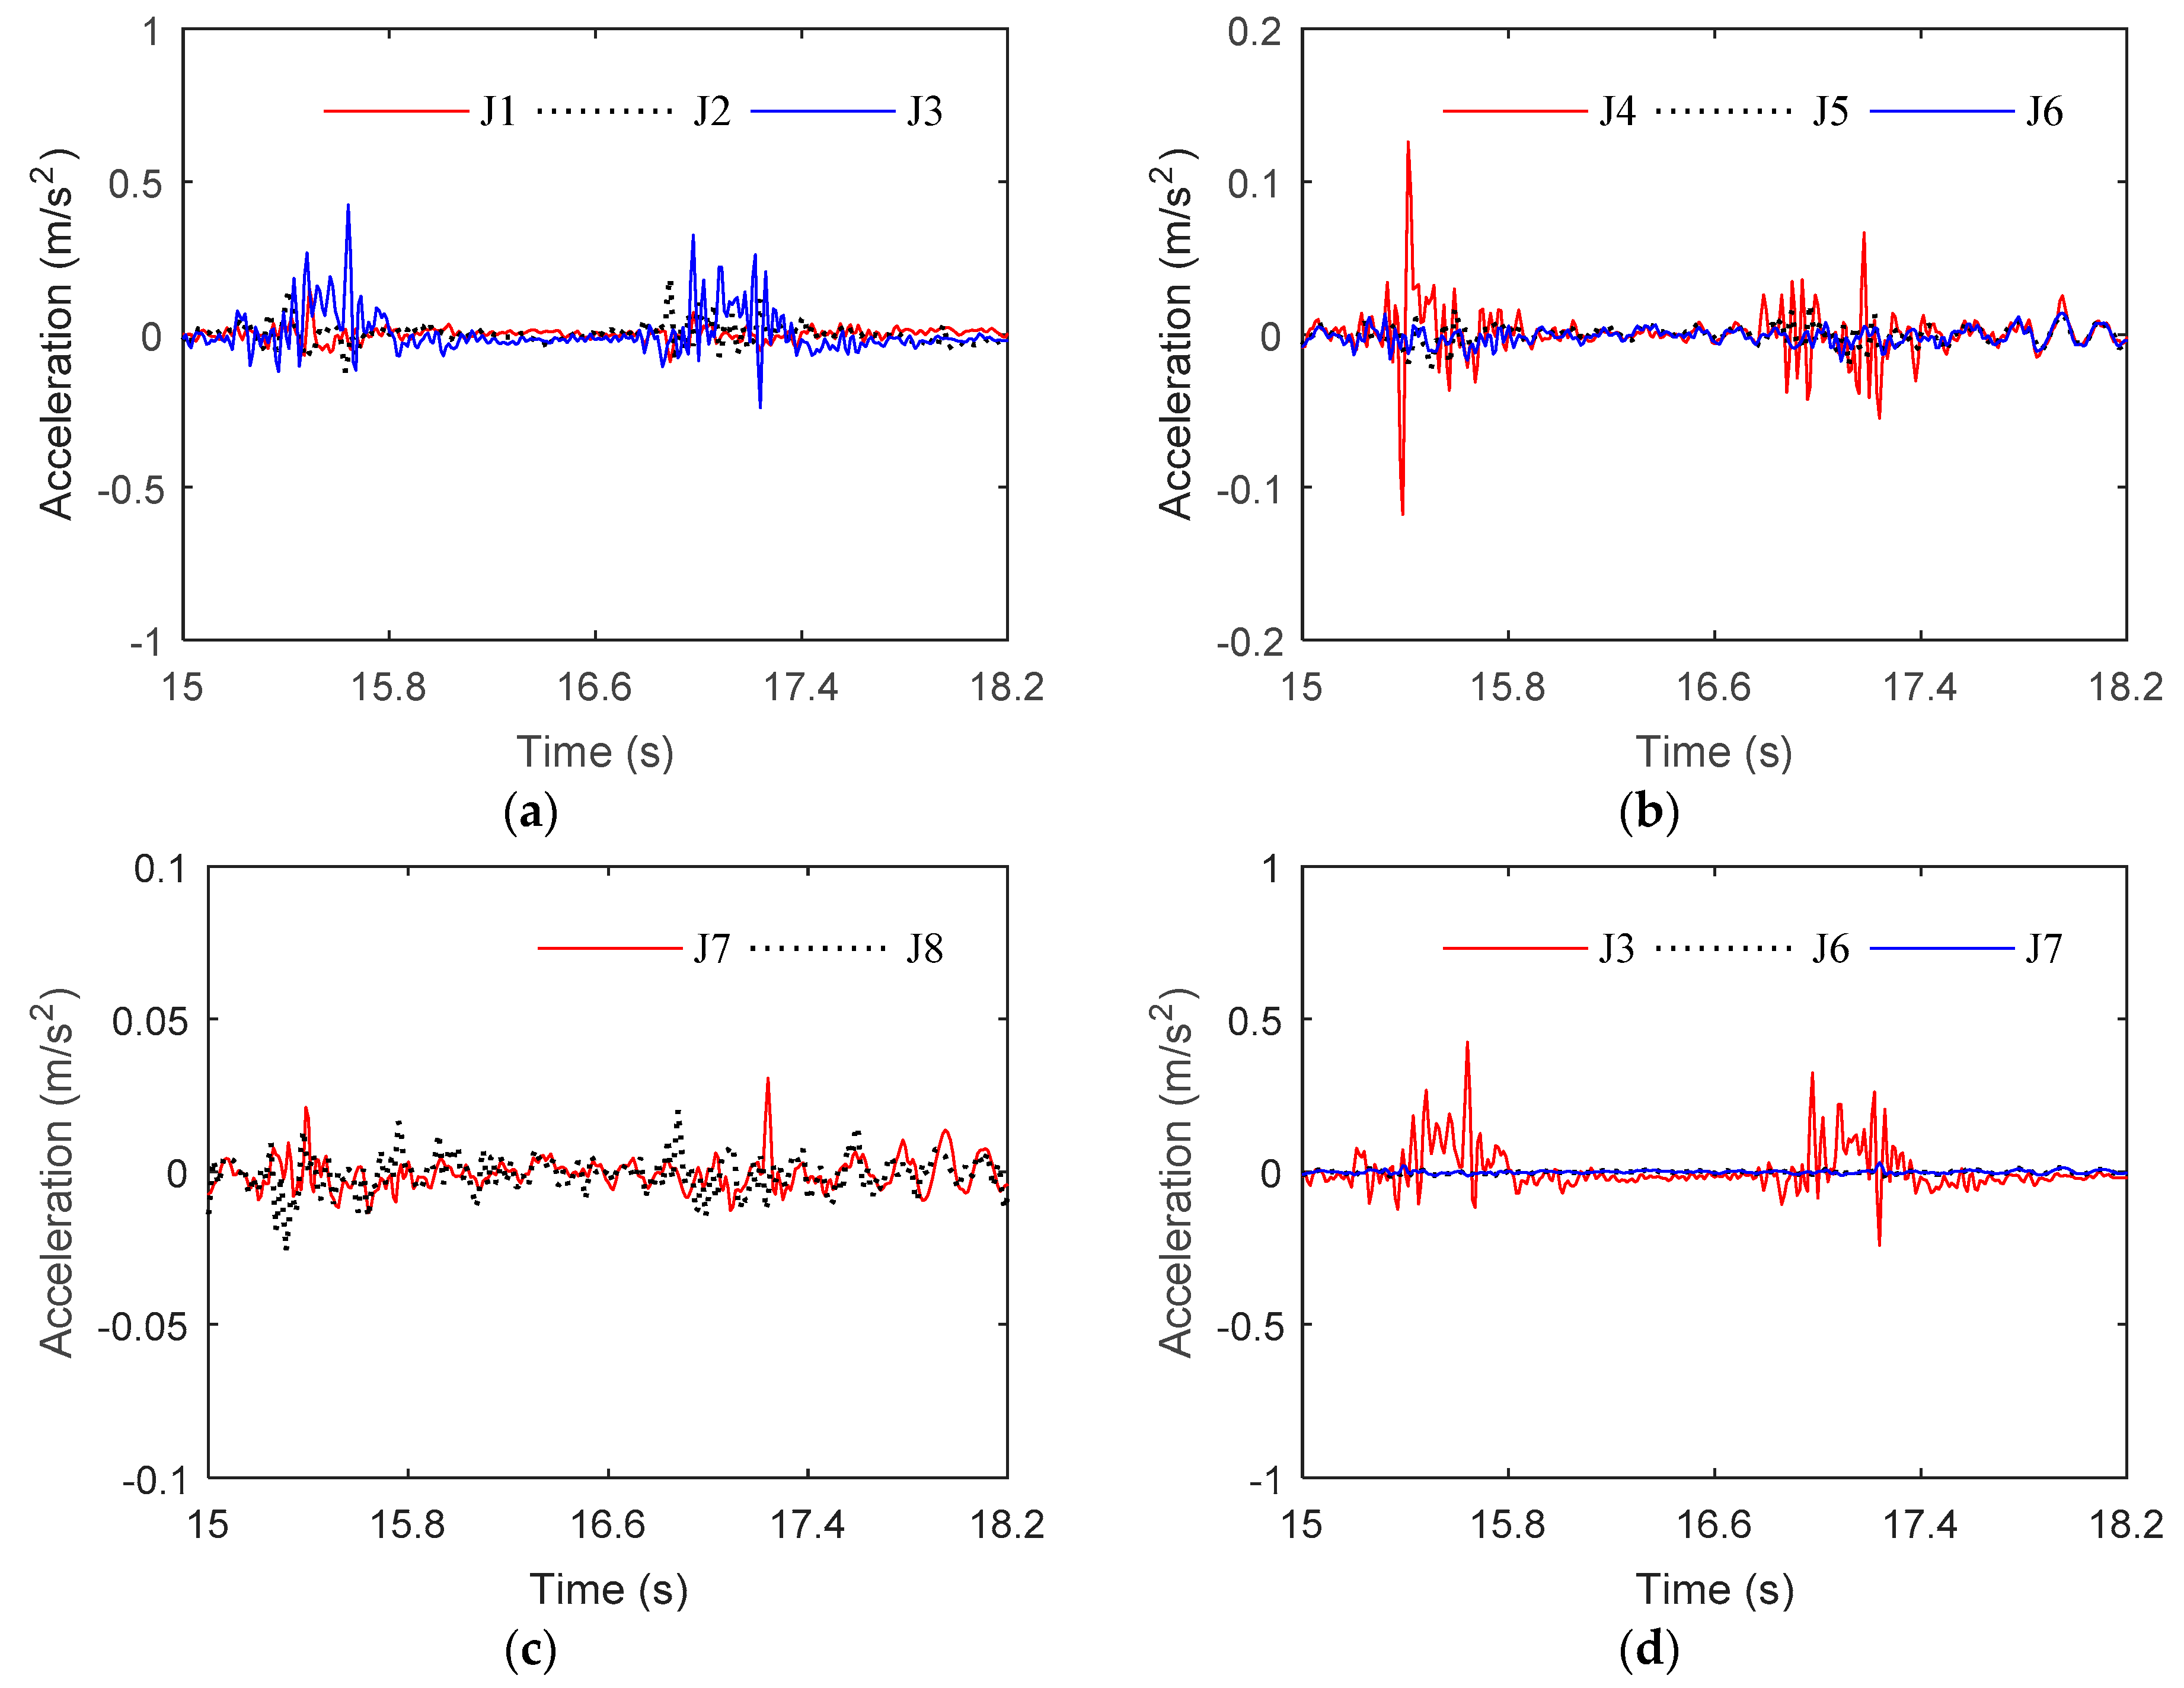
According to the experimental results, the acceleration response at different positions of the electrical platform was analyzed. Comparison between time series of the acceleration response at superstructure, jacket structure, and sensitive positions for internal electrical equipment is shown in Figure 12. To observe the change of the acceleration response more clearly, the time series at various measurement positions are presented with a range of 3.2 s, respectively. Among the eight acceleration sensors arranged on the structure, acceleration sensor J3 had the largest response. This is because J3 is located on the lower jacket structure and near the water surface. This part of the structure is directly affected by wave load; thus the peak value is higher than that of other positions. When wave acts on the structure, the instantaneous response of acceleration at each measuring point is quite different. The acceleration responses at all measuring points decay synchronously after wave excitation, and the attenuation trend is basically the same. It can be concluded that the wave excitation propagates upward and downward from the middle part of the platform structure at the same time. When the whole structure is excited, the response at each measuring point attenuates synchronously.

3.2.2. The Electrical Platform in Storm Condition

The acceleration response of some key nodes of the electrical platform under storm condition was measured. Under the combined action of wind, wave, and current, the acceleration response of the structure increases with increasing wind speed, current speed, and wave height. According to the acceleration time series at different positions, the acceleration response of the structure is analyzed in frequency domain (see Figure 13). The results show that the spectral peaks of the structure at different positions appear at approximately 6 Hz, which is close to the first-order mode frequency of the structure in the normal direction. In addition, it can be found from the spectrum curve that the wave slamming on the lower deck of the platform excites the high-order mode of the structure.
Based on the experimental results, the acceleration responses of the jacket structure, the superstructure, and sensitive positions of the electrical equipment inside the platform were compared and analyzed. To observe the variation of the acceleration more clearly, each response time series was presented with a range of 8.0 s (see Figure 14). The results show that the trend of acceleration response at three measuring points on the jacket is consistent. However, there are significant differences in both the time history and the peak value of acceleration response at the measurement points in the superstructure and electrical equipment. This is mainly due to that the phase difference occurs in the transmission process after the external environmental load stimulates the hydrodynamic response in the structure. At the same time, this phenomenon is related to the high-order mode of the structure due to wave excitation.

4. Discussion

4.1. Effect of Water Depth on Strain Response

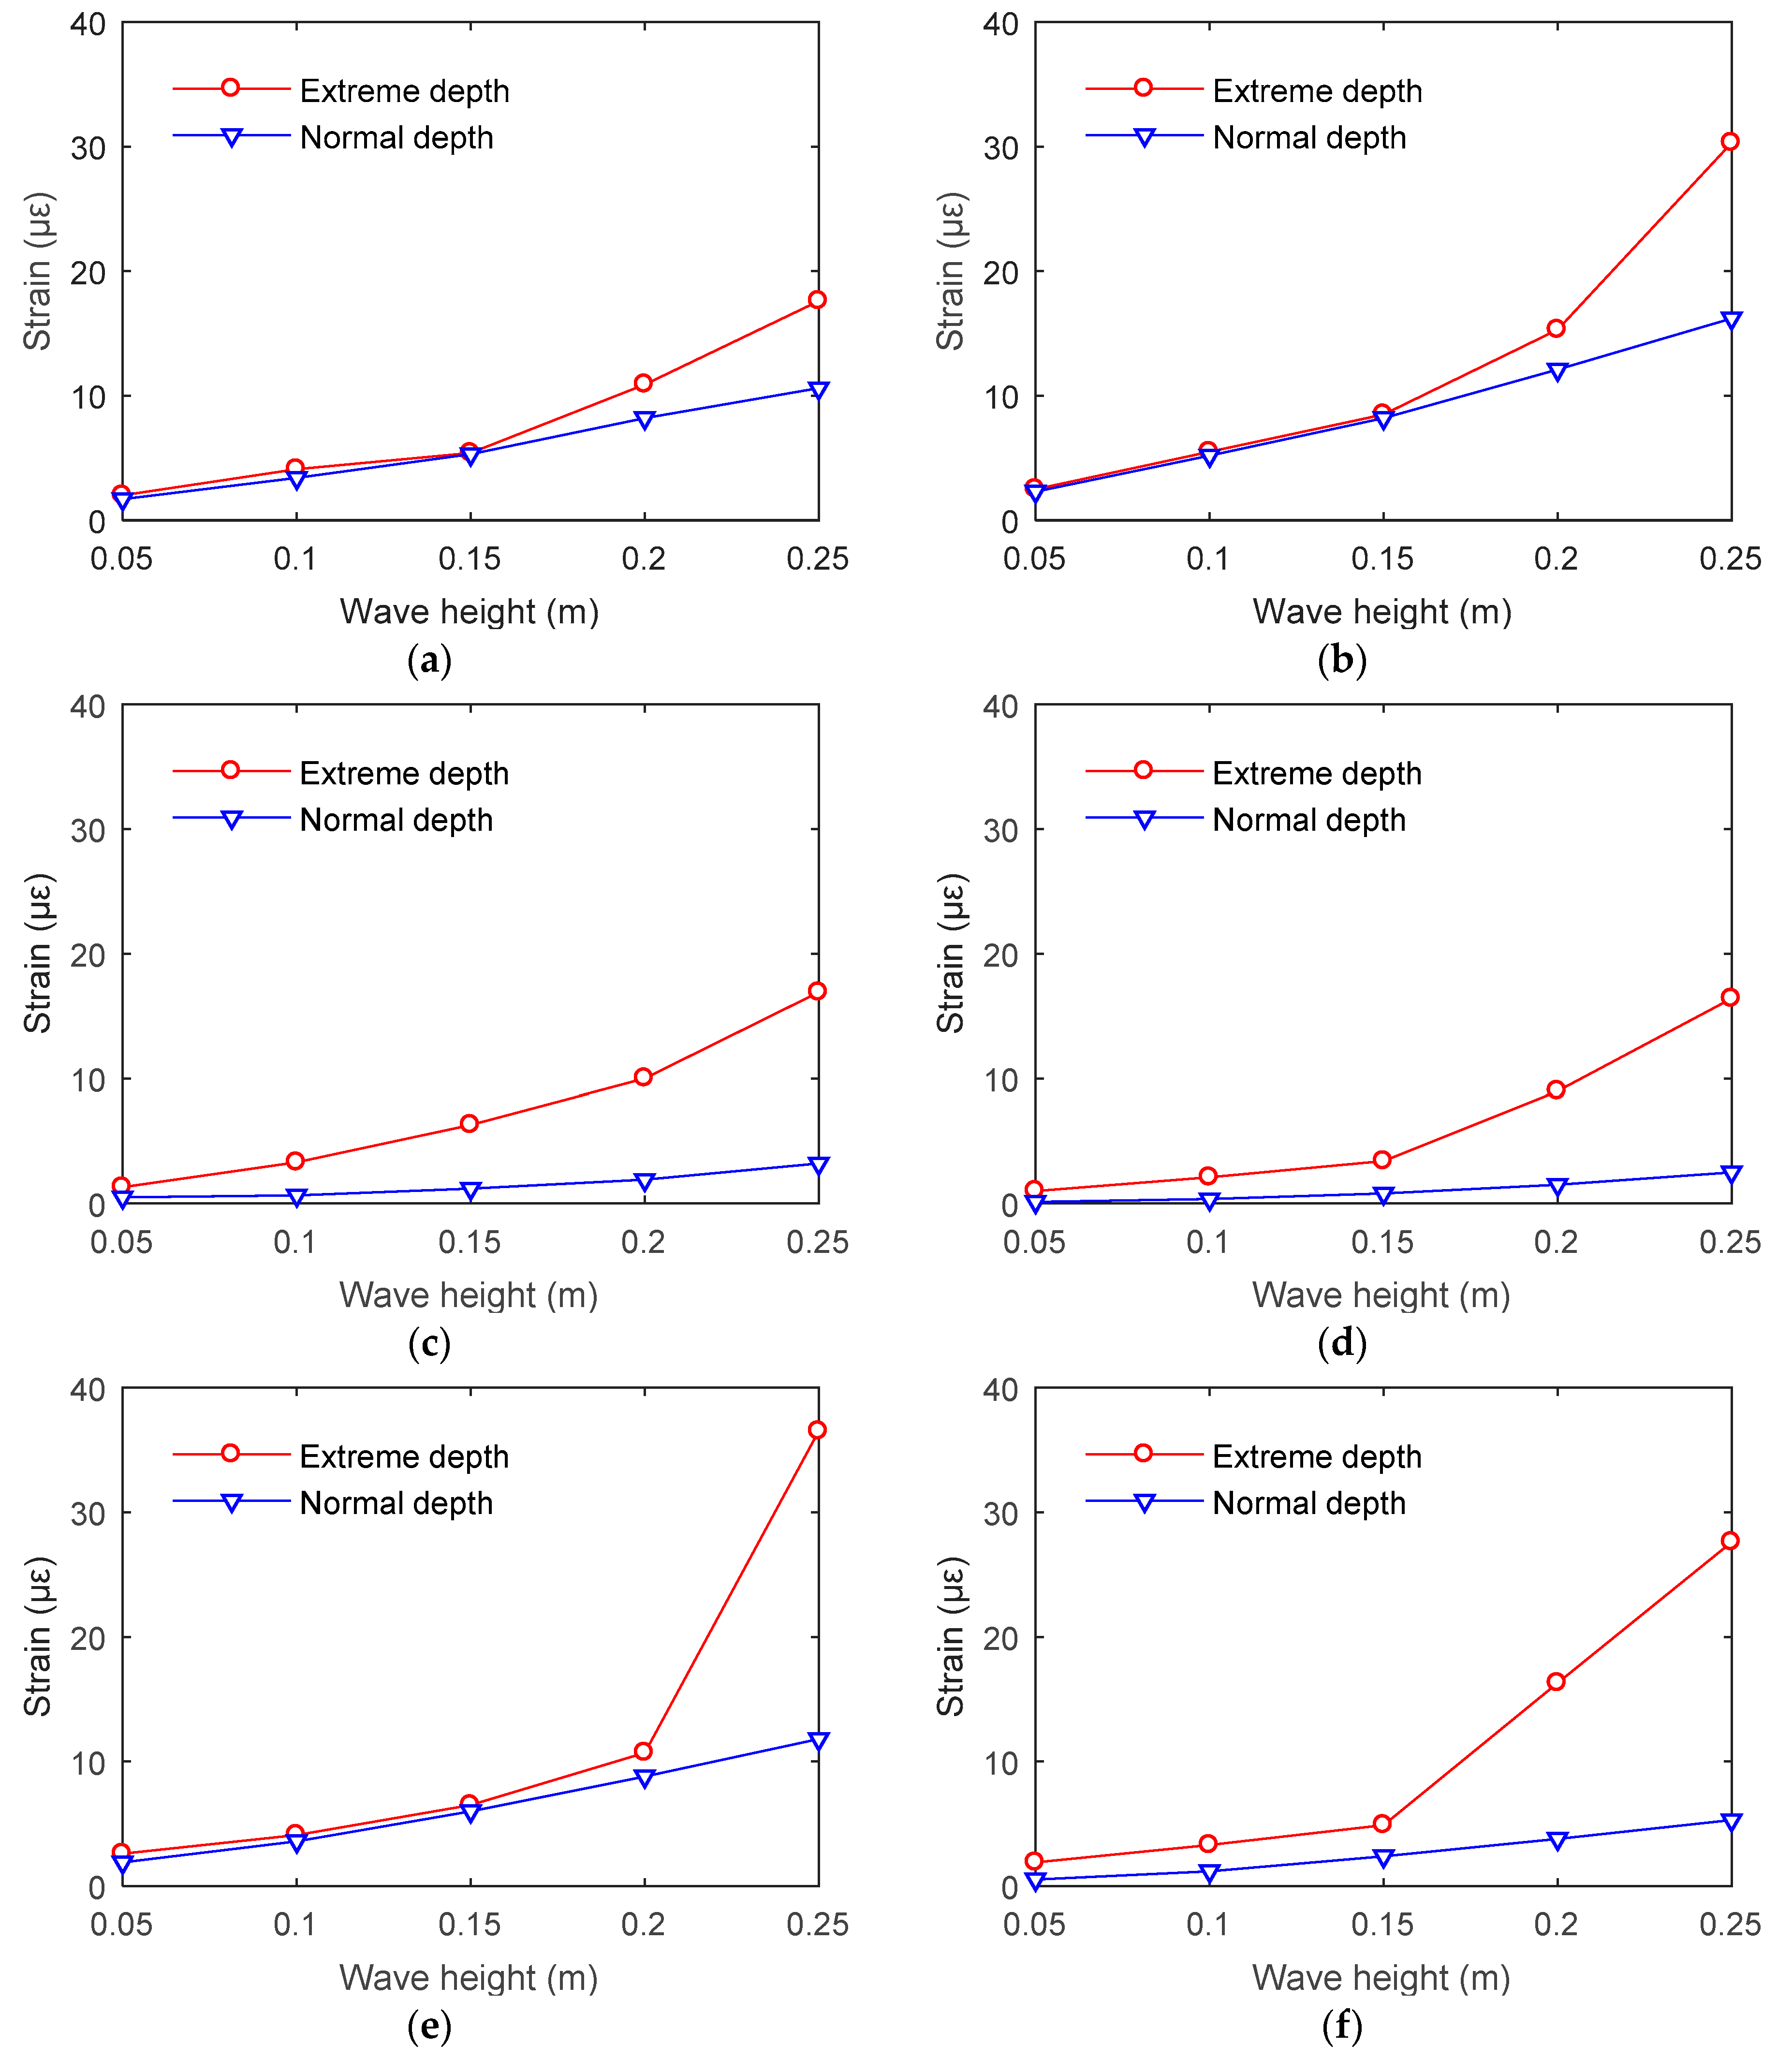
The electrical platform structure presents different characteristics of the hydrodynamic response under normal and storm conditions. When the water depth changes, the hydrodynamic response of the structure will be different, even if the wave state remains the same. The structural strain peaks at different positions under the action of regular waves with an attack angle of 0°are shown in Figure 15. When the wave height increases, the strain of the structure increases in both extreme and normal water depths. Moreover, the strain peak of the structure in extreme depth is larger than that in normal depth.
In the experiment, when the wave height is greater than 0.20 m, the structural strain in extreme depth is significantly greater than that in normal depth. This is mainly due to the following two reasons: (i) When the water depth increases, the area of interaction between water and the jacket structure of the electrical platform increases. Therefore, the loads acting on the structure increases, and the local stress and strain increase correspondingly. However, jacket members are slender and the increase of effective area is limited. Therefore, the strain increment is small under waves with lower wave height (less than 0.15 m). (ii) When the water level rises, larger waves (wave height larger than 0.20 m) will interact with the superstructure. On the one hand, waves will impact on the windward side of the superstructure of the platform. On the other hand, waves interact with the lower deck of the platform, which creates a complex wave-slamming effect. This will change the mechanism of dynamic response of the structure significantly, and the stress and acceleration responses will show strong nonlinearity. Moreover, the environmental load and response of the structure increase significantly.

4.2. Effect of Attack Angle on Strain Response

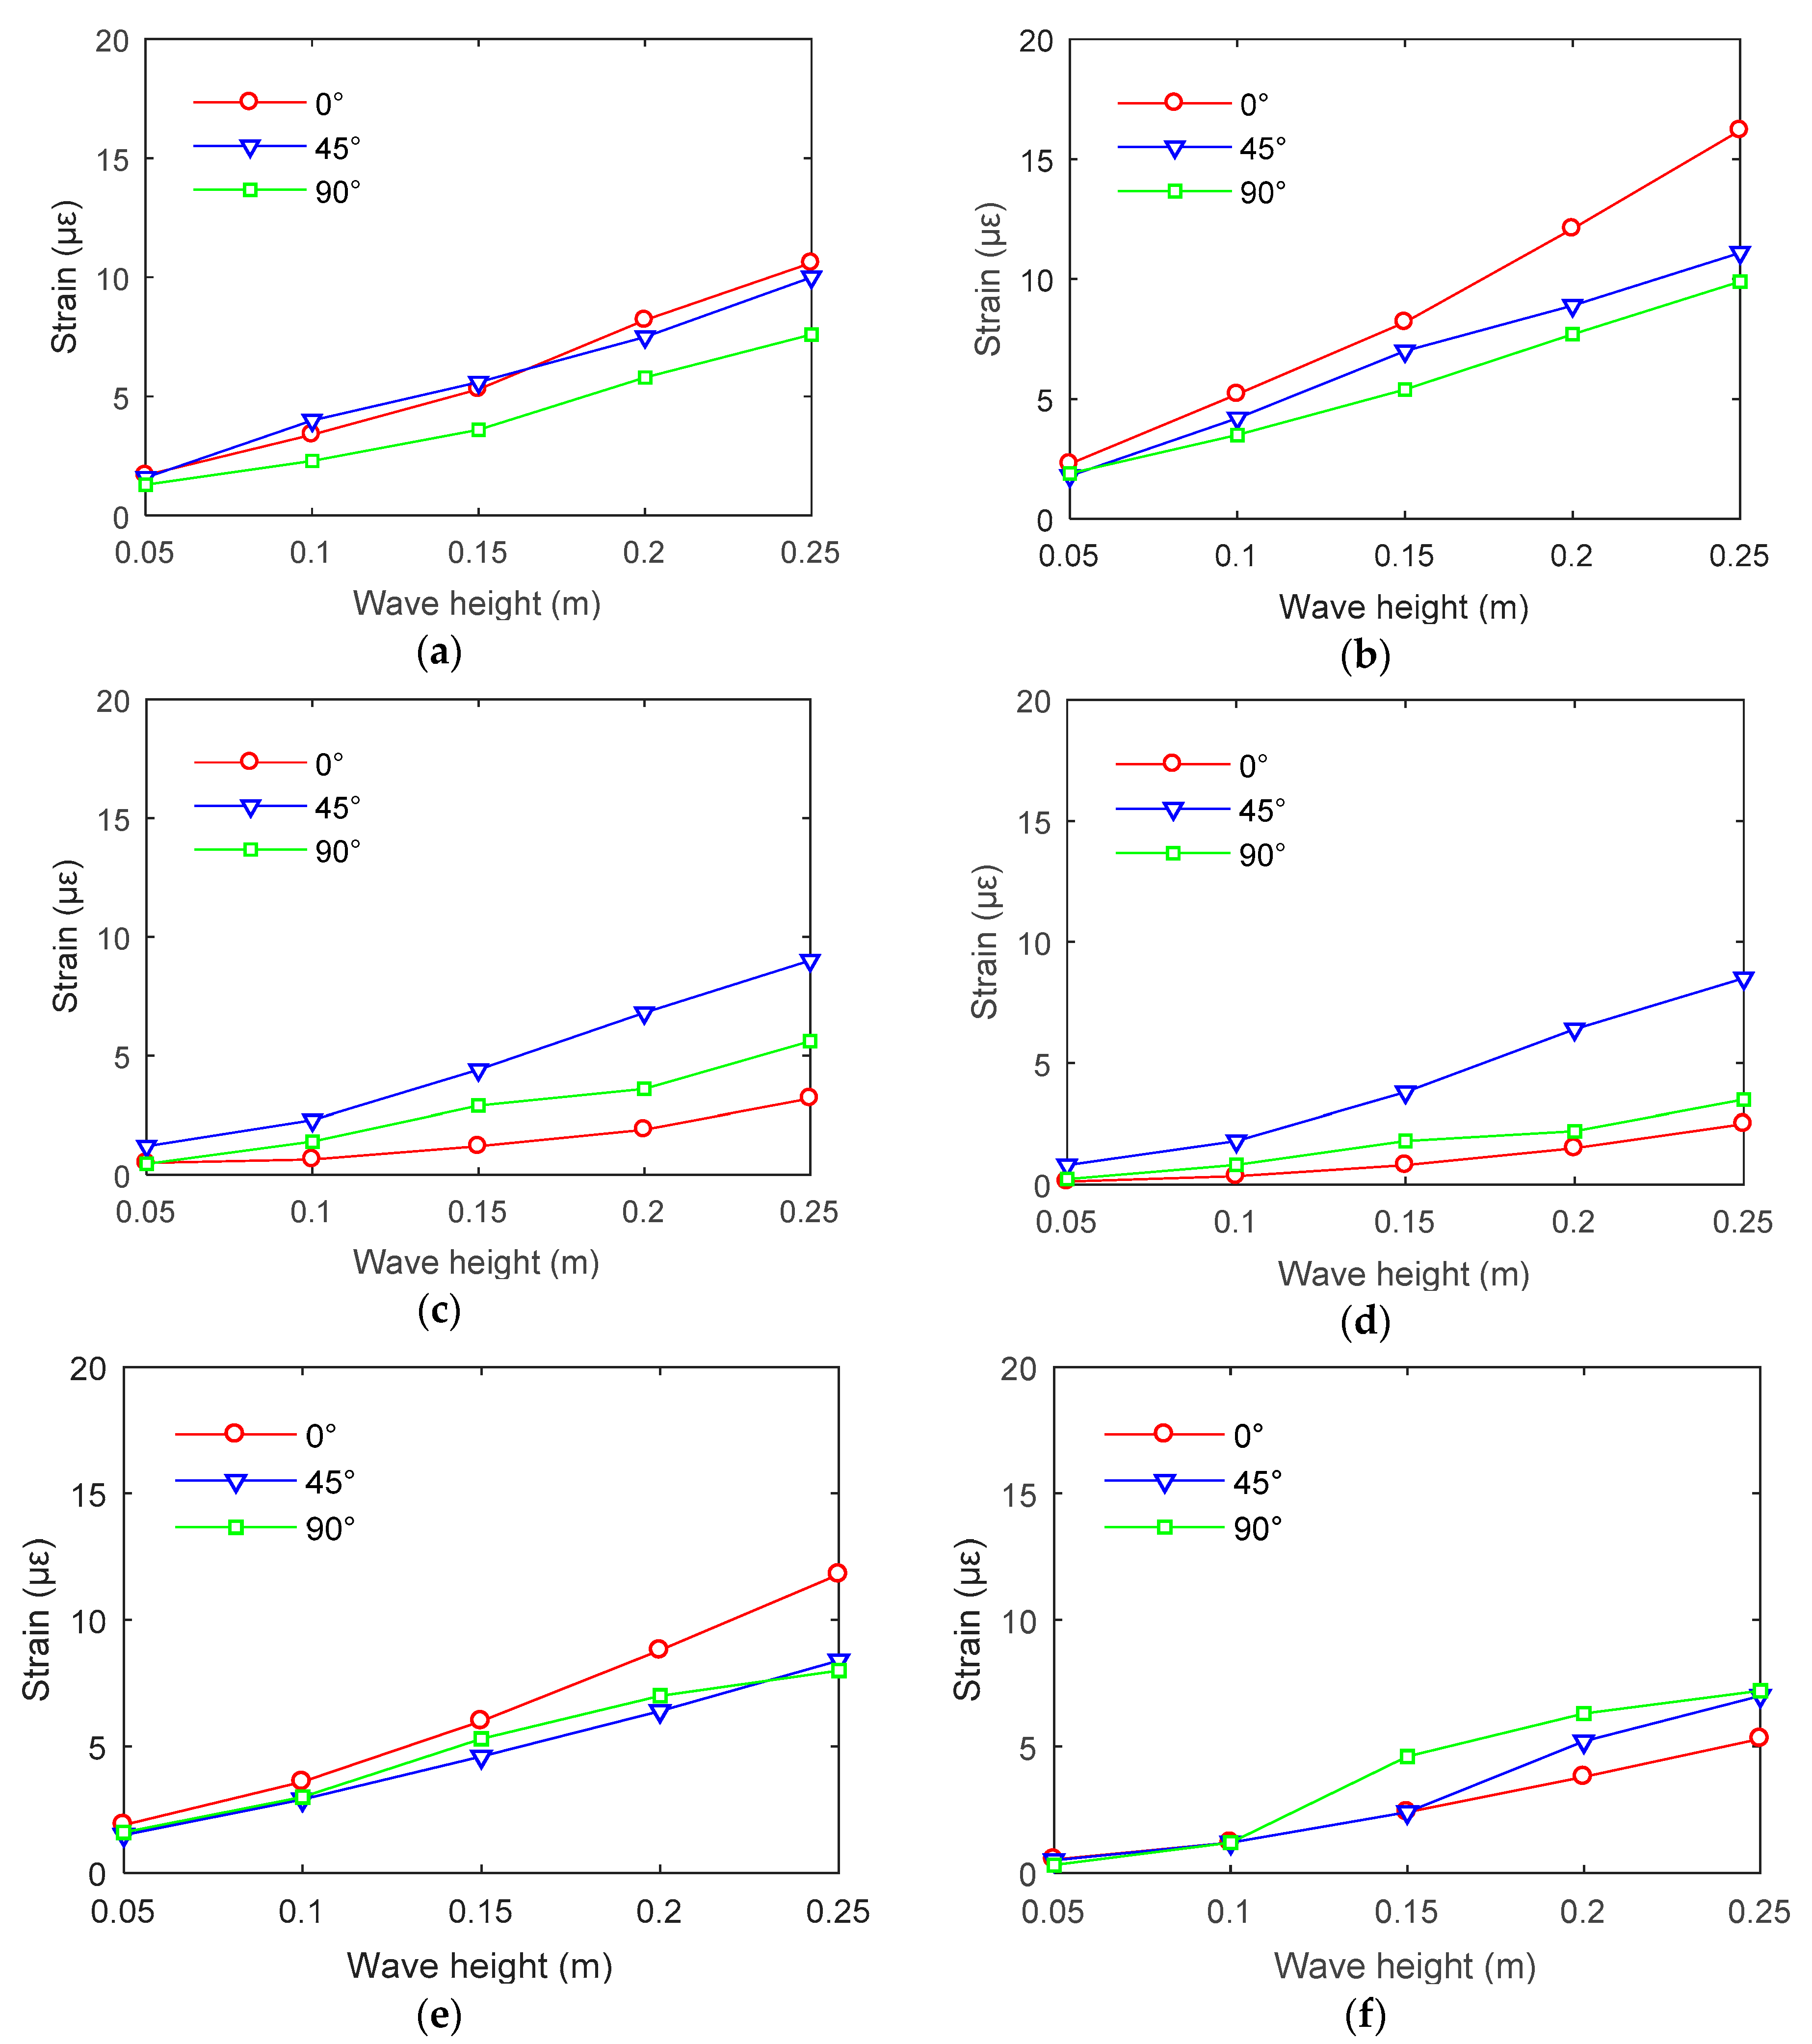
In this study, three attack angles between the environmental loads and the platform structure were considered. Under the same environmental loads, the attack angle has a significant influence on the structural strength and motion response. However, from a perspective of practical engineering, structural strain is more closely related to structural safety. Therefore, the strain response under different angles of attack was analyzed in this section. With the increase of wave height, the strain response of the structure under the action of waves at all angles tends to increase. However, the variation trends of structural strain are different at various positions under three angles of attack. The electric platform structure is a statically indeterminate frame structure. No matter which direction the wave load impacts on the platform, the strain at different positions has a good consistency; in addition, the strain values are comparable. There was no significant difference in strain value between the wave side and the leeward side (see Figure 16).

4.3. Effect of Environmental Loads on Strain Response

Various combined modes of environmental loads have different effects on strain response of the platform. Taking the time series of strain at the measuring point S2 at 0° attack angle as an example, the strain response of the platform structure under irregular wave only and the combined action of wind-wave-current is shown in Figure 17. It can be seen from the experimental results that the strain response of the structure under waves with the wave height of 0.20 m is larger than that when the wave height is 0.15 m, regardless of the combined action of wind, wave, and current or wave only. Overall, the strain response of the structure under combined loads is larger than that under wave load only. Under wave action only, the structural strain changes periodically around the equilibrium position, with a maximum value of approximately 10 με. However, due to the actions of wind and current, the equilibrium position of the time series of strain increases to approximately 30 με. Under the combined action of wind, wave, and current, the maximum value of strain can exceed 40 με. Due to the action of wind and water, the structure experiences an initial constant value of strain. Therefore, the strain of the structure under the combined action of wind, wave, and current is significantly larger than that under the action of irregular waves.

4.4. Effect of Water Depth on Acceleration Response

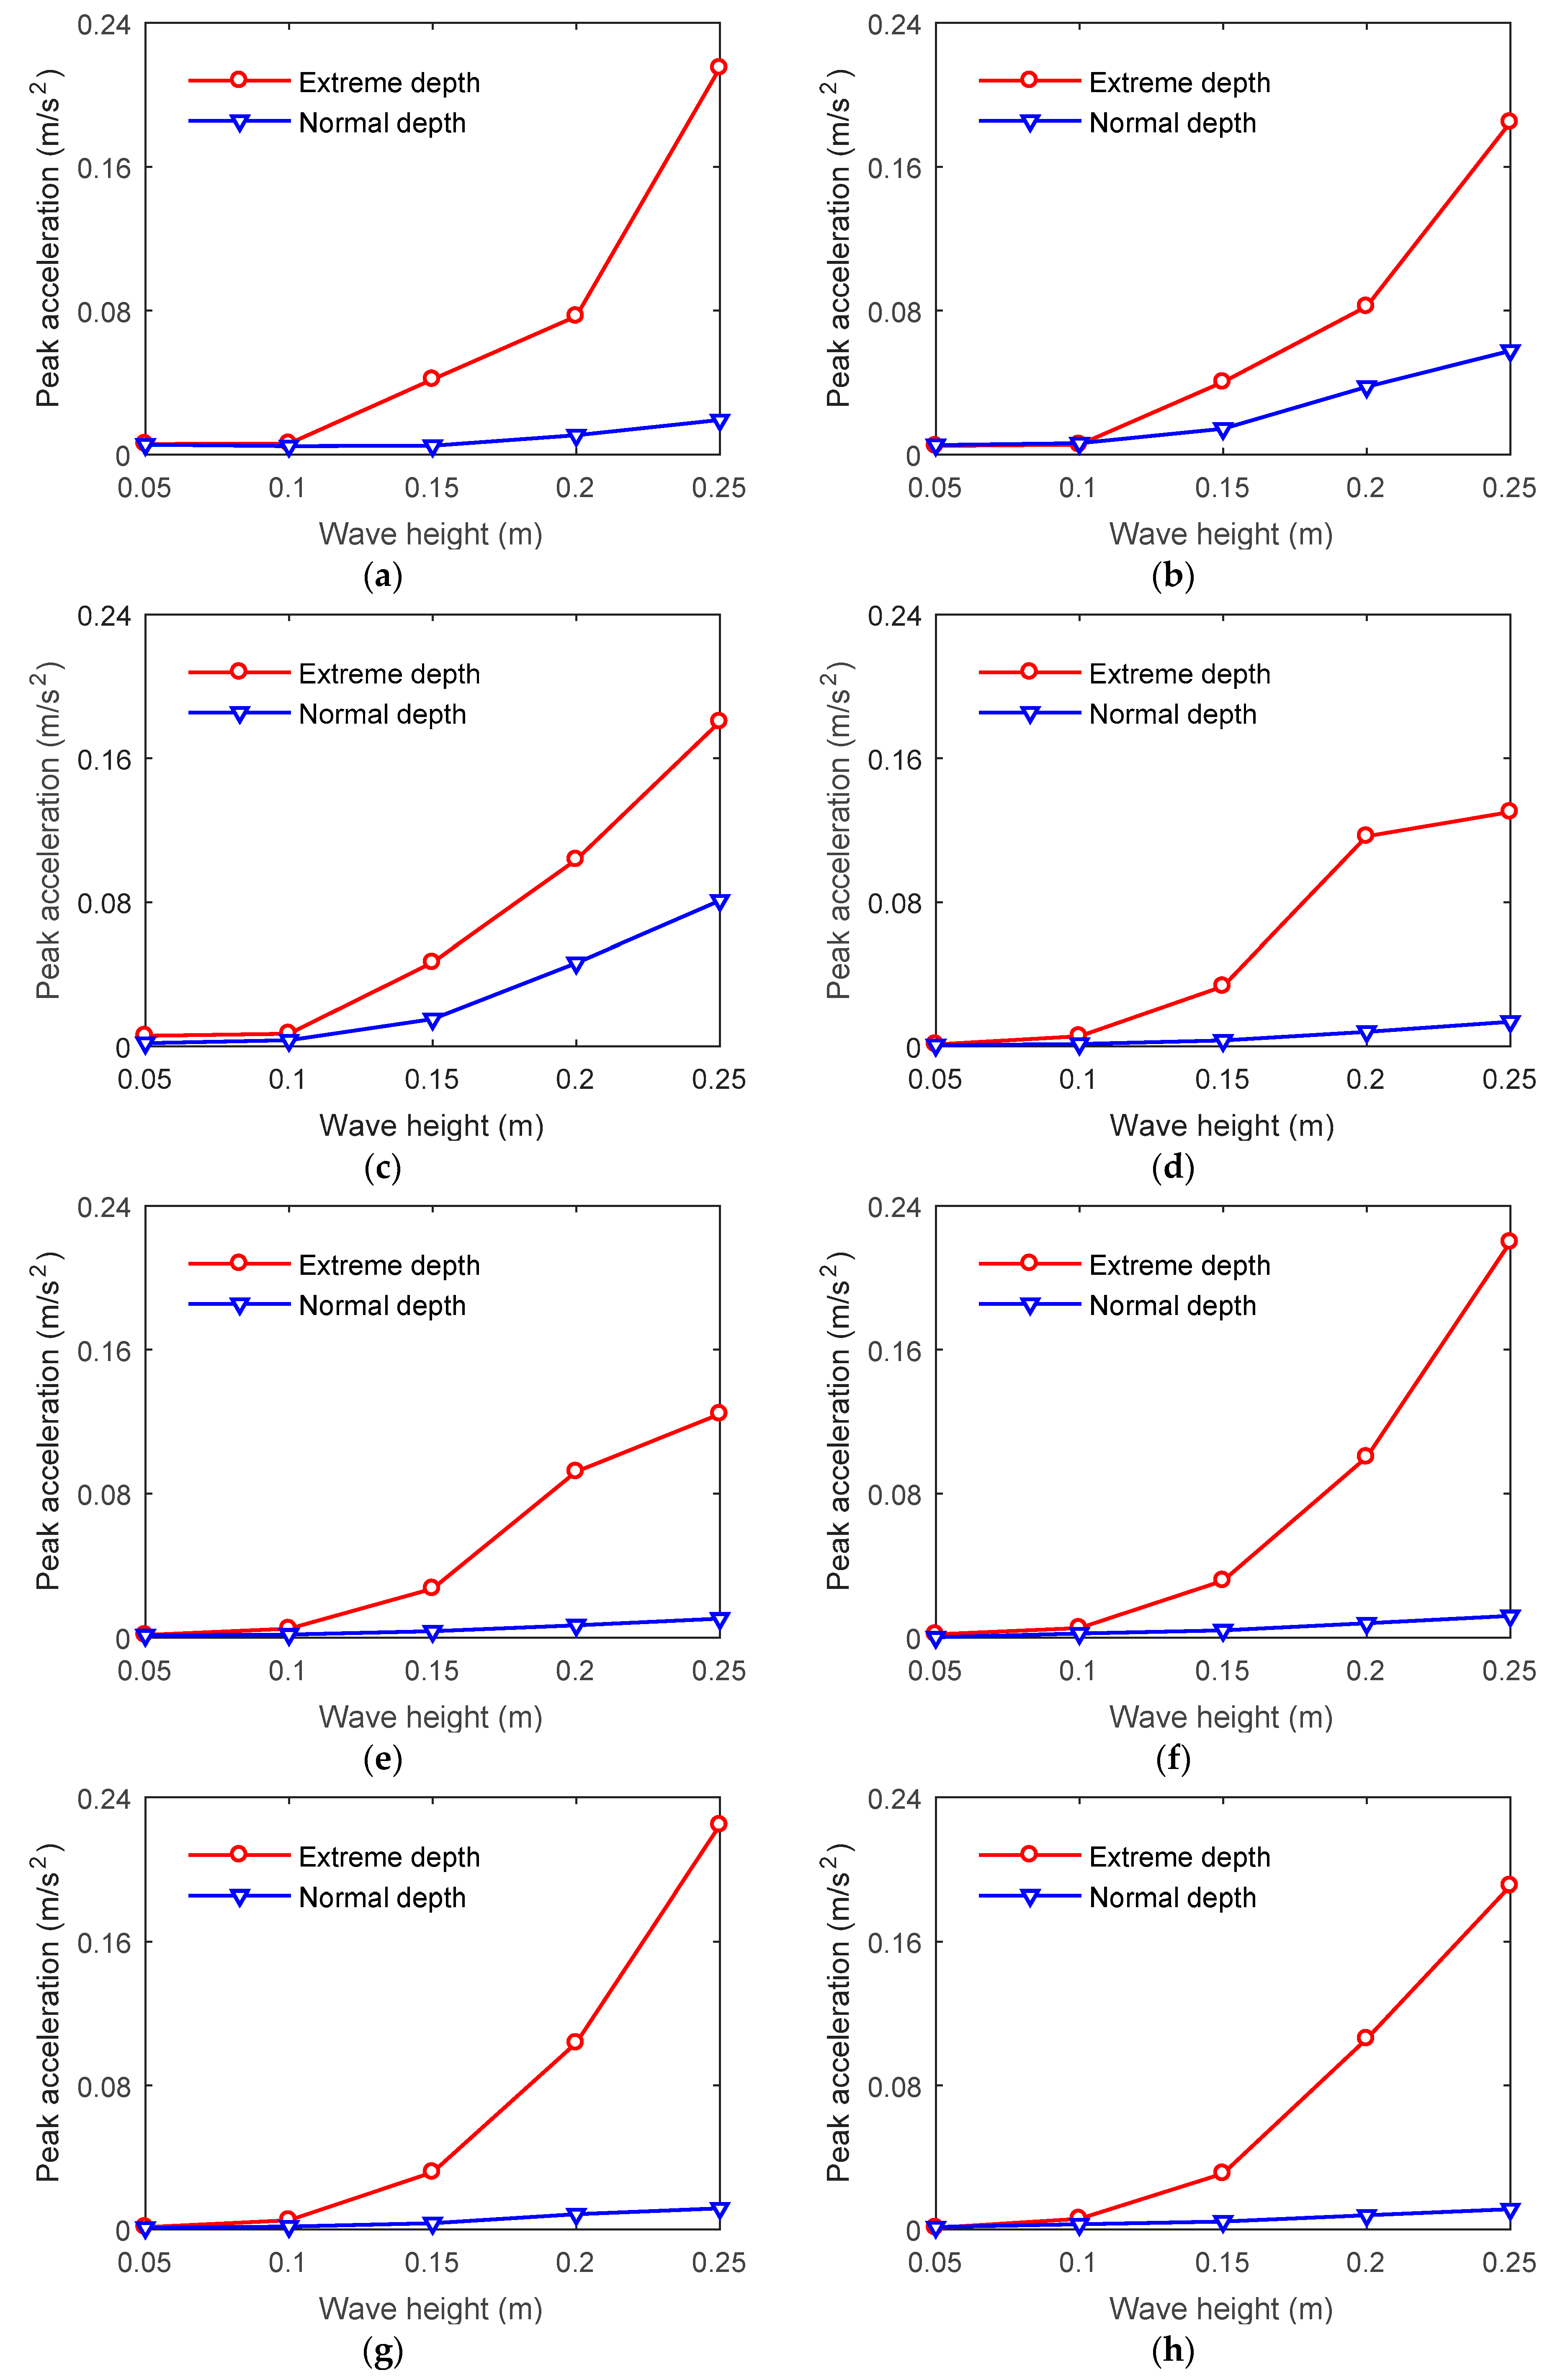
Similar to the strain response, the influence of water depth on the acceleration response of the structure is mainly related to the following two reasons. On the one hand, the area of interaction between water and the jacket structure and electrical platform increases with the increase of water depth. Therefore, the structural load increases and the acceleration response of the structure increases correspondingly. On the other hand, as the water rises, waves with larger wave height slam directly on the superstructure. It can greatly increase the wave load and acceleration response of the structure. According to the experimental results, when the wave height increases, the peak acceleration of the structure in extreme and normal water depths presents a nonlinear increasing trend (see Figure 18). When the wave height increases, the peak acceleration of the structure increases in both extreme and normal water depths. When the wave height is small (less than 0.10 m), the peak acceleration of each measuring position of the structure in extreme and normal water depths has limited difference. However, when the wave height is greater than 0.15 m, the acceleration response of the structure in extreme depth is significantly greater than that in normal depth. This phenomenon is consistent with the variation of wave load. The results of acceleration response in this study can provide reference for the layout of electrical equipment on the platform.
The present study is primarily based on physical model test. Wind, wave, and current acting on the platform in the same direction is considered as the most dangerous sea state. In addition, both normal wave and storm conditions are considered in this study. The present results could reflect the dynamic responses of the offshore electrical platform. Due to high efficiency and accuracy, numerical simulation has been widely used in the fields of coastal and offshore engineering [19,20,21,22]. In the future work, the results of physical model test will be taken as the benchmark for the development of finite element model. On the basis of validation, the numerical simulation of the electrical platform will be carried out to further enrich the structural responses of strain, stress, and motion. The study of wind, wave, and current loads acting on the structure with different incident directions will be conducted and provide a supplement for the results of the physical model test. Besides, the effect of extreme loads, such as earthquake, on the dynamic response of an electrical platform can be investigated by numerical simulation [23].

5. Conclusions

In this study, a physical model experiment was carried out to study the dynamic characteristics of a 10,000-ton offshore electrical platform under the combined actions of wind, wave, and current. Two water depth conditions, extreme and normal depths, were simulated in the experiments. Through the physical model test, the acceleration and stress responses of the offshore electrical platform in three typical attack angles were obtained. The main conclusions are as follows:
(i) The increase of water depth caused a rapid increase of strain and acceleration response of the electrical platform. Especially in waves with high wave height, the peak value of strain and acceleration responses could increase by more than 10 times, if waves directly impacted on the superstructure of the electrical platform. Therefore, in practical engineering, the wave height and storm surge should be fully considered to avoid wave-slamming effect on the superstructure.
(ii) With the increase of wave height, the strain response of the structure under waves at various attack angles tended to increase. However, there was no definite relationship between attack angle and peak strain at different locations. It was suggested that the peak values of strain and acceleration response caused by different external environmental loads should be fully considered in structural design.
(iii) The experimental results showed that the maximum strain value is about 10 με under waves. When wind, wave, and current acted on the platform together, the maximum strain value can exceed 40 με. The strain of the structure under the combined action of wind, wave, and flow was significantly larger than that under wave load only.

Author Contributions

Conceptualization, D.-L.Z.; formal analysis, C.-W.B.; funding acquisition, G.-Y.W. and S.-X.Z.; investigation, D.-L.Z.; methodology, C.-W.B. and G.-H.D.; resources, G.-Y.W.; supervision, G.-Y.W. and G.-H.D.; writing—original draft, C.-W.B.; writing—review and editing, D.-L.Z. and S.-X.Z.

Funding

This research was funded by National Key R&D Program of China, Grant No. 2017YFC1404200; National Natural Science Foundation of China (NSFC), Grant No. 31972843; Research Fund of Power China Huadong Engineering Corporation, Project No. KY2018-ZD-03; and Fundamental Research Funds for the Central Universities, Project No. DUT18RC(3)076.

Acknowledgments

The authors acknowledge the technical support from Power China Huadong Engineering Corporation Limited.

Conflicts of Interest

The authors declare no conflict of interest.

References

  1. Elshafey, A.A.; Haddara, M.R.; Marzouk, H. Dynamic response of offshore jacket structures under random loads. Mar. Struct. 2009, 22, 504–521. [Google Scholar] [CrossRef]
  2. Dong, W.; Moan, T.; Gao, Z. Long-term fatigue analysis of multi-planar tubular joints for jacket-type offshore wind turbine in time domain. Eng. Struct. 2011, 33, 2002–2014. [Google Scholar] [CrossRef]
  3. Park, M.S.; Koo, W.; Kawano, K. Numerical analysis of the dynamic response of an offshore platform with a pile-soil foundation system subjected to random waves and currents. J. Waterw. Port Coast. Ocean Eng. 2012, 138, 275–285. [Google Scholar] [CrossRef]
  4. Taylor, P.H.; Santo, H.; Choo, Y.S. Current blockage: Reduced Morison forces on space frame structures with high hydrodynamic area, and in regular waves and current. Ocean Eng. 2013, 57, 11–24. [Google Scholar] [CrossRef]
  5. Santo, H.; Taylor, P.H.; Day, A.H.; Nixon, E.; Choo, Y.S. Current blockage and extreme forces on a jacket model in focused wave groups with current. J. Fluid. Struct. 2018, 78, 24–35. [Google Scholar] [CrossRef]
  6. Santo, H.; Taylor, P.H.; Day, A.H.; Nixon, E.; Choo, Y.S. Blockage and relative velocity Morison forces on a dynamically-responding jacket in large waves and current. J. Fluids Struct. 2018, 81, 161–178. [Google Scholar] [CrossRef] [Green Version]
  7. Saha, N.; Gao, Z.; Moan, T.; Naess, A. Short-term extreme response analysis of a jacket supporting an offshore wind turbine. Wind Energy 2014, 17, 87–104. [Google Scholar] [CrossRef]
  8. Raheem, A.; Shehata, E. Study on nonlinear response of steel fixed offshore platform under environmental loads. Arabian J. Sci. Eng. 2014, 39, 6017–6030. [Google Scholar] [CrossRef]
  9. Zadeh, S.M.G.; Baghdar, R.S.; Olia, S.V.K. Finite element numerical method for nonlinear interaction response analysis of offshore jacket affected by environment marine forces. Open J. Mar. Sci. 2015, 5, 422–442. [Google Scholar] [CrossRef]
  10. Devaney, L.C. Breaking Wave Loads and Stress Analysis of Jacket Structures Supporting Offshore Wind Turbines; University of Manchester: Manchester, UK, 2012. [Google Scholar]
  11. Dezvareh, R.; Bargi, K.; Mousavi, S.A. Control of wind/wave-induced vibrations of jacket-type offshore wind turbines through tuned liquid column gas dampers. Struct. Infrast. Eng. 2016, 12, 312–326. [Google Scholar] [CrossRef]
  12. Wang, W.H.; Gao, Z.; Moan, T.; Li, X. Model Test and Numerical Analysis of a Multi-Pile Offshore Wind Turbine under Seismic, Wind, Wave and Current Loads. J. Offshore Mech. Arct. Eng. 2016, 139, 031901. [Google Scholar] [CrossRef]
  13. Wei, K.; Myers, A.T.; Arwade, S.R. Dynamic effects in the response of offshore wind turbines supported by jackets under wave loading. Eng. Struct. 2017, 142, 36–45. [Google Scholar] [CrossRef] [Green Version]
  14. Gho, W.M.; Yang, Y. Ultimate strength of completely overlapped joint for fixed offshore wind turbine jacket substructures. J. Mar. Sci. Appl. 2019, 18, 99–113. [Google Scholar] [CrossRef]
  15. Liu, F.; Li, X.; Tian, Z.; Zhang, J.; Wang, B. Transient response estimation of an offshore wind turbine support system. Energies 2019, 12, 891. [Google Scholar] [CrossRef]
  16. Lin, G.; Zhu, T.; Lin, B. Dynamic model test similarity criterion. J. Dalian Univ. Technol. 2000, 40, 1–8. (In Chinese) [Google Scholar]
  17. Chakrabarti, S. Handbook of Offshore Engineering; Elsevier Press: Amsterdam, The Netherlands, 2005. [Google Scholar]
  18. API. Recommended Practice for Planning, Designing, and Constructing Fixed Offshore Platforms-Working Stress Design, 22nd, ed.; American Petroleum Institute Recommended Practice 2A-WSD: Washington, DC, USA, 2007. [Google Scholar]
  19. Gaeta, M.G.; Bonaldo, D.; Samaras, A.G.; Carniel, S.; Archetti, R. Coupled wave-2D hydrodynamics modeling at the Reno river mouth (Italy) under climate change scenarios. Water 2018, 10, 1380. [Google Scholar] [CrossRef]
  20. Hu, X.; Yang, F.; Song, L.; Wang, H. An unstructured-grid based morphodynamic model for sandbar simulation in the Modaomen Estuary, China. Water 2018, 10, 611. [Google Scholar] [CrossRef]
  21. Petti, M.; Bosa, S.; Pascolo, S. Lagoon sediment dynamics: A coupled model to study a medium-term silting of tidal channels. Water 2018, 10, 569. [Google Scholar] [CrossRef]
  22. He, Z.; Hu, P.; Zhao, L.; Wu, G.; Pähtz, T. Modeling of breaching due to overtopping flow and waves based on coupled flow and sediment transport. Water 2015, 7, 4283–4304. [Google Scholar] [CrossRef]
  23. Sun, Z.Z.; Bi, C.W.; Zhao, S.X.; Dong, G.H.; Yu, H.F. Experimental analysis on dynamic responses of an electrical platform for an offshore wind farm under earthquake load. J. Mar. Sci. Eng. 2019, 7, 279. [Google Scholar] [CrossRef]
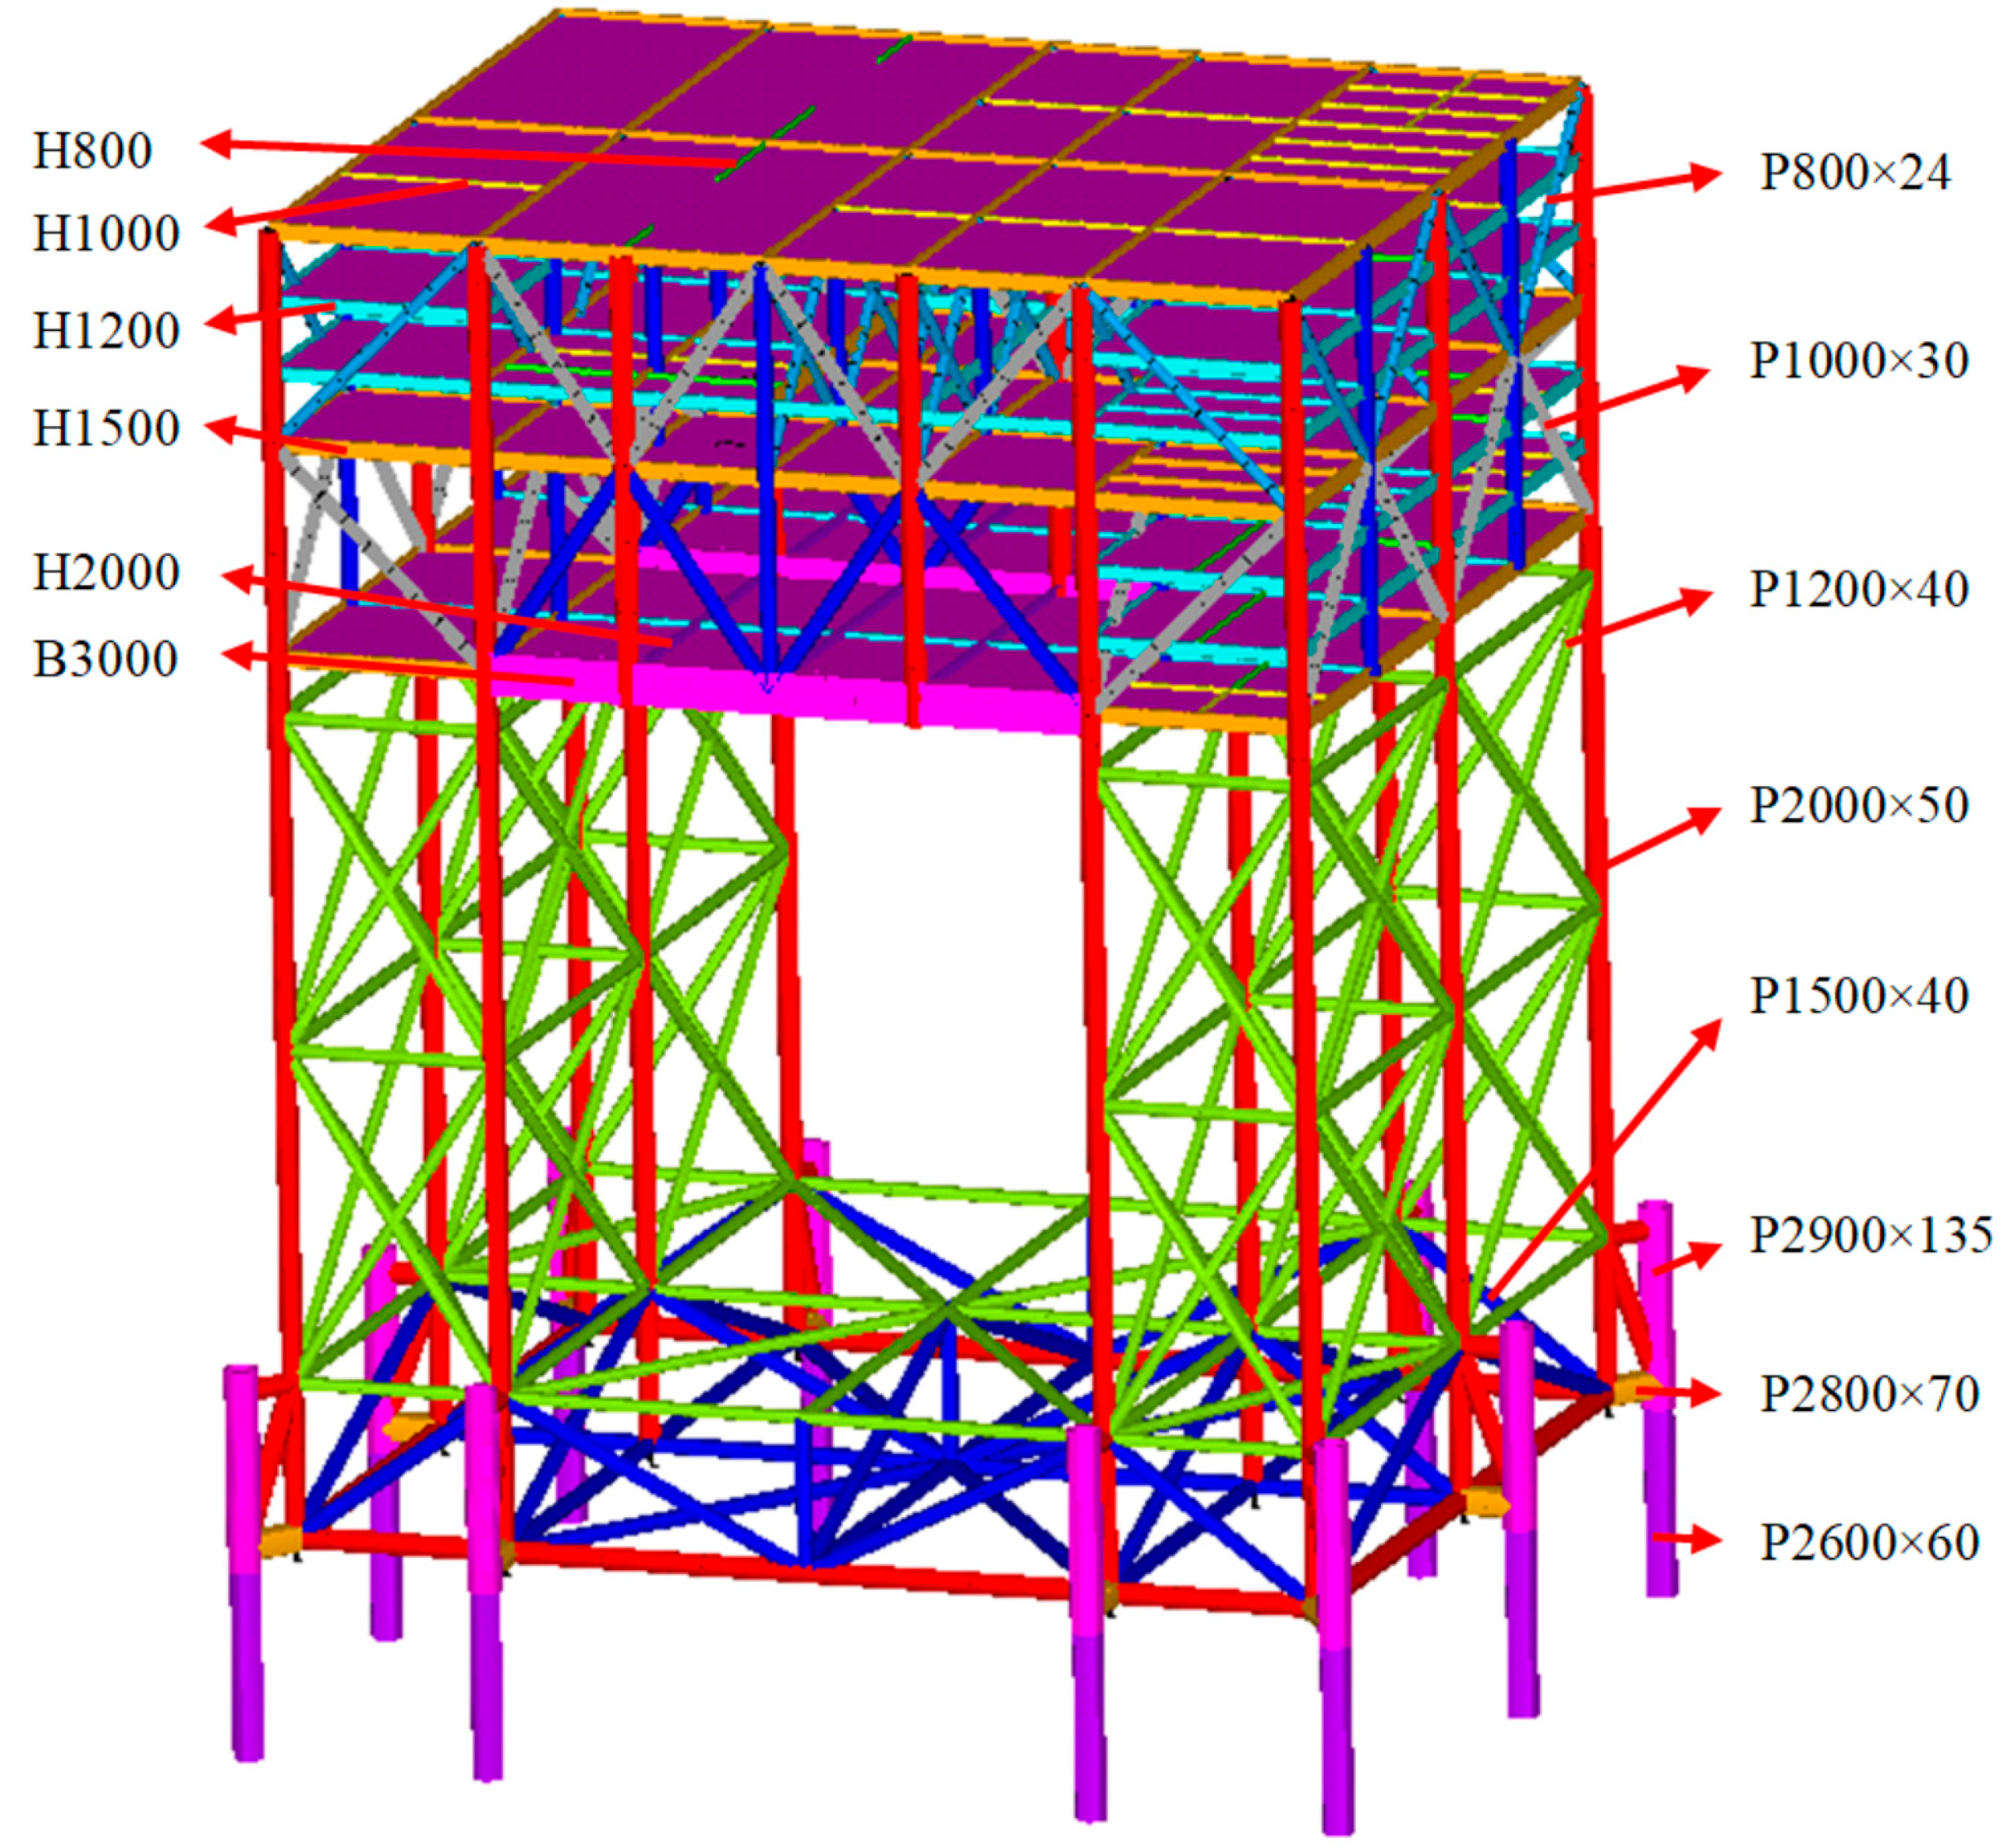
Figure 1. Schematic diagram of the electrical platform.
Water 11 02042 g001
Figure 2. The experimental layout of the electrical platform model.
Water 11 02042 g002
Figure 3. The electrical platform model in the wave flume. (a) In air; (b) In water.
Water 11 02042 g003
Figure 4. The experimental layout of acceleration sensors. (a) Acceleration sensor; (b) Acceleration sensors on the platform.
Water 11 02042 g004
Figure 5. Measurement positions of dynamic response at key nodes of the electrical platform.
Water 11 02042 g005
Figure 6. Time-series of the strain response of strain gauges at measurement position S5 in waves. Wave condition: H = 0.10 m and T = 1.6 s.
Water 11 02042 g006
Figure 7. Time-series of the strain response at various measurement positions in waves. Wave condition: H = 0.15 m and T = 1.4 s.
Water 11 02042 g007
Figure 8. The structural strains at various measurement positions in waves. (a) Variation with wave height when wave period T = 1.6 s; (b) Variation with wave period when wave height H = 0.15 m.
Water 11 02042 g008
Figure 9. Time-series of the strain response at various measurement positions in storm conditions. (a) S1; (b) S2; (c) S3; (d) S4.
Water 11 02042 g009aWater 11 02042 g009b
Figure 10. The peak accelerations at various measurement positions in waves. (a) Variation with wave height when wave period T = 1.6 s; (b) Variation with wave period when wave height H = 0.15 m.
Water 11 02042 g010
Figure 11. Frequency-domain comparison of acceleration responses at measurement positions J7 and J8 in waves. (a) J7; (b) J8.
Water 11 02042 g011
Figure 12. Time-series of the acceleration response at various measurement positions in wave condition A5. (a) J1, J2, J3; (b) J4, J5, J6; (c) J7, J8; (d) J3, J6, J7.
Water 11 02042 g012
Figure 13. Frequency domain comparison of acceleration responses at various measurement positions in storm condition C2. (a) J2 and J6; (b) J7 and J8.
Water 11 02042 g013
Figure 14. Time-series of the acceleration response at various measurement positions in storm condition C2. (a) J1, J2, J3; (b) J4, J5, J6; (c) J7, J8; (d) J3, J6, J7.
Water 11 02042 g014
Figure 15. Structural strain responses at various measurement positions of the electrical platform with different water depths in waves for wave period of 1.6 s. (a) S1; (b) S2; (c) S3; (d) S4; (e) S5; (f) S6.
Water 11 02042 g015
Figure 16. Structural strain responses at various measurement positions of the electrical platform with various attack angles in waves for wave period of 1.6 s. (a) S1; (b) S2; (c) S3; (d) S4; (e) S5; (f) S6.
Water 11 02042 g016
Figure 17. Time-series of the strain response at measurement position S2 in both wave and storm conditions.
Water 11 02042 g017
Figure 18. Structural peak accelerations at various measurement positions of the electrical platform with different water depths in waves for wave period of 1.6 s at attack angle of 90°. (a) J1; (b) J2; (c) J3; (d) J4; (e) J5; (f) J6; (g) J7; (h) J8.
Water 11 02042 g018
Table 1. The similarity relation of basic parameters for the experimental model design.
ParameterSimilaritySimilar Scale
Lengthλ60
AreaλA1120.7
Volumeλ·λA67,241
Densityλρ = 11
Massλρ·λ·λA67,241
Speedλ0.57.746
Accelerationλg = 11
Timeλ0.57.746
Frequencyλ−0.50.129
Forceλ3603
Momentλ4604
Moment of areaλA·λr24.59e6
Moment of massλ·λA·λr22.76e8
Stressλ4·λD·λA−1·λr−2176.3
Table 2. Geometric dimension parameters of the superstructure model.
Member TypeModel NumberSectional Dimension (mm)Section for Model
Box beamB300059.1 × 23Rectangular section (Height × Width)
I-beamH200045.5 × 8.6
H150034.2 × 6.8
H120027.6 × 6.4
H100022.8 × 5.1
H80018.1 × 3.8
PipeP2000 × 5032 × 3Pipe (Outside diameter × Thickness)
P1500 × 4025 × 2
P1000 × 3022Solid bar (Diameter)
P800 × 2418
Table 3. Geometric dimension parameters of the jacket structure model.
Member TypeModel NumberSectional Dimension (mm)Section for Model
PipeP2000 × 5032 × 3Pipe (Outside diameter × Thickness)
P1500 × 4025 × 2
P1200 × 4020 × 2
P2800 × 7045 × 5
P2600 × 6045 × 3
P2900 × 13550 × 5
Table 4. Regular waves for the physical model experiment.
Test NumberWave Height (m)Wave Period (s)
A10.05 (3) 11.6 (12.4)
A20.10 (6)1.6 (12.4)
A30.15 (9)1.0, 1.2, 1.4, 1.6, 1.8
(7.7, 9.3, 10.8, 12.4, 13.9)
A40.20 (12)1.6 (12.4)
A50.25 (15)1.6 (12.4)
1 The values in parentheses represent the prototype values.
Table 5. Regular waves for the physical model experiment.
Test NumberSignificant Wave Height (m)Significant Wave Period (s)
B10.15 (9)1.6 (12.4)
B20.20 (12)1.8 (13.9)
Table 6. Storm condition for the physical model experiment.
Test NumberWind Speed (m/s)Current Speed (m/s)Irregular Wave
C14.6 (36)0.226 (1.75)Hs = 0.15 m
Tp = 1.6 s
C26.6 (51.5)0.258 (2)Hs = 0.20 m
Tp = 1.8 s
Table 7. Strain-response values at various measurement positions in waves (unit: με).
Wave ConditionMeasuring Point
123456
H0.05_T1.61.72.30.50.131.90.53
H0.10_T1.63.45.20.650.353.61.2
H0.15_T1.01.85.11.20.83.72.8
H0.15_T1.22.16.50.90.53.73.3
H0.15_T1.43.97.71.10.64.93
H0.15_T1.65.38.21.20.8162.4
H0.15_T1.86.49.21.71.36.72.2
H0.20_T1.68.212.11.91.58.83.8
H0.25_T1.610.616.23.22.511.85.3
Table 8. Peak values of acceleration response at various measurement positions in waves (unit: m/s2).
Wave ConditionMeasuring Point
J1J2J3J4J5J6J7J8
H0.05_T1.60.01970.0240.02510.01210.00440.00470.00350.0075
H0.10_T1.60.03360.06440.06910.03680.00820.00830.00650.0055
H0.15_T1.00.10780.21100.20870.10630.02260.02190.02080.0174
H0.15_T1.20.07220.15100.1670.06190.01730.01460.01190.0155
H0.15_T1.40.06300.14200.15610.0560.01320.01260.00950.0118
H0.15_T1.60.05770.12960.13130.06010.01340.01410.01240.0111
H0.15_T1.80.05100.10810.11180.05520.01120.01460.01060.0104
H0.20_T1.60.07150.13690.16240.0770.01630.01460.01260.0131
H0.25_T1.60.0780.15050.19010.0750.01730.01490.01520.0178