Article

The Effect of Fertigation on Cabbage (Brassica oleracea L. var. capitata) Grown in a Greenhouse

1
State Key Laboratory of Simulation and Regulation of Water Cycle in River Basin, China Institute of Water Resources and Hydropower Research, Beijing 100038, China
2
College of Water Conservancy and Civil Engineering, China Agricultural University, Beijing 100083, China
3
College of Urban and Rural Construction, Hebei Agricultural University, Baoding 071001, China
*
Author to whom correspondence should be addressed.
Water 2020, 12(4), 1076; https://doi.org/10.3390/w12041076
Submission received: 21 February 2020 / Revised: 10 March 2020 / Accepted: 8 April 2020 / Published: 10 April 2020
(This article belongs to the Special Issue Irrigation Scheduling and Crop Water Relations)

Abstract

:
Understanding the response of crop growth to water and fertilizer is helpful to improve their management and use efficiency. Three water and fertilizer coupling treatments were designed to carry out a two-season trial on two cabbage (Brassica oleracea L. var. capitata) cultivars in spring and autumn in the Beijing–Tianjin–Hebei region. The irrigation timings of the three treatments were controlled by the soil moisture content of 0–20 cm soil layer. Treatment 1 (LWHF): when the soil moisture content was decreased to 75% of the field capacity (θf), irrigation was carried out (i.e., the lower limit of irrigation was 75%θf), the critical soil moisture content for stopping irrigation was 90%θf (upper limit of irrigation), and the nitrogen (N) application amount was 400 kg/ha; treatment 2 (HWLF): the lower and upper limits of irrigation were 85%θf and 100%θf, respectively, and the N application amount was 200 kg/ha; and treatment 3 (MWMF): the lower and upper limits of irrigation were 75%θf and 100%θf, respectively, and the N application amount was 300 kg/ha. The results showed that the yield and its related parameters of cabbage in spring were higher than those in autumn because of the use of different cultivars and seasons. The growth indices of HWLF and MWMF in the two seasons were larger than that of LWHF, and the yields of HWLF were the highest, 78.37 t/ha (spring) and 64.42 t/ha (autumn), respectively. The nitrogen use efficiencies (NUEs) of LWHF in spring and HWLF in autumn were the highest, 213.29 kg/kg and 391.83 kg/kg, respectively. In general, there were statistically significant differences in the cumulative increment in plant height, stem diameter and leaf area in the two-season trial, yield in autumn and NUE in spring among the three treatments. In addition, there was a significant positive linear correlation between almost all indices in different growth stages and the corresponding evapotranspiration (ETi). It is suggested that the application of drip irrigation under mulch should be approximately 114.7–125.0 mm, and the N fertilization should be about 200 kg/ha.

1. Introduction

Among many factors affecting crop growth, water and fertilizer are key factors that can be adjusted and controlled. In actual agricultural production, to obtain higher yields, excessive water use and fertilization have become standard practices, and these practices not only leach nutrients from surface soil to deep soil, reducing water and nutrient use efficiency [1,2], but may also cause soil environmental deterioration [3,4]. To improve the efficiency of water and fertilizer use and determine the appropriate amount of water and fertilizer for crop growth, some authors have studied winter wheat [5], potato [6,7,8], tomato [9,10], broccoli [11,12], onion [13] and areca nut [14], among other crop species. These studies proposed that drip irrigation and fertilization can achieve higher water and fertilizer use efficiency and recommended improved water and fertilization management schemes for these crops compared with standard practices.
Water resources are extremely scarce in the Beijing–Tianjin–Hebei region, with agricultural water consumption close to 57.1% of the total. The vegetable planting area accounts for approximately 13% of the grain crop planting area, but vegetable water consumption accounts for approximately 20% of the grain crop water consumption. At present, the greenhouse vegetable planting area accounts for 58.7% of the vegetable planting area in the Beijing–Tianjin–Hebei region, and the planting area of greenhouse vegetables, water consumption and fertilization amount are increasing annually. It has been reported that the amount of nitrogen (N) fertilizer used in greenhouse vegetable production in this area is 1.3–5.8 times higher than the recommended value, and the nitrate content in groundwater of vegetable fields in some areas exceeds 37.5%–44.8% [15,16,17]. Although drip irrigation and fertilization are also used in some greenhouse vegetable planting, the waste of irrigation and fertilization is still very serious due to the lack of scientific and rational management of water and fertilizer. Therefore, it is of great significance to determine reasonable water and fertilizer management of greenhouse vegetables in the Beijing–Tianjin–Hebei region for regional water savings and pollution reduction.
The area of cabbage (Brassica oleracea L. var. capitata) is approximately 100,000 ha in the Beijing–Tianjin–Hebei region, ranking second among leafy vegetables. Moreover, cabbage has a large planting scale in many areas at home and abroad. Some authors have conducted studies on water and fertilizer consumption during the growth period of Brassica species. Due to differences in climate, soil physical properties and limitations of the experimental schemes, the results of different studies are different (Table 1). At present, research on cabbage has mainly been conducted in the field, and research on cabbage planting in greenhouses has been less frequently reported. In addition, research on crop biomass and N uptake and utilization has mainly focused on wheat [25,26], maize [27,28] and cotton [29], and there have also been some reports on vegetable biomass, such as tomato [30,31,32] and winter rape [33]. However, few reports have been put forth on the biomass allocation and nitrogen use efficiency (NUE) of cabbage in response to fertigation under mulch in greenhouses. To date, no relevant studies have been reported on the relationships between evapotranspiration (ETi) and the growth index of cabbage.
At present, most research results regarding the effect of water and fertilizer on crop growth have been carried out separately for water and fertilizer [34]. In fact, there is an incentive effect between water and fertilizer. According to relevant studies, an appropriate ratio of water and fertilizer is beneficial for increasing crop yield. The combination of high irrigation and N application may not necessarily achieve the highest yield [10,11,18], but it will certainly increase production costs. Therefore, within the recommended threshold range of published articles, water and fertilizer coupling treatments were designed in this study, and the aims were to evaluate (i) the response of different cultivars of cabbage to water and fertilizer coupling treatments, (ii) the effects of different water and fertilizer coupling treatments on cabbage growth, yield, biomass and water and nitrogen use efficiency and (iii) the relationships between ETi and the indices at different growth stages of cabbage. The aim of this study is to propose a better water and fertilizer management model suitable for greenhouse cabbage to guide local agricultural production and to provide theoretical guidance for the rational development and utilization of water resources and the reduction of soil environmental pollution in the Beijing–Tianjin–Hebei.

2. Materials and Methods

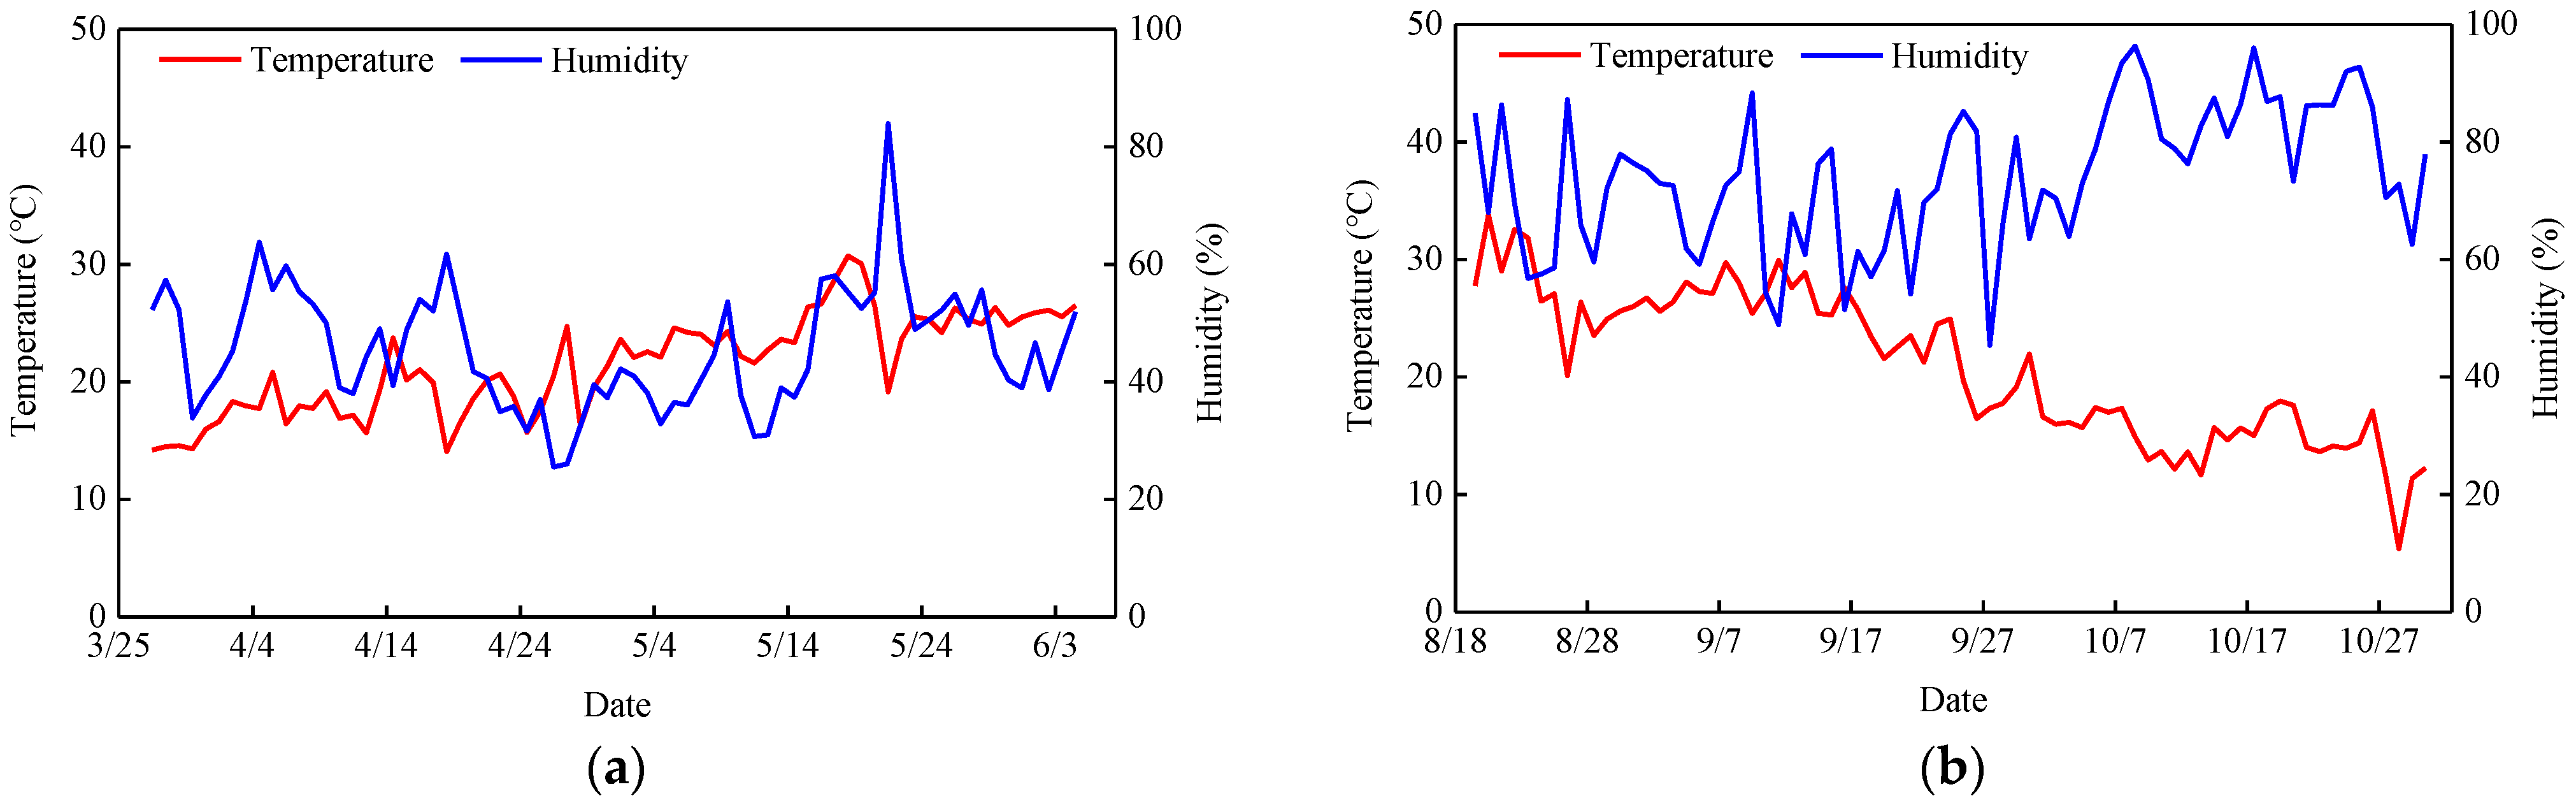
2.1. Experimental Conditions

The trial was conducted in two plastic greenhouses at the water-saving irrigation demonstration base of China Irrigation and Drainage Development Center in Beijing (116°34′52″ N, 40°8′20″ E). The region has a warm temperate, continental semi-humid monsoon climate, with an annual mean temperature of 11.2 °C and annual mean precipitation of 625 mm. The trial was conducted in two seasons: the first trial (spring season) was conducted in the first greenhouse from March to June 2017, while the second trial (autumn season) was conducted in the second greenhouse from August to October 2017. The two greenhouses were 3 m apart. Before the beginning of the trial, soil samples were collected in each greenhouse. After air-drying, the soil samples were crushed and sifted. The particle composition of each layer was measured by a Malvern laser particle size analyzer, as shown in Table 2. Each layer of soil in the No. 1 greenhouse was a silt loam (international system). The 60–80 cm soil layer in the No. 2 greenhouse was silt, and the other layers were silt loam. In addition, the field capacity (θf) of the 1 m deep soil layer in both greenhouses varied from 0.330 cm3/cm3 to 0.380 cm3/cm3, the wilting point varied from 0.151 cm3/cm3 to 0.168 cm3/cm3, the bulk density was between 1.46 g/cm3 and 1.61 g/cm3, and the pH value was between 7.77 and 8.66. Before the beginning of the spring trial, the initial nitrate content and ammonium content in the 0–60 cm soil layer were 65.18 mg/kg and 15.46 mg/kg, respectively.
The daily average temperature in the greenhouses for the spring and autumn trials were 15–25 °C and 10–30 °C, respectively, and the daily air average relative humidity levels were 30%–60% and 50%–90%, respectively. The fluctuation range of the average temperature and relative humidity in autumn was larger than that in spring, and the daily average temperature in the autumn trial was less than 20 °C starting in October, but the average relative humidity increased obviously and stayed at 75%–95% (Figure 1).

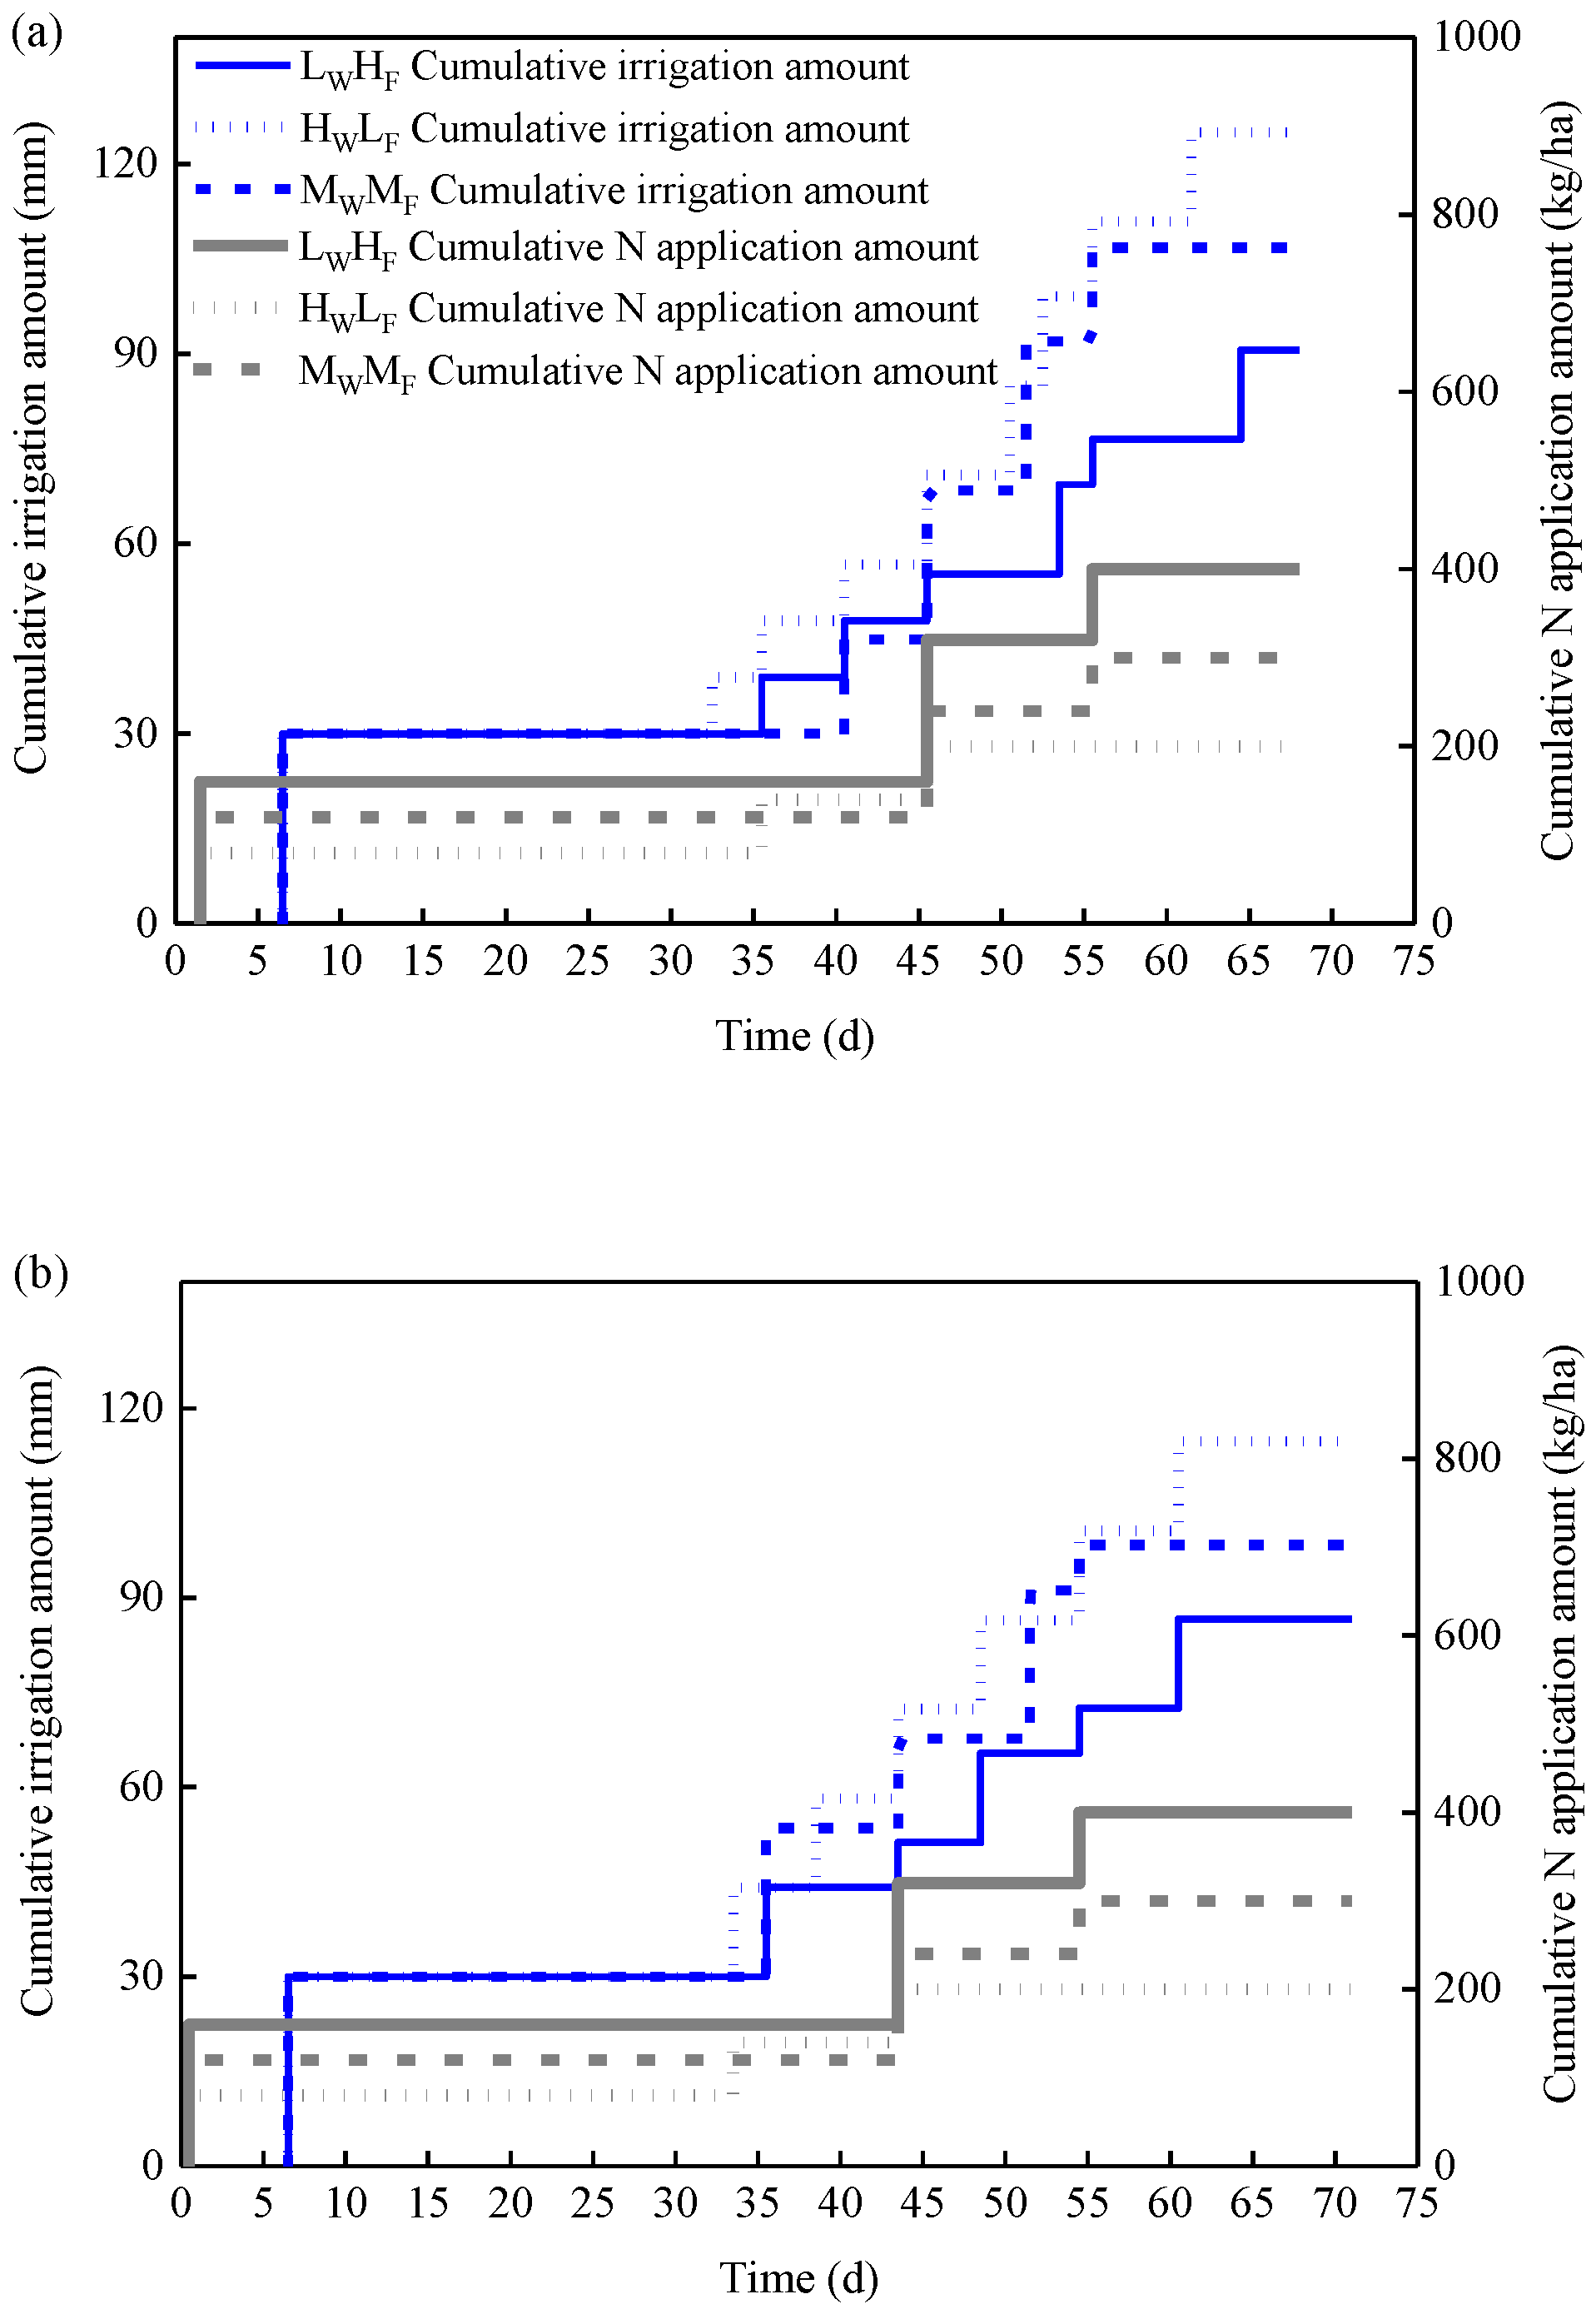
2.2. Irrigation and Fertilization Treatments

Considering that the water and fertilizer coupling treatments in the trial were designed within the threshold range recommended by previously published articles [18,19,20,21,22,23,24], these treatments were considered to be better for cabbage growth. The purpose of this work was to select the water and fertilizer coupling scheme for cabbage growth in greenhouse in the Beijing–Tianjin–Hebei from these treatments through field comparative trial. Therefore, only three water and fertilizer coupling treatments were designed in this study.
The irrigation timing of the three treatments were controlled by soil moisture content of 0–20 cm soil layer. Treatment 1: when the soil moisture content was decreased to 75%θf, irrigation was carried out (i.e., the lower limit of irrigation was 75%θf), the critical value of the soil moisture content for stopping irrigation was 90%θf (upper limit of irrigation), and the N application amount was 400 kg/ha. The irrigation amount of the cabbage growth period in this treatment was the smallest compared with that of other treatments; thus, it was called the low water and high fertilizer (LWHF) treatment. Treatment 2: the lower and upper limits of irrigation were 85%θf and 100%θf, respectively, and the N application amount was 200 kg/ha. The irrigation amount of this treatment was the largest compared with that of other treatments; thus, it was called the high water and low fertilizer (HWLF) treatment. Treatment 3: the lower and upper limits of irrigation were 75%θf and 100%θf, respectively, and the N application amount was 300 kg/ha; thus, it was called the medium water and fertilizer (MWMF) treatment. The timing and amount of the N application and the upper and lower limits of irrigation water for each treatment are shown in Table 3, and the date and amount of irrigation and fertilization are shown in Figure 2; the amount of irrigation of cabbage can be calculated by the following formula:
M = 0.1 p h θ f ( K 1 K 2 ) / η
where M is the amount of each irrigation, mm; p is the soil moisture ratio; h is the calculated irrigation depth, 20 cm was used to calculate the irrigation depth before the early heading stage of spring cabbage, 30 cm was used after the early heading stage, and 30 cm was used during the autumn cabbage growing period; θf is the calculated (volume) field capacity of the soil layer, cm3/cm3; K1 and K2 are the percentages of the upper and lower limit of irrigation water to the θf, respectively,%; and η is the utilization coefficient of irrigation water.
The same amounts of phosphorus and potassium fertilizer were applied to each treatment: 100 kg/ha (containing P2O5) and 150 kg/ha (containing K2O), respectively, of which all phosphate fertilizer and 40% of the potassium fertilizer were applied as the base fertilizer before cabbage transplantation, and the remaining potassium fertilizer, applied as topdressing fertilizer, was added to the soil through the irrigation water (40% of the total amount was used in the early heading, and 20% was used in the late heading stage). The N, P and K fertilizers used were urea (N ≥ 46%), calcium superphosphate (P2O5 ≥ 16%) and potassium sulphate (K2O ≥ 50%), respectively.

2.3. Measurements

Five cabbage plants with similar growth potential were marked in each plot after transplanting, and their stem diameter, plant height, leaf number, leaf area, leaf spread and leaf area index (LAI) were measured every seven days.
The measurement methods were as follows:
  • The measured values of stem diameter were the average values of the marked plants measured by a Vernier caliper (accuracy 0.002 mm) 5 cm from the ground.
  • The measured values of plant height, leaf area and leaf spread were obtained from three repeated measurements of the plants with a ruler (accuracy 0.5 mm).
  • The leaf number was determined after three repeated counts of the plants.
  • The LAI was measured by an LP-80 (AccuPAR PAR/LAI Ceptometer, METER Group, Inc., Pullman, WA, USA) at 11:00 AM and 1:00 PM on a sunny day every 7 days, and the two values per plot were averaged as measured values.
When the cabbage was harvested, the weights of the aboveground part and the head of each cabbage were determined by an electronic scale with a precision of 10 g.
To measure the weight of cabbage roots, three cabbage plants were randomly selected from each plot after harvesting. Pits with a length and width of 40 cm × 40 cm were excavated around their roots, and the depth was divided into three layers: 0–20 cm, 20–40 cm and 40–60 cm. The excavated soil with roots was soaked in barrels for more than 1 hour, after which sieving was conducted and impurities were removed from the roots. The roots were washed with clean water twice and were then returned to the laboratory where remaining water was absorbed with filter paper. After being weighed with an electronic scale with an accuracy of 0.01 g, roots were placed in an oven at 105 °C for 30 min, which was then adjusted to 60 °C to continue drying to a constant weight. In each plot, the aboveground parts of the three plants whose roots had been excavated were divided into stems, leaves and heads; dust on the surface was washed with clear water, followed by wiping with filter paper, and then the aboveground parts were weighed with an electronic scale with an accuracy of 0.01 g. These parts were placed in an oven at 105 °C for 30 min, which was then adjusted to 60 °C to continue drying to a constant weight, after which the aboveground parts were weighed.
The steps used to determine the total nitrogen (TN) content of the cabbage plants were as follows: grinding and sieving the dried root, stem, leaf and head samples separately and sealing them in self-sealing bags to prevent dampness. After the trial, the TN content (%) of these samples was measured by a Kjeldahl nitrogen meter (Kjeltec2300, FOSS, Hillerød, Denmark), and then the TN content of each part of the cabbage plants was calculated; the TN content of each plant part (mg/g) = the TN content (%) of the corresponding part × 10.
A Trime-PICO-IPH sensor was used to measure the soil water content every 2–3 days during the growth period of cabbage (10 cm per layer, 100 cm for the total depth). The evapotranspiration (ETi, i = 1, 2, 3 and 4, representing seeding, rosette, early heading and late heading stages, respectively) of cabbage in each growth stage was calculated by the water balance equation. Total evapotranspiration (ET) was the sum of ETi in each growth stage.
Water productivity and N use-related indicators were calculated using the following methods:
  • The water productivity of yield (WPY) is the ratio of crop yield (Y) to ET during the entire crop growth period.
  • The water productivity of biomass (WPB) is the ratio of the final biomass (B) to the ET during the entire crop growth period.
  • The harvest index (HI) is the ratio of Y to B.
  • Total nitrogen uptake (TNU):
TN U = 1 100 i = 1 n N i B i
where n = 4; Ni is the TN content of roots, stems, leaves and bulbs; and Bi is the total dry weight of the corresponding part.
  • NUE is the ratio of Y to TNU.
  • The nitrogen harvest index (HIN) is the ratio of fruit nitrogen uptake to TNU.

2.4. Experimental Design and Statistical Analysis

Two-season trial on two cabbage (Brassica oleracea L. var. capitata) cultivars in spring and autumn were carried out for three irrigation and fertilizer coupling treatments. The spring test cabbage cultivar was “Super Chunfeng”, sown on February 8, 2017, transplanted on March 29, and harvested on June 3; the autumn test cultivar was “Zhonggan 201”, sown on July 22, 2017, transplanted on August 25, and harvested on October 28.
The greenhouse was designed with 9 plots (three treatments, each treatment was replicated three times), each of which was 5 m × 2.8 m. To avoid possible lateral exchange of water between plots, a buffer zone between adjacent plots was set, and 500 cm × 60 cm plastic cloth was buried vertically in the middle of the buffer zone. The widths of the protected areas at both ends of the greenhouse were 200 cm and 220 cm. Fertilization by drip irrigation under mulch was used in the trial. The nominal diameter of the insert patch drip irrigation belt was 16 mm, the dripper spacing was 30 cm, the designated flow rate was 1.7–2.0 L/h, and the average measured flow rate was 1.8 L/h. All treatments were planted alternately in wide (60 cm) and narrow rows (40 cm), with a plant spacing of 40 cm. Venturi fertilizer applicators and fertilizer barrels were installed at the head of the irrigation system for topdressing, and the amount of irrigation was measured by a water meter installed at the head. Each plot was equipped with a separate valve in front of it to control the timing of irrigation and fertilization. Trial data were also independently collected in each plot.
The recording and calculation of the experimental data were carried out in Excel 2016. Origin 8.0 drawing software was used for drawing and analysis. A one-way analysis of variance (ANOVA) was used to analyze the significance of the response of variables to water and fertilizer coupling treatments, and least significance difference (LSD) tests were used for multiple comparisons of mean values of variables. These statistical analyses were performed using the SPSS software package, version 22.0.

3. Results and Discussion

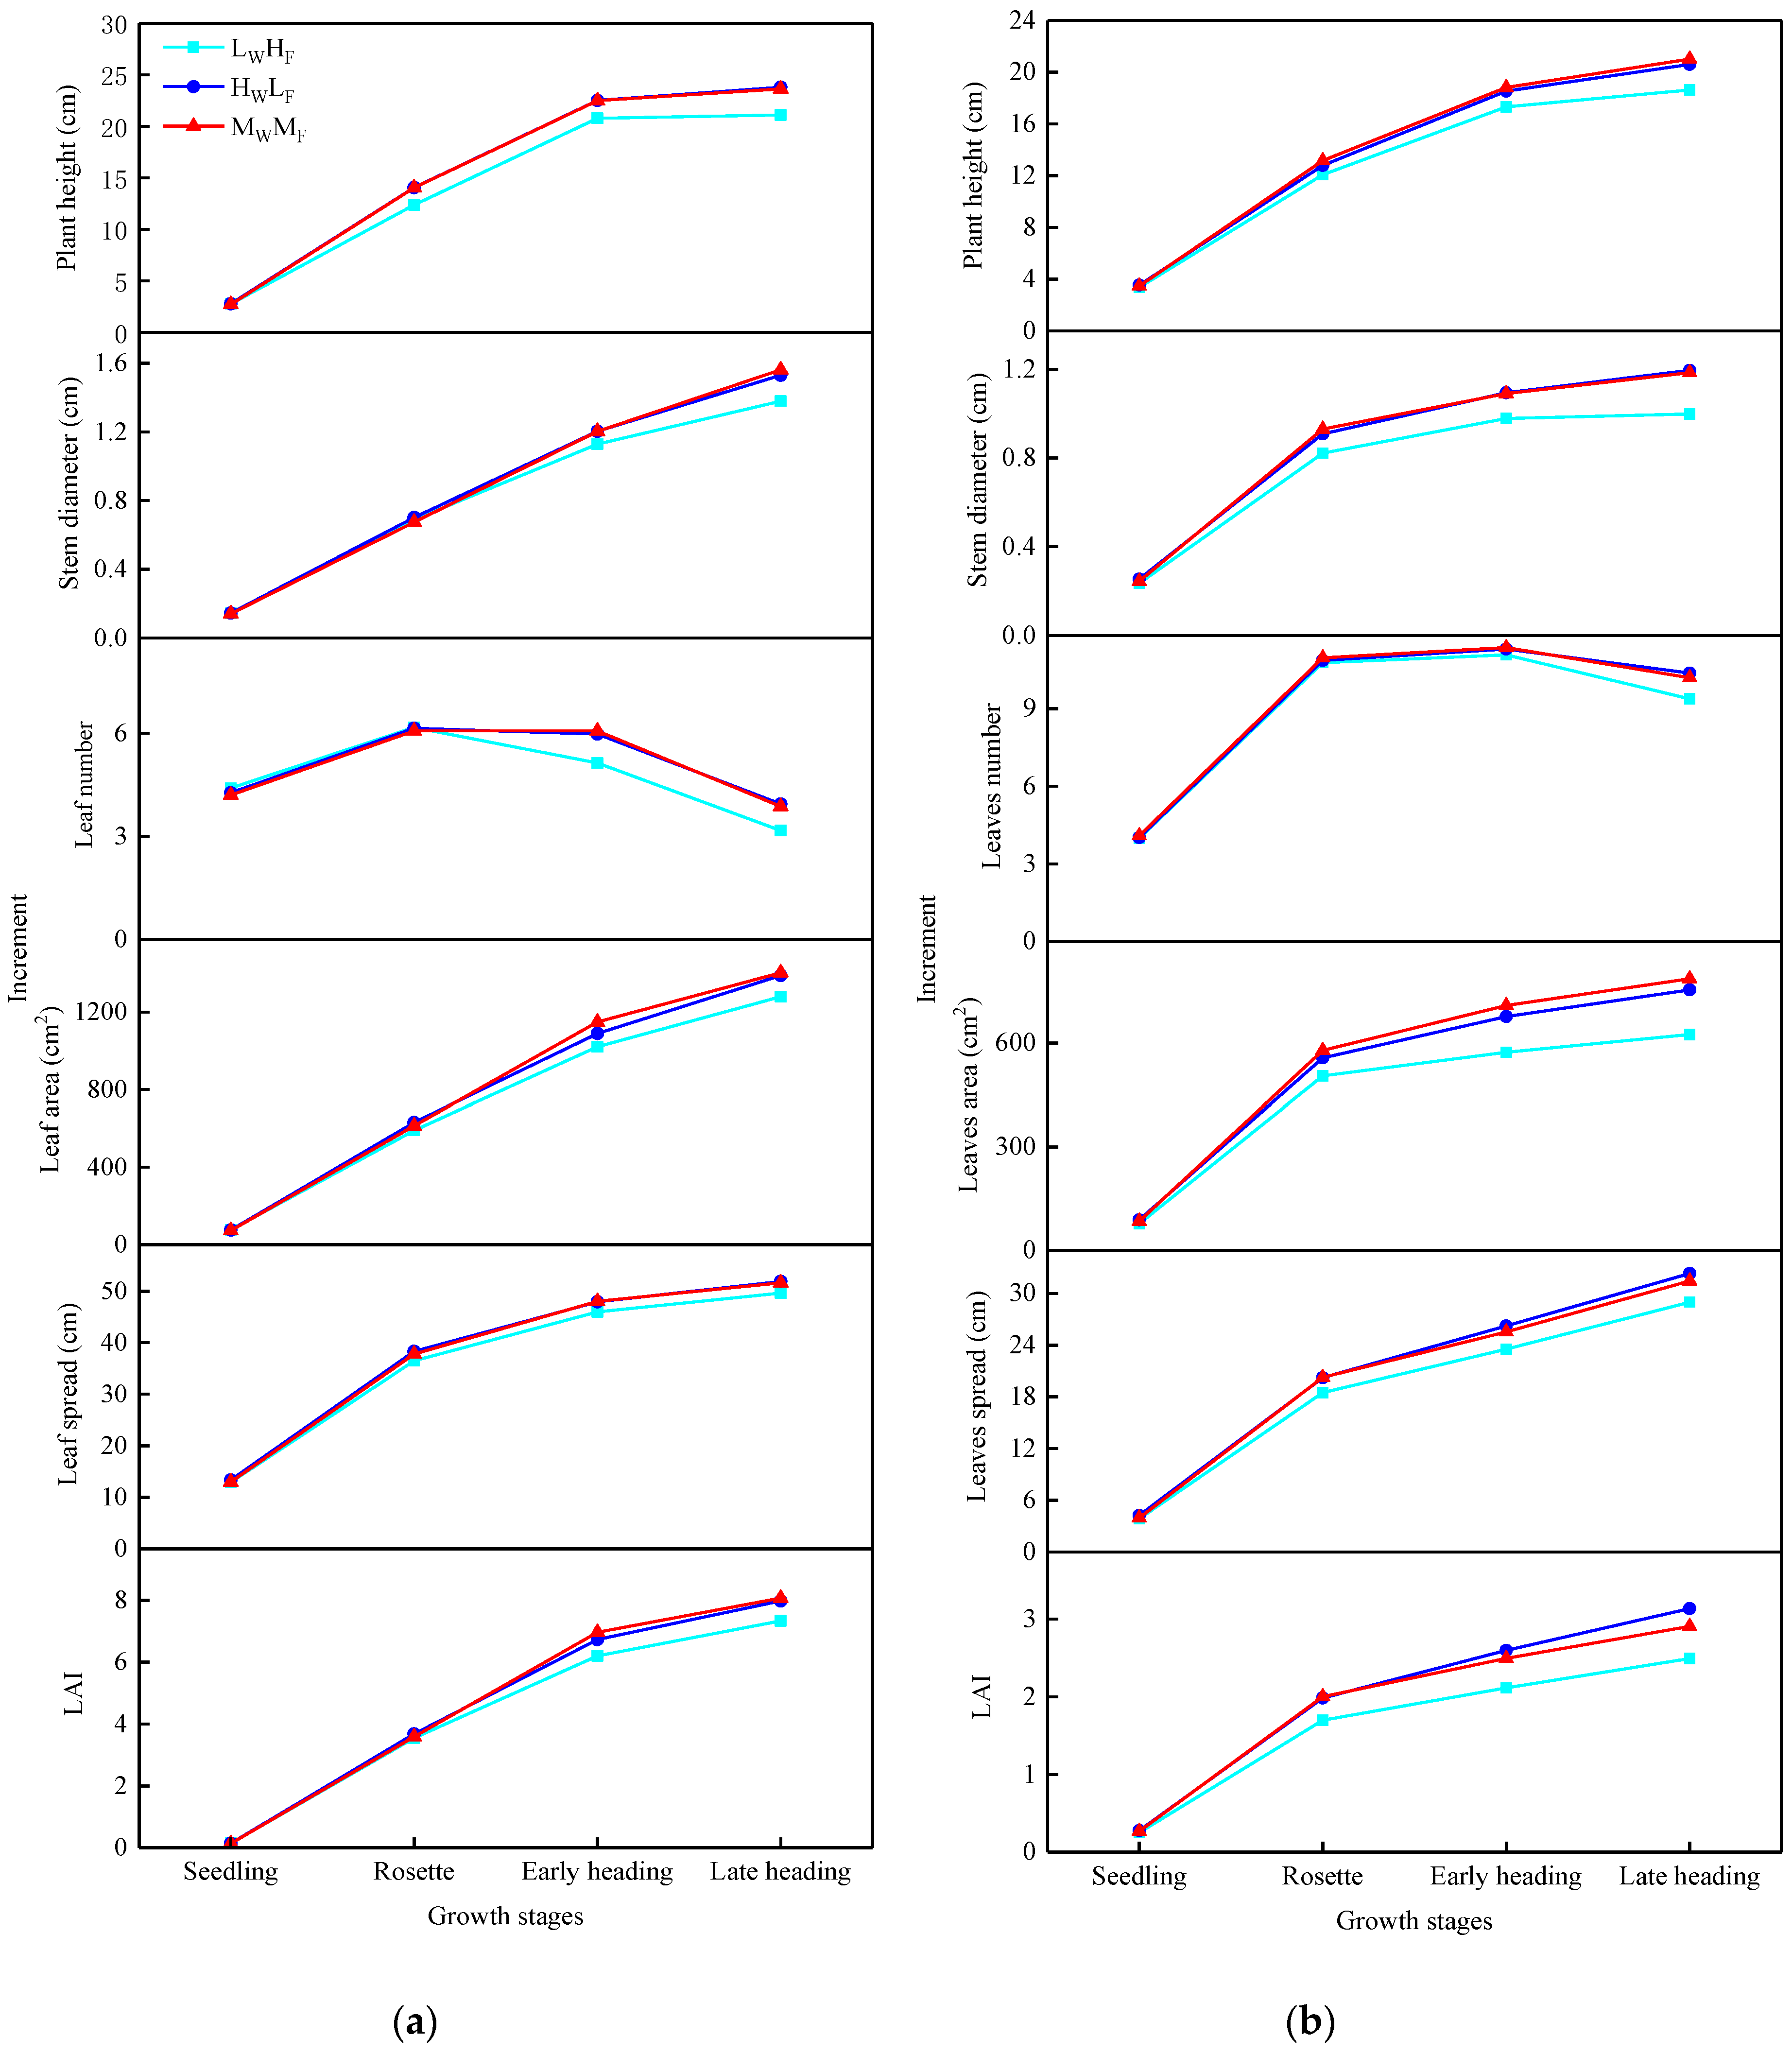
3.1. Effects of Different Treatments on the Growth of Cabbage

The increments in the growth indices of cabbage during different growth stages under different water and fertilizer coupling treatments are shown in Figure 3. Because of the different cultivars and growing seasons used in the two trials, the growth indices were also different. Compared with other growth stages, cabbage grew faster in the rosette and early heading stages in spring and in the rosette stage in autumn. The leaf area, leaf spread and LAI of cabbage in autumn were obviously smaller than those in spring. Moreover, different water and fertilizer coupling treatments also had a certain impact on the growth indices during the different stages. The effects of the two-season trial on plant height occurred mainly in the rosette stage and late heading stage, with the following ranking during the rosette stage: treatment 3 (MWMF) > treatment 2 (HWLF) > treatment 1 (LWHF). The stem diameter and leaf area increments of LWHF cabbage in spring were obviously lower than those of the other two treatments from the beginning of the early heading, and these two indices of LWHF in autumn were obviously lower than those of the other two treatments from the beginning of the rosette stage. The leaf number of spring cabbage grew fastest at the seedling stage and began to show negative growth with the gradual senescence of leaves at the beginning of heading. Treatment differences were mainly observed in the early heading stage, where MWMF was significantly higher than LWHF. The leaf number of autumn cabbage increased fastest in the rosette stage, whereas negative growth occurred in the late heading stage, but there was no significant difference between different treatments in each stage. Different treatments had little effect on the leaf spread of cabbage. The LAI values of spring cabbage at the early heading stage and autumn cabbage at the rosette stage were significantly affected by different treatments, and for both, MWMF was significantly higher than LWHF.
The one-way ANOVA results for the stage increment and cumulative increment of each growth index under different water and fertilizer coupling treatments are shown in Table 4. Among the effects of different treatments on the stage increment of spring cabbage, only the stem diameter reached a significant difference at the late heading stage (P < 0.05); the cumulative increment of plant height, stem diameter and LAI reached a significant difference at P < 0.05, and the leaf number and leaf area reached a significant difference at P < 0.01. Among the effects on the stage increment of autumn cabbage, plant height at the rosette stage and stem diameter at the late heading stage reached a significant difference at the P < 0.05 level, plant height at the late heading stage reached a significant difference at the P < 0.01 level and the cumulative increment of plant height, stem diameter, leaf area and leaf spread reached a significant difference at the P < 0.01 level.
According to the above analysis, the effects of different water and fertilizer coupling treatments on the growth indices were mainly manifested in the responses based on the cumulative increment and stage increment for the rosette and late heading stages, and the overall increment of the LWHF indices was less than those of HWLF and MWMF, while the difference between HWLF and MWMF was not significant. Therefore, in the growth period of cabbage, the combination of high irrigation and low N application was more beneficial to increasing the growth indices of cabbage than the combination of low irrigation and high N application.

3.2. Effects of Different Treatments on the Biomass Distribution of Cabbage Plants

Cabbage plants were divided into below- and aboveground parts. The belowground part consisted of the roots, and the aboveground part included the stems, leaves and heads. The biomass of each part, the distribution ratio and the total biomass under different water and fertilizer coupling treatments are shown in Table 5. The one-way ANOVA results showed that the effects of different treatments on stem biomass, leaf biomass and total biomass of cabbage in both seasons and root biomass of autumn cabbage were not significant, but the effect on the root biomass of spring cabbage was significant (P < 0.05), and its MWMF value was significantly greater than that of LWHF. Different treatments had significant effects on the head biomass; specifically, the head biomass of spring cabbage in HWLF was significantly higher than that in MWMF and LWHF, and the head biomasses of autumn cabbage in HWLF and MWMF were significantly higher than that in LWHF. Gao et al. [35] found that both irrigation and fertilization had significant effects on the root, leaf and total biomass of Chinese cabbage, but the effects of the different water and fertilizer treatments on root, leaf and total biomass were not significant. Erdem et al. [18] found that irrigation and fertilization had no significant effect on the head biomass of broccoli but had a significant effect on the biomass of leaves.
Based on the distribution proportion of total biomass in each part, head and leaf biomasses of spring cabbage accounted for the largest proportion, both between 40% and 50%, followed by root biomass between 5.42% and 6.17%, whereas stem biomass accounted for the smallest proportion. The proportion of autumn cabbage head biomass ranged from 64.46% to 67.37%, followed by leaf biomass (25.35% to 28.06%), root biomass (3.98% to 4.11%) and stem biomass (3.17% to 3.49%). Due to the influence of cabbage cultivars, the distribution proportion of total biomass during the two seasons was quite different.
According to the data from the two-season trial, the total biomass and its distribution proportion in each part depended primarily on the cultivar. The total biomass of the spring cultivar was obviously higher than that of the autumn cultivar, but the proportion of head biomass was smaller than that of the autumn cultivar, and the proportion of leaf biomass was larger. This certainly increased the ET and water consumption of crops. The ET results calculated in this trial also confirmed this point. For the same cultivar, the head biomass of HWLF in spring was 284.47 kg/ha and 570.98 kg/ha higher than that of LWHF and MWMF, respectively, while that of MWMF in autumn was 399.84 kg/ha and 79.38 kg/ha higher than that of LWHF and HWLF, respectively. Moreover, the total biomass of LWHF was obviously lower than that of HWLF and MWMF. A comprehensive analysis showed that the effects of HWLF and MWMF on the biomass of some parts of cabbage plants were superior to those of LWHF.

3.3. Effects of Different Treatments on the Yield of Cabbage

According to the data in Table 6, from the perspective of yield and yield-related parameters, in the spring trial, the highest market yield of cabbage among the three treatments was observed in response to HWLF, which was 78.37 t/ha, i.e., 5.00 t/ha and 4.91 t/ha higher than that of LWHF and MWMF, respectively. The maximum head weight, minimum head weight and average head weight of HWLF were also the highest, the maximum head weight and minimum head weight of MWMF were the lowest, and the yield of LWHF was the lowest. However, the one-way ANOVA results showed that the effects of the different treatments on the maximum head weight and yield did not reach significant differences, but the minimum head weight reached a significant difference at P < 0.05, and the average head weight reached a significant difference at P < 0.01; for both of them, HWLF was significantly higher than MWMF and LWHF. In addition, based on the coefficient of variation (Cv), the discrete degree of yield per plant in HWLF was the lowest relative to its mean value, compared with MWMF, the highest. Based on the coefficient of skewness (CS), the yield per plant in HWLF was the most symmetrical on both sides of its mean value, and the asymmetrical degree of MWMF was the highest.
In the autumn trial, from the perspective of yield and yield-related parameters, the highest market yield of cabbage among the three treatments was observed in HWLF, which was 64.42 t/ha, i.e., 9.36 t/ha and 1.54 t/ha higher than that of LWHF and MWMF, respectively. The maximum head weight, minimum head weight and average head weight of HWLF were also the highest, whereas the lowest values were observed in response to LWHF. However, the one-way ANOVA results showed that the effect of different treatments on the maximum head weight did not reach a significant difference, but the minimum head weight was significantly affected (P < 0.05), and on average, the head weight and yield were significantly affected at P < 0.01; for all of them, HWLF and MWMF were significantly higher than LWHF. In addition, the discrete degree of yield per plant in HWLF was the lowest relative to its mean value, and that of LWHF was the highest. Compared with LWHF and MWMF, HWLF had the most symmetrical yield distribution on both sides of its mean value, and MWMF had the greatest degree of asymmetry.
Different water and fertilizer coupling treatments had certain effects on the maximum head weight, minimum head weight, average head weight and yield of cabbage in the two seasons. A comprehensive analysis showed that the yield of the HWLF treatment was the highest and that of the LWHF treatment was the lowest. Based on Cv and CS, the yield of the MWMF treatment was the most discrete and asymmetrical. Therefore, the analysis of the yield data showed that treatment 2 (HWLF) was better than the other two treatments. Similarly, Gao et al. [35] recommended the application of high water and low fertilizer in the agricultural production of Chinese cabbage.
The yield of cabbage in spring and autumn was the highest in HWLF, but the yield of cabbage in autumn was significantly lower than that in spring. The reason was not only related to the cultivars but also to the planting season. The temperature of the autumn trial in the heading stage was lower than that of the spring trial, but the relative humidity was higher (Figure 1). Similar results have been obtained in previous research [12,18]. The effect of the water and fertilizer coupling treatments on the yield of cabbage in spring was not significant, but it had a significant effect on the yield of cabbage in autumn. Gao et al. [35] also drew similar conclusions in a study of Chinese cabbage in Northeast China. The different water and fertilizer treatments in the first season had no significant effect on the yield, but the different water and fertilizer treatments in the second season did have a significant effect. Erdem et al. [18] found that different water and fertilizer treatments had no significant effect on broccoli yield in northwestern Turkey.

3.4. Effects of Different Treatments on Irrigation Water Productivity of Cabbage

The results of the two-season trial showed that WPY and WPB increased with decreasing irrigation. The one-way ANOVA results showed that WPY of spring cabbage and WPB of autumn cabbage reached significant differences under different treatments (P < 0.05). The effect on WPB of spring cabbage reached a significant difference (P < 0.01), while the effect on WPY of autumn cabbage did not reach a significant difference (Table 7). In the spring trial, WPY and WPB of HWLF were 13.77% and 13.56% lower than those of LWHF, respectively, and WPY and WPB of MWMF were 11.70% and 8.32% lower than those of LWHF, respectively. In the autumn trial, WPY and WPB of HWLF were 6.16% and 13.87% lower than those of LWHF, respectively, and WPY and WPB of MWMF were 0.76% and 6.54% lower than those of LWHF, respectively. Based on the harvest index (HI), there was no significant difference between the different treatments for the spring experimental results, but the autumn results reached a significant difference at P < 0.01, and the HI of LWHF was significantly lower than that of HWLF and MWMF.
The LWHF treatment resulted in the highest WPY and WPB, but its N application amount was obviously higher than the two other treatments; specifically, its N application amount was twice as high as that of HWLF. Although the WPY and WPB values of HWLF in spring were significantly lower than those of LWHF, the HI values were not significantly different among the different treatments; the WPY and WPB values of HWLF in autumn were relatively low, but the HI values were the highest. Moreover, the WPY, WPB and HI values of MWMF were not significantly different from those of HWLF in the two-season trial.
The results of this study showed that although high irrigation reduced water productivity, high yields can be achieved, and the irrigation regime developed in this study did not have the problem of excessive use and waste of irrigation water. Erdem et al. [18] reached a similar conclusion in a study of broccoli. Specifically, when the amount of irrigation was 1.25Ep (Ep is the cumulative pan evaporation measured at a 7-day interval), the yield of broccoli was the highest, but the water productivity was lower than that of the regime with a lower amount of irrigation. In addition, McKeown et al. [24] found that the yield of cabbage increased with increased irrigation during the growth period and concluded that maintaining the soil moisture content near θf was conducive to obtaining the maximum yield.

3.5. Effects of Different Treatments on Nitrogen Uptake and Utilization in Cabbage

3.5.1. Effects of Different Treatments on the Total Nitrogen Content in Each Part of the Plants

The head TN content in the spring trial was close to that of the leaves, which was higher than for the root and stem components. The leaf TN content in the autumn trial was the highest, and the head TN content was close to that of the stem (Table 8). The one-way ANOVA results for the effects of different treatments on the head TN content showed that there was a significant difference in spring cabbage (P < 0.05), i.e., MWMF resulted in a significantly higher value than LWHF, but there was no significant effect for autumn cabbage. The effects of different treatments on the TN content of spring and autumn cabbage plants reached significant differences at P < 0.05 and P < 0.01, respectively, and MWMF resulted in a significantly higher value than HWLF and LWHF in spring, while MWMF and HWLF resulted in significantly higher values than LWHF in autumn. Erdem et al. [18] and Gao et al. [35] drew similar conclusions when studying whether applied water and N had significant effects on the TN content of plants.
The results of the two-season trial showed that although LWHF had the highest N application amount, the accumulation of N in each part of the plant was significantly lower than that in HWLF and MWMF. Although HWLF had the lowest N application, the accumulation of N in each part of the plant was not significantly different from that in MWMF. The amount of irrigation per time and the total amount of irrigation during the growth period must have a strong impact on the absorption and utilization of N. Based on the TN content of plants, MWMF and HWLF were better among the three treatments.

3.5.2. Effects of Different Treatments on the NUE of Cabbage

The one-way ANOVA results showed that the effects of different treatments on TNU and NUE of spring cabbage reached significant differences, and the TNU values of MWMF and HWLF were significantly higher than that of LWHF, while the NUEs of LWHF and HWLF were significantly higher than that of MWMF. However, there was no significant difference in the TNU, NUE and HIN values of autumn cabbage. (Table 9)
According to the results of the two-season trial, the increase in the N application amount was not proportional to the plant TNU. LWHF had the highest N application amount, but the plant TNU in this treatment was not the highest; on the contrary, it was lower than in other treatments. It can be inferred that a reasonable N application amount should be 200–300 kg/ha when only considering the effect of N applications on the growth of cabbage. On the other hand, the N application amount of HWLF was 50% of that of LWHF and 66.7% of that of MWMF, but the TNU value of HWLF in spring was only 1.41% lower than that of MWMF, whereas the highest value was observed in response to HWLF in autumn. This result indicated that increasing the irrigation amount could increase the nutrient uptake of cabbage, thereby increasing the NUE. Therefore, an appropriate water and fertilizer coupling scheme could improve plant TNU and NUE. The results showed that the optimal N application amount plus the residual amount of mineralized N in the 0–60 cm soil layer before transplanting cabbage was close to the conclusion of Everaarts and De Moel [23]. In addition, there has been some related research [36,37,38,39,40] showing that the amount of N required for early to mid-season cultivars to obtain the highest yield is 150–308 kg/ha, which was also consistent with the results of the two early season cultivars in this study.

3.6. Analysis of the Correlation between ETi and Increments in the Indices during the Different Growth Stages of Cabbage

There were significant positive linear correlations between ETi and the increments in plant height, leaf area and LAI in each growth stage of cabbage in the two seasons, and the coefficients of determination (R2) were higher than 0.50, while there were weak linear relationships between the evapotranspiration of the late heading (ET4) and the increment in stem diameter and leaf number at the late heading stage in the spring trial, and there were weak linear correlations between the evapotranspiration of the seeding (ET1) and the increment in leaf spread in the seedling stage in both seasons (Table 10). Therefore, not all increments in the growth indices in the various stages had a significant linear correlation with ETi. The main reason is that under certain conditions of light, temperature and humidity, water is not the only factor affecting the growth of cabbage plants, and nutrients, as well as the interaction between water and nutrients, will also have a strong impact on the growth of cabbage plants. However, the relationship between the cumulative increment of the growth indices and ET showed significant quadratic curves (R2 ≥ 0.66). It can be seen that increasing the amount of irrigation (i.e., increasing ET) within the range of the irrigation amount designed in this trial was beneficial to the growth of cabbage.

4. Conclusions

The growth indices of HWLF and MWMF in the two seasons were larger than that of LWHF; plant height, stem diameter and leaf area in the two-season trial were significantly different in the different treatments. The yield and biomass of cabbage in spring were higher than those in autumn because of the use of different cultivars and seasons. For the same cultivar, the yields of HWLF in both seasons were the largest, and those of LWHF were the lowest. Different treatments exhibited statistically different of yield in autumn. The head biomass of HWLF in spring was significantly higher than that of the other two treatments, and that of HWLF and MWMF in autumn was significantly higher than that of LWHF. It can be seen that when the total irrigation amount of cabbage was small, the application of higher N amount does not help increase the growth, yield and biomass of cabbage. On the contrary, when the irrigation amount was high, the application of less N was beneficial to increasing the growth and yield of cabbage.
From the perspective of N uptake and utilization, high N application did not increase TNU by cabbage plants when the amount of irrigation was low, but increasing the amount of irrigation was conducive to the absorption and utilization of N by crops. Therefore, the design of an appropriate water and fertilizer coupling scheme can improve the N uptake and utilization efficiency of plants. In addition, there was a significant positive linear correlation between ETi and the increment in most of the growth indices of cabbage during the various growth stages, which shows that a high irrigation amount is better than a low irrigation amount to promote the growth of cabbage.
As a result, it is recommended that when cabbage is planted in greenhouses in the Beijing–Tianjin–Hebei, the irrigation application of drip irrigation under mulch should be approximately 114.7–125.0 mm and the N fertilization in the HWLF system should be about 200 kg/ha (see Table 3).

Author Contributions

Conceptualization, X.W. and M.B.; methodology, X.W. and M.B.; formal analysis, T.D. and S.Z.; investigation, Y.L. (Yanan Liu); resources, Y.L. (Yinong Li) and T.D.; data curation, X.W., S.Z. and Y.S.; writing-Original Draft Preparation, X.W.; writing-Review & Editing, X.W., M.B. and Y.L. (Yinong Li). All authors have read and agreed to the published version of the manuscript.

Funding

This study was financially supported by the National Key Research and Development Program (No. 2016YFC0401403) and the IWHR Innovative Team Project (No. ID0145B602017).

Acknowledgments

We thank the anonymous reviewers for their constructive comments that have helped to improve the manuscript.

Conflicts of Interest

The authors declare no conflict of interest.

References

  1. Quiñones, A.; Martínez-Alcántara, B.; Legaz, F. Influence of irrigation system and fertilization management on seasonal distribution of N in the soil profile and on N-uptake by citrus trees. Agric. Ecosyst. Environ. 2007, 122, 399–409. [Google Scholar] [CrossRef]
  2. Li, Y.; Sun, Y.; Liao, S.; Zou, G.; Zhao, T.; Chen, Y.; Yang, J.; Zhang, L. Effects of two slow-release nitrogen fertilizers and irrigation on yield, quality, and water-fertilizer productivity of greenhouse tomato. Agric. Water Manag. 2017, 186, 139–146. [Google Scholar] [CrossRef]
  3. Zhang, T.Q.; Liu, K.; Tan, C.S.; Warner, J.; Wang, Y.T. Processing tomato nitrogen utilization and soil residual nitrogen as influenced by nitrogen and phosphorus additions with drip-fertigation. Soil Sci. Soc. Am. J. 2011, 75, 738–745. [Google Scholar] [CrossRef]
  4. Kuscu, H.; Turhan, A.; Ozmen, N.; Aydinol, P.; Demir, A.O. Optimizing levels of water and nitrogen applied through drip irrigation for yield, quality, and water productivity of processing tomato (Lycopersicon esculentum Mill.). Hortic. Environ. Biotechnol. 2014, 55, 103–114. [Google Scholar] [CrossRef]
  5. Zhang, M.; Dong, B.; Qiao, Y.; Shi, C.; Yang, H.; Wang, Y.; Liu, M. Yield and water use responses of winter wheat to irrigation and nitrogen application in the North China Plain. J. Integr. Agric. 2018, 17, 1194–1206. [Google Scholar] [CrossRef] [Green Version]
  6. Darwish, T.M.; Atallah, T.W.; Hajhassan, S.; Haidar, A. Nitrogen and water use efficiency of fertigated processing potato. Agric. Water Manag. 2006, 85, 95–104. [Google Scholar] [CrossRef]
  7. Badr, M.A.; El-Tohamy, W.A.; Zaghloul, A.M. Yield and water use efficiency of potato grown under different irrigation and nitrogen levels in an arid region. Agric. Water Manag. 2012, 110, 9–15. [Google Scholar] [CrossRef]
  8. Fandika, I.R.; Kemp, P.D.; Millner, J.P.; Horne, D.; Roskruge, N. Irrigation and nitrogen effects on tuber yield and water use efficiency of heritage and modern potato cultivars. Agric. Water Manag. 2016, 170, 148–157. [Google Scholar] [CrossRef]
  9. Singandhupe, R.B.; Rao, G.G.S.N.; Patil, N.G.; Brahmanand, P.S. Fertigation studies and irrigation scheduling in drip irrigation system in tomato crop (Lycopersion esculentum L.). Eur. J. Agron. 2003, 19, 327–340. [Google Scholar] [CrossRef]
  10. Du, Y.; Cao, H.; Liu, S.; Gu, X.; Cao, Y. Response of yield, quality, water and nitrogen use efficiency of tomato to different levels of water and nitrogen under drip irrigation in Northwestern China. J. Integr. Agric. 2017, 16, 1153–1161. [Google Scholar] [CrossRef] [Green Version]
  11. Thompson, T.L.; Doerge, A.T.; Godin, R.E. Subsurface drip irrigation and fertigation of broccoli. I. Yield, quality and nitrogen uptake. Soil Sci. Soc. Am. J. 2002, 60, 163–168. [Google Scholar] [CrossRef]
  12. Gutezeit, B. Yield and nitrogen balance of broccoli at different soil moisture levels. Irrig. Sci. 2004, 23, 21–27. [Google Scholar] [CrossRef]
  13. Rajput, T.B.S.; Patel, N. Water and nitrate movement in drip-irrigated onion under fertigation and irrigation treatments. Agric. Water Manag. 2006, 7, 293–311. [Google Scholar] [CrossRef]
  14. Bhat, R.; Sujatha, S.; Balasimha, D. Impact of drip fertigation on productivity of arecanut (Areca catechu L.). Agric. Water Manag. 2007, 90, 101–111. [Google Scholar] [CrossRef]
  15. Zhang, H.; Tang, J.; Yuan, S.; Huang, S. Investigation and analysis of greenhouse vegetable fertilization in Tianjin and Hebei province. Soil Ferti. Sci. China 2018, 2, 54–60. (In Chinese) [Google Scholar]
  16. Du, L.; Zhao, T.; Zhang, C.; An, Z.; Wu, Q.; Liu, B.; Li, P.; Ma, M. Investigation on nitrate pollution in soils, ground water and vegetables of three typical farmlands in Beijing region. Sci. Agric. Sin. 2009, 42, 2837–2843. (In Chinese) [Google Scholar]
  17. Yuan, L.; Ju, X.; Zhang, L.; Wang, J.; Yang, Z. NPK accumulation in greenhouse soil and its effect on groundwater. Chin. J. Eco Agric. 2010, 18, 14–19. (In Chinese) [Google Scholar] [CrossRef]
  18. Erdem, T.; Arın, L.; Erdem, Y.; Polat, S.; Deveci, M.; Okursoy, H.; Gültaş, H.T. Yield and quality response of drip irrigated broccoli (Brassica oleracea L. var. italica) under different irrigation regimes, nitrogen applications and cultivation periods. Agric. Water Manag. 2010, 97, 681–688. [Google Scholar] [CrossRef]
  19. Guo, X.; Zhu, H.; Wang, W.; Ye, S.; Wu, J.; Wu, L. Effects of different rates of nitrogen and potash on yield and quality of cabbage. Plant Nutr. Ferti. Sci. 2004, 10, 161–166. (In Chinese) [Google Scholar]
  20. Liu, J.; Zhao, T.; An, Z.; Zhang, C.; Liu, B. Effects of the interactions of irrigation and nitrogen on cabbage yields and nitrate accumulation. ACTA Agric. Boreali Sin. 2008, 23, 208–213. (In Chinese) [Google Scholar]
  21. Zhang, P.; Jing, C.; Song, X.; Sun, Z.; Yuan, N.; Xue, L.; Wang, H.; Pu, M. Water and nitrogen utilization and nitrogen leaching of different irrigation mode in cabbage. Chin. Agric. Sci. Bull. 2014, 30, 147–150. (In Chinese) [Google Scholar]
  22. Zhou, Y.; Zhang, G.; Liu, H.; Wang, F.; Yun, X.; Yu, J. Effect of different water and fertilizer supply on wild cabbage yield, quality, water and fertilizer use efficiency. China Veget. 2015, 4, 54–59. (In Chinese) [Google Scholar]
  23. Everaarts, A.P.; De Moel, C.P. The effect of nitrogen and the method of application on yield and quality of white cabbage. Eur. J. Agron. 1998, 9, 203–211. [Google Scholar] [CrossRef]
  24. McKeown, A.W.; Westerveld, S.M.; Bakker, C.J. Nitrogen and water requirements of fertigated cabbage in Ontario. Can. J. Plant Sci. 2010, 90, 101–109. [Google Scholar] [CrossRef]
  25. Ma, S.; Yu, Z.; Shi, Y.; Zhang, Y.; Zhao, J. Effect of field border width for irrigation on dry matter accumulation and distribution, yield, and water use efficiency of wheat. Acta Ecol. Sin. 2015, 35, 169–176. [Google Scholar] [CrossRef]
  26. Tian, Z.; Liu, X.; Gu, S.; Yu, J.; Zhang, L.; Zhang, W.; Jiang, D.; Cao, W.; Dai, T. Postponed and reduced basal nitrogen application improves nitrogen use efficiency and plant growth of winter wheat. J. Integr. Agric. 2018, 17, 2648–2661. [Google Scholar] [CrossRef] [Green Version]
  27. Srivastava, R.K.; Panda, R.K.; Chakraborty, A.; Halder, D. Enhancing grain yield, biomass and nitrogen use efficiency of maize by varying sowing dates and nitrogen rate under rainfed and irrigated conditions. Field Crop. Res. 2018, 221, 339–349. [Google Scholar] [CrossRef]
  28. Wang, Y.; Zhang, X.; Chen, J.; Chen, A.; Wang, L.; Guo, X.; Niu, Y.; Liu, S.; Mi, G.; Gao, Q. Reducing basal nitrogen rate to improve maize seedling growth, water and nitrogen use efficiencies under drought stress by optimizing root morphology and distribution. Agric. Water Manag. 2019, 212, 328–337. [Google Scholar] [CrossRef]
  29. Li, G.; Gao, L.; Kang, Z.; Li, J.; Wang, M.; Ma, Y.; Zhang, J. Effects of different water treatments on dry matter accumulation and nitrogen migration and production of machine-harvested cotton. Cotton Sci. 2016, 28, 353–360. (In Chinese) [Google Scholar]
  30. Huang, H.; Li, J.; Zhang, J.; Zhang, Z.; Du, Q.; Fan, J. Effect of water and fertilizer coupling on photosynthesis production and dry matter distribution of tomato under drip irrigation. J. Irrig. Drain. 2015, 34, 6–12. (In Chinese) [Google Scholar]
  31. Badr, M.A.; Abou-Hussein, S.D.; El-Tohamy, W.A. Tomato yield, nitrogen uptake and water use efficiency as affected by planting geometry and level of nitrogen in an arid region. Agric. Water Manag. 2016, 169, 90–97. [Google Scholar] [CrossRef]
  32. Kinoshita, T.; Yamazaki, H.; Inamoto, K.; Yamazaki, H. Analysis of yield components and dry matter production in a simplified soilless tomato culture system by using controlled-release fertilizers during summer–winter greenhouse production. Sci. Hortic. 2016, 202, 17–24. [Google Scholar] [CrossRef]
  33. Gu, X.; Li, Y.; Du, Y. Effects of ridge-furrow film mulching and nitrogen fertilization on growth, seed yield and water productivity of winter oilseed rape (Brassica napus L.) in Northwestern China. Agric. Water Manag. 2018, 200, 60–70. [Google Scholar] [CrossRef]
  34. Shao, D.; Guo, L.; Wang, X.; Hong, L. Efficient Utilization of Water and Fertilizer; Science Press: Beijing, China, 2012. [Google Scholar]
  35. Gao, N.; Liu, Y.; Wu, H.; Zhang, P.; Yu, N.; Zhang, Y.; Zou, H.; Fan, Q.; Zhang, Y. Interactive effects of irrigation and nitrogen fertilizer on yield, nitrogen uptake, and recovery of two successive Chinese cabbage crops as assessed using 15N isotope. Sci. Hortic. 2017, 215, 117–125. [Google Scholar] [CrossRef]
  36. Bishop, R.F.; Chipman, E.W.; MacEachern, C.R. Effect of nitrogen, phosphorus and potassium on yields and nutrient levels in cabbage grown on sphagnum peat. Commun. Soil Sci. Plant Anal. 1975, 6, 479–488. [Google Scholar] [CrossRef]
  37. White, J.M.; Forbes, R.B. Effect of spacing and fertilizer rates on cabbage yield and head weight. Proc. Fla. State Hortic. Soc. 1976, 89, 118–120. [Google Scholar]
  38. Csizinszky, A.A.; Schuster, D.J. Impact of insecticide schedule, N and K rates, and transplant container size on cabbage yield. HortScience 1993, 28, 299–302. [Google Scholar] [CrossRef] [Green Version]
  39. Sanderson, K.R.; Ivany, J.A. Cole crop yield response to reduced nitrogen rates. Can. J. Plant Sci. 1999, 79, 149–151. [Google Scholar] [CrossRef] [Green Version]
  40. Westerveld, S.M.; McDonald, M.R.; McKeown, A.W.; Scott-Dupree, C.D. Optimum nitrogen fertilization of summer cabbage in Ontario. Acta Hortic. 2003, 627, 211–215. [Google Scholar] [CrossRef]
Figure 1. Daily average temperature and humidity in the spring trial (a); daily average temperature and humidity in the autumn trial (b).
Water 12 01076 g001
Figure 2. Water and N applied in the spring cabbage growth period, with March 23 as the first day (a); water and N applied in the autumn cabbage growth period, with August 18 as the first day (b).
Water 12 01076 g002
Figure 3. Comparison of plant height, stem diameter, leaf number, leaf area, leaf spread and LAI increments of spring cabbage in different stages in response to various treatments (a); comparison of plant height, stem diameter, leaf number, leaf area, leaf spread and LAI increments of autumn cabbage in different stages in response to various treatments (b).
Water 12 01076 g003
Table 1. Research results of irrigation and fertilization amounts for Brassica.
Serial NumberSpeciesIrrigation Amount (mm)N Fertilizer Amount (kg N/ha)TimeResearch SiteAuthors
1Broccoli150–2002010TurkeyErdem et al. [18]
2Cabbage350–4502004HefeiGuo et al. [19]
3Cabbage3003002008BeijingLiu et al. [20]
4Cabbage2253002014LanzhouZhang et al. [21]
5Cabbage204.83042015LanzhouZhou et al. [22]
6White cabbage330 (included both applied N and compensation for residual mineral N in the 0–60 cm layer)1998NetherlandsEveraarts and De Moel [23]
7Late cabbageIrrigation maintained near the field capacity (θf) over the growing seasonOver 4002010OntarioMcKeown et al. [24]
Table 2. Main soil parameters of the No. 1 and No. 2 greenhouses.
GreenhousesSoil Depth
(cm)
Clay (%)Silt (%)Sand (%)Field Capacity
(cm3/cm3)
Wilting Point
(cm3/cm3)
Bulk Density
(g/cm3)
Initial Humidity
(mm)
pH
1#0–207.59777.83314.5710.3320.1511.4955.48.04
20–4013.02469.14517.8300.3650.1651.5265.98.22
40–6014.12774.31411.5590.3770.1671.5871.78.30
60–8015.17277.5657.2620.3750.1671.6172.28.38
80–10015.46770.15614.3770.3700.1651.6072.18.28
2#0–2010.60066.94422.4560.3300.1511.4652.87.78
20–4016.80578.0415.1540.3670.1651.5558.47.77
40–6015.96666.38417.6500.3750.1671.6063.88.15
60–803.25388.2198.5280.3800.1681.5965.18.40
80–10012.81269.28517.9030.3680.1651.6066.58.66
Table 3. Irrigation and nitrogen (N) application amounts for cabbage under different water and fertilizer coupling treatments.
Treatments IrrigationFertilizing N amount (kg N/ha)
Lower
Limit
Upper
Limit
Single Amount (Spring) (mm)Single Amount (Autumn) (mm)Total (mm)Base
Fertilizer
RosetteEarly
Heading
Late
Heading
Total
LWHF75% θf a90% θf8.9 (14.1) b14.1 c90.6 (86.6) d160 16080400
HWLF85% θf100% θf8.9 (14.1)14.1125.0 (114.7)806060 200
MWMF75% θf100% θf14.9 (23.5)23.5106.8 (98.3)120 12060300
aθf is the field capacity. b The size of the single application amount before the early heading (after the early heading) stage of cabbage in spring. c The size of the single application amount during the cabbage growing period in autumn. d Total irrigation amount of cabbage in spring (autumn).
Table 4. One-way ANOVA results for the effects of different water and fertilizer coupling treatments on the stage increments and cumulative increment of plant height, stem diameter, leaf number, leaf area, leaf spread and leaf area index (LAI).
SeasonsGrowth IndicesSeedlingRosetteEarly HeadingLate HeadingAccumulated Increment
SpringPlant heightNS aNSNSNS*
Stem diameterNSNSNS**
Leaf numberNSNSNSNS**
Leaf areaNSNSNSNS**
Leaf spreadNSNSNSNSNS
LAINSNSNSNS*
AutumnPlant heightNS*NS****
Stem diameterNSNSNS***
Leaf numberNSNSNSNSNS
Leaf areaNSNSNSNS**
Leaf spreadNSNSNSNS**
LAINSNSNSNSNS
a Not significant. * Significant at P < 0.05. ** Significant at P < 0.01.
Table 5. Biomass and distribution ratio of each part of cabbage plants under different water and fertilizer coupling treatments.
SeasonsTreatmentsUnderground PartAboveground PartsTotal Biomass
(kg/ha)
Root Biomass
(kg/ha)
Ratio a
(%)
Stem Biomass
(kg/ha)
Ratio a
(%)
Leaf Biomass
(kg/ha)
Ratio a
(%)
Head Biomass
(kg/ha)
Ratio a
(%)
SpringLWHF522.382b b5.42467.595ab4.854322.107a44.844327.257b44.899639.341a
HWLF577.270ab5.59567.390a5.504562.975a44.224611.722a44.6910,319.356a
MWMF617.636a6.17446.866b4.464905.675a49.004040.742c40.3610,010.920a
One-way ANOVA*-NSc-NS-**-NS
AutumnLWHF200.225a3.98175.261a3.491410.242a28.063239.282b64.465025.011a
HWLF218.014a4.04184.588a3.421438.512a26.633559.746a65.915400.860a
MWMF221.948a4.11171.440a3.171369.224a25.353639.122a67.375401.733a
One-way ANOVANS-NS-NS-*-NS
a Ratio was the ratio of the average value of root, stem, leaf and head biomass to the average value of the total biomass, respectively. b Different letters in the same column show significant differences between different water and fertilizer coupling treatments (P < 0.05). c Not significant. * Significant at P < 0.05. ** Significant at P < 0.01.
Table 6. Ratios of maximum, minimum and average head weight, Cv, CS and yield of cabbage under different water and fertilizer coupling treatments.
SeasonsTreatmentsMaximum Head Weight (kg)Minimum Head Weight (kg)Average Head Weight (kg)CvCSYield (kg/ha)
SpringLWHF1.99a a0.71b1.43b0.18−0.4273,368.25a
HWLF2.05a0.94a1.53a0.14−0.2278,371.43a
MWMF1.92a0.69b1.43b0.20−0.7273,460.32a
One-way ANOVANS b***--NS
AutumnLWHF1.51b0.30b1.07b0.26−0.4955,061.91b
HWLF1.78a0.52a1.24a0.22−0.1864,423.81a
MWMF1.66ab0.51a1.23a0.25−0.7062,885.71a
One-way ANOVANS***--**
a Different letters in the same column show significant differences between different water and fertilizer coupling treatments (P < 0.05). b Not significant. * Significant at P < 0.05. ** Significant at P < 0.01.
Table 7. Water productivity of yield (WPY), water productivity of biomass (WPB) and harvest index (HI) of the different water and fertilizer coupling treatments.
SeasonsTreatmentsWPY
(kg/m3)
YD a
(%)
WPB
(kg/m3)
BD b
(%)
HI
SpringLWHF51.55a c06.77a07.62a
HWLF44.45b−13.775.85b−13.567.60a
MWMF45.51b−11.706.21b−8.327.34a
One-way ANOVA*-**-NS d
AutumnLWHF41.85a03.82a010.97b
HWLF39.27a−6.163.29b−13.8711.95a
MWMF41.53a−0.763.57ab−6.5411.65a
One-way ANOVANS-*-**
a YD indicates the relative loss based on the water productivity of yield of treatments relative to treatment 1. b BD indicates the relative loss based on the water productivity of biomass of treatments relative to treatment 1. c Different letters in the same column show significant differences between different water and fertilizer coupling treatments (P < 0.05). d Not significant. * Significant at P < 0.05. ** Significant at P < 0.01.
Table 8. TN content and distribution ratio of cabbage plants under different water and fertilizer coupling treatments.
SeasonsTreatmentsRootStemLeavesHeadPlant
TN Content
(mg/g)
NDa
(%)
TN Content
(mg/g)
ND
(%)
TN Content
(mg/g)
ND
(%)
TN Content
(mg/g)
ND
(%)
TN Content
(mg/g)
ND
(%)
SpringLWHF26.02 ± 0.56ab025.27 ± 0.65b037.01 ± 1.18b036.77 ± 1.64b0125.07 ± 3.78b0
HWLF26.96 ± 0.46a3.6123.95 ± 0.12c−5.2238.47 ± 0.75ab3.9239.51 ± 0.50ab7.46128.88 ± 0.75b3.05
MWMF27.17 ± 2.37a4.4428.13 ± 0.58a11.3339.35 ± 0.64a6.3242.11 ± 1.03a14.52136.77 ± 3.09a9.35
One-way ANOVANSc-**-NS-*-*-
AutumnLWHF20.08 ± 0.35a025.09 ± 1.37b038.55 ± 0.75b025.55 ± 0.58a0109.27 ± 1.83b0
HWLF21.75 ± 1.05a8.3126.48 ± 0.80ab5.5441.43 ± 1.06a7.4726.76 ± 0.61a4.74116.42 ± 1.65a6.54
MWMF20.28 ± 0.26a1.0128.19 ± 0.66a12.3740.69 ± 0.31a5.5426.79 ± 0.89a4.88115.96 ± 0.62a6.12
One-way ANOVANS-NS-*-NS-**-
a ND indicates the relative increase in the TN content in treatments relative to treatment 1. b Different letters in the same column show significant differences between different water and fertilizer coupling treatments (P < 0.05). c Not significant. * Significant at P < 0.05. ** Significant at P < 0.01.
Table 9. TNU, NUE and HIN of cabbage plants under different water and fertilizer coupling treatments.
SeasonsTreatmentsTNU
(kg/ha)
NUE
(kg/kg)
HIN
SpringLWHF344.27ba213.29a0.46a
HWLF386.75a202.64a0.47a
MWMF392.27a187.25b0.43b
One-way ANOVA**NSb
AutumnLWHF145.72a378.99a0.57a
HWLF164.44a391.83a0.58a
MWMF162.64a387.38a0.60a
One-way ANOVANSNSNS
a Different letters in the same column show significant differences between different water and fertilizer coupling treatments (P < 0.05). b Not significant. * Significant at P < 0.05.
Table 10. Regression analysis of ETi and the increments in plant height, stem diameter, leaf number, leaf area, leaf spread and LAI for cabbage during various stages.
SeasonsGrowth StagesPlant height (H)Stem Diameter (S)Leaf Number (L)Leaf Area (A)Leaf Spread (K)LAI
Regression EquationR2Regression EquationR2Regression EquationR2Regression EquationR2Regression EquationR2Regression EquationR2
SpringSeedlingH = 0.218ET1 + 1.5590.84S = 0.014ET1 + 0.0650.77L = 0.606ET1 + 0.9550.79A = 10.902ET1 + 14.7550.93K = 0.240ET1 + 11.7810.02LAI = 0.043ET1 − 0.0920.91
RosetteH = 0.142ET2 + 1.9280.51S = 0.001ET2 + 0.4840.78L = 0.01ET2 + 1.2580.59A = 4.023ET2 + 287.330.86K = 0.120ET2 + 16.9960.61LAI = 0.014ET2 + 2.6100.98
Early headingH = 0.004ET3 + 8.2340.98S = 0.007ET3 + 0.1480.99L = 0.088ET3 − 4.601.00A = 7.210ET3 + 132.740.69K = 0.050ET3 + 7.4140.62LAI = 0.055ET3 + 0.4000.93
Late headingH = 0.055ET4 − 1.5810.67S = 0.004ET4 + 0.1520.24L = − 0.001ET4 − 2.0390.001A = 3.084ET4 + 131.970.88K = 0.020ET4 + 2.8120.79LAI = 0.009ET4 + 0.7520.81
Whole growth
period
H = − 0.0006ET2 + 0.238ET + 1.2600.98S = − 0.00001ET2 + 0.011ET + 0.0740.99L = − 0.0003ET2 + 0.046ET + 4.1270.66A = − 0.014ET2 + 10.676ET + 3.080.99K = − 0.001ET2 + 0.495ET + 10.581.00LAI = − 0.0001ET2 + 0.073ET − 0.3520.99
AutumnSeedlingH = 0.145ET1 + 1.0730.76S = 0.014ET1 + 0.0150.64L = 0.073ET1 + 2.8410.61A = 9.284ET1 − 68.1530.80K = 0.227ET1 + 0.2890.37LAI = 0.022ET1 − 0.0910.80
RosetteH = 0.07ET2 + 6.6690.52S = 0.008ET2 + 0.3460.66L = 0.01ET2 + 6.5530.73A = 5.092ET2 + 276.670.60K = 0.156ET2 + 9.9490.79LAI = 0.029ET2 + 0.5750.86
Early headingH = 0.051ET3 + 3.3570.92S = 0.003ET3 + 0.0470.78L = 0.014ET3 − 0.2090.96A = 5.501ET3 − 129.710.68K = 0.092ET3 + 1.5050.85LAI = 0.020ET3 − 0.3270.95
Late headingH = 0.066ET4 − 1.6430.67S = 0.007ET4 − 0.3010.84L = 0.065ET4 − 4.7310.96A = 2.222ET4 − 51.8420.94K = 0.054ET4 + 2.9350.94LAI = 0.013ET4 − 0.2680.89
Whole growth
period
H = − 0.001ET2 + 0.304ET − 0.9240.99S = − 0.0001ET2 + 0.018ET + 0.020.93L = − 0.001ET2 + 0.193ET + 1.7910.85A = − 0.05ET2 + 12.682ET − 73.20.93K = − 0.001ET2 + 0.430ET − 1.6330.97LAI = − 0.0002ET2 + 0.044ET − 0.2910.95

