Article

Attribution Analysis of Hydrological Drought Risk Under Climate Change and Human Activities: A Case Study on Kuye River Basin in China

School of Civil Engineering, Anhui Polytechnic University, Wuhu 241000, China
*
Author to whom correspondence should be addressed.
Water 2019, 11(10), 1958; https://doi.org/10.3390/w11101958
Submission received: 8 August 2019 / Revised: 17 September 2019 / Accepted: 18 September 2019 / Published: 20 September 2019

Abstract

:
This study conducted quantitative diagnosis on the impact of climate change and human activities on drought risk. Taking the Kuye river basin (KRB) in China as the research area, we used variation point diagnosis, simulation of precipitation and runoff, drought risk assessment, and attribution quantification. The results show that: (1) the annual runoff sequence of KRB changed significantly after 1979, which was consistent with the introduction of large-scale coal mining; (2) under the same drought recurrence period, the drought duration and severity in the human activity stage were significantly worse than in the natural and simulation stages, indicating that human activities changed the drought risk in this area; and (3) human activities had little impact on drought severity in the short duration and low recurrence period, but had a greater impact in the long duration and high recurrence period. These results provide scientific guidance for the management, prevention, and resistance of drought; and guarantee sustainable economic and social development in the KRB.

1. Introduction

Drought, an abnormal water shortage caused by imbalance in the water cycle, is an extreme event in the water cycle. Many definitions of drought exist, including meteorological drought, agricultural drought, socio-economic drought, and hydrologic drought [1,2]. The latter is defined as a deficit in surface water or groundwater, including a reduction in water supply for drinking water, irrigation, industrial needs, and hydropower production, causing the death of fish and hampering navigation [1].
The change in the hydrological drought risk of watersheds is the result of environmental change, mainly modification in global natural conditions, such as climate change and human activities, which can have strong local impacts and contribute to global effects. Influenced by climate change marked by global warming, and driven by high-impact human activities, global change has become obvious over the past 100 years. The water cycle process has changed to different degrees, reflected in the increasing risk of natural disasters represented by flood and drought disasters [3,4,5]. The occurrence of drought events is worsening, with higher frequency, greater severity, and wider scope [6]. Serious and extreme drought events are increasing, as is the destruction caused by drought disasters [7], posing a serious threat to human living environments, food security, social stability, and sustainable economic development. With climate warming, population growth, and economic development, the frequency of drought in Northwest China is among the highest in the country. Large-scale severe drought has been frequently recorded, resulting in increasingly serious losses and impacts on the environment. Therefore, drought is known to seriously threaten sustainable economic and social development [8].
On analyzing several research works, we found that drought is affected by climatic factors (natural climate and anthropogenic climate), environmental resource factors, topographic and geomorphic factors, water resource conditions, social and economic factors, population growth factors, coal mining, water conservancy facilities, and other land use factors [7,9,10,11,12,13]. Strzepek et al. [14] and Kirono et al. [15] used global climate models to study the factors affecting drought in Australia and most parts of the United States, respectively. The results show that the emission of aerosols will increase the area affected by drought and escalate the frequency of drought. Wang et al., based on 35 climate models and two emissions scenarios (RCP4.5 and RCP8.5), applied the coupled model inter-comparison project phase 5 (CMIP5) model to forecast China’s future drought situation; the results showed that China’s drought situation may worsen with temperature increases [16]. Based on the measured meteorological data of 101 meteorological stations in the Yellow River basin and the precipitation and temperature data of six models from 1961 to 2099 under the three emission scenarios of CMIP5, Yang et al. (2018) assessed the drought in the Yellow River basin, and the results show that the drought conditions in the early 21st century under the three emission scenarios were all severe, relative to the baseline period [17]. According to Williams et al.’s analysis of drought in California, the main driving factor is precipitation. Although natural variation is dominant, the climate warming caused by human activities intensifies the probability of drought occurrence in California, and with a continuous increase in temperature, water will evaporate from plants and soil into the air, leading to the aggravation of drought severity in the state [18].
Therefore, calculating the proportion of the contribution of climate change and human activities to the risk of drought is important to guide the work of local governments in preventing and combating drought. However, little research has been conducted on the issue. For example, Jiang et al. used empirical parameter statistical analysis to separate and quantitatively evaluate the factors impacting flood disaster area in Xinjiang for more than 50 years; the results show that flood disasters in Xinjiang were mainly affected by human activities and precipitation anomalies [19]. This research idea can be applied to the quantitative attribution of drought risk change. Al-faraj et al. showed that the construction of reservoirs in upstream regions in the Diyala River basin in central Asia significantly changed the hydrological situation in the downstream region, aggravating the hydrological drought [20]. Zhang et al. studied the drought risk in the Huaihe River basin, showing that the construction and operation of reservoirs can reduce the occurrence frequency of hydrological drought in the downstream region and extend the duration of drought [21]. Luan et al. drew a drought scale map and found that since the 1960s, drought events in the Fen and Wei plains have been increasing, but the occurrence frequency of extreme drought and excessive drought has been significantly reduced, which is related to the introduction of several water conservancy projects during this period, which reduced the harm level of drought events to some extent [22]. Based on the monthly runoff data of Boluo station in the Dongjiang River basin, Tu et al. constructed multivariate joint distribution of hydrological and drought indicators using the meta-Gaussian Copula function, and quantitatively assessed the impact of reservoir runoff regulation on hydrological and drought multivariate joint characteristics. The results showed that the regulation of reservoir runoff alleviated the hydrological drought in the Dongjiang River basin, but the multi-variable joint transcendence period of the same group of drought indicators significantly increased under the influence of the reservoir [23].
However, most studies on the impact of climate change and human activities on drought risk are qualitative or semi-quantitative, and very few have focused on drought risk change. With the increasingly severe impacts of climate change and human activities on hydrology and water resources in river basins, non-quantitative research does not help in understanding the internal mechanism of hydrology [24]. Determining how to quantitatively distinguish the impacts of climate change and human activities on the hydrological cycle and the water resource formation process within a region has become a focus of academic research [25,26]. The lack of hydrological, soil, and vegetation data in the region cannot meet the requirements of climate and hydrological models. Rainfall and runoff data, which are easy to obtain, directly reflect change in water resources. Therefore, we propose a variation attribution analysis method based on the relationship between precipitation and runoff. On the basis of identifying and dividing the reference period, this method starts from the runoff, showing the change in hydrological and drought risk and the precipitation reflecting climate change, and simulates a runoff series in the variation period only subject to climate change. Then, the monthly runoff of the three stages (natural stage, human activity stage, and simulation stage) is obtained, and the recurrence period, duration, and severity of drought are calculated according to the runoff of the three stages, such that the contribution rate of various factors affecting the variation of drought risk can be quantitatively calculated. A case study of the Kuye river basin (KRB) in China was conducted to verify the effectiveness of the method.
The contributions of this method include: (1) coupling the precipitation and runoff simulation and hydrological sequence variation points of diagnosis and methods, such as hydrologic drought risk assessment; (2) revealing the factors driving drought risk in terms of climate change and human activities on drought duration, drought severity, and return period of drought to guide disaster prevention and mitigation practice; and (3) introducing an idea to study the variation in drought risk, which can be used for attribution diagnosis of meteorological drought, agricultural drought, and social and economic drought.
The following sections are arranged as follows. Section 2 introduces the framework of our method in detail, including the ordered clustering method (OCM) for the diagnosis of variation points, the artificial neural network (ANN) method to simulate the relationship between precipitation and runoff, the Copula method for drought risk assessment, and the attribution diagnosis method for hydrological factors. Section 3 introduces the hydrology and geography of the KRB. Section 4 applies the above method framework and takes the KRB as an example to obtain variation point diagnosis results, ANN simulation results, three-stage Copula drought risk assessment results, results of climate change, and the human activity contribution ratio. Section 5 summarizes our conclusions.

2. Methodology

2.1. Ordered Clustering Method (OCM)

As global climate change and human activities increase, the statistical scale of hydrological elements have changed, and the hydrological series, including precipitation and runoff, which are closely related to human production and life, have lost their original consistency. Scholars have conducted extensive and effective work in the diagnosis of water resource variation [26,27]. Xie et al. proposed an approach to evaluate the significance of abrupt changes in time series at five levels: no, weak, moderate, strong, and dramatic change; and stated that human activities contributed much more than climate change to the abrupt changes in the corresponding surface water resources amount [26]. Song et al. studied the changes in the frequency of precipitation extremes and their contributions to total precipitation at different extreme percentile thresholds. They found that extreme precipitation events with high-percentile thresholds have more spatial and temporal variability than those with low-percentile thresholds [27]. The affected series and the original series (natural series) of data can be regarded as two different classes. Therefore, OCM can be used to deduce mutation points between the natural series and the affected series.
OCM is essentially used to deduce the optimal segmentation point to minimize the sum of squares of deviations among similar classes, when the sum of squares of deviations between classes is relatively large [28,29]. If the hydrological series has two distinct stages, the time series changes of the sum of squares of the total deviations show a single valley bottom, and the year corresponding to the valley bottom is the optimal series mutation year. The optimal segmentation method is as follows:
V τ = i = 1 τ ( x i x τ ¯ ) 2
V n τ = i = τ + 1 n ( x i x n τ ¯ ) 2
where n is the length of the series, and τ is the possible variation position; x τ ¯ and x n τ ¯ are the mean values of hydrological series before and after the variation points, respectively; V τ and V n τ are the sum of deviation squares of each stage.
The total sum of squares of deviations can be calculated as:
S n ( τ ) = V τ + V n τ
when the S n ( τ ) is a minimum value and the corresponding point τ is the optimal point of division.

2.2. ANN Method to Simulate the Relationship Between Precipitation and Runoff

Artificial neural network (ANN) has attracted attention due to its advantages in solving highly nonlinear problems [30]. The back-propagation (BP) algorithm, which was used to train the ANN models, is the most popular training algorithm for Multilayer Perception (MLP)—ANN models, which are the most applied ANN types in the field of hydrology [31]. Experts have extensively applied the BP ANN to the study of precipitation and runoff simulation over the years, perfecting its theory and technology [32,33,34,35].
When we used the BP network to simulate the relationship between precipitation and runoff in KRB, we mainly used the precipitation of the first six months to simulate the monthly runoff, so the 6-10-1 network structure was adopted for simulation. When choosing the month of precipitation data, we considered that the model should reflect the change in soil water storage in the basin, and the number of months should not be too small; to make the model more concise, the input data should not be excessive, so we chose precipitation prediction runoff of the first six months. The calculation process was mainly simulated using the Visual C++ 2010 (Microsoft Corporation, Redmond, DC, USA) programming platform.
The Nash–Sutcliffe efficiency (NSE) coefficient, commonly used in the field of hydrological simulation, was adopted as the evaluation tool for the simulation effect [36]:
N S E = 1 i = 1 N ( Q o i Q s i ) 2 i = 1 N ( Q o i Q o ¯ ) 2
where Q o i is the observed runoff, Q s i is the simulated runoff, and Q o ¯ is the total average of the observed runoff. NSE has a range of −∞ to 1. An NSE value close to 1 indicates that the model is of good quality and high reliability. An NSE close to or less than 0 indicates that the output value of the model is too large from the observed value, and the cause of the problem needs to be found.

2.3. Drought Risk Assessment Method

The model includes the following four steps.

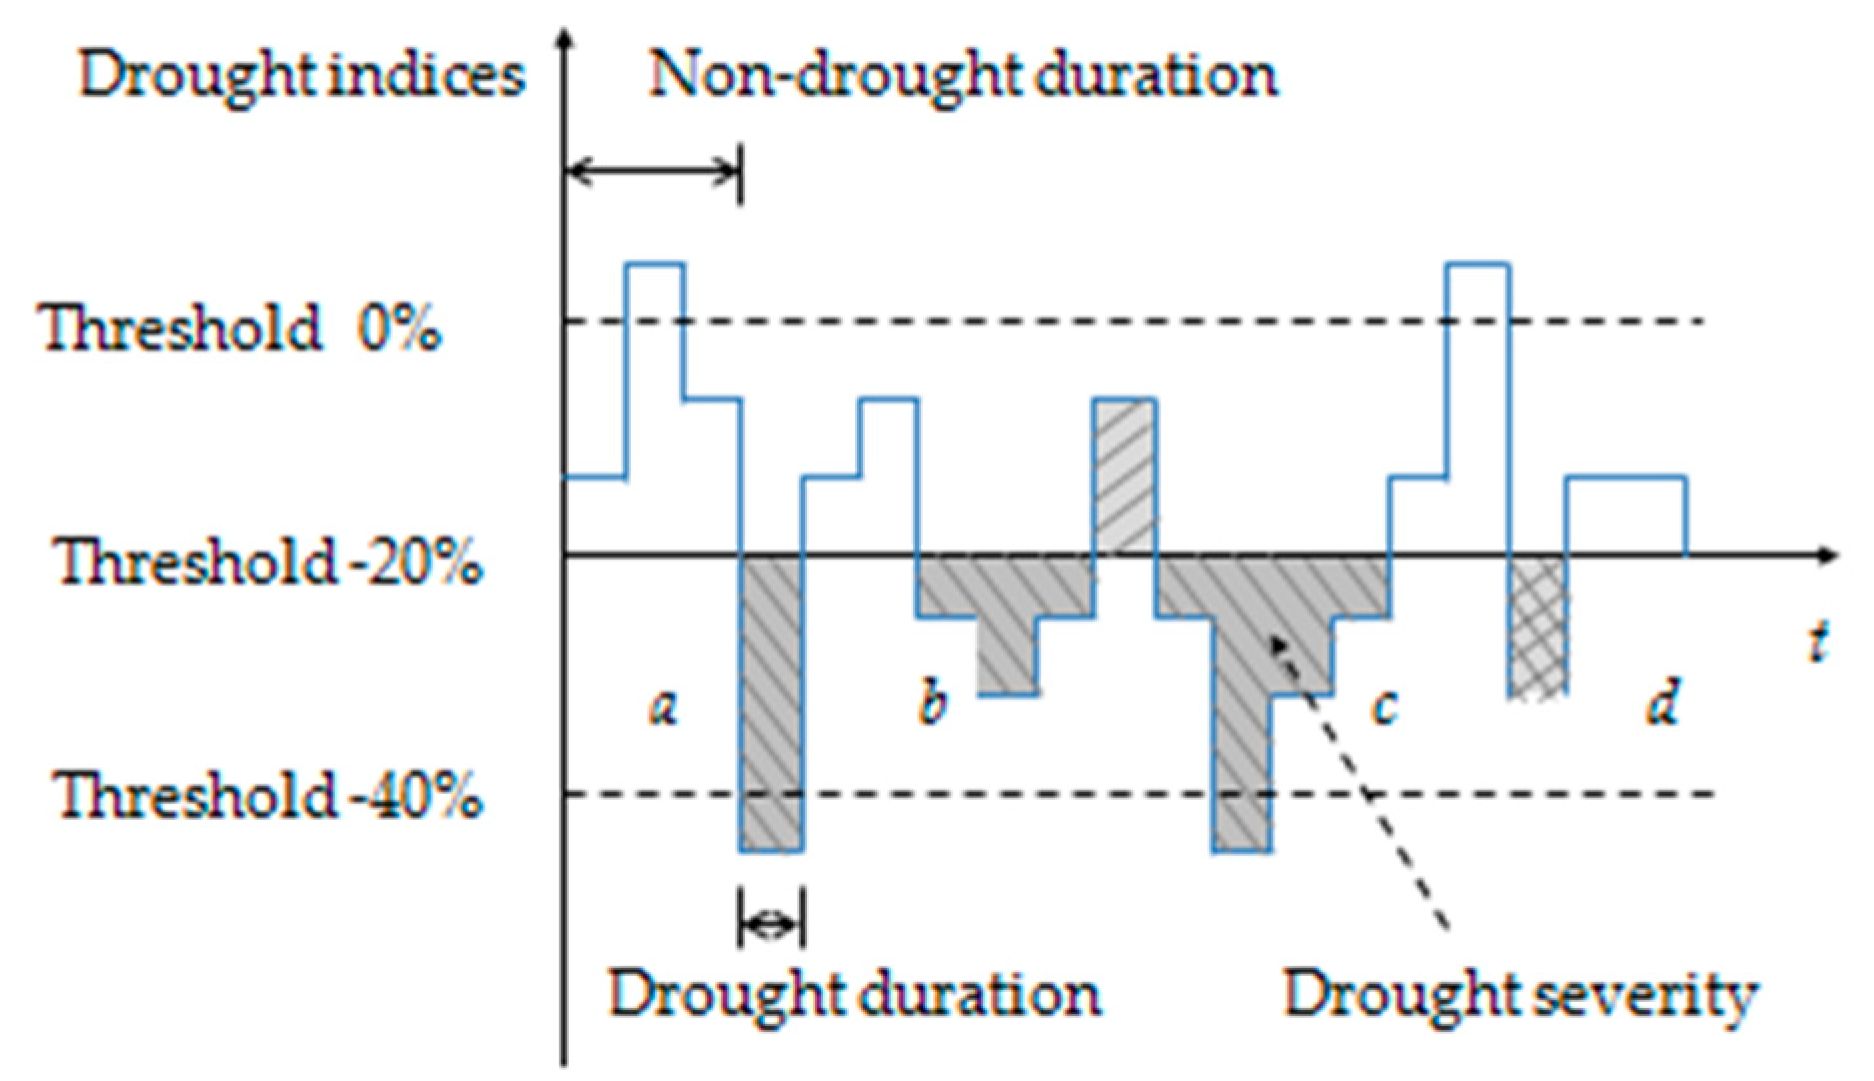
2.3.1. Step 1: Identification of Drought Processes

The run-length theory [1,37] is generally adopted to set the threshold value of the hydrological series. In this paper, this hydrological series is the monthly runoff depth, which represents the river flow discharge. The runoff falling below a certain threshold is recognized as a drought event. The threshold value can usually be determined by the percentage of the historical mean of runoff in a certain period, such as −20% and −40% [37]. According to the run-length theory and the set threshold, the drought duration and corresponding drought severity can be identified. A schematic diagram identifying the drought process is shown in Figure 1, where a, b, c and d represent 4 drought events. We then obtained the drought duration (D) and drought severity (S) of each drought event.

2.3.2. Step 2: Determination of Marginal Distribution of Drought Characteristics

The marginal distribution of drought duration and severity are the basis for determining the joint distribution of drought risk. Generally, γ distribution and its deformation forms, such as exponential distribution and Pearson type Ⅲ distribution, can be adopted [27,37,38]. Considering the generality of the marginal distribution calculation method, we uniformly adopted γ distribution to determine the marginal distribution of drought characteristics. Then, we obtained the probability density function of drought duration u(d) and drought severity v(s) and the distributed function FD(d) and FS(s).

2.3.3. Step 3: Determination of Joint Distribution of Drought Risk

Copula function is widely used to measure the joint distribution of drought risk. Various forms of the Copula function exist, among which Gumbel–Hougaard (GH) Copula in Archimedean Copula is the most commonly used, including in the field of hydrology [37,38]. The function form of GH Copula is as follows:
F D , S ( d , s ) = C ( u , v ) = exp { [ ( ln u ) θ + ( ln v ) θ ] 1 θ }
where the parameter θ can be obtained through the Kendall correlation coefficient between drought duration and drought severity. Therefore, we also used the GH function to determine the joint distribution of drought duration and drought severity.

2.3.4. Step 4: Recurrence Period of the Joint Distribution of Hydrological Drought Risk

According to joint distribution of the above Copula functions in Equation (3), when drought duration D > d and drought severity S > s, the drought recurrence period T ( d , s ) is [39]:
T ( d , s ) = E ( L ) P ( D > d S > s ) = E ( L ) 1 F D ( d ) F S ( s ) + F D , S ( d , s )
where E(L) is the expectation of the interval between two drought events, equal to the sum of the average of drought duration and non-drought duration.

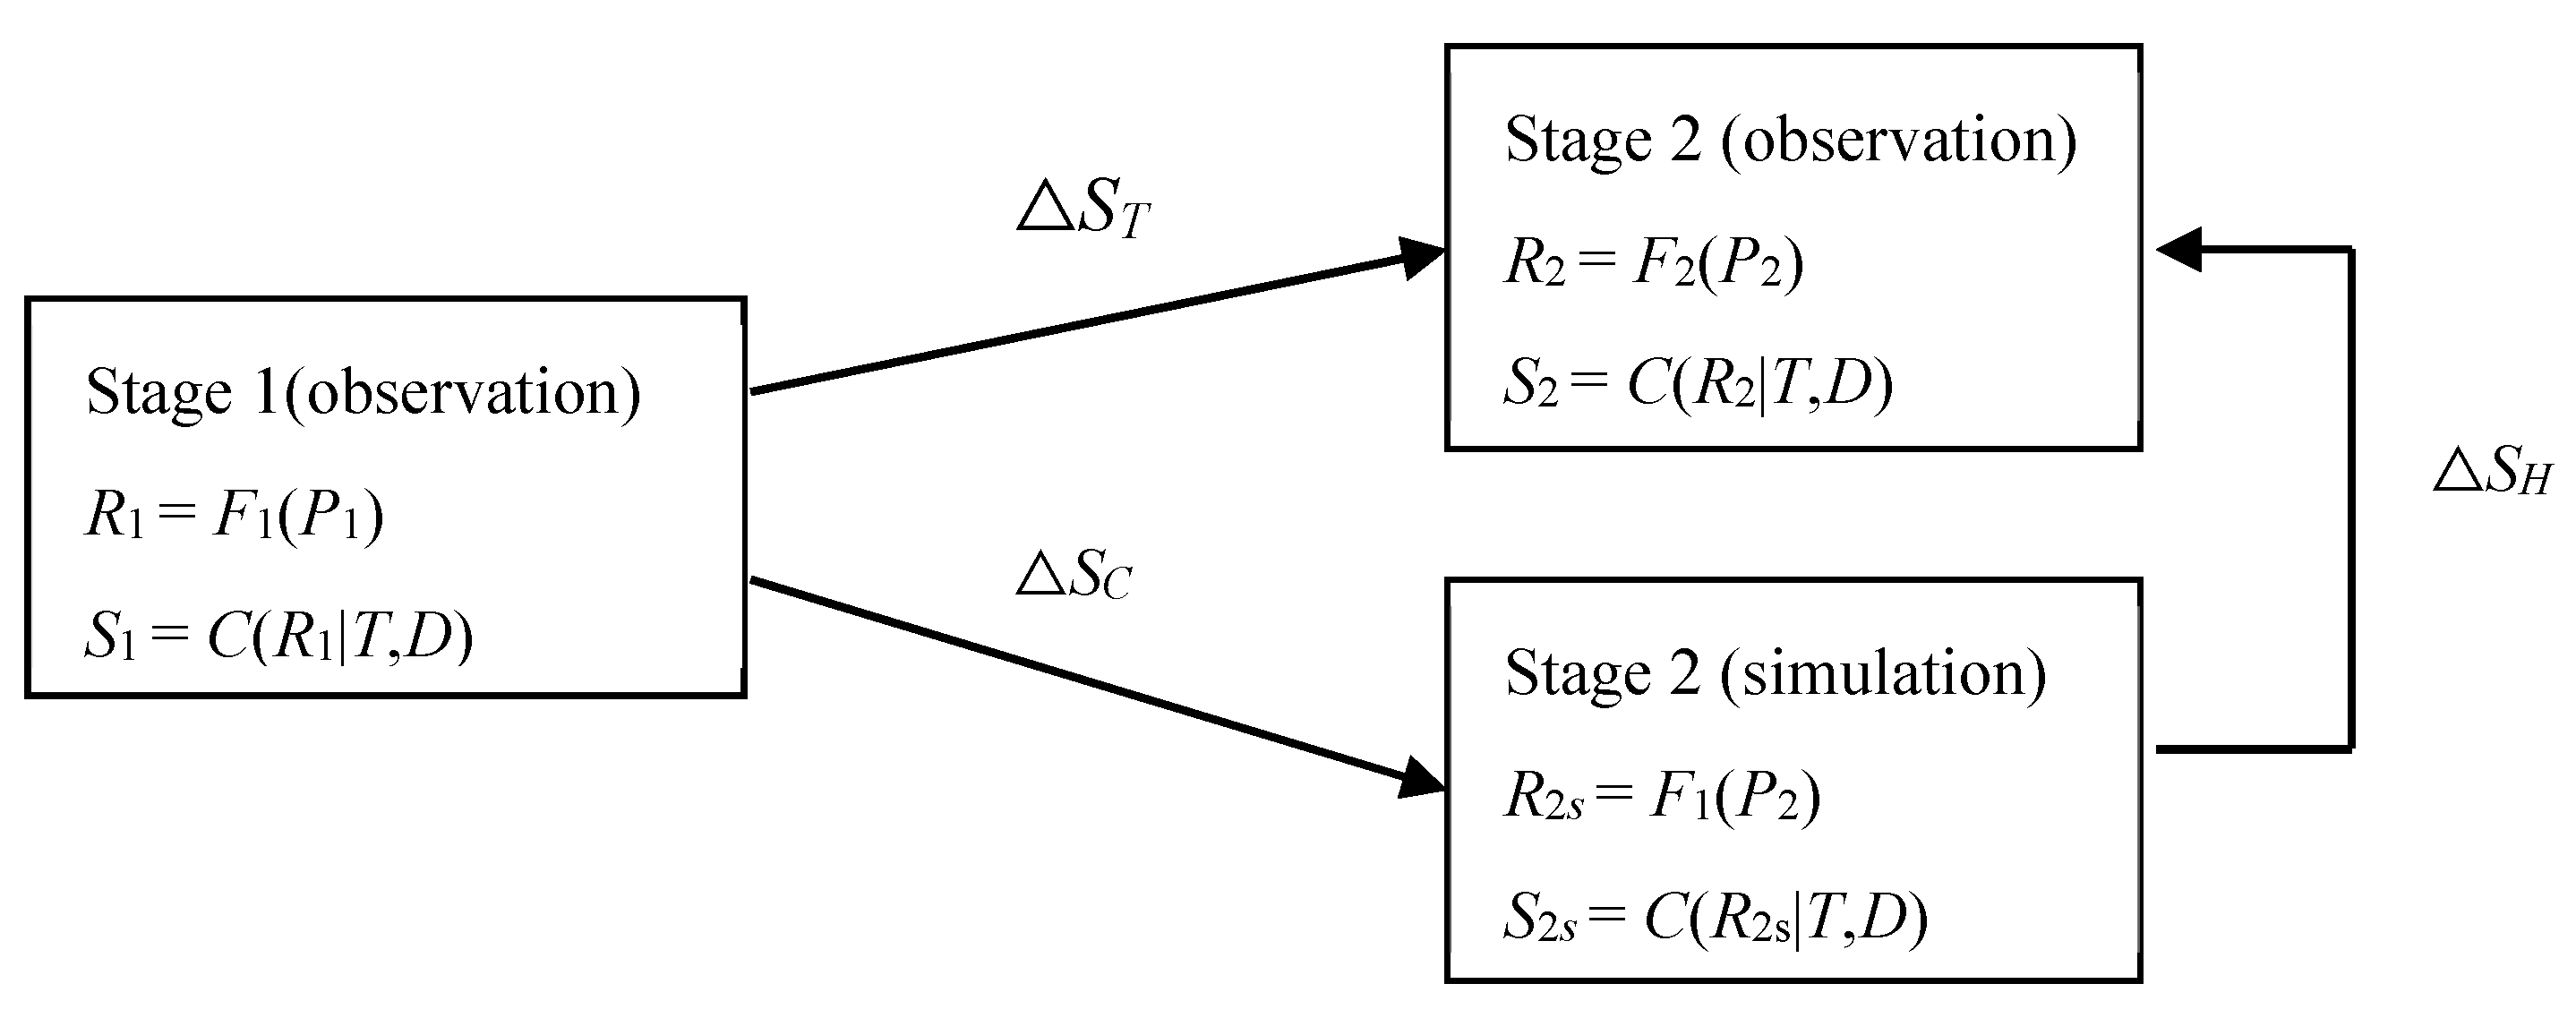
2.4. Quantitative Identification of Drought Risk Attribution
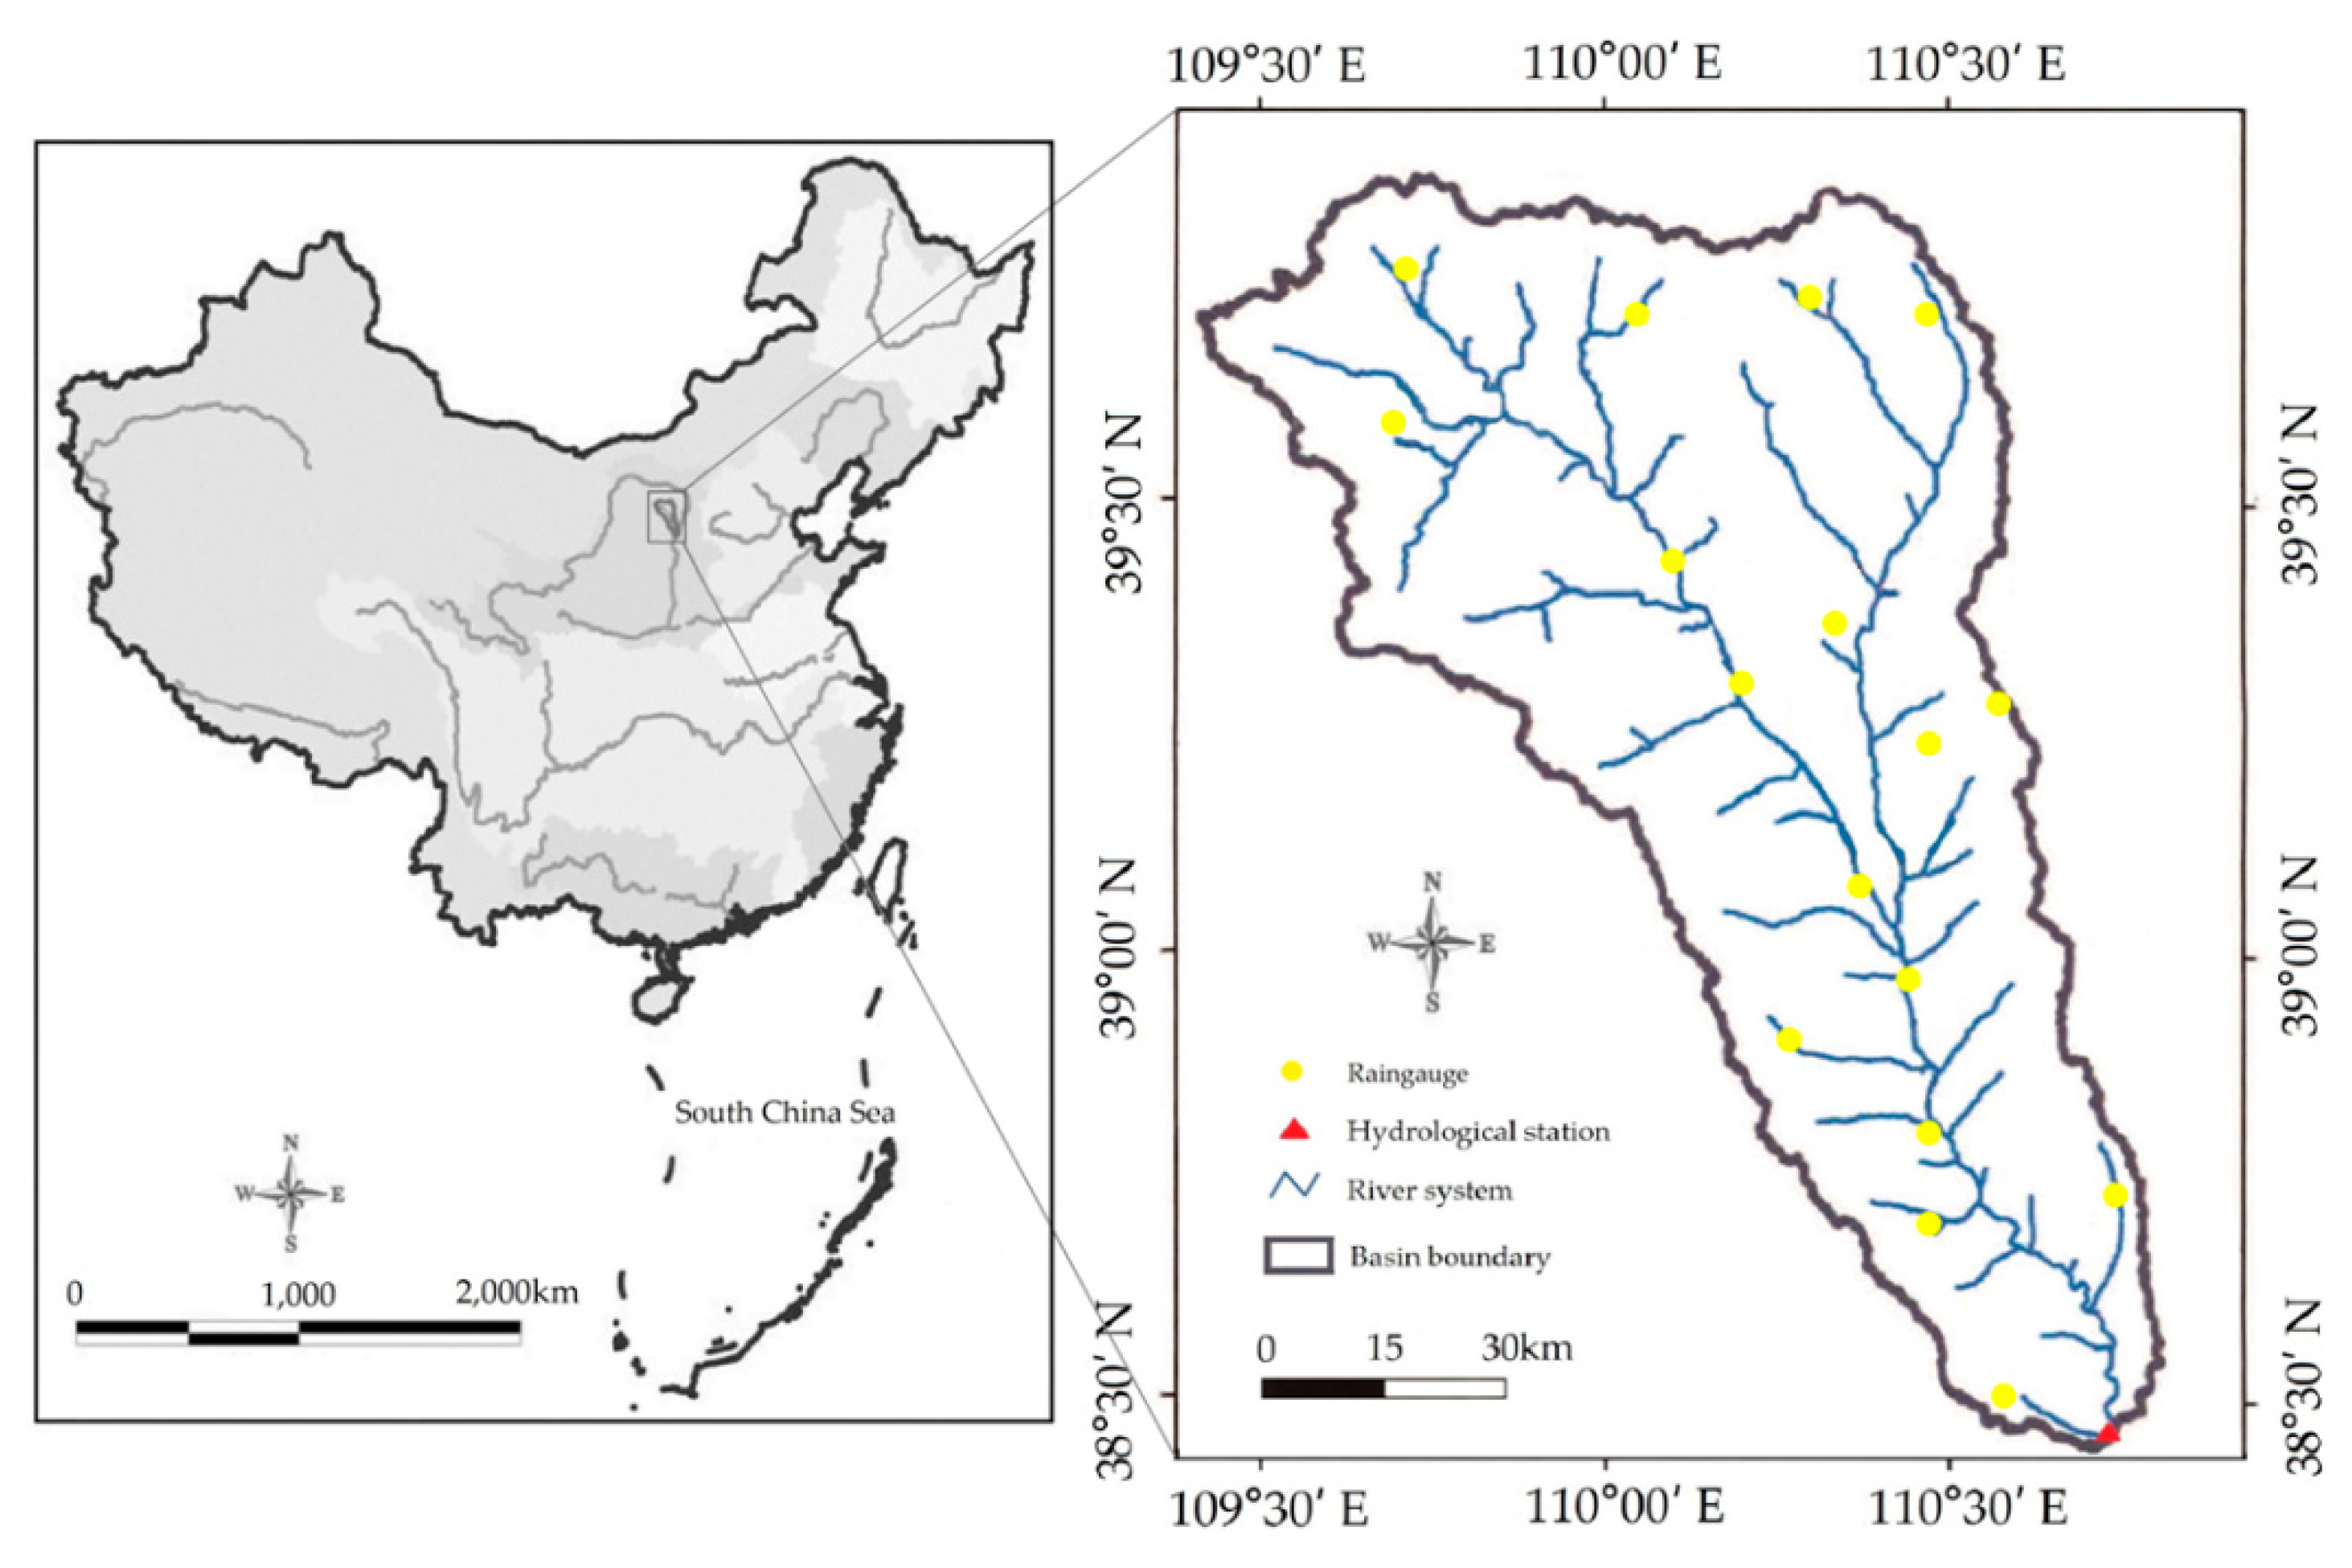
The precipitation and runoff simulation approach was adopted to simulate the runoff sequence without the influence of human activities, and then the hydrological drought recurrence period of each stage can be calculated according to the GH Copula function to quantitatively identify the attribution of drought risk change.
We suppose that the variation points are divided into three stages: natural stage 1 (observation), human activities stage 2 (observation), and ANN-simulated stage 2 (simulation). Under a certain drought recurrence period T and drought duration D, the first stage has drought severity S1 and runoff R1, and the second observation stage has severity S2 and runoff R2, as shown in Figure 2. According to the ANN simulation in Section 2.2, the functional relationship between R1 and P1 was established, R1 = F(P1), and, combined with the hydrological drought risk Copula calculation function, the runoff R2s obtained after the simulation can be used to calculate the drought severity under each recurrence period and drought duration.
For the first stage, we have S1 = C(R1|T, D), where the F function constitutes the factors of the underlying surface. If human activities have no influence, we think that this F function is also applicable to the second stage. However, according to the calculation of R2s and Copula function, a large difference △SH exists between S2s and the observed S2. This indicates that the underlying surface of the second stage has undergone significant changes under the influence of human activities. As the underlying surface F adopted by S2s in the simulation calculation is the same as that of the first stage, the difference in the value between S2s and S1, △SC, reflects the influence of climate change.
In Figure 2, the difference between S1 and S2, △ST, reflects the total change in drought severity. It has two parts: one caused by human activities, and the other by climate change.
The following equations outline the method of analyzing the impact of environmental change on runoff:
Δ S T = S 2 S 1
Δ S H = S 2 S 2 s
Δ S C = S 2 s S 1
η H = Δ S H Δ S T × 100 %
η C = Δ S C Δ S T × 100 %
where η H and η C are the percentages of impacts of human activities and climate change on the contribution to hydrological drought severity, respectively.

3. Site Description

The KRB is located between 109°28’ and 110°52’ E, and 38°23’ and 39°52’ N, with an area of about 8706 km2 and total length of 242 km. Elevation of the KRB is about 800–1300 m, with a river source elevation of 1498.7 m and estuary elevation of 740.6 m, which is a total drop of 758.1 m with average river slope of 2.55‰. The terrain in this region is high in the northwest and low in the southeast, and the depth of gullies is more than 150 m. The basin has a warm temperate semi-arid continental monsoon climate: dry and windy in spring, hot and rainy in summer, rainy and cold in autumn, and dry and cold in winter. The annual average temperature is 8.9 °C, ranging from −28.1 °C to 38.9 °C, with snow cover in winter. The average annual precipitation is 375–450 mm, increasing from northwest to southeast, mainly occurring from July to October, accounting for more than 70% of the annual precipitation.
We collected monthly precipitation data from 17 rain-measuring stations in the KRB and monthly runoff data from the Wenjiachuan hydrological station from 1954 to 2005. The Wenjiachuan station is the most downstream control station along the Kuye River, which flows into the Yellow River in Shamao Village, Shaanxi Province, China [40]. The locations of the 17 rain-measuring stations and the Wenjiachuan hydrology station are shown in Figure 3.
The conditions of the underlying surface of the KRB are complex. The soil in the watershed is loose and barren, and soil erosion is serious due to the lack of vegetation on the surface. The KRB is rich in high-quality coal resources, and the famous Shenfu-Dongsheng coal field runs through the middle of the basin. In the 1980s, with the focus shifting from coal resources development in China to the fragile ecological environment in the west, large-scale coal mining began in the KRB [41,42].

4. Results and Discussion

4.1. Variation Point Diagnosis

To qualitatively understand the changes in precipitation and runoff in the KRB, annual precipitation and runoff were plotted as shown in Figure 4.
Figure 4a shows that average annual precipitation in the KRB is close to the horizontal line, indicating that the annual precipitation changed little in the study period. However, annual runoff decreased by more than 50% year by year from 1980 onward.
The results of the OCM are shown in Figure 4b. The figure shows the smallest sum of deviations of squares in 1979, which can be used as a variation point. This result is consistent with the large-scale coal mining that has occurred in the region since 1979 [41].

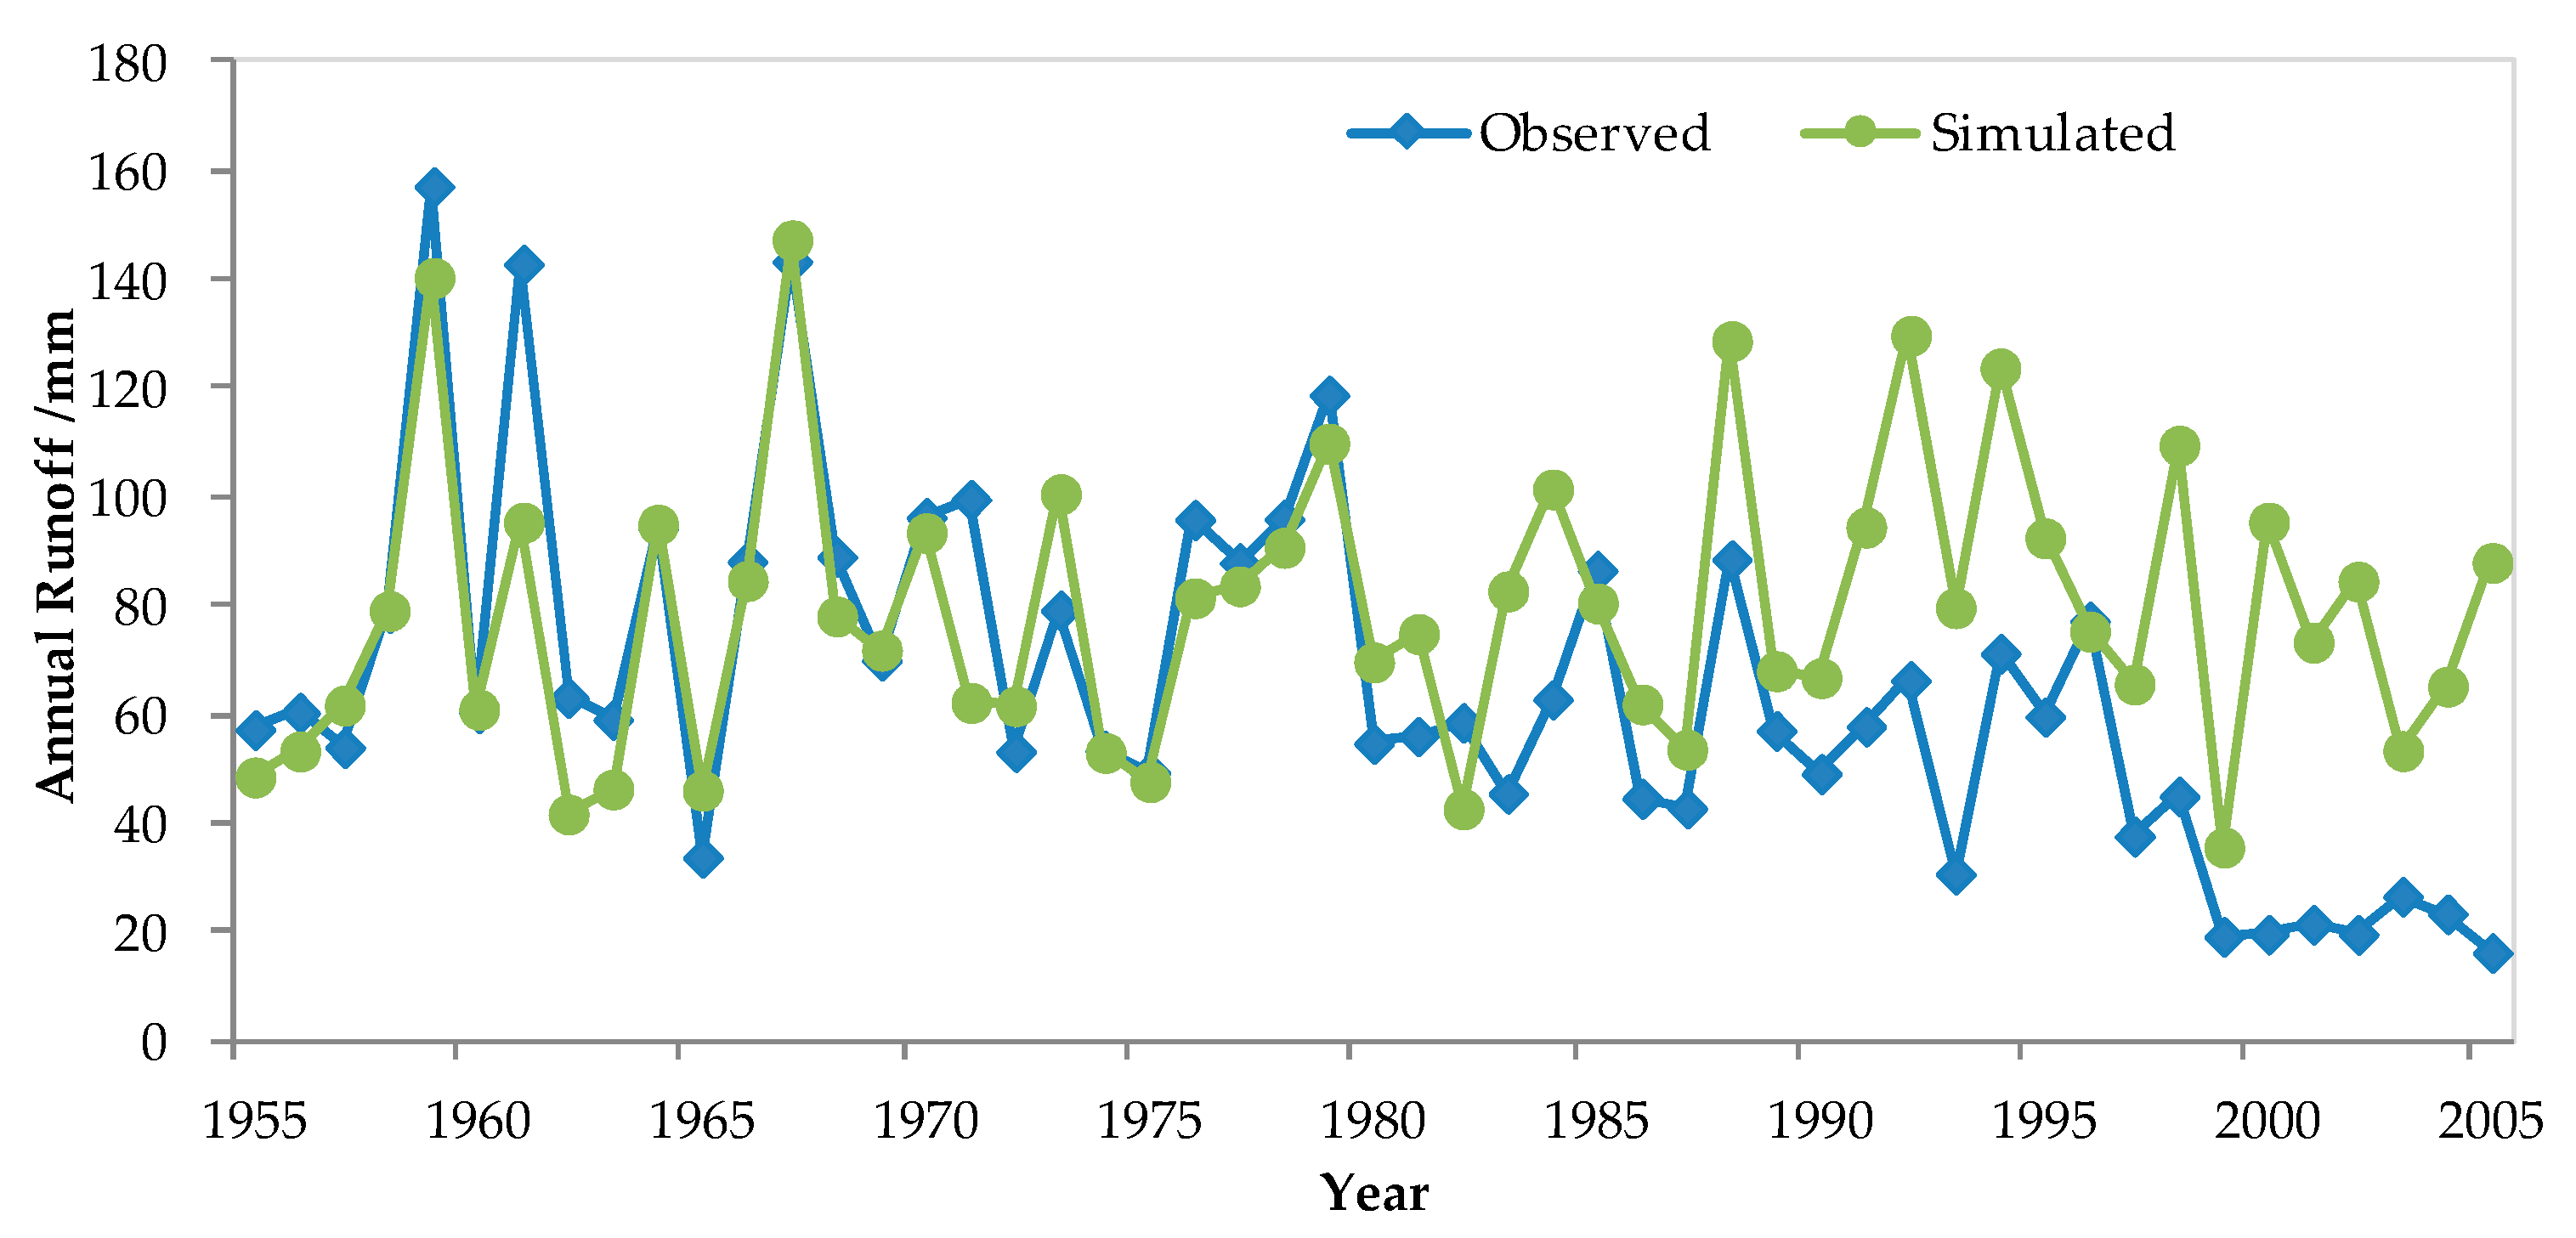
4.2. ANN Simulation Results

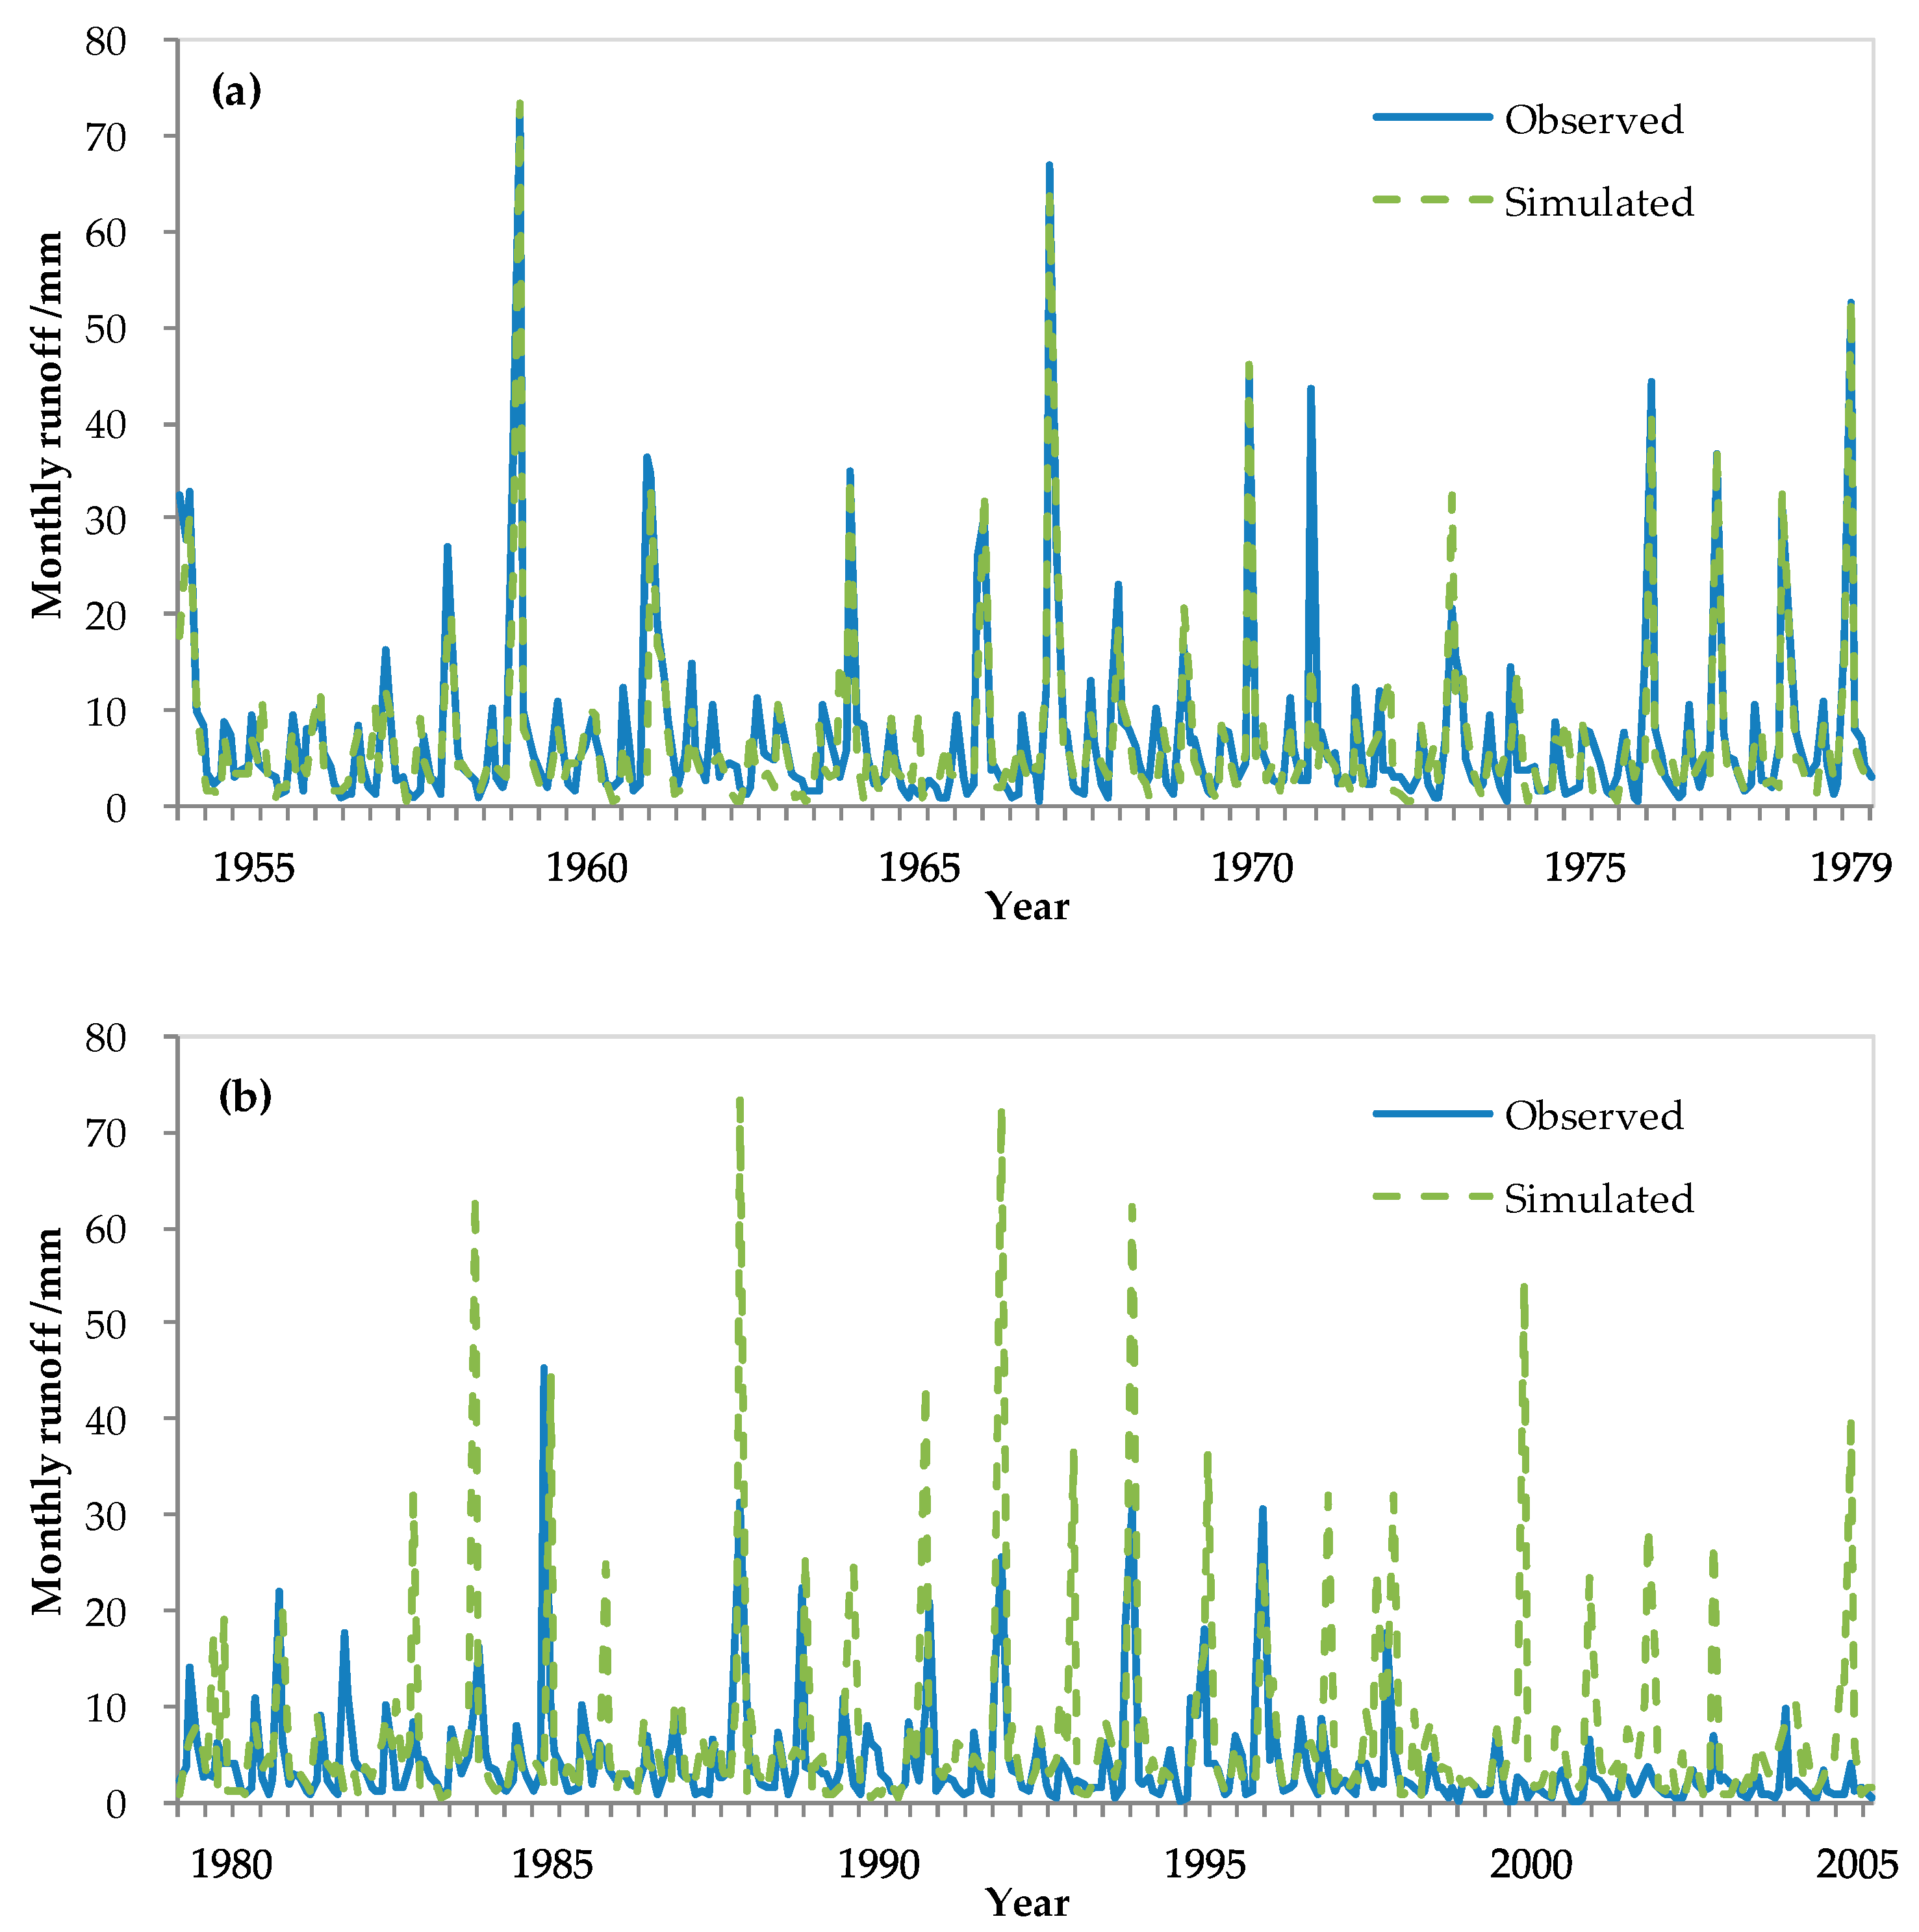
4.2.1. Simulation and Prediction Results

Monthly precipitation from 1954 to 1979 was used as the input and corresponding monthly runoff as the output. The simulated monthly precipitation and monthly runoff results are shown in Figure 5a. Monthly precipitation from 1980 to 2005 was input into the ANN; the monthly runoff predictions for human activities are shown in Figure 5b.
In the ANN simulation results in Figure 5a, the observed values are consistent with the simulated values, indicating that simulation quality was satisfactory. The NSE value of 0.801 further quantitatively indicates that the ANN model has accurately established the functional relationship between monthly precipitation and monthly runoff.
However, the prediction in Figure 5b shows that the calculated value of the model is much larger than the observed value, indicating a significant error between the calculated value of the model and the observed value. The NSE value of −2.312 is far less than 0, which further indicates that the monthly runoff calculated by the model deviates from reality.

4.2.2. ANN Simulation Discussion

The calculation results of the simulation model are relatively high because the ANN model used to establish the relationship between monthly precipitation and monthly runoff is based on historical data, which were not affected by human activities from 1954 to 1979. The model was used to predict the annual runoff from 1980 to 2005, which was a period affected by human activities. However, this deviation reflects the extent of human activities. For example, during the period from 1980 to 2005, the newly built water diversion irrigation system or the introduction of high-water consumption industries, such as coal mining, consumed a large amount of water from the river. The result is that the discharge measured by hydrologic stations was relatively small.
Figure 6 further demonstrates the difference between the simulated monthly runoff and the observed monthly runoff on the annual scale.
Figure 6 shows that in the period from 1954 to 1979, which was not affected by human activities, the simulated results of the model are basically consistent with the observed annual runoff, indicating that the simulated results of the model were accurate. However, during the period from 1980 to 2005, the annual runoff simulated by the model was higher than the observed value. In this period, at the beginning of the 1980s and 1990s, this phenomenon was not obvious. Later, the simulated runoff of the model was seen to be generally larger than the observed runoff. This is directly related to the coal mining that started in the early 1980s [42]. Until the 1980s, almost zero coal was mined annually in the KRB. In the 1980s, the average annual coal mining amount was about 29 × 104 t. In the 1990s, the average annual coal mining amount increased to 520 × 104 t. In the first five years of the 21st century, the average annual coal mining amount increased rapidly to 5452 × 104 t, seriously damaging the ecological environment in the region.

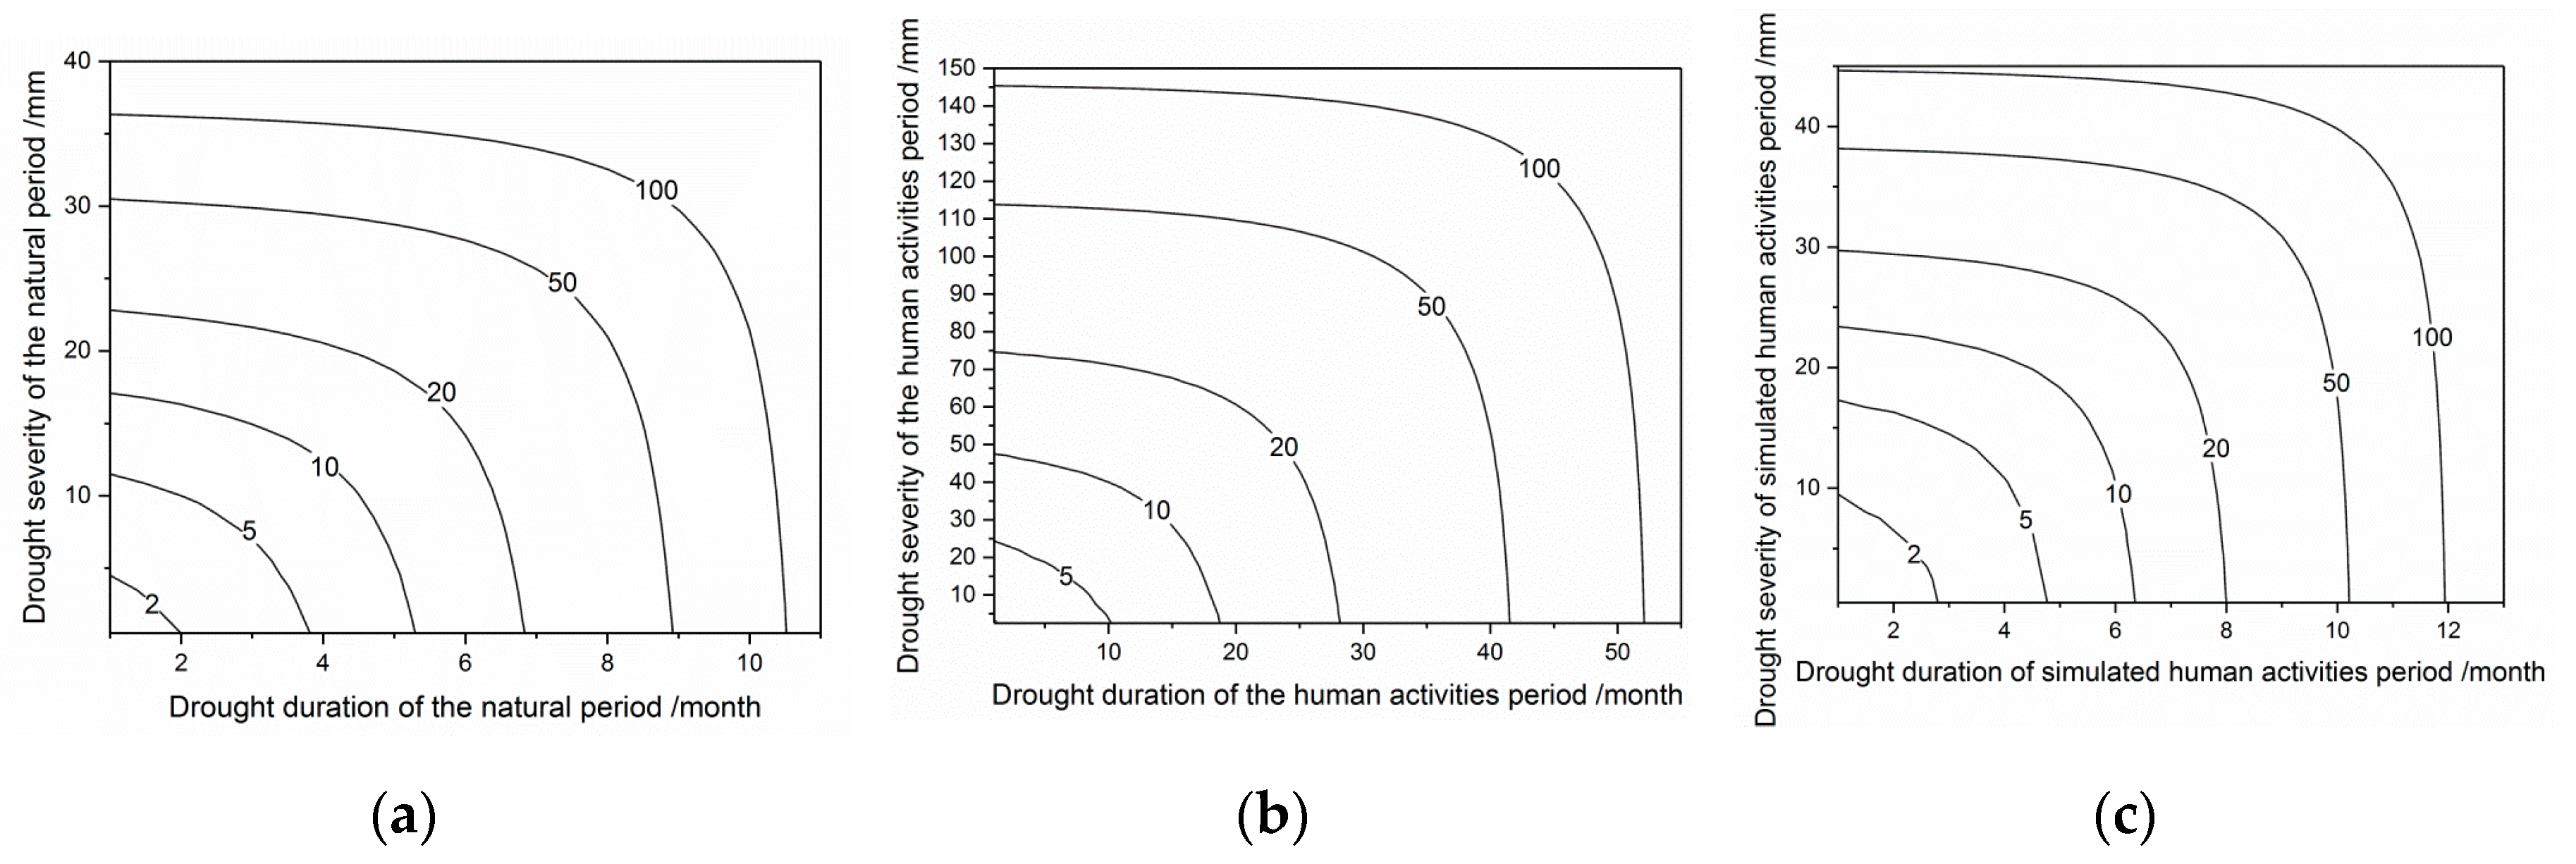
4.3. Results of Drought Risk Assessment

Based on the observed R1 in the first natural stage, and R2 and R2s in the second human activity stage, the drought process was identified by the run theory, and the hydrological drought risk in each stage was calculated by the GH Copula function, as shown in Figure 7. The parameters of the Copula function are shown in Table 1.
Figure 7 shows that the drought duration and drought severity in the natural state stage in Figure 7a are generally consistent with Figure 7c in the simulated state under each recurrence period. This indicates that without large-scale increase human activities, the drought risk status in the basin from 1980 to 2005 would not have changed significantly.
The results also indicate that climate change has contributed less to the recurrence of drought in the region. However, the drought recurrence period during the stage of human activities (Figure 7b) shows a significant increase in both duration and severity. For example, under the return period of 100 years, the drought duration increased about five times, while the severity of drought increased by nearly four times, severely restricting local social and economic development.
The above results provide a qualitative analysis of the impact of climate change and human activities on drought risk, which needed to be further quantitatively analyzed.

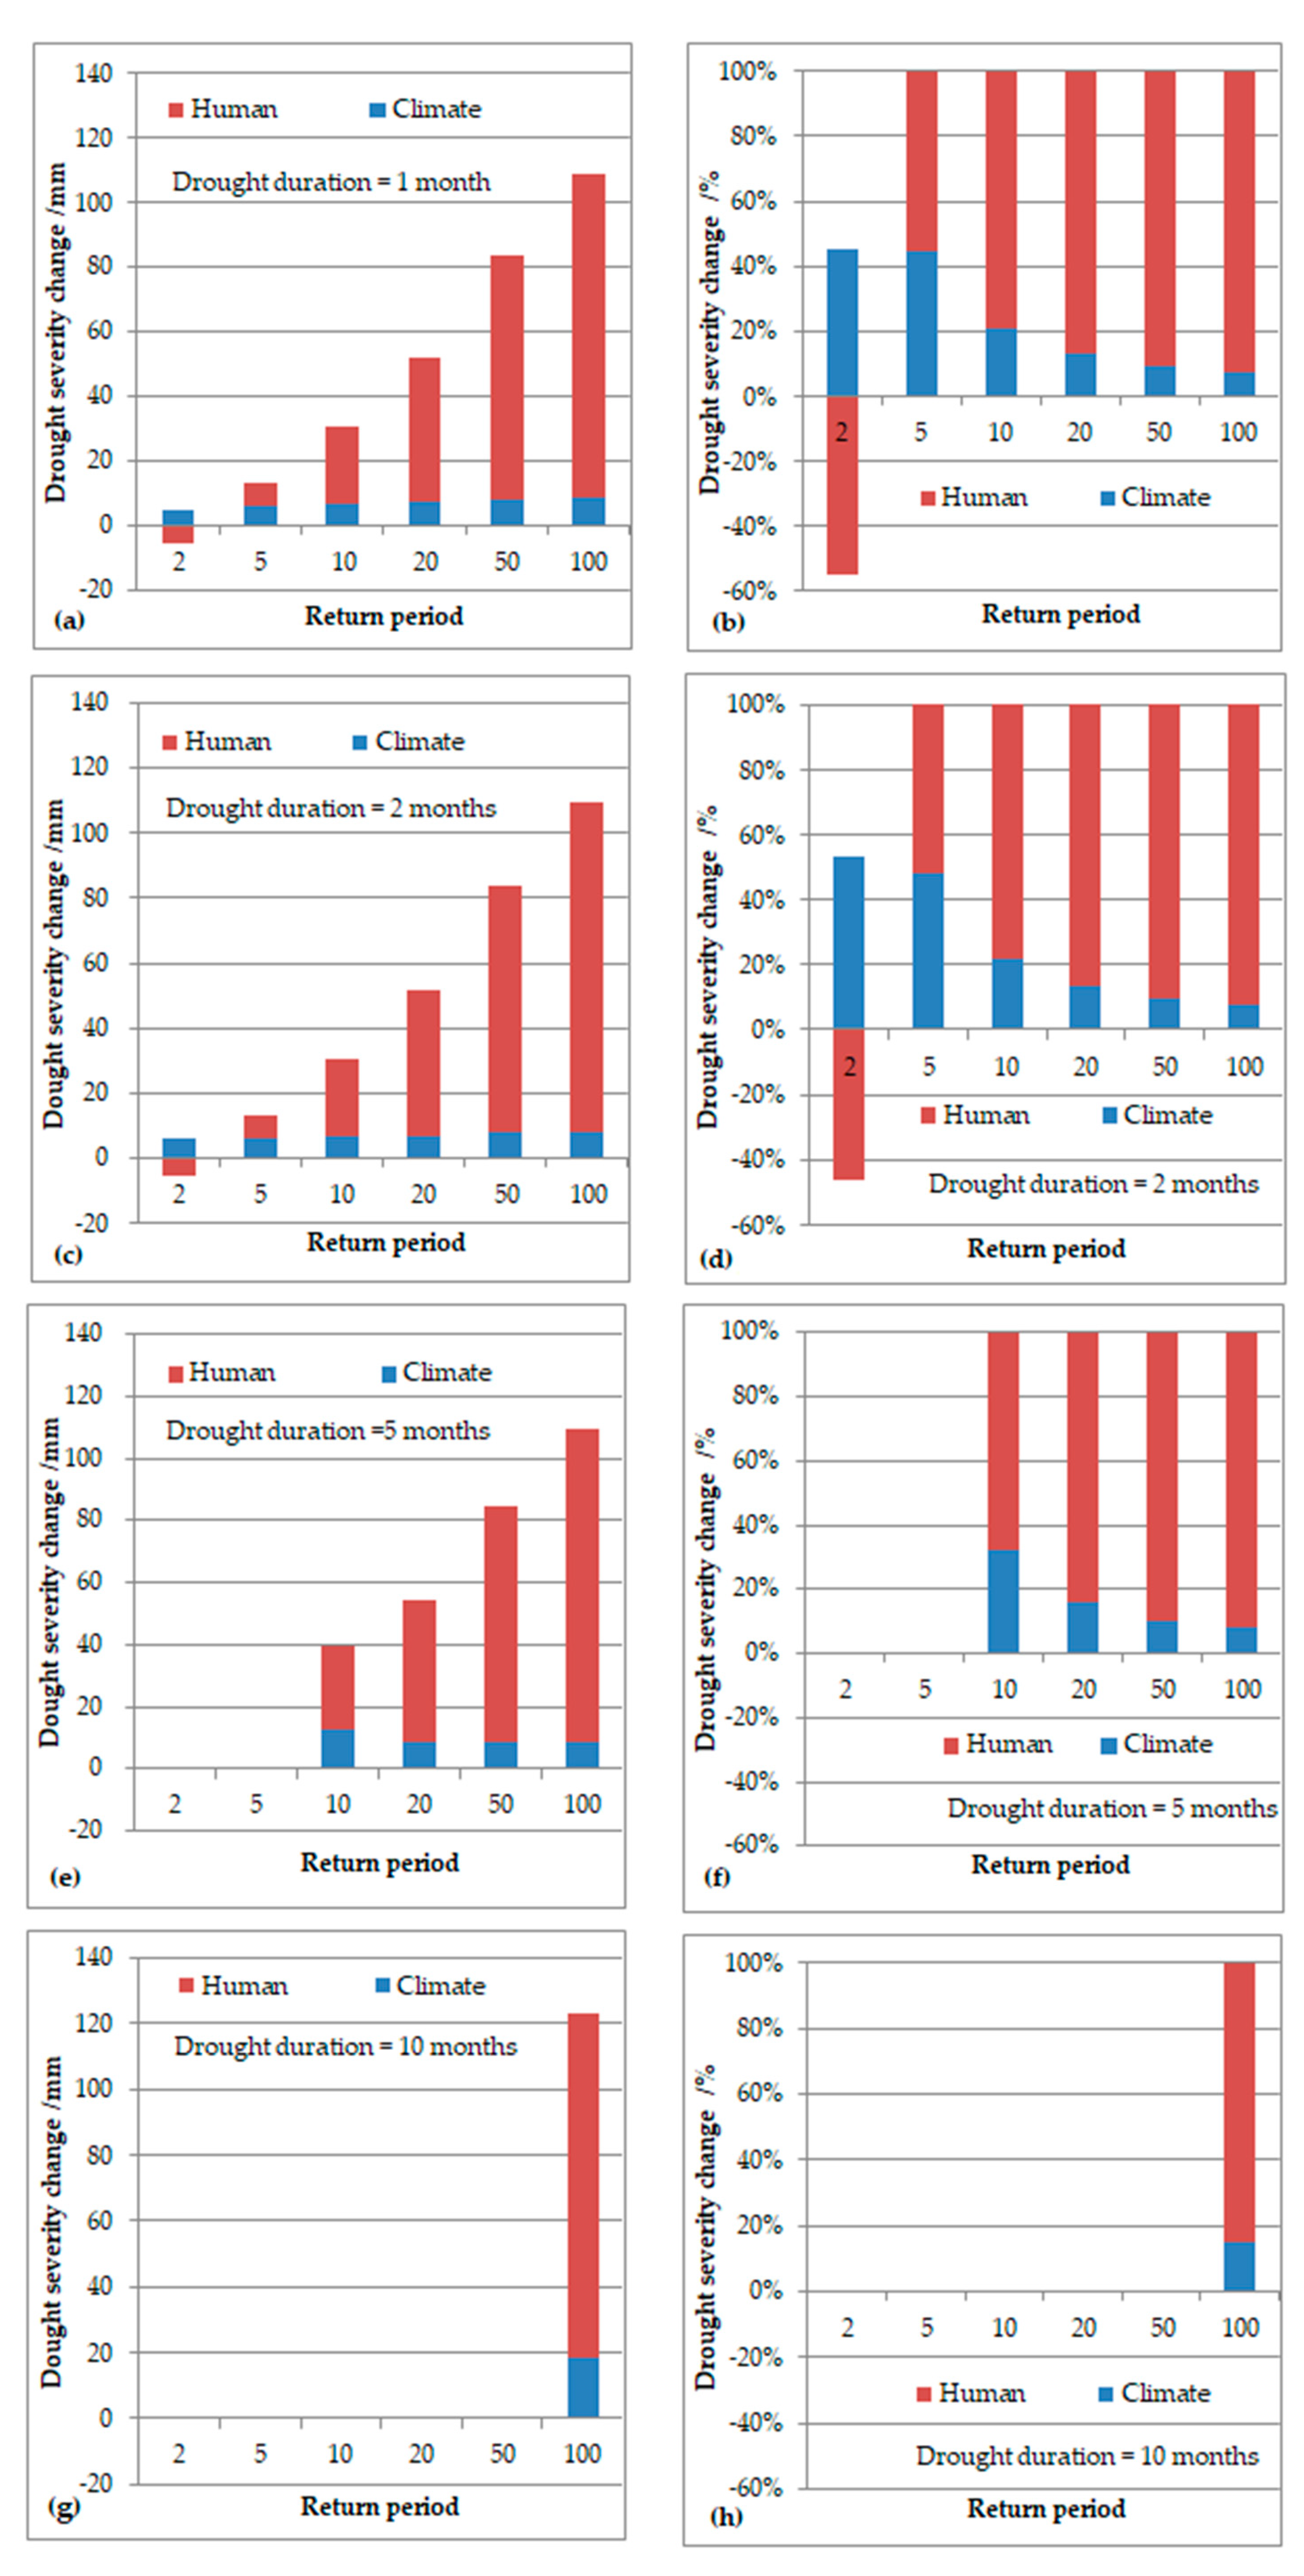
4.4. Quantitative Analysis of Contribution Rate of Climate Change and Human Activities to Drought Risk

According to Equations (7)–(11), the contribution rate of climate change and human activities to the change in drought severity was quantitatively calculated under the condition of drought durations of 1, 2, 5, and 10 months, and the recurrence periods of 2, 5, 10, 20, 50, and 100 years, as shown in Figure 8. The figure shows that human activities and climate change jointly affected the drought severity values under different drought recurrence periods. The red columns are longer, indicating a greater impact of human activity. This is consistent with the little change occurring in annual precipitation (Figure 4a) and large-scale human activity in the area.
Specifically, when the duration of drought is short, one or two months, and the recurrence period is low (two years), the contribution of climate change and human activities to drought severity is opposite compared to under other conditions. Figure 8a–d show that human activities contribute to reducing drought severity in a low drought recurrence period. This shows that local water resources protection measures, such as soil and water conservation, can promote the alleviation of frequent small-scale droughts, though the effect on reducing major drought disasters is limited. The unlimited development of rivers and other water resources, must still be reduced, and corresponding water resources planning and use policies must be formulated.
As the drought duration increased to 5 and 10 months, drought severity in the minor recurrence period could not be calculated. For example, when D = 5 months, the drought severity in the recurrence periods of two and five years can no longer be calculated because drought duration and drought severity jointly determine the recurrence period of drought. Greater drought duration is usually accompanied by greater drought severity.
For the 100-year drought recurrence period, the variation in each drought severity value is close to 100 mm. This value is also close to the difference between the simulated annual runoff and the observed annual runoff in Figure 6, likely caused by the excessive exploitation of water resources by local large-scale water industries. Therefore, if this region wants to prevent major drought disaster events that occur once in a century, it is necessary to adjust the current high-consumption water industry situation in the region and realize the sustainable use of water resources [43], for example, through the transfer of high-consumption water industries to other areas with abundant water resources, improving the water use rate of high-consumption water industries or massively increasing the proportion of reclaimed water [44]; the idea of virtual water can also be used as a reference for changing the local grain planting structure [45,46] to reduce the overall risk of large-scale drought disaster.

5. Conclusions

(1) The annual runoff series in the KRB changed significantly after 1979. The annual runoff decreased year over year after the variation, while the average annual precipitation changed little.
(2) ANN can be used to simulate the relationship between monthly precipitation and monthly runoff in the period not affected by human activities, but the simulation results for the period affected by human activities are poor. Human activities became widespread in the area after 1979, leading to a change in the relationship between monthly precipitation and monthly runoff. The difference between simulated and measured results reflects the influence of human activities on runoff and hydrological drought risk.
(3) The quantitative identification of drought risk generally reflects that human activities mainly contributed to the increase in drought risk in this region, but human activities have a beneficial effect on drought events with a short recurrence period of two years and contributed more to high-risk drought events with recurrence of five years and longer.
We mainly focused here on the hazard of hydrological drought risk. Further research should consider the vulnerability and exposure to hydrological drought. Additionally, the methods we used are simple in that the data-driven precipitation–runoff model does not consider hydrological factors such as evapotranspiration, temperature, and soil water storage in the basin. Therefore, further studies should adopt a hydrological model with a physical mechanism.

Author Contributions

Conceptualization and writing—original draft preparation, M.Z.; methodology, M.Z. and R.Z.; validation, R.Z.; data curation, J.W. All the authors read and approved the final manuscript.

Funding

The authors would like to thank the support of the National Key Research and Development Program of China under Grant No. 2017YFC1502405 and No. 2016YFC0401303, the National Natural Science Foundation of China under Grant No. 51579059, 51409001, the Key Research and Development Program of Shandong Province under Grant No. 2017GSF20101, and the Excellent Talents Supporting program of Higher Education of Anhui Province under Grant No. gxyqZD2016127.

Acknowledgments

The authors would like to thank anonymous reviewers for their valuable comments that helped improve the original version of this paper.

Conflicts of Interest

The authors declare no conflict of interest.

References

  1. Fleig, A.K.; Tallaksen, L.M.; Hisdal, H.; Demuth, S. A global evaluation of streamflow drought characteristics. Hydrol. Earth Syst. Sci. 2006, 10, 535–552. [Google Scholar] [CrossRef] [Green Version]
  2. Wilhite, D.A.; Glantz, M.H. Understanding the drought phenomenon: The role of definitions. Water Int. 1985, 10, 111–120. [Google Scholar] [CrossRef]
  3. Allen, M.R.; Ingram, W.J. Constraints on future changes in climate and the hydrologic cycle. Nature 2002, 419, 224–232. [Google Scholar] [CrossRef] [PubMed]
  4. Oki, T. Global Hydrological Cycles and World Water Resources. Science 2006, 313, 1068–1072. [Google Scholar] [CrossRef] [PubMed] [Green Version]
  5. Jin, J.L.; Wei, Y.M.; Zou, L.L.; Liu, L.; Fu, J. Risk evaluation of China’s natural disaster systems: An approach based on triangular fuzzy numbers and stochastic simulation. Nat. Hazards 2012, 62, 129–139. [Google Scholar] [CrossRef]
  6. Song, S.; Singh, V.P. Meta-elliptical copulas for drought frequency analysis of periodic hydrologic data. Stoch. Environ. Res. Risk Assess. 2010, 24, 425–444. [Google Scholar] [CrossRef]
  7. Mishra, A.K.; Singh, V.P. A review of drought concepts. J. Hydrol. 2010, 391, 202–216. [Google Scholar] [CrossRef]
  8. Cong, D.; Zhao, S.; Chen, C.; Duan, Z. Characterization of droughts during 2001–2014 based on remote sensing: A case study of Northeast China. Ecol. Inform. 2017, 39, 56–67. [Google Scholar] [CrossRef]
  9. Yuan, Z.; Yan, D.; Yang, Z.; Yin, J.; Breach, P.; Wang, D. Impacts of climate change on winter wheat water requirement in Haihe River Basin. Mitig. Adapt. Strat. Glob. 2016, 21, 677–697. [Google Scholar] [CrossRef]
  10. Yuan, X.C.; Wang, Q.; Wang, K.; Wang, B.; Jin, J.L.; Wei, Y.M. China’s regional vulnerability to drought and its mitigation strategies under climate change: Data envelopment analysis and analytic hierarchy process integrated approach. Mitig. Adapt. Strat. Glob. 2015, 20, 341–359. [Google Scholar] [CrossRef]
  11. Dai, A. Increasing drought under global warming in observations and models. Nat. Clim. Change 2013, 3, 52–58. [Google Scholar] [CrossRef]
  12. Forootan, E.; Khaki, M.; Schumacher, M. Understanding the global hydrological droughts of 2003–2016 and their relationships with teleconnections. Sci. Total Environ. 2019, 650, 2587–2604. [Google Scholar] [CrossRef]
  13. Xiao, M.Z.; Zhang, Q.; Singh, V.P. Influences of ENSO, NAO, IOD and PDO on seasonal precipitation regimes in the Yangtze River basin, China. Int. J. Climatol. 2014, 35, 3556–3567. [Google Scholar] [CrossRef]
  14. Strzepek, K.; Yohe, G.; Neumann, J.; Boehlert, B. Characterizing changes in drought risk for the United States from climate change. Environ. Res. Lett. 2010, 5, 044012. [Google Scholar] [CrossRef]
  15. Kirono, D.G.C.; Kent, D.M.; Hennessy, K.J.; Mpelasoka, F. Characteristics of Australian droughts under enhanced greenhouse conditions: Results from 14 global climate models. J. Arid Environ. 2011, 75, 566–575. [Google Scholar] [CrossRef]
  16. Wang, L.; Chen, W. A CMIP5 multimodel projection of future temperature, precipitation, and climatological drought in China. Int. J. Climatol. 2014, 34, 2059–2078. [Google Scholar] [CrossRef]
  17. Yang, X.L.; Zheng, W.F.; Lin, C.Q.; Ren, L.L.; Wang, Y.Q.; Zhang, M.R.; Yuan, F.; Jiang, S.H. Prediction of drought in the Yellow River based on statistical downscale study and SPI. J. Hohai Univ. 2017, 45, 377–383. (In Chinese) [Google Scholar]
  18. Williams, A.P.; Seager, R.; Abatzoglou, J.T.; Cook, B.I.; Smerdon, J.E.; Cook, E.R. Contribution of anthropogenic warming to California drought during 2012–2014. Geophys. Res. Lett. 2015, 42, 6819–6828. [Google Scholar] [CrossRef]
  19. Fengqing, J.; Cheng, Z.; Guijin, M.; Ruji, H.; Qingxia, M. Magnification of Flood Disasters and its Relation to Regional Precipitation and Local Human Activities since the 1980s in Xinjiang, Northwestern China. Nat. Hazards 2005, 36, 307–330. [Google Scholar] [CrossRef]
  20. Al-Faraj, F.A.M.; Scholz, M. Assessment of temporal hydrologic anomalies coupled with drought impact for a trans-boundary river flow regime: The Diyala watershed case study. J. Hydrol. 2014, 517, 64–73. [Google Scholar] [CrossRef]
  21. Zhang, R.; Chen, X.; Zhang, Z.; Shi, P. Evolution of hydrological drought under the regulation of two reservoirs in the headwater basin of the Huaihe River, China. Stoch. Environ. Res. Risk Assess. 2015, 29, 487–499. [Google Scholar] [CrossRef]
  22. Luan, Q.H.; Fu, X.R.; Liu, J.H.; Shao, W.W.; Bai, L.L.; Xu, X.Y. Drought events and drought-waterlogging asynchronismin Fen-wei Plain. South North Water Trans. Water Sci. Technol. 2016, 14, 90–95. (In Chinese) [Google Scholar]
  23. Tu, X.J.; Du, X.X.; Du, Y.L.; Chen, X.H.; Li, K. Multivariate joint design of hydrological drought and impact of water reservoirs. J. Lake Sci. 2018, 30, 509–518. (In Chinese) [Google Scholar]
  24. Wang, G.; Wang, Y. Managing Water for Sustainable Utilization as China Warms. Int. J. Environ. Sci. Nat. Resour. 2019, 17, 555952. [Google Scholar] [CrossRef]
  25. Wang, G.; Zhang, J.; Jin, J.; Weinberg, J.; Bao, Z.; Liu, C.; Zhai, R. Impacts of climate change on water resources in the Yellow River basin and identification of global adaptation strategies. Mitig. Adapt. Strat. Glob. 2017, 22, 67–83. [Google Scholar] [CrossRef]
  26. Xie, P.; Wu, Z.; Sang, Y.F.; Gu, H.; Zhao, Y.; Singh, V.P. Evaluation of the significance of abrupt changes in precipitation and runoff process in China. J. Hydrol. 2018, 560, 451–460. [Google Scholar] [CrossRef]
  27. Song, X.; Zhang, J.; Zou, X.; Zhang, C.; AghaKouchak, A.; Kong, F. Changes in precipitation extremes in the Beijing metropolitan area during 1960–2012. Atmos. Res. 2019, 222, 134–153. [Google Scholar] [CrossRef]
  28. Bao, Z.; Zhang, J.; Wang, G.; Fu, G.; He, R.; Yan, X.; Zhang, A. Attribution for decreasing streamflow of the Haihe River basin, northern China: Climate variability or human activities? J. Hydrol. 2012, 460, 117–129. [Google Scholar] [CrossRef]
  29. Wang, G.; Zhang, J.; Yang, Q. Attribution of Runoff Change for the Xinshui River Catchment on the Loess Plateau of China in a Changing Environment. Water 2016, 8, 267. [Google Scholar] [CrossRef]
  30. Fahimi, F.; Yaseen, Z.M.; El-Shafie, A. Application of soft computing based hybrid models in hydrological variables modeling: A comprehensive review. Theor. Appl. Climatol. 2016, 128, 1–29. [Google Scholar] [CrossRef]
  31. Maier, H.R.; Dandy, G.C. Neural networks for the prediction and forecasting of water resources variables: A review of modelling issues and applications. Environ. Model Softw. 2000, 15, 101–124. [Google Scholar] [CrossRef]
  32. Dawson, C.W.; Wilby, R.L. Hydrological modelling using artificial neural networks. Prog. Phys. Geogr. 2001, 25, 80–108. [Google Scholar] [CrossRef]
  33. Maier, H.R.; Jain, A.; Dandy, G.C.; Sudheer, K.P. Methods used for the development of neural networks for the prediction of water resource variables in river systems: Current status and future directions. Environ. Model Softw. 2010, 25, 891–909. [Google Scholar] [CrossRef]
  34. Abrahart, R.J.; Anctil, F.; Coulibaly, P.; Dawson, C.W.; Mount, N.J.; See, L.M.; Wilby, R.L. Two decades of anarchy? Emerging themes and outstanding challenges for neural network river forecasting. Prog. Phys. Geogr. 2012, 36, 480–513. [Google Scholar] [CrossRef]
  35. Jin, J.L.; Wei, Y.M.; Zou, L.L.; Liu, L.; Zhang, W.W.; Zhou, Y.L. Forewarning of sustainable utilization of regional water resources: A model based on BP neural network and set pair analysis. Nat. Hazards 2012, 62, 115–127. [Google Scholar] [CrossRef]
  36. Gupta, H.V.; Kling, H. On typical range, sensitivity, and normalization of Mean Squared Error and Nash-Sutcliffe Efficiency type metrics. Water Resour. Res. 2011, 47, 125–132. [Google Scholar] [CrossRef]
  37. Zhou, Y.L.; Yuan, X.C.; Jin, J.L.; Li, J.Q.; Song, S.B. Regional hydrological drought frequency based on Copulas. Scientia Geographica Sinica 2011, 31, 1383–1388. [Google Scholar]
  38. Zhang, Q.; Xiao, M.; Singh, V.P.; Chen, X. Copula-based risk evaluation of hydrological droughts in the East River basin, China. Stoch. Environ. Res. Risk Assess. 2013, 27, 1397–1406. [Google Scholar] [CrossRef]
  39. Shiau, J.T. Return period of bivariate distributed hydrological events. Stoch. Environ. Res. Risk Assess. 2003, 17, 42–57. [Google Scholar] [CrossRef]
  40. Wang, G.Q.; Zhang, J.Y.; Xuan, Y.Q.; Liu, J.F.; Jin, J.L.; Bao, Z.X.; Yan, X.L. Simulating the Impact of Climate Change on Runoff in a Typical River Catchment of the Loess Plateau, China. J. Hydrometeorol. 2013, 14, 1553–1561. [Google Scholar] [CrossRef]
  41. Guo, Q.L.; Yang, Y.; Xiong, X. Using hydrologic simulation to identify contributions of climate change and human activity to runoff changes in the Kuye river basin, China. Environ. Earth Sci. 2016, 75, 417–426. [Google Scholar] [CrossRef]
  42. Jiang, X.H.; Gu, X.W.; He, H.M. The influence of coal mining on water resources in the Kuye river basin. J. Nat. Resour. 2010, 25, 300–307. [Google Scholar]
  43. Zhang, M.; Zhou, J.H.; Zhou, R.J. Interval Multi-Attribute Decision of Watershed Ecological Compensation Schemes Based on Projection Pursuit Cluster. Water 2018, 10, 1280. [Google Scholar] [CrossRef]
  44. Zhou, R.J.; Wang, Y.B.; Zhang, M.; Yu, P.X.; Li, J.Y. Adsorptive removal of phosphate from aqueous solutions by thermally modified copper tailings. Environ. Monit. Assess. 2019, 191, 198–210. [Google Scholar] [CrossRef]
  45. Wang, Z.Z.; Zhang, L.L.; Zhang, Q.; Wei, Y.M.; Wang, J.W.; Ding, X.L.; Mi, Z.F. Optimization of virtual water flow via grain trade within China. Ecol. Indic. 2019, 97, 25–34. [Google Scholar] [CrossRef]
  46. Wang, Z.Z.; Zhang, L.L.; Ding, X.L.; Mi, Z.F. Virtual water flow pattern of grain trade and its benefits in China. J. Clean. Prod. 2019, 223, 445–455. [Google Scholar] [CrossRef]
Figure 1. Schematic diagram of drought identification.
Water 11 01958 g001
Figure 2. Schematic diagram of quantitative identification of drought risk attribution.
Water 11 01958 g002
Figure 3. River system and location of the Kuye river basin (KRB), China.
Water 11 01958 g003
Figure 4. Variation characteristics of precipitation and runoff series. (a) The trends in annual runoff and annual precipitation, and (b) the result of ordered clustering, showing the variation point.
Water 11 01958 g004
Figure 5. Artificial neural network (ANN) (a) simulation results from 1954 to 1979, and (b) model prediction results from 1980 to 2005.
Water 11 01958 g005
Figure 6. Simulated and observed annual runoff.
Water 11 01958 g006
Figure 7. Recurrence period of joint distribution of drought severity and drought duration. (a) The risk of natural period, (b) for the human activities period, and (c) for the simulated human activities.
Water 11 01958 g007
Figure 8. Drought risk attribution contribution: (a,c,e,g) Changes in drought severity and (b,d,f,h) the corresponding contribution from human activities and climate change.
Water 11 01958 g008
Table 1. Copula function parameters. R2—coefficient of determination.
Monthly Runoff SeriesKendall Correlation Coefficient (τ)Copula Parameters (θ)
θ = 1/(1 − τ)
R2
1954–1979 observed0.3941.6500.946
1980–2005 observed0.5152.1540.911
1980–2005 simulated0.4381.7790.816

