Meteorological Drought Monitoring in Northeastern China Using Multiple Indices


Abstract
1. Introduction
2. Materials and Methods
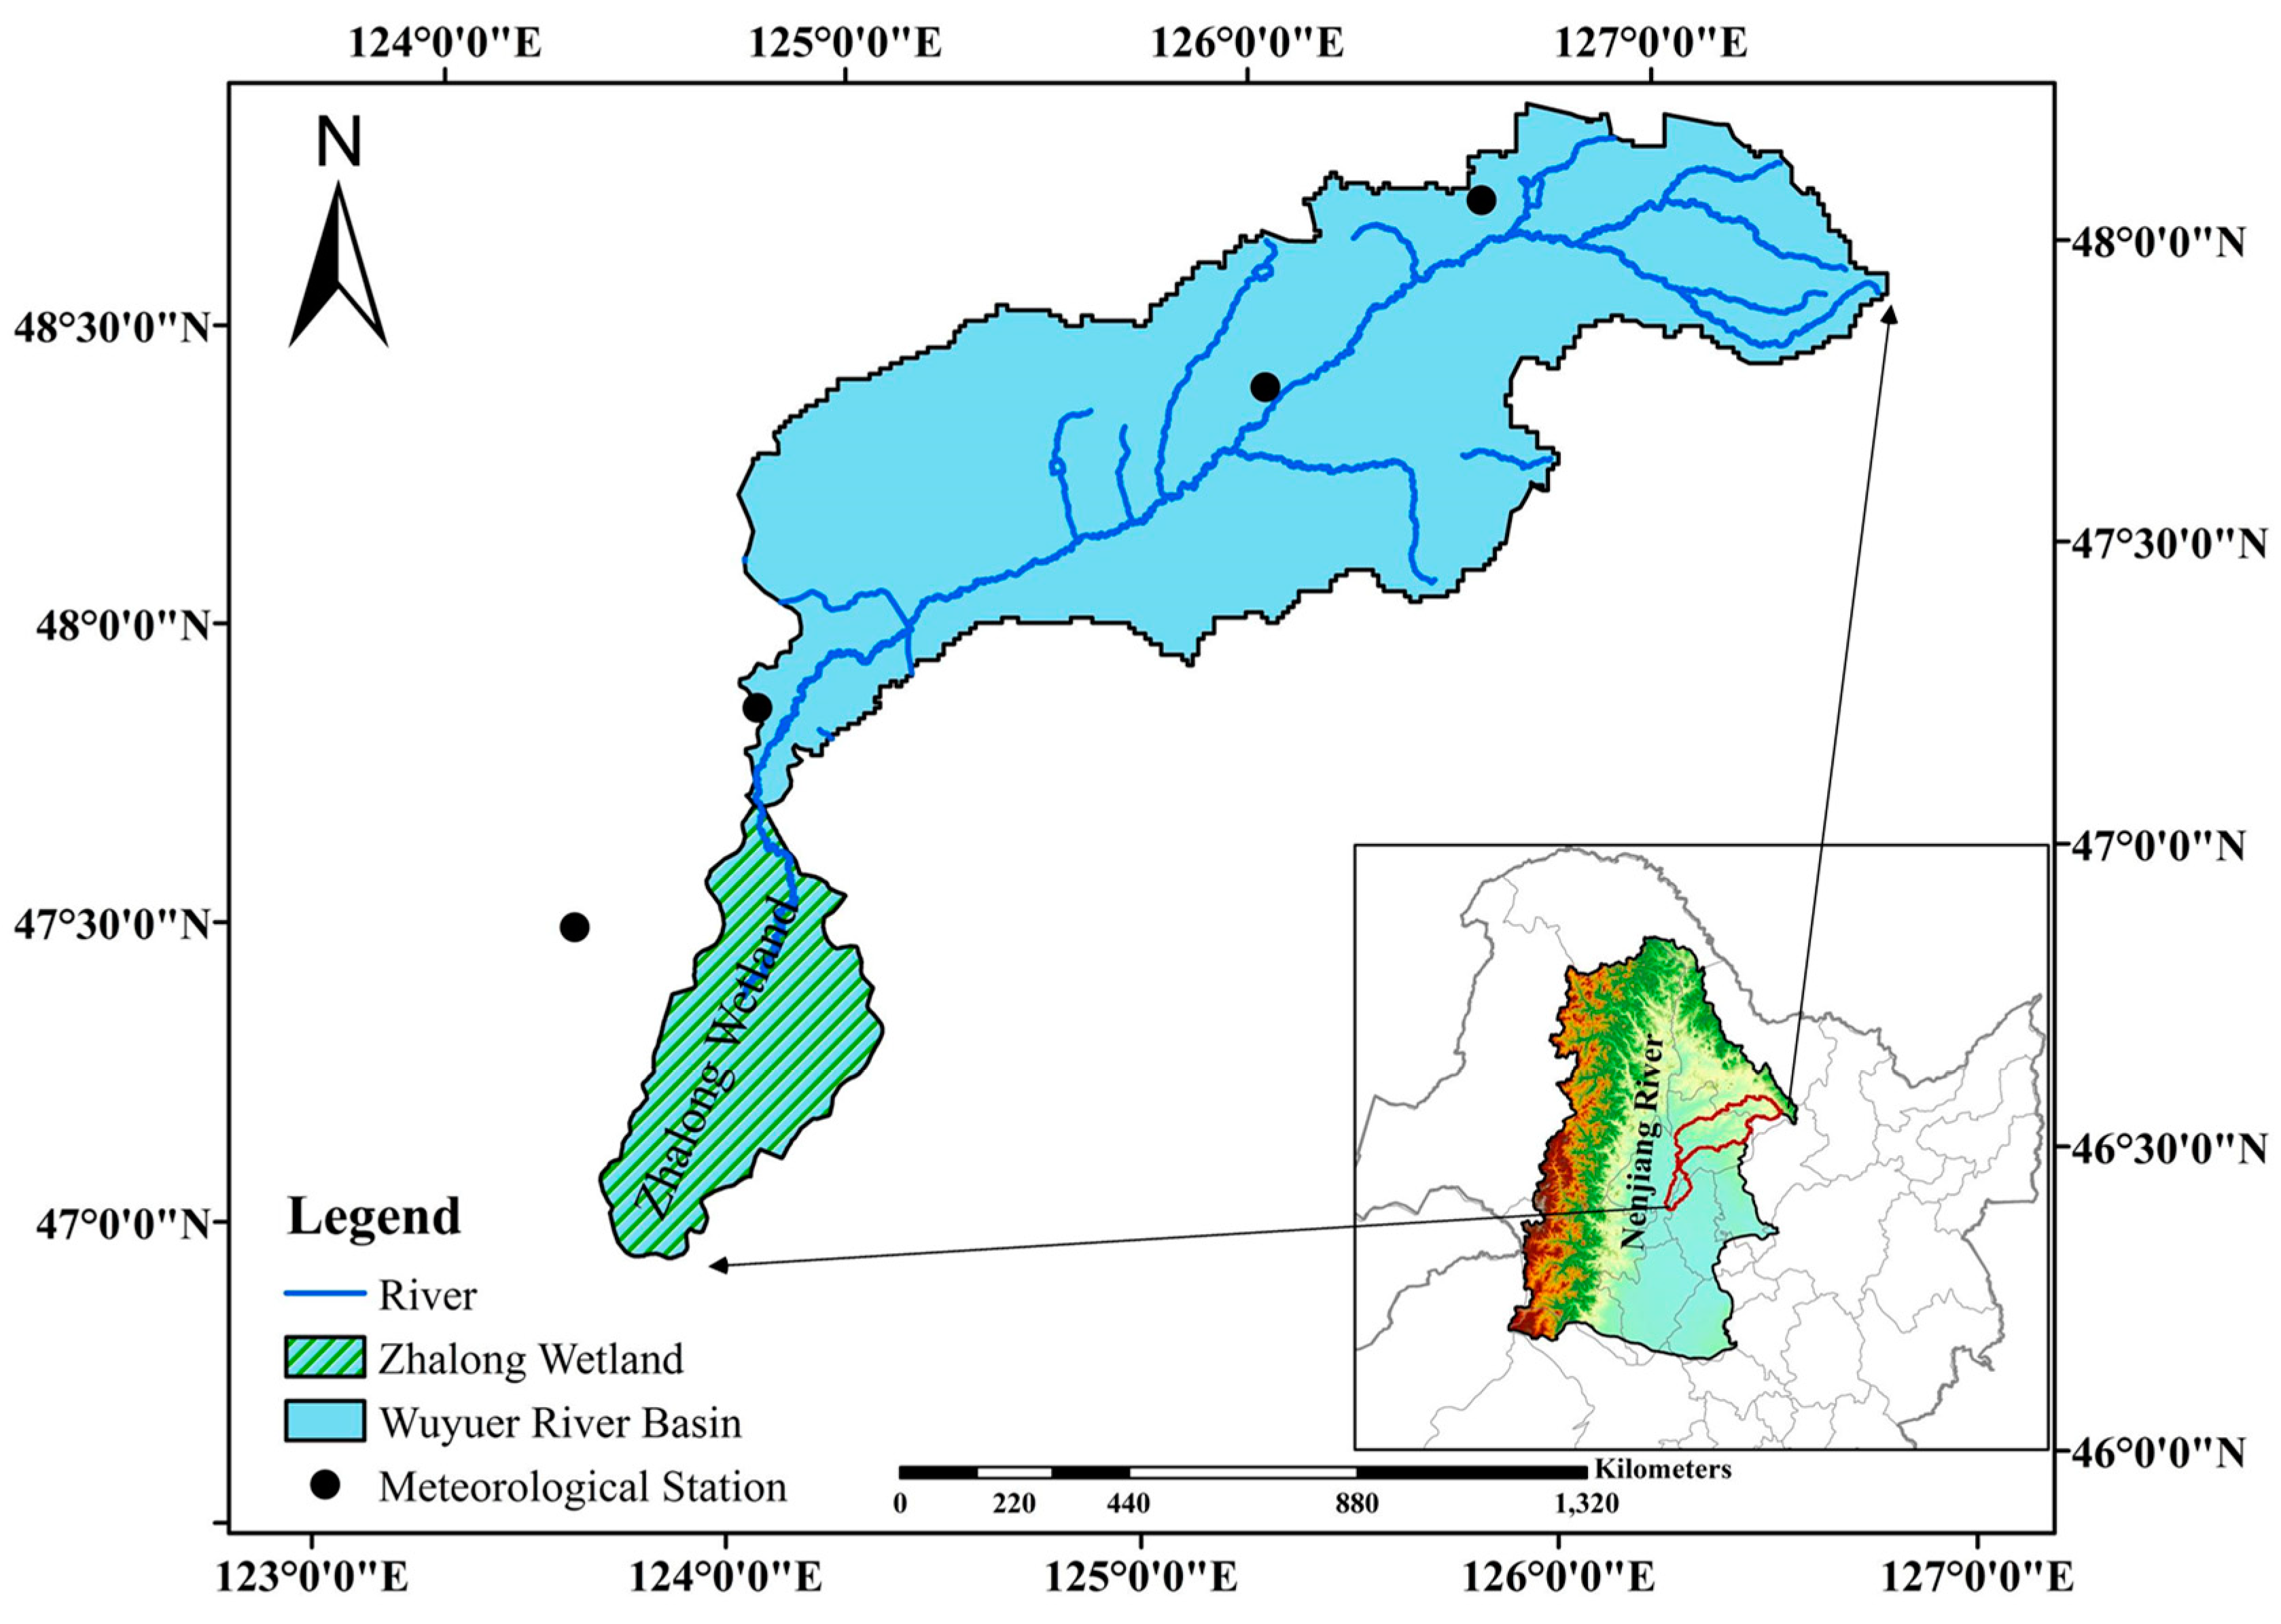
2.1. Study Area
2.2. Data Collection
2.3. Drought Indices Calculation
2.3.1. Percent of Normal by Mean (PN)
2.3.2. Z-Score
2.3.3. Standardized Precipitation Index (SPI)
2.3.4. Effective Drought Index (EDI)
3. Results and Discussion
3.1. Correlations of Drought Indices for Different Timesteps
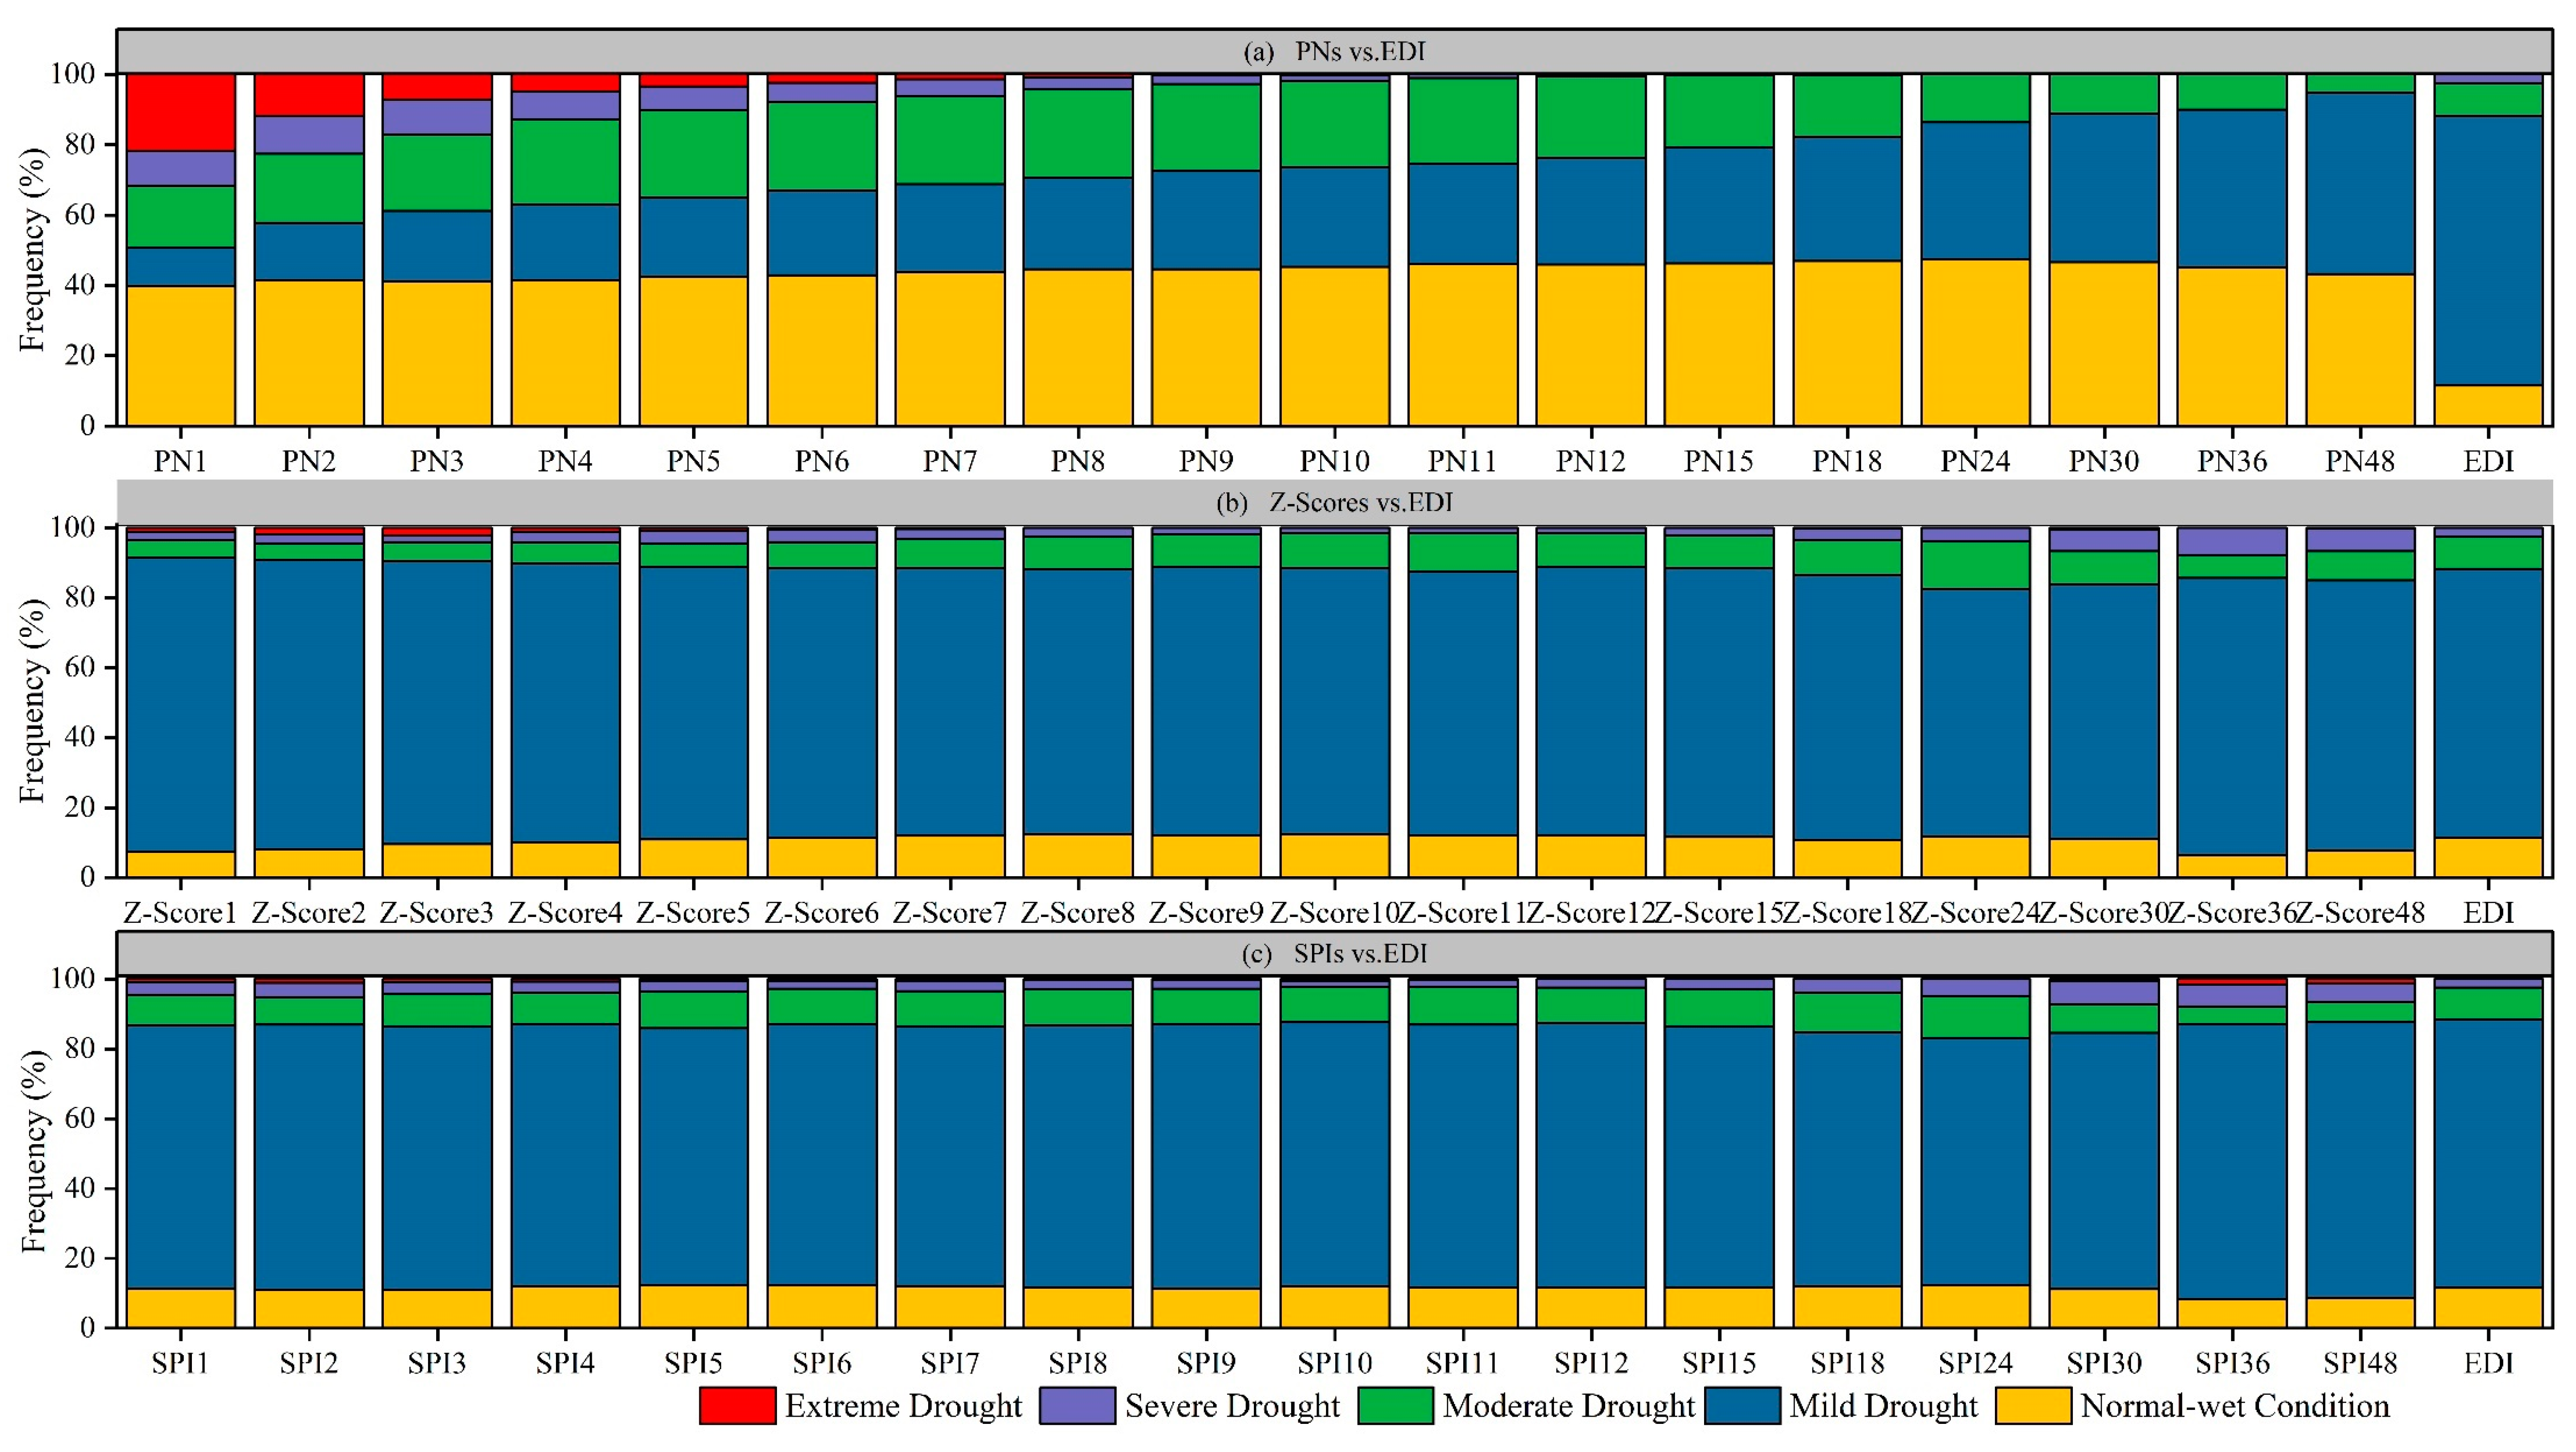
3.2. Evaluation of Drought Classes Indicated by DIs
3.2.1. Comparison of PN with EDI
3.2.2. Comparison of Z-Score with EDI
3.2.3. Comparison of SPI with EDI
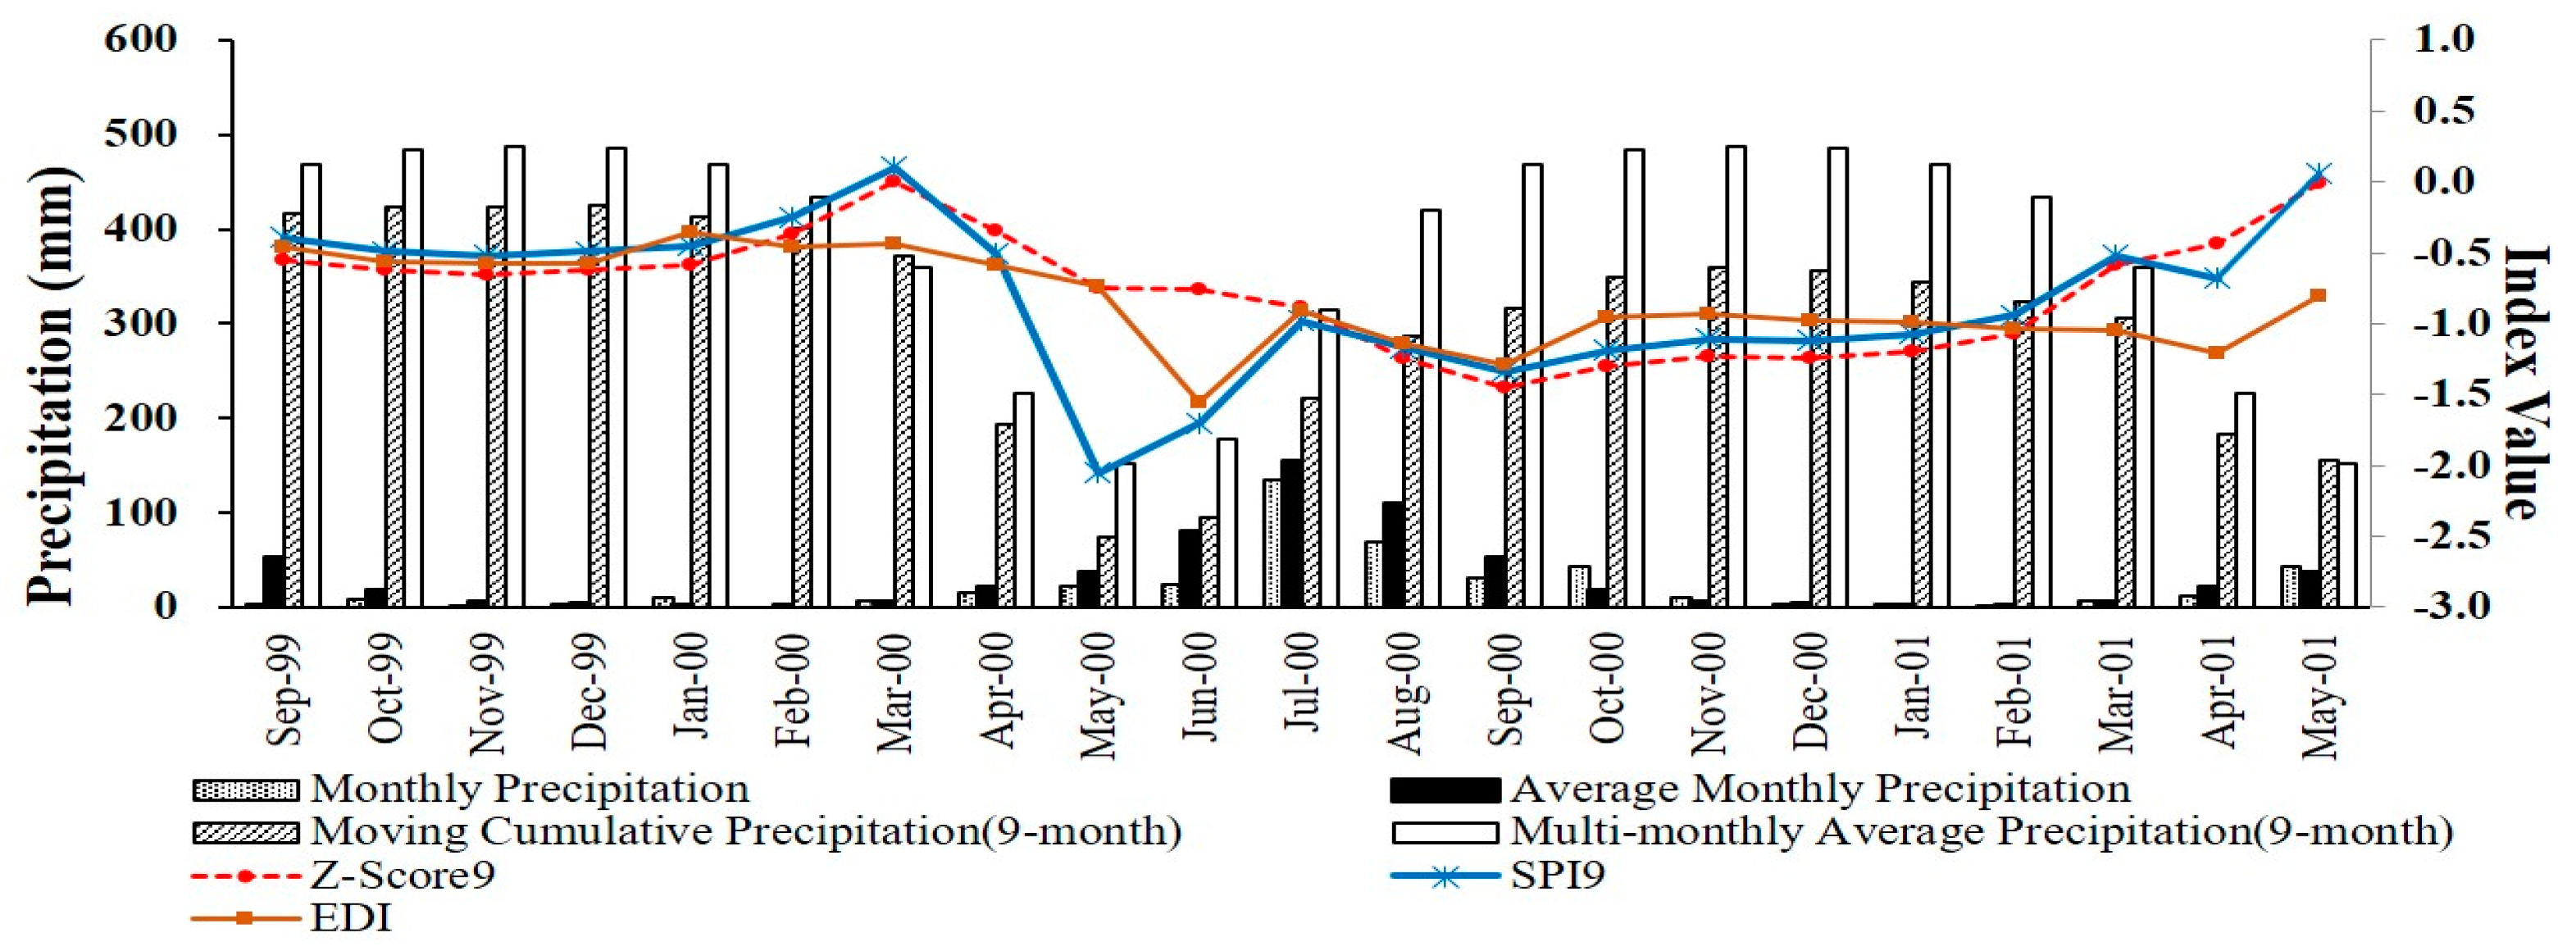
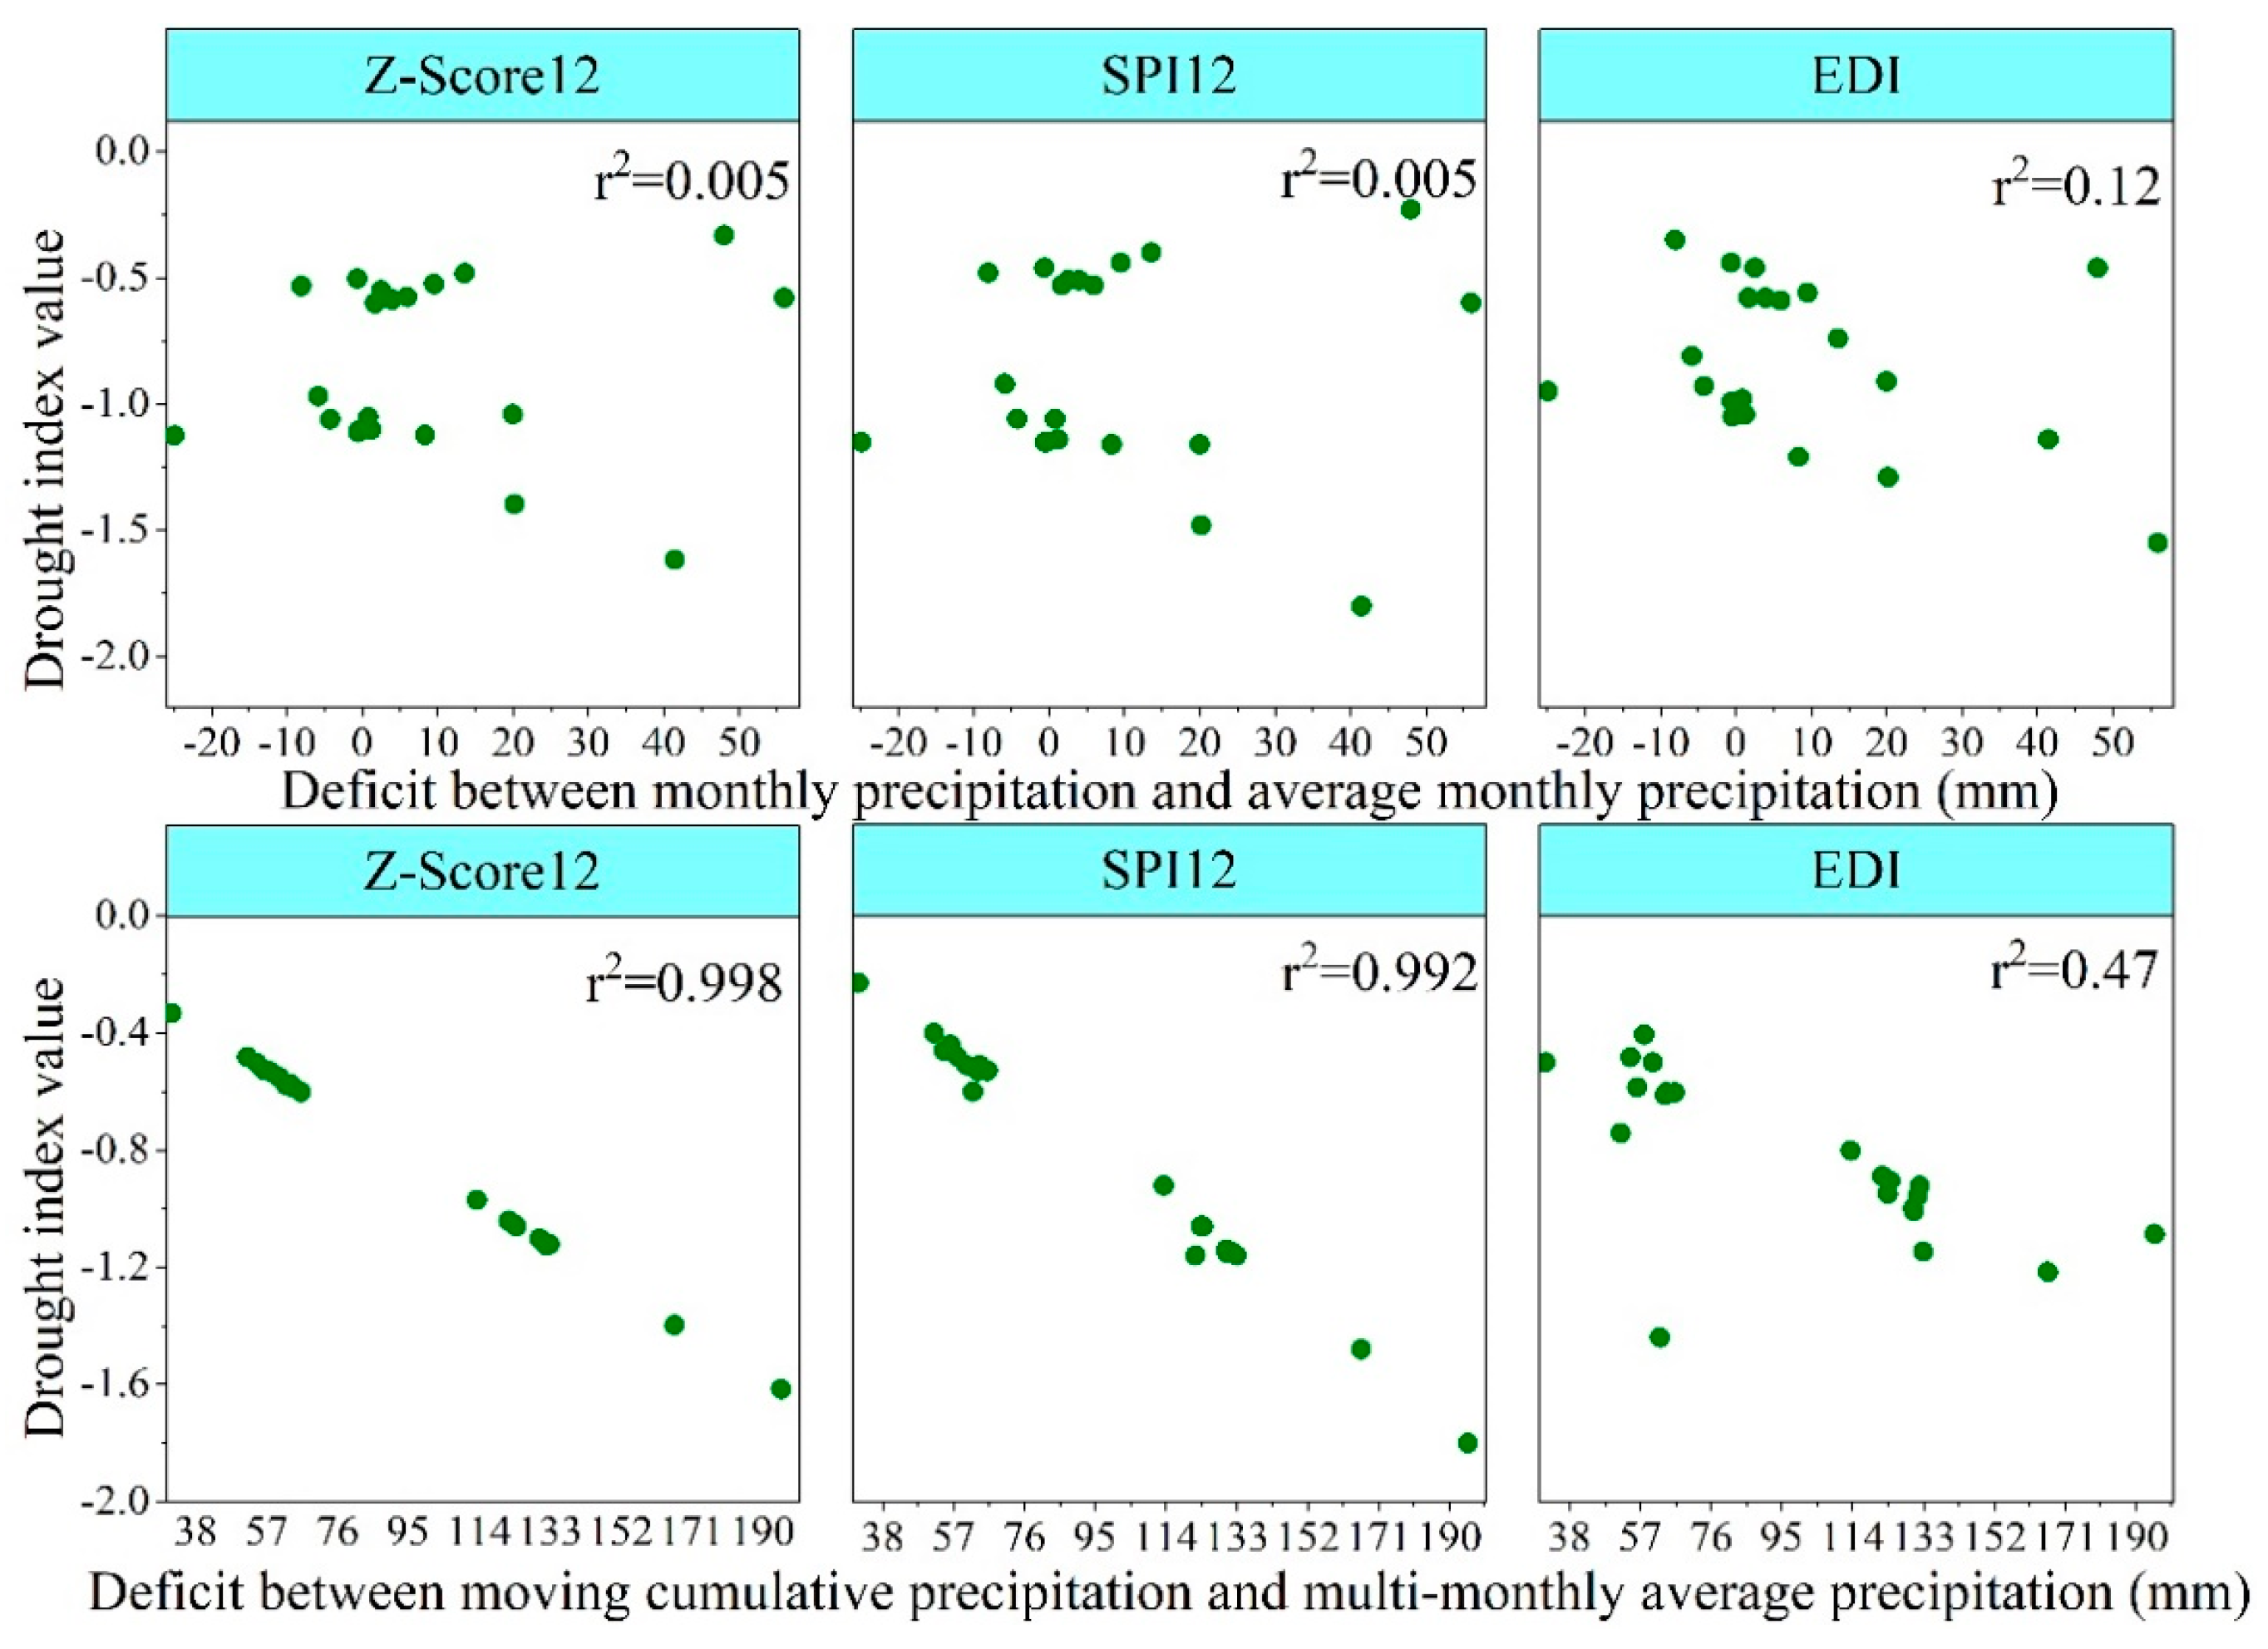
3.3. Effectiveness of DIs in Detecting Historical Droughts
4. Conclusions
Author Contributions
Funding
Acknowledgments
Conflicts of Interest
References
- Chen, S.T.; Kuo, C.C.; Yu, P.S. Historical trends and variability of meteorological droughts in Taiwan. Hydrol. Sci. J. 2009, 54, 430–441. [Google Scholar] [CrossRef]
- Meehl, G.A.; Karl, T.; Easterling, D.R. An introduction to trends in extreme weather and climate events: Observations, socioeconomic impacts, terrestrial ecological impacts, and model projections. Bull. Am. Meteorol. Soc. 2000, 81, 413–416. [Google Scholar] [CrossRef]
- Zamani, R.; Tabari, H.; Willems, P. Extreme streamflow drought in the Karkheh river basin (Iran): Probabilistic and regional analyses. Nat. Hazards 2015, 76, 327–346. [Google Scholar] [CrossRef]
- Dai, A. Increasing drought under global warming in observations and models. Nat. Clim. Chang. 2013, 3, 52–58. [Google Scholar] [CrossRef]
- Wilhite, D.A.; Glantz, M.H. Understanding the drought phenomenon: The role of definitions. Water Int. 1985, 10, 111–120. [Google Scholar] [CrossRef]
- Dracup, J.A.; Lee, K.S.; Paulson, E.G. On the definition of droughts. Water Resour. Res. 1980, 16, 297–302. [Google Scholar] [CrossRef]
- Acosta-Michlik, L.A.; Kumar, K.S.K.; Klein, R.J.T.; Campe, S. Application of fuzzy models to assess susceptibility to droughts from a socio-economic perspective. Reg. Environ. Chang. 2008, 8, 151–160. [Google Scholar] [CrossRef]
- White, D.H.; Walcott, J.J. The role of seasonal indices in monitoring and assessing agricultural and other droughts: A review. Crop Pasture Sci. 2009, 60, 599–616. [Google Scholar] [CrossRef]
- Sharma, S.; Mujumdar, P. Increasing frequency and spatial extent of concurrent meteorological droughts and heatwaves in India. Sci. Rep. 2017, 7. [Google Scholar] [CrossRef]
- Wu, J.; Chen, X.; Yao, H.; Gao, L.; Chen, Y.; Lui, M. Non-linear relationship of hydrological drought responding to meteorological drought and impact of a large reservoir. J. Hydrol. 2017, 551, 495–507. [Google Scholar] [CrossRef]
- Heim, R.R.J. A Review of twentieth-century drought indices used in the United States. Bull. Am. Meteorol. Soc. 2002, 83, 1149–1165. [Google Scholar] [CrossRef]
- Manatsa, D.; Mukwada, G.; Siziba, E.; Chinyanganya, T. Analysis of multidimensional aspects of agricultural droughts in Zimbabwe using the Standardized Precipitation Index (SPI). Theor. Appl. Climatol. 2010, 102, 287–305. [Google Scholar] [CrossRef]
- Li, X.; He, B.; Quan, X.; Liao, Z.; Bai, X. Use of the standardized precipitation evapotranspiration index (SPEI) to characterize the drying trend in Southwest China from 1982–2012. Remote Sens. 2015, 7, 10917–10937. [Google Scholar] [CrossRef]
- Buttafuoco, G.; Caloiero, T.; Coscarelli, R. Analyses of drought events in Calabria (southern Italy) using standardized precipitation index. Water Res. Manag. 2015, 29, 557–573. [Google Scholar] [CrossRef]
- Joshi, N.; Singh, A.K.; Madramootoo, C.A. Corn yield simulation under different nitrogen loading and climate change scenarios. J. Irrig. Drain. Eng. 2015, 141, 04015013. [Google Scholar] [CrossRef]
- Palmer, W. Meteorological Drought; US Department of Commerce, Weather Bureau; Research Paper No. 45; US Government Printing Office: Washington, DC, USA, 1965.
- Morid, S.; Smakhtin, V.; Moghaddasi, M. Comparison of seven meteorological indices for drought monitoring in Iran. Int. J. Climatol. 2006, 26, 971–985. [Google Scholar] [CrossRef]
- Yao, Z.; Ding, Y. Climate Statistics; Meteorological Press: Beijing, China, 1990. (In Chinese) [Google Scholar]
- McKee, T.B.; Doesken, N.J.; Kleist, J. The Relationship of Drought Frequency and Duration to Time Scales. In Proceedings of the 8th Conference on Applied Climatology, Anaheim, CA, USA, 17–22 January 1993; American Meteorological Society: Boston, MA, USA, 1993; pp. 179–184. [Google Scholar]
- Shafer, B.A.; Dezman, L.E. Development of a surface water supply index (SWSI) to assess the severity of drought conditions in snowpack runoff areas. In Proceedings of the 50th Annual Western Snow Conference, Reno, NV, USA, 19–23 April 1982; pp. 164–175. [Google Scholar]
- Khan, M.I.; Liu, D.; Fu, Q.; Saddique, Q.; Faiz, M.A.; Li, T.; Qamar, M.U.; Cui, S.; Cheng, C. Projected changes of future extreme drought events under numerous drought indices in the Heilongjiang province of China. Water Resour. Manag. 2017, 31, 1–17. [Google Scholar] [CrossRef]
- Byun, H.-R.; Wilhite, D.A. Objective quantification of drought severity and duration. J. Clim. 1999, 12, 2747–2756. [Google Scholar] [CrossRef]
- Zhang, B.; Zhao, X.; Jin, J.; Wu, P. Development and evaluation of a physically based multiscalar drought index: The standardized moisture anomaly index. J. Geophys. Res. Atmos. 2015, 120, 11575–11588. [Google Scholar] [CrossRef]
- Bajgain, R.; Xiao, X.; Wagle, P.; Basara, J.; Zhou, Y. Sensitivity analysis of vegetation indices to drought over two tallgrass prairie sites. ISPRS J. Photogramm. Remote Sens. 2015, 108, 151–160. [Google Scholar] [CrossRef]
- Gao, B.-C. NDWI—A normalized difference water index for remote sensing of vegetation liquid water from space. Remote Sens. Environ. 1996, 58, 257–266. [Google Scholar] [CrossRef]
- Gu, Y.; Brown, J.F.; Verdin, J.P.; Wardlow, B. A five-year analysis of MODIS NDVI and NDWI for grassland drought assessment over the central Great Plains of the United States. Geophys. Res. Lett. 2007, 34. [Google Scholar] [CrossRef]
- Zhou, Y.; Xiao, X.; Zhang, G.; Wagle, P.; Bajgain, R.; Dong, J.; Jin, C.; Basara, J.B.; Anderson, M.C.; Hain, C.; et al. Quantifying agricultural drought in tallgrass prairie region in the US Southern Great Plains through analysis of a water-related vegetation index from MODIS images. Agric. For. Meteorol. 2017, 246, 111–122. [Google Scholar] [CrossRef]
- Keyantash, J.; Dracup, J.A. The quantification of drought: An evaluation of drought indices. Bull. Am. Meteorol. Soc. 2002, 83, 1167–1180. [Google Scholar] [CrossRef]
- Hao, Z.; Aghakouchak, A. A nonparametric multivariate multi-index drought monitoring framework. J. Hydrometeorol. 2014, 15, 89–101. [Google Scholar] [CrossRef]
- He, B.; Lü, A.F.; Wu, J.J.; Zhao, L.; Liu, M. Drought hazard assessment and spatial characteristics analysis in China. J. Geogr. Sci. 2011, 21, 235–249. [Google Scholar] [CrossRef]
- Zhai, J.Q.; Su, B.; Krysanova, V.; Vetter, T.; Gao, C.; Jiang, T. Spatial variation and trends in PDSI and SPI indices and their relation to streamflow in 10 large regions of China. J. Clim. 2010, 23, 649–663. [Google Scholar] [CrossRef]
- Wang, H.; Chen, Y.; Pan, Y.; Li, W. Spatial and temporal variability of drought in the arid region of China and its relationships to teleconnection indices. J. Hydrol. 2015, 523, 283–296. [Google Scholar] [CrossRef]
- Feng, X.; Zhang, G.; Yin, X. Hydrological responses to climate change in Nenjiang River Basin, Northeastern China. Water Resour. Manag. 2011, 25, 677–689. [Google Scholar] [CrossRef]
- Song, X.; Song, S.; Sun, W.; Mu, X.; Wang, S.; Li, J.; Li, Y. Recent changes in extreme precipitation and drought over the Songhua River Basin, China, during 1960–2013. Atmos. Res. 2015, 157, 137–152. [Google Scholar] [CrossRef]
- Zhong, K.; Zheng, F.; Wu, H.; Qin, C.; Xu, X. Dynamic changes in temperature extremes and their association with atmospheric circulation patterns in the Songhua River Basin, China. Atmos. Res. 2017, 190, 77–88. [Google Scholar] [CrossRef]
- Ahmadalipour, A.; Moradkhani, H.; Svoboda, M. Centennial drought outlook over the CONUS using NASA-NEX downscaled climate ensemble. Int. J. Climatol. 2017, 37, 2477–2491. [Google Scholar] [CrossRef]
- Barua, S.; Ng, A.W.M.; Perera, B.J.C. Comparative Evaluation of drought indexes: Case study on the Yarra River Catchment in Australia. J. Water Resour. Plan. Manag. 2011, 137, 215–226. [Google Scholar] [CrossRef]
- Kim, D.W.; Byun, H.R.; Choi, K.S. Evaluation, modification, and application of the effective drought index to 200-year drought climatology of Seoul, Korea. J. Hydrol. 2009, 378, 1–12. [Google Scholar] [CrossRef]
- Ding, H.; Xia, B. Analysis of drought and their factors in Keshan County. Theor. Obs. 2014, 3, 72–73. (In Chinese) [Google Scholar]
- Yang, H.; Wang, H.; Fu, G.; Yan, H.; Zhao, P.; Ma, M. A modified soil water deficit index (MSWDI) for agricultural drought monitoring: Case study of Songnen Plain, China. Agric. Water Manag. 2017, 194, 125–138. [Google Scholar] [CrossRef]
- Faiz, M.A.; Liu, D.; Fu, Q.; Sun, Q.; Li, M.; Baig, F.; Li, T.; Cui, S. How accurate are the performances of gridded precipitation data products over Northeast China? Atmos. Res. 2018, 211, 12–20. [Google Scholar] [CrossRef]
- Song, X.; Li, L.; Fu, G.; Li, J.; Zhang, A.; Liu, W.; Zhang, K. Spatial–temporal variations of spring drought based on spring-composite index values for the Songnen Plain, Northeast China. Theor. Appl. Climatol. 2014, 116, 371–384. [Google Scholar] [CrossRef]
- Pandey, R.P.; Dash, B.B.; Mishra, S.K.; Singh, R. Study of indices for drought characterization in KBK districts in Orissa (India). Hydrol. Process. 2010, 22, 1895–1907. [Google Scholar] [CrossRef]
- Paulo, A.; Pereira, L.S. Drought concepts and characterization. Water Int. 2006, 31, 37–49. [Google Scholar] [CrossRef]
- Montaseri, M.; Amirataee, B. Comprehensive stochastic assessment of meteorological drought indices. Int. J. Climatol. 2016, 37, 998–1013. [Google Scholar] [CrossRef]
- Wu, H.; Hayes, M.J.; Weiss, A.; Hu, Q. An evaluation of the standardized precipitation index, the China-Z index and the statistical Z-score. Int. J. Climatol. 2001, 21, 745–758. [Google Scholar] [CrossRef]
- Dogan, S.; Berktay, A.; Singh, V.P. Comparison of multi-monthly rainfall-based drought severity indices, with application to semi-arid Konya closed basin, Turkey. J. Hydrol. 2012, 470, 255–268. [Google Scholar] [CrossRef]
- Luo, L.; Apps, D.; Arcand, S.; Xu, H.; Pan, M.; Hoerling, M. Contribution of temperature and precipitation anomalies to the California drought during 2012–2015. Geophys. Res. Lett. 2017, 44, 3184–3192. [Google Scholar] [CrossRef]
- Williams, A.P.; Seager, R.; Abatzoglou, J.T.; Cook, B.I.; Smerdon, J.E.; Cook, E.R. Contribution of anthropogenic warming to California drought during 2012–2014. Geophys. Res. Lett. 2015, 42, 6819–6828. [Google Scholar] [CrossRef]
- Field, C.B.; Barros, V.R.; Mach, K.; Mastrandrea, M. Climate Change 2014: Impacts, Adaptation, and Vulnerability; Contribution of Working Group II to the Fifth Assessment Report; Intergovernmental Panel on Climate Change: Geneva, Switzerland, 2014. [Google Scholar]


| Drought Index | Full Name | Considered Variables | References |
|---|---|---|---|
| PDSI | Palmer Drought Severity Index | Precipitation, Temperature, Soil moisture | [16] |
| PN | Percent of Normal | Precipitation | [17] |
| Z-Score | Z-Score | Precipitation | [18] |
| SPI | Standardized Precipitation Index | Precipitation | [19] |
| SWSI | Surface Water Supply Index | Rainfall, Runoff, and Snow water content, Storage Reservoir Volume | [20] |
| SPEI | Standardized Precipitation Evapotranspiration Index | Precipitation, Evapotranspiration | [13] |
| RDI | Reconnaissance Drought Index | Precipitation, Potential Evapotranspiration | [21] |
| EDI | Effective Drought Index | Precipitation | [22] |
| SMAI | Standardized Moisture Anomaly Index | Precipitation, Runoff, Soil moisture, Evapotranspiration | [23] |
| LSWI | Land Surface Water Index | Remote Sensing Based Vegetation Indices | [24] |
| NDWI | Normalized Difference Water Index | Water and Vegetation information from MODIS (Moderate Resolution Imaging Spectroradiometer) images | [25,26] |
| Stations | Elevation (m) | Coordinates | Statistics of Annual Precipitation Series (1960–2010) | |||||
|---|---|---|---|---|---|---|---|---|
| Lat. | Lon. | Mean (mm) | Max (mm) | Min (mm) | Median (mm) | St.D | ||
| Beian | 270 | 48.28 | 126.52 | 523 | 785 | 312 | 499 | 123 |
| Keshan | 235 | 48.05 | 125.88 | 497 | 901 | 252 | 492 | 110 |
| Fuyu | 163 | 47.80 | 124.48 | 438 | 748 | 285 | 418 | 125 |
| Classifications | Extreme Drought | Severe Drought | Moderate Drought | Mild Drought | Normal-Wet Condition |
|---|---|---|---|---|---|
| 4 | 3 | 2 | 1 | 0 | |
| PN (%) | ≤40 | 40~55 | 55~80 | 80~100 | ≥100 |
| Z-Score | ≤−2.00 | −1.90~−1.50 | −1.49~−1.00 | −0.99~0.99 | ≥1 |
| SPI | ≤−2.00 | −1.90~−1.50 | −1.49~−1.00 | −0.99~0.99 | ≥1 |
| EDI | ≤−2.00 | −1.90~−1.50 | −1.49~−1.00 | −0.99~0.99 | ≥1 |
| DIs | Timestep | |||||||||||||||||
|---|---|---|---|---|---|---|---|---|---|---|---|---|---|---|---|---|---|---|
| 1 | 2 | 3 | 4 | 5 | 6 | 7 | 8 | 9 | 10 | 11 | 12 | 15 | 18 | 24 | 30 | 36 | 48 | |
| PN | 0.32 | 0.37 | 0.41 | 0.48 | 0.53 | 0.57 | 0.61 | 0.65 | 0.68 | 0.68 | 0.67 | 0.66 | 0.63 | 0.59 | 0.52 | 0.42 | 0.33 | 0.35 |
| Z-Score | 0.33 | 0.41 | 0.47 | 0.52 | 0.57 | 0.63 | 0.68 | 0.73 | 0.76 | 0.79 | 0.78 | 0.76 | 0.66 | 0.60 | 0.51 | 0.43 | 0.35 | 0.33 |
| SPI | 0.33 | 0.42 | 0.47 | 0.54 | 0.60 | 0.66 | 0.73 | 0.76 | 0.78 | 0.81 | 0.80 | 0.78 | 0.71 | 0.64 | 0.52 | 0.43 | 0.35 | 0.32 |
| EDI | Z-Score9 | SPI9 | Z-Score12 | SPI12 | Z-Score15 | SPI15 | |
|---|---|---|---|---|---|---|---|
| Extreme drought | 0.00 | 0.00 | 4.76 | 0.00 | 0.00 | 0.00 | 0.00 |
| Severe drought | 4.76 | 0.00 | 4.76 | 4.76 | 4.76 | 0.00 | 4.76 |
| Moderate drought | 23.81 | 33.33 | 28.57 | 42.86 | 42.86 | 42.86 | 52.38 |
| Mild drought | 71.43 | 66.67 | 61.90 | 52.38 | 52.38 | 52.38 | 38.10 |
| Normal-wet Condition | 0.00 | 0.00 | 0.00 | 0.00 | 0.00 | 4.76 | 4.76 |
© 2019 by the authors. Licensee MDPI, Basel, Switzerland. This article is an open access article distributed under the terms and conditions of the Creative Commons Attribution (CC BY) license (http://creativecommons.org/licenses/by/4.0/).
Share and Cite
Li, F.; Li, H.; Lu, W.; Zhang, G.; Kim, J.-C. Meteorological Drought Monitoring in Northeastern China Using Multiple Indices. Water 2019, 11, 72. https://doi.org/10.3390/w11010072
Li F, Li H, Lu W, Zhang G, Kim J-C. Meteorological Drought Monitoring in Northeastern China Using Multiple Indices. Water. 2019; 11(1):72. https://doi.org/10.3390/w11010072
Chicago/Turabian StyleLi, Fengping, Hongyan Li, Wenxi Lu, Guangxin Zhang, and Joo-Cheol Kim. 2019. "Meteorological Drought Monitoring in Northeastern China Using Multiple Indices" Water 11, no. 1: 72. https://doi.org/10.3390/w11010072
APA StyleLi, F., Li, H., Lu, W., Zhang, G., & Kim, J.-C. (2019). Meteorological Drought Monitoring in Northeastern China Using Multiple Indices. Water, 11(1), 72. https://doi.org/10.3390/w11010072